Introduction
AUD is the Australian Dollar, and RUB is the Russian Ruble; AUD/RUB is thus an exotic currency pair. When trading this pair, forex traders should expect relatively high volatility due to its exotic nature.
In this pair, the AUD is the base currency, and the RUB is the quote currency. It means that the AUD/RUB pair’s price represents the amount of Russian Ruble that one Australian Dollar. If the AUD/RUB price is 55.813, it means that you can buy 55.813 Russian Rubles using 1 Australian Dollar.
AUD/RUB Specification
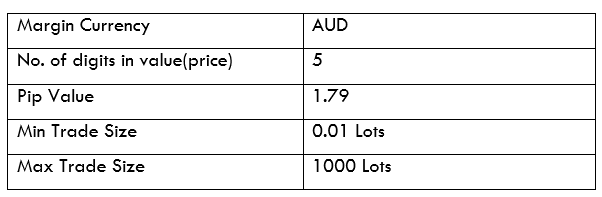
Spread
For the AUD/RUB pair, the spread is the difference between the price at which you can buy the pair from a broker and the price at which you can sell it to the broker.
The spread for the AUD/RUB pair is:
ECN: 10 pips | STP: 15 pips
Fees
If you have an ECN account, different brokers will charge you varying fees per trade, depending on the size of your position. For most STP accounts, however, there are no fees levied whenever you open a position.
Slippage
In the forex market, slippage occurs when you open a position, but it is executed at a price different than the one you requested. The primary determinants of slippage are market volatility and your broker’s speed of execution.
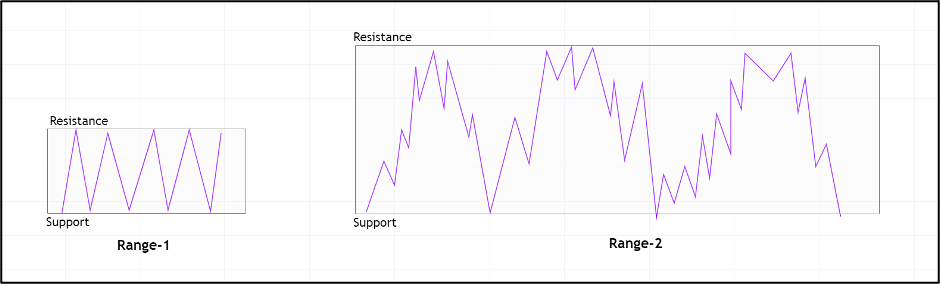
Trading Range in the AUD/RUB Pair
Throughout the day, the price of a currency pair fluctuates. This fluctuation, as observed from different timeframes, is known as the trading range. In forex, the trading range can help a trader determine the volatility of a currency pair, hence assess the risks it carries.
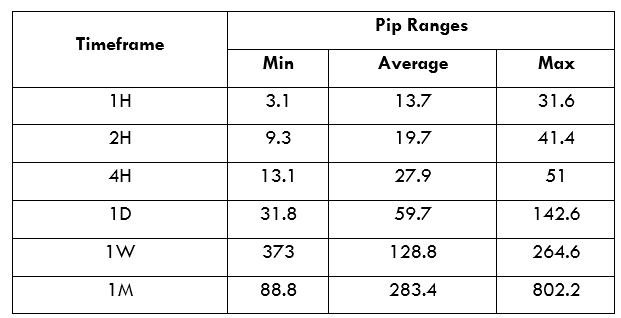
The Procedure to assess Pip Ranges
- Add the ATR indicator to your chart
- Set the period to 1
- Add a 200-period SMA to this indicator
- Shrink the chart so you can determine a larger period
- Select your desired timeframe
- Measure the floor level and set this value as the min
- Measure the level of the 200-period SMA and set this as the average
- Measure the peak levels and set this as Max.
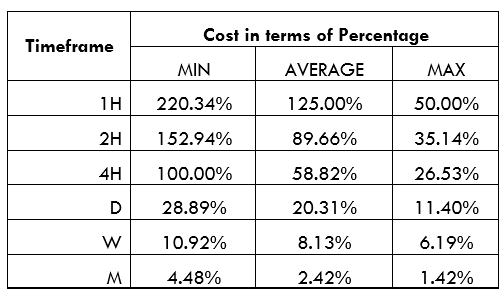
AUD/RUB Cost as a Percentage of the Trading Range
We can combine volatility, slippage, and trading fees to determine the cost of trading a currency pair across different timeframes.
Below are cost percentages for both the ECN and the STP forex accounts. These percentages are in terms of pips.
ECN Model Account
Spread = 10 | Slippage = 2 | Trading fee = 1
Total cost = 13
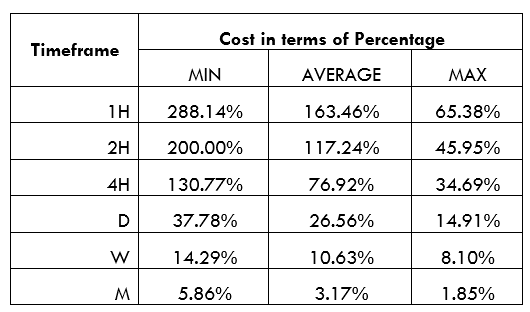
STP Model Account
Spread = 15 | Slippage = 2 | Trading fee = 0
Total cost = 17
The Ideal Timeframe to Trade the AUD/RUB
In the analyses above, we notice that lower timeframes have low volatility, accompanied by higher trading costs for the AUD/RUB pair. With either the ECN or the STP account, costs are highest when volatility is at the lowest, 3.1 pips. The lowest costs are incurred when volatility is the highest at 802.2 pips.
We can observe that longer-term traders generally enjoy lower trading costs. However, shorter-term traders can reduce their trading costs by trading the AUD/RUB pair when volatility is above average; since costs are lower.
If traders use pending orders, they can eliminate slippage, which lowers the trading costs. Here’s an example with the ECN account.
Total cost = Slippage + Spread + Trading fee
= 0 + 10 + 1 = 11
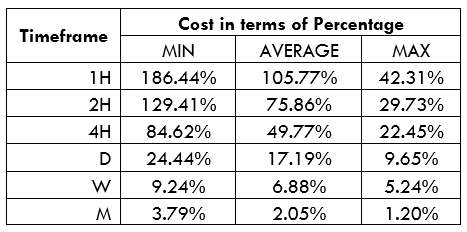
You can notice that there is a significant reduction in trading costs. For example, the highest trading cost for the ECN account has reduced from 220.34% to 186.44%.