Categories
Forex Assets

Understanding The Costs Involved While Trading The CAD/ILS Forex Exotic Pair

Introduction

CAD/ILS is an exotic currency cross. Here, CAD is the Canadian Dollar, and ILS is the Israeli Shekel. The CAD is the base currency, and the ILS is the quote currency. Therefore, the price of the CAD/ILS pair represents the quantity of the ILS that  CAD can buy. If the price of the pair is 2.6004, it means that 1 CAD can buy 2.6004 ILS.

CAD/ILS Specification

Spread

The buying price and the selling price of a currency pair tend to be different in forex. The difference between these two prices is the spread. The spread for the CAD/ILS pair is: ECN: 22 pips | STP: 27 pips

Fees

Forex brokers charge a commission on every trade made with the ECN account. The commission varies depending on the broker and the type of trade. Trades on STP accounts do not attract a trading fee.

Slippage

It is rare for a trader to get the exact price they request for a trade. Usually, there is a difference between the price requested and the execution price. This difference is the slippage, and it depends on market volatility and the speed of trade execution.

Trading Range in the CAD/ILS Pair

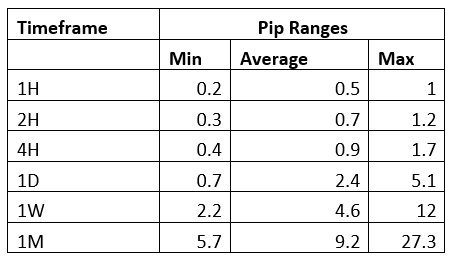
The trading range is the analysis of how currency fluctuates across different timeframes in terms of pips. The trading range is used to analyze a currency pair’s volatility and expected profit. For example, if on the 2-hour timeframe the trading range of the CAD/ILS pair is 10 pips, then a trader can expect to either gain or lose $38.5

Here’s the trading range for the CAD/ILS pair.

The Procedure to assess Pip Ranges

  1. Add the ATR indicator to your chart
  2. Set the period to 1
  3. Add a 200-period SMA to this indicator
  4. Shrink the chart so you can determine a larger period
  5. Select your desired timeframe
  6. Measure the floor level and set this value as the min
  7. Measure the level of the 200-period SMA and set this as the average
  8. Measure the peak levels and set this as Max.

CAD/ILS Cost as a Percentage of the Trading Range

The cost of trading any currency involves the slippage, fees, and the spread. These costs vary across different timeframes under different volatility conditions. For a forex trader, analyzing the cost as a percentage of the trading range helps implement informed risk management techniques.

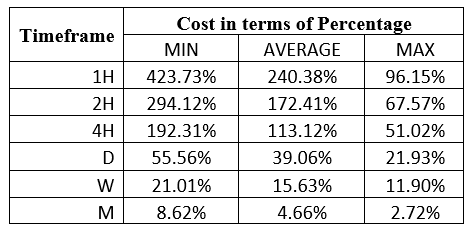
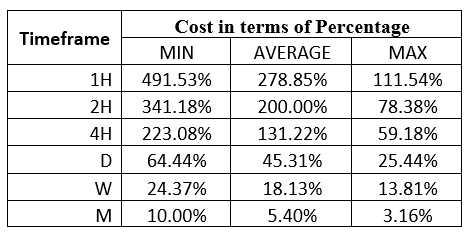
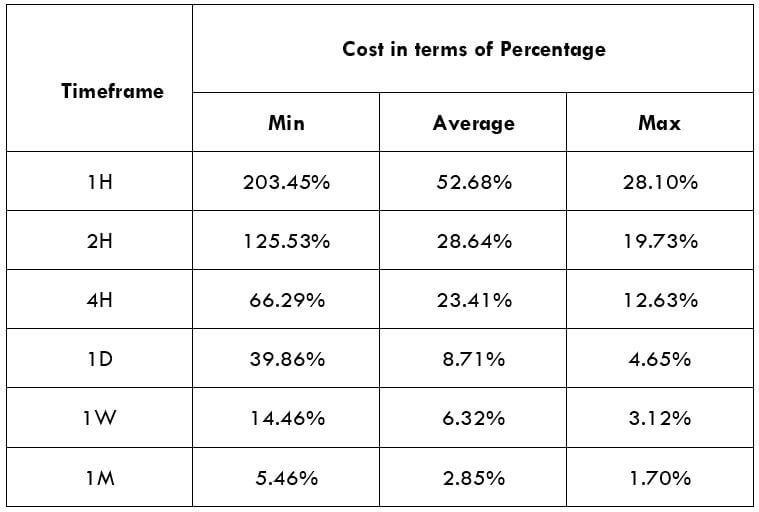
The tables below show the analyses of the trading costs for the CAD/ILS pair across different timeframes.

ECN Model Account

Spread = 22 | Slippage = 2 | Trading fee = 1

Total cost = 25

STP Model Account

Spread = 27 | Slippage = 2 | Trading fee = 0

Total cost = 29

The Ideal Timeframe to Trade CAD/ILS

We can see that the trading cost for the CAD/ILS pair is higher during shorter timeframes and low volatility in both the ECN and STP accounts. Longer-term traders trading on weekly and monthly timeframes enjoy relatively lesser trading costs than shorter timeframe traders.

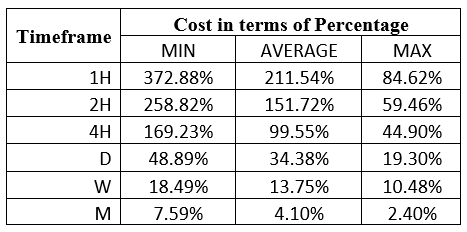
It is worth noting that for every type of trader, initiating trades when volatility is above average reduces the trading costs. Furthermore, opting to use forex limit orders instead of market orders which are susceptible to slippage, can significantly reduce trading costs. With limit orders, the risk of slippage is removed hence lowering trading costs. Here are the trading costs when limit orders are used.

ECN Account Using Limit Model Account

Total cost = Slippage + Spread + Trading fee

= 0 + 22 + 1 = 23

We can see that trading costs for the CAD/ILS have reduced across all timeframes, with the highest cost dropping from 491.53% to 372.88% of the trading range.


Categories
Forex Assets

Exploring The GBP/ILS Forex Exotic Currency Pair

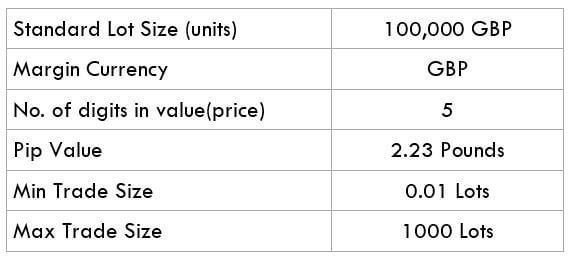
Understanding GBP/ILS

GBP/ILS is the abbreviation for the Pound sterling against the Israeli Shekel. In currency pairs, the first currency GBP here is the base currency and the second currency ILS is the quote currency. In Forex currency pairs, if the value of, let’s say, the base currency goes up, the quote currency’s value will go down and vice versa.

Also, when we buy a currency pair, we buy the base currency and implicitly sell the quote currency. The market value of GBP/ILS determines the strength of ILS against the GBP that can be understood as 1 Pound is equal to how much ILS. So if the conversion rate for the pair GBP/ILS is 4.4725, it means to buy 1 GBP, we need 4.4725 ILS.

Spread

We know that the “bid” is the price at which we sell the currency, and “ask” is the price is at which we can BUY the currency. The arithmetic difference between the ask and bid price is known as the spread. The spread is how most of the brokers make money. There are also brokers who charge a separate fee instead of making profits in the form of spread. Below are the ECN and STP spreads for the GBP/ILS Forex pair.

ECN: 54 pips | STP: 56 pips

Fees

Every time we place a trade, some commission must be paid to the brokers, and that is known as a fee. This fee varies from broker to broker. For instance, there is no fee charged on STP account models, but ECN brokers do charge some fee.

Slippage

The arithmetic difference between the expected price of a trader and the price at which the trade is executed is known as slippage. It can occur mostly when the market is volatile & fast-moving. Another reason when the slippage may occur is when we place a huge number of orders at the same time.

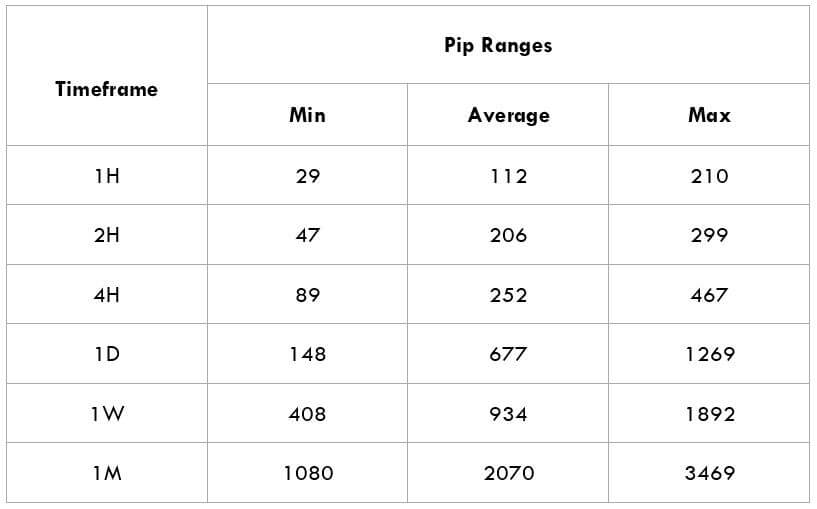
Trading Range in GBP/ILS

The trading range here is to measure the volatility of the GBP/ILS pair. Whether we make a profit or loss in a given time period depends on the movement of a currency pair that can be assessed using the trading range table. It is a representation of the min, avg, & max pip movement in a currency pair.

Procedure to assess Pip Ranges

  1. Add the Average True Range indicator to your price chart
  2. Make sure to set the period to one
  3. Then add a 200-period Simple Moving Average to ATR
  4. Shrink the chart in order to assess a significant period
  5. Select the timeframe of your choice
  6. Floor level must be measured and set that value as the min
  7. 200-period SMA must be measured and set that value as average
  8. Finally, measure the peak levels and consider this as Max values.

GBP/ILS Cost as a Percent of Trading Range

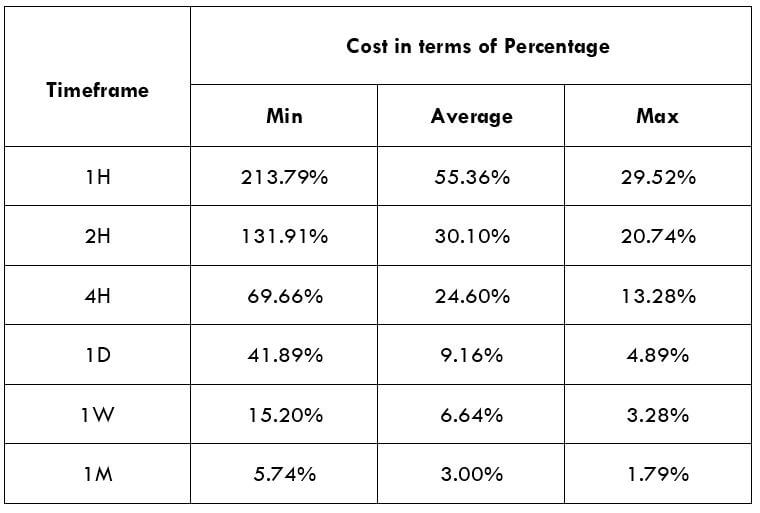
The cost of trade depends on the broker and mostly varies based on the market’s volatility. The below tables represent the cost variation in terms of percentages.

ECN Model Account

Spread = 54 | Slippage = 3 |Trading fee = 5

Total cost = Slippage + Spread + Trading Fee = 3 + 54 + 5 = 62


STP Model Account

Spread = 56| Slippage = 3 | Trading fee = 0

Total cost = Slippage + Spread + Trading Fee = 3 + 56 + 0 = 59

Trading the GBP/ILS

The GBP/ILS is an exotic-cross currency pair and is a trending market. We consider the market to be trending when the price generally moves in one direction, either downwards or upwards. As seen in the Range table, the average pip movement on the 1-hour time frame is 112. This clearly shows that the pip movements are normal, and this currency pair is tradable.

Note that the higher the volatility, the lower is the cost of the trade. However, this is not an advantage as it is risky to trade highly volatile markets. Let’s take, for example, in the 1M time frame, the Maximum pip range value is 3469, and the minimum is 1080. When we compare the fees for both the pip movements, we find that for 1080pip movement fess is 5.74%, and for 3469pip movement, fess is only 1.79%.

So, we can confirm that the prices are higher for low volatile markets and low for highly volatile markets. It is recommended to trade when the market volatility is around the average values, but experienced traders who strictly follow money management can trade in a volatile market. The volatility here is moderate, and the costs are a little high compared to the maximum values. But, if our priority is towards reducing costs, we may trade when the volatility of the market is around the maximum values.