Categories
Forex Basic Strategies

Trading The Forex Market Effectively Using ‘Renko’ Charts

Introduction

If you are a Forex trader, you can agree-many winning strategies exist out there. And Renko charts are among the handy weapons you can deploy to your advantage. This write-up will help you grasp handy tips to get your feet wet, as well as scaling your trading into a profitable trajectory.

Renko charts are not very popular as bars or candlesticks among traders. However, they can be very profitable when a trader uses them correctly. Renko chart trading is a robust way to analyze price trends, and even superb when you combine it with another tool to confirm entry and exit positions.

What Is Unique With Renko?

Well, Renko charts only show you the price movements of an underlying asset without factoring in time and volume. The formation of a Renko bar or body is in one direction. And it forms only when prices move by a predefined amount in pips. You can adjust the number of pips per block to suit your needs or trading strategy.

Also, a subsequent Renko bar can only form either adobe or below a previous one. It’s that model that shows you the price direction with unique preciseness.

Their naming arises from Japanese “Renga,” which means brick. Therefore, Renko charting arises from a series of blocks. In the light of Forex trading, the charting of the blocks moves up or down with prices.

Advantages of Trading Forex using Renko charts

  1. Renko charts are simple in both ease of interpretation and use.
  2. Great for determining the levels of support and resistance.
  3. Traders can adjust the block sizes to suit their trading needs.
  4. Renko charts are great at signaling price breakout or reversal.
  5. Ideally, Renko charts only show you how prices are moving.

Overall, Renko charts give traders an edge with overly volatile commodities like Oil and Gold. The charting digs deeper into the pricing histories. The charting model behind Renko builds on plotting price on the -Y-axis Vis a Vis time.

Renko beats conventional price-charting by removing insignificant price movements.

There are three metrics that Renko shades off from ordinary price action. And they are:

  • Any false price breakouts
  • The candle-wicks
  • The price volatility

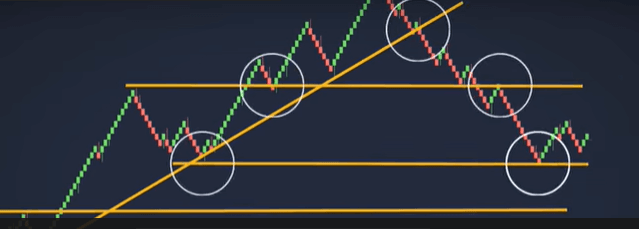
Ideally, it pays attention to the critical metrics: support, resistance, and the trend.

Whenever prices move, Renko converts that into a commensurate block on the chart. And every block forms after price confirmations. The reality is, Renko charts do not work with partial blocks. They have to be wholesome and in line with the set numbers per single block.

As a trader, it makes great sense if you’re able to sift out short-term fluctuations out of a price chart. Beauty is Renko charting is a great tool at that. Price volatility is the greatest enemy for many traders, especially if you can only bring in a small trading margin.

While most traders can establish trends from normal price- charting, Renko charting is another wholesome set of trading tools to help you sharpen your decisions while trading.

More Pointers with Renko Charts

As indicated earlier, Renko charting creates blocks after by concurrently establishing the closing positions of a previous block. Next, subsequent blocks can only form either below or above a previous one.

Using the precedence above, Renko charting brings you a precise tool into your trading arsenal to help you view trends more clearly. Along with that, it’s also important to calculate the most appropriate block size – in line with the asset you target to trade.

Calculation of Renko blocks

There are two documented methods for the determination of the optimal sizes of Renko blocks.

First is the ATR or Average True Range. It relies on the ART indicator to determine the height of an ordinary candlestick.

Second is the model where a trader provides a predefined value for the size of a block.

So, new blocks only form when price movements meet the minimum value set for a block.

Sniffing a Buy Opportunity with Renko Charts

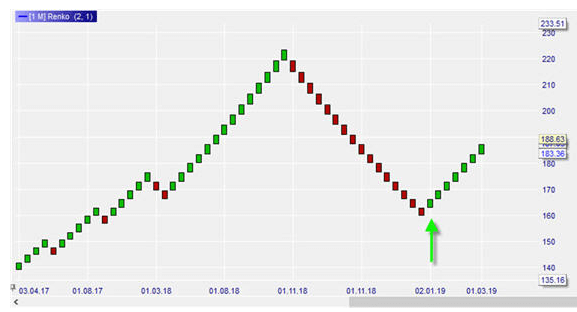
Image credits: best-trading-platforms.com

Renko charts help traders spot trend directions very clearly. And there are two ways to spot an opportunity to go long. Using the image above, a monthly view of a stock’s prices is visible. Simple, green bricks signify uptrends, while the ref ones signify the downtrend.

Primarily, the years 2017 and 2019 are trends – good opportunities to go long (buy). Towards the end of 2018, there’s a trend reversal (bricks turn red- the opportunity for buyers to exit and pocket profits)

Also, the same trend reversal creates an opportunity for traders to go short and also take profits. Look at 2019 also; the green bricks signify the continuity of the uptrend.

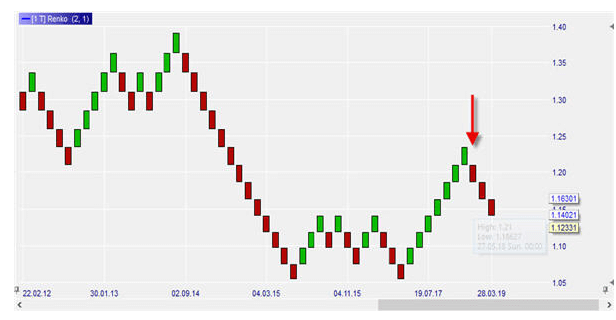
Image Credits: best-trading-platforms.com

Look at the figure above, the EUR/USD pair oscillations ranging from 1.0500 – 1.1500 from 2015 through to -2016. Also, notice the uptrend starting from 2017 but with a reversal along the way. Uptrends are opportunities to go long, while downtrends are opportunities to go short.

Pro Tip: If you are looking to upscale your trading success, Renko charts greatly help. However, ensure that aside from mastering them, it’s excellent to confirm the trends, support, and resistance levels using one or more indicators.

Keep in mind that trading success arises from careful analysis of entry and exit positions. Upfront, it may seem cumbersome – taking time to do the due diligence in the analysis. Utmost, do not trade with emotions. Renko charts and many other tools will help you sharpen your analysis.

The preciseness and effectiveness of a strategy arise from long spells of practical use. Renko is a super-tool for scalping when you compare it to classical price charting or bar or candlesticks.

Other handy trade signal tools to combine with Renko Charts

  • Simple Moving Averages -SME Enter trades with three bars in the direction of the trend and 10 SME sloping downwards or upwards. (This will help you avoid false breaks in a reversal against the trend)
  • On Balance Volume –OBV Enter trades when you confirm the trend and SME as tally that with OBV indicator’s direction.

Parting Shot

Renko charting brings in more preciseness for your trend confirmation in line with price action and the trend. It helps you filter out the noise with volume and time and leaves you with price direction only. For successful scalping, incorporating Renko is a better way to go about it. Renko charts help you keep the focus on the trend for position trades and note it’s the reversal in good time to exit.

Categories
Forex Basic Strategies

The Absolute BEST Forex Trading Strategies for Beginners

It’s easy for beginner traders to become overwhelmed, which sadly leads many to give up on trading for good before ever really getting started. This can be avoided when beginners have access to simple, easy-to-follow strategies that aren’t overly technical or risky. Below, we will outline some of the best simple trading strategies for beginners:

  • Trailing Stop/Stop Loss Combo Strategy
  • Moving Average Crossover Strategy
  • Breakout Trading Strategy
  • A more detailed 50 Day Breakout Strategy

Trailing Stop/Stop Loss Combo Strategy

This strategy uses stop-loss orders and trailing stops, which ensure that the share will be sold at market price value if it dips to a certain level. Loss-limiting strategies are good for beginners because they can allow traders to get used to trading without risking a larger amount of capital. Trailing stops are also applied through this method to add to the efficiency of the stop loss. 

Traders would combine trailing stop and stop loss together and set those limits based on their maximum risk tolerance. For example, you could set the stop loss at 2% below the current trade price and the trailing stop at 2.5% below the price. If the price increases, the trailing stop will surpass the fixed stop loss and render it obsolete. Note that it can be more difficult to use trailing stops with active trades, due to price fluctuations and volatility. You’ll need to study a stock for several days so that you can set a trailing stop value that will accommodate normal price fluctuations and only catch the true pullback of the price. 

Moving Average Crossover Strategy

This strategy uses a simple moving average (SMA). SMA is a slower price indicator that looks at older data than what is used by most indicators. Usually, a longer SMA is combined with a shorter one. For example, a 25-day SMA might be combined with a 200-day SMA. Information can be compared on charts to indicate bullish or bearish trends and to provide buy or sell signals. 

Moving averages are often used to indicate the overall trend and can be used in combination with a breakout strategy to help do away with signals that don’t match the trend indicated by the moving averages. 

Breakout Trading Strategy

This strategy focuses strongly on trends in the market. Consolidation occurs when the market moves between bands of support and resistance. A breakout occurs when the market moves beyond the boundaries of the consolidation, either to new highs or new lows.  A breakout must occur for a new trend to begin; therefore, breakouts are signals that a new trend has started.

Following this strategy is fairly straightforward, which is why we would recommend it to beginners. Of course, risk management is crucial for the strategy to work with limited losses. One of the Breakout strategy’s downsides is that not every breakout signals a new trend. 

You’ll also need to get a feel for the type of trend you’re entering:

  • A breakout beyond the highest high or the lowest low for a longer period suggests a longer trend. 
  • A breakout for a short period suggests a short-term trend.

Once you learn to identify trends more quickly, you’ll be able to react more quickly and ride the trend earlier in the curve, although this could lead traders to follow shorter-term trends. 

The 50 Day Breakout Trading Strategy 

This strategy evolves around momentum, meaning that when prices are moving strongly in one direction, it is likely that things will continue in this direction. Further movement in the direction of the trend is also considered to be far more likely than any movement against the trend.

When using the Breakout Strategy, traders should focus on the pairs EUR/USD and USD/JPY because these pairs have shown the best reliability through research. Traders will also want to use the Average True Range trading indicator. There are a few other key steps to accomplishment with this strategy:

  1. Monitor the daily chart for the entry signal. A new 50-day high signal that a long trade should be entered, while a low indicates that one should enter a short trade. The trade should be entered immediately once the signal is received. 
  2. Traders should only risk a maximum of 0.25% of their account size per trade. Someone with $2,000 in their account would only risk $5 per trade, which makes this more beginner-friendly.
  3. Tighter stop losses will help to ensure greater profitability.
  4. Two days after the trade entry, move the stop loss to break even if the trade is still open. If the market price is worse than the stop loss, you should close the trade at market price. 
  5. Use an exit strategy that is either based on time or using a trailing stop. Exiting after 8 days has shown the best profitability through research.  

While some beginners may struggle with the exit strategy, you should remember that a time-based exit of around 5-8 days is profitable. This helps to avoid frustration with making mental judgments as well. 

Categories
Forex Basic Strategies

Learning To Trade The ‘Make Your Wish’ Forex Trading Strategy

Introduction

The ‘make your wish’ strategy is based on one of the most popular candlestick patterns, i.e., the Shooting Star. As we all are aware that it looks similar to an inverted hammer, we try to develop a strategy that gives us the ability to capture small bearish reversal in the market. This pattern can prove to be a very “dangerous” pattern if developed at the right location.

Once we comprehend the importance of shooting stars, we discover that one candle pattern has such a power that it can signal the reversal of a strong bullish trend. Very few people take the risk of trading reversal, as this type of trading has badly hurt the trading accounts of many.

Today’s strategy will address this issue and will show how we can catch a falling knife without cutting off our fingers. The ‘make your wish’ can help us spot the top of the market and how to trade it properly. As Shooting stars are believed to make our wishes come true, we have named this strategy as ‘Make Your Wish,’ hoping that the strategy makes our wish of winning come true.

Time Frame

This strategy can only be traded on very short-term price charts such as 5 minutes or 1 minute. Hence, this is a perfect, intraday trading strategy.

Indicators

We make use of just one technical indicator in this strategy, and that is the Chaikin Oscillator.

Currency Pairs

The most suitable currency pairs are EURUSD, USD/JPY, GBP/USD, AUD/USD, GBP/AUD, USD/CAD, GBP/JPY, and CAD/JPY. Minor and exotic pairs should completely be avoided.

Strategy Concept

The ‘make your wish’ strategy is a very simple and effective technique to use in the forex market. Since most traders are interested in day trading and scalping, there isn’t a better strategy to use for that. The strategy is based on the simple concept that when the market moves sharply in one direction, it needs to ‘pullback’ at some of the time that will lead to a decent retracement in the price to the next technical level. The ‘shooting star’ helps us identifying the time when retracement will start.

Here, we take advantage of this retracement and try to particulate in the short-term reversal of the market. As this can involve high risk, we cannot solely rely on a candlestick pattern and use a technical indicator to give us the extra confirmation. We use the ‘Chaikin Oscillator, ’ which is designed to anticipate directional changes in the market by measuring the momentum behind the movements. Anticipating change in direction is the first step to identifying a change in the trend. But this also isn’t enough for forecasting a reversal, which we shall in detail in the future course of the detail.

The risk-to-reward (RR) of the trades will not be high as we are trading against the trend of the market, which may not be suitable for high ‘RR’ seekers. But at the same time, the probability of success is high for trades executed using this strategy.

Trade Setup

In order to execute the strategy, we have considered the 5-minute chart of where we will be illustrating a ‘long’ trade. Here are the steps to execute the strategy.

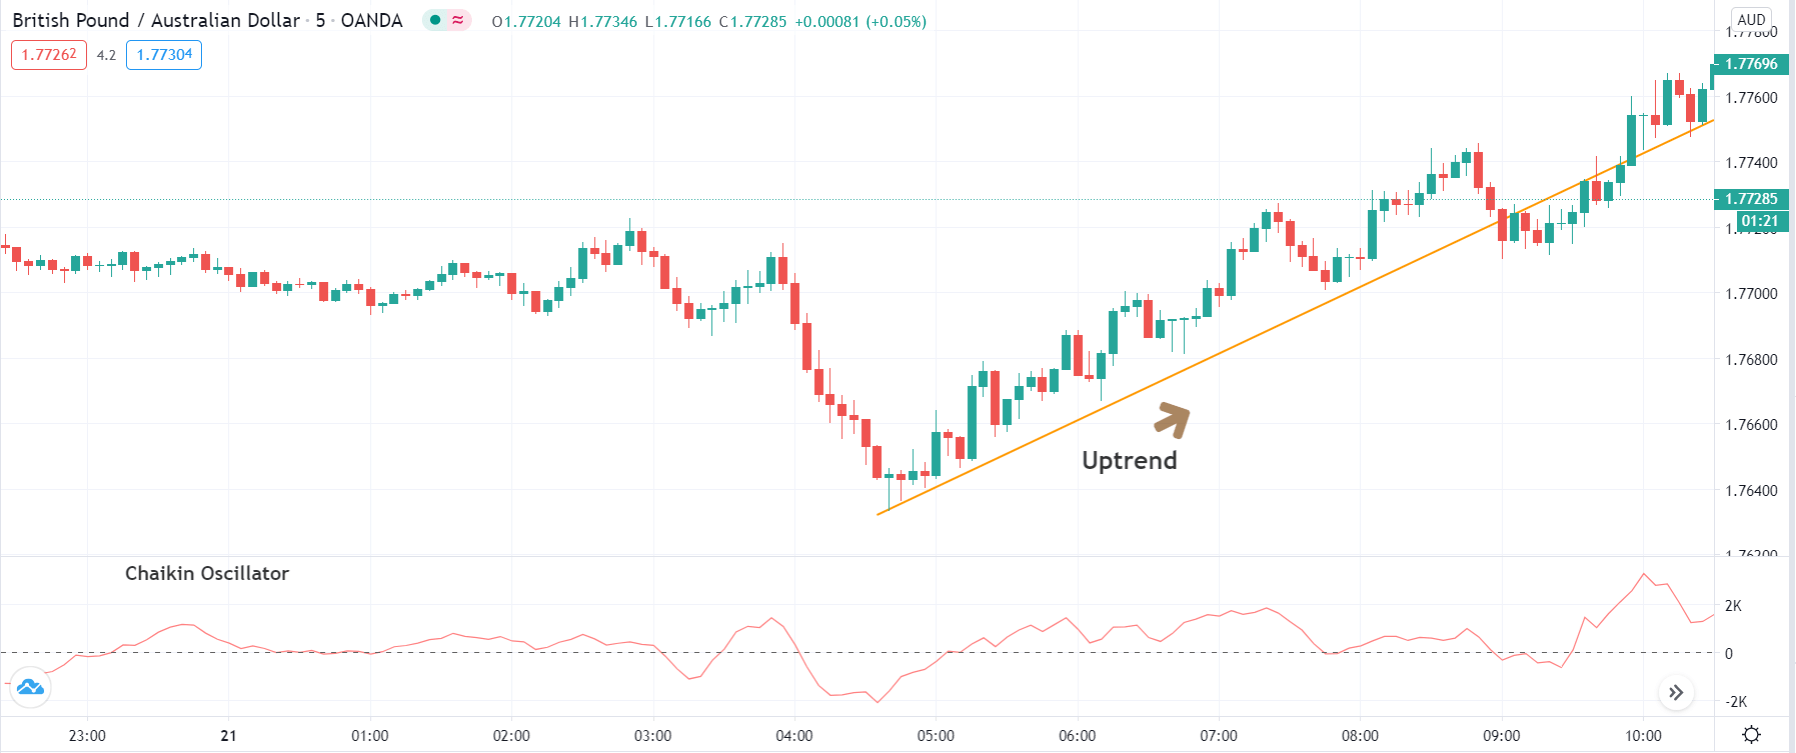
Step 1: Firstly, we identify the trend of the market by plotting a trendline. If the price bounces off from the trendline, each time it comes close to it, we can say that the market is trending. Here we should make sure that the price is not violating the trendline multiple times. This also means that there are no deeper retracements in the trend, which is desired for the strategy. The trendline is plotted by connecting the ‘highs’ and ‘lows’ of the market.

The below image shows that GBP/AUD is in a strong uptrend.

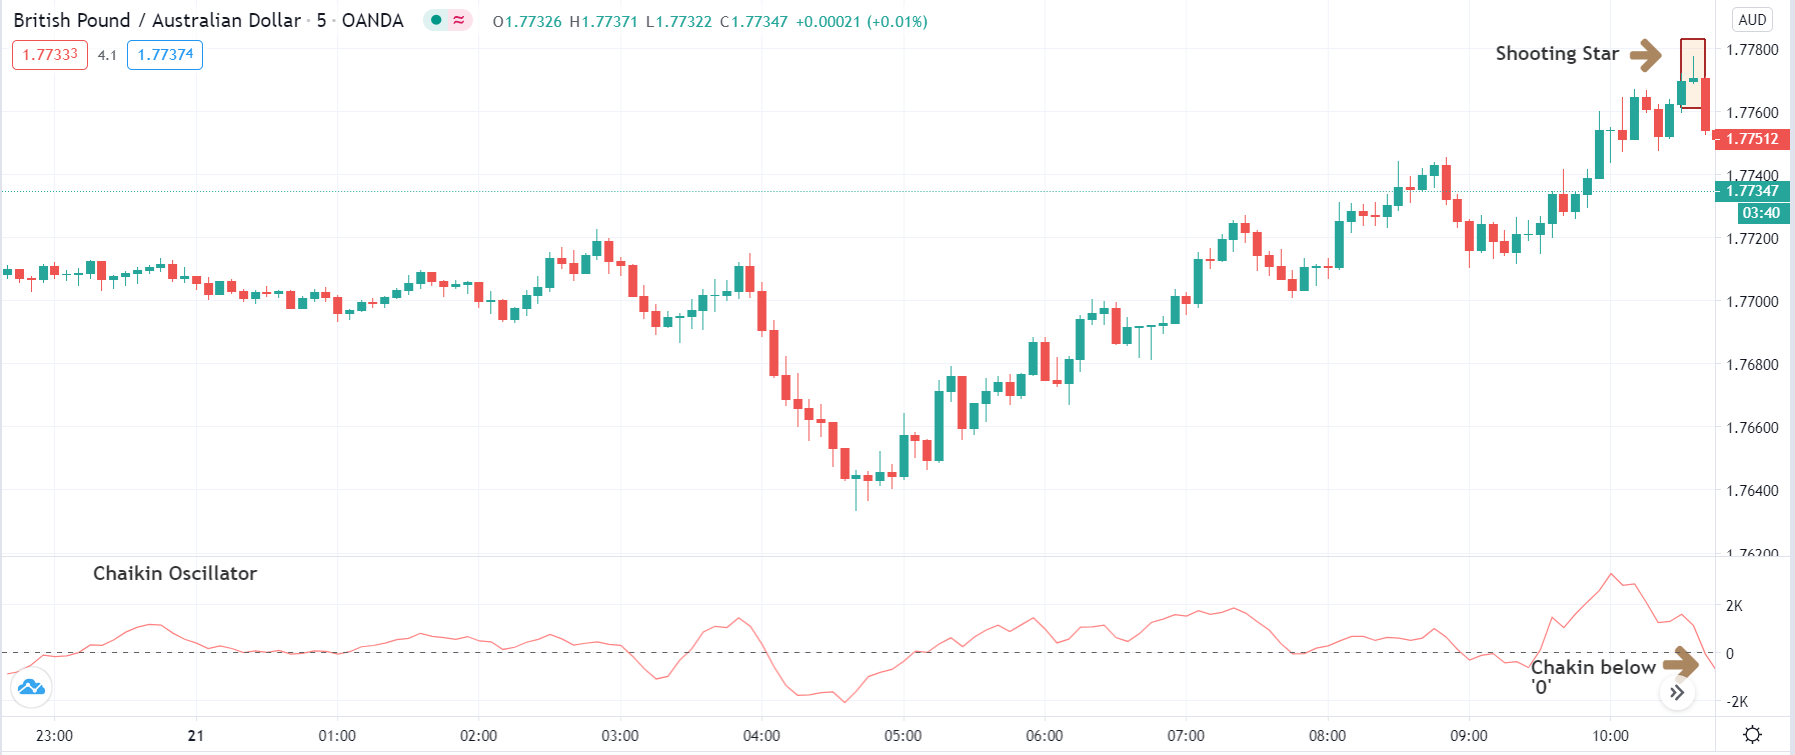
Step 2: Next, we wait for the ‘Shooting star’ candlestick pattern to appear in the trend. Once the pattern shows up on the chart, we look at the Chaikin oscillator and make a note of its reading. When this ‘rejection’ pattern appears in an uptrend, it indicates a reversal of the trend if the Chaikin oscillator starts moving lower and slips below the ‘0’ level.

When this ‘rejection’ pattern appears in a downtrend, it indicates a reversal of the trend if the Chaikin oscillator starts moving upwards and moves from negative to positive territory. When both these criteria are fulfilled, reversal is imminent in the market. But we cannot enter the market as yet.

The below image shows how the pattern emerges on the chart along with a falling Chaikin oscillator.

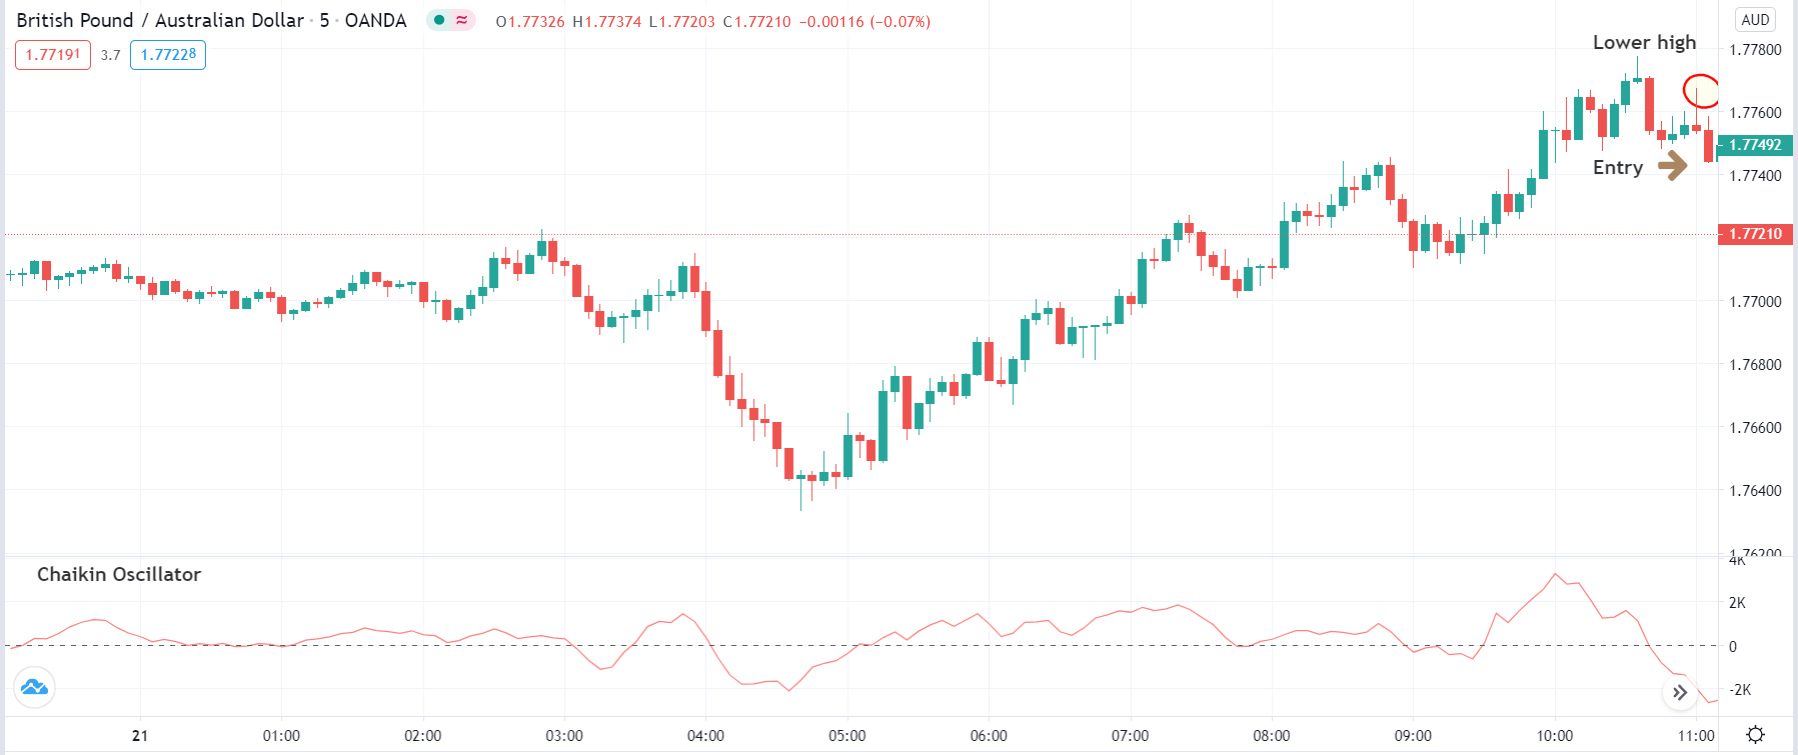
Step 3: It is important to note that we enter the market soon after the appearance of the pattern. After the formation of the pattern, it is necessary to wait for a ‘lower high’ in case of an uptrend reversal and a ‘higher low’ in a downtrend reversal.

The below image shows the formation of  ‘lower high’ after the appearance of the ‘shooting star’ pattern, which is the final confirmation for entering the trade.

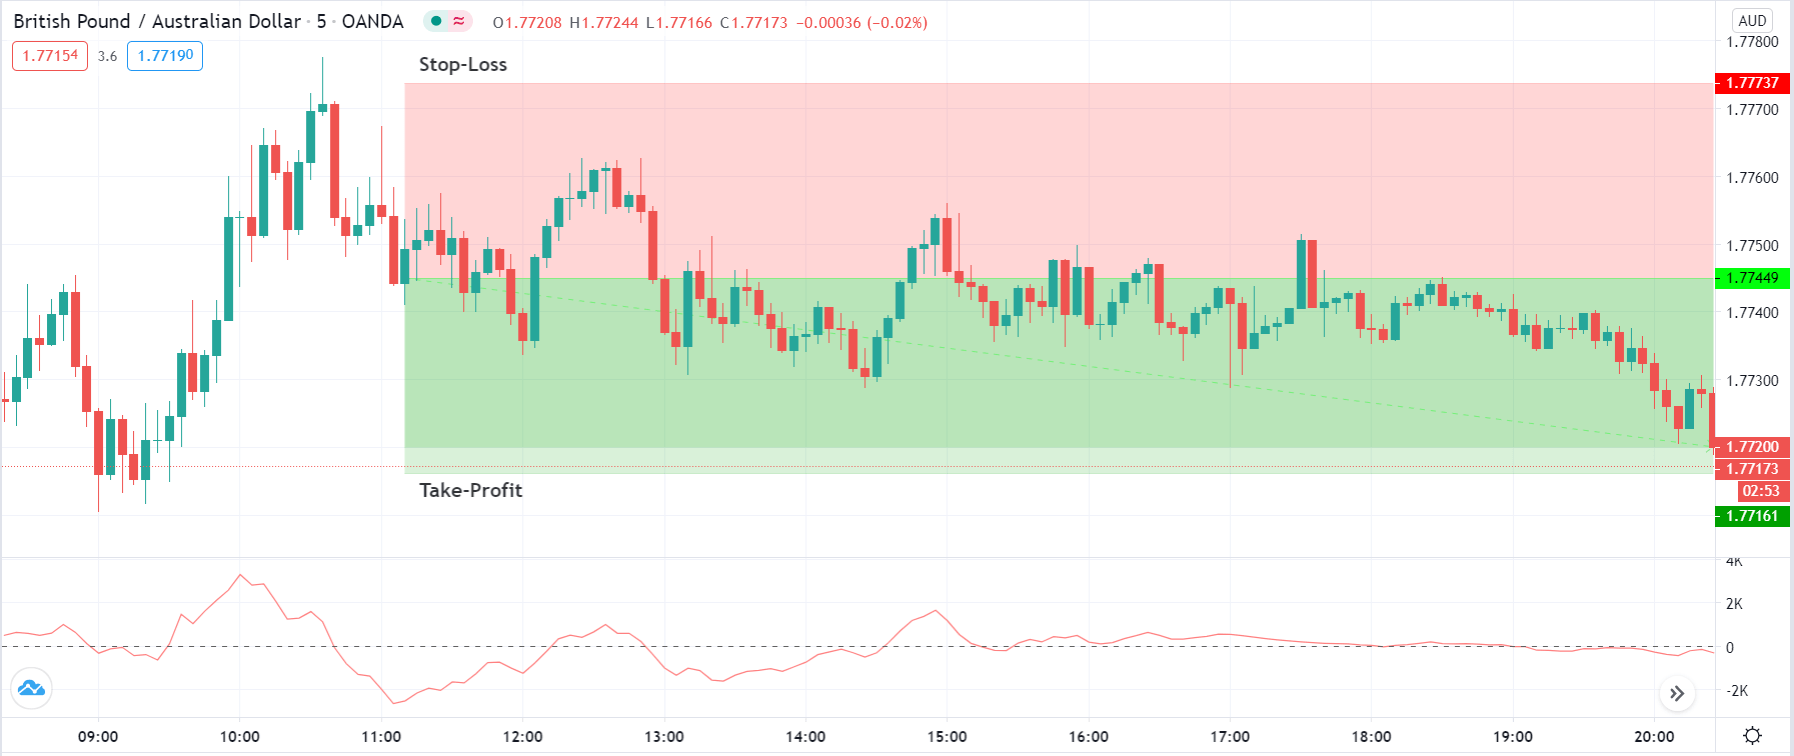
Step 4: Now, let us determine the stop-loss and take-profit levels for the strategy. Setting the stop-loss is pretty simple, where it is placed above the ‘lower high’ in a ‘long’ trade and below the ‘higher low’ in a ‘short’ trade. The take-profit is set at a price where the distance of take-profit from the point of ‘entry’ is equal to the distance of ‘stop-loss.’ That means the risk-to-reward (RR) of trades executed using this strategy is not more than 1:1. The reason for low RR is because we are trading against the trend of the market. Hence there is a possibility that the market might start moving in its major direction.

Strategy Roundup

A lot of traders warn against reversal trading, but finding top and bottom in the market and trading reversal can be done successfully if we have a proven methodology like the ‘make your wish’ strategy. We need to take into consideration all the rules outlined in this strategy guide other than just looking for the ‘shooting star’ pattern.

Categories
Forex Basic Strategies

Learning The ‘Intraday Strategy’ To Trade The Forex Market

Introduction

In today’s article, we present to you a fairly simple but reliable trading strategy that can be used by all types of traders, irrespective of their style. It is believed that when markets are strongly trending in one direction, it gets impossible to catch the stalling point. It is only difficult to catch the ‘top’ or ‘bottom’ of the market, but it also carries a huge amount of risk. We are going to discuss a trading strategy that is contrary to this common belief. We shall try to catch the highest or the lowest point in the market by using some of the most powerful technical indicators and techniques.

Time Frame

The strategy can be used on the 5 minutes, 15 minutes, and 1-hour time frame chart. An intraday trader would apply the strategy on the 5 or 15 minutes chart, whereas a positional trader would open the 1-hour chart.

Indicators

We use the following indicators in the strategy:

  • 5-period Exponential Moving Average (EMA)
  • 10-period Exponential Moving Average (EMA)
  • 14-period Relative Strength Index (RSI)
  • Slow Stochastic Oscillator
  • K and D period – 3

Currency Pairs

This strategy can only be applied on major currency pairs of the forex market. Some of the preferred pairs include EUR/USD, GBP/JPY, GBP/USD, USD/CAD, USD/JPY, EUR/GBP, etc.

Strategy Concept

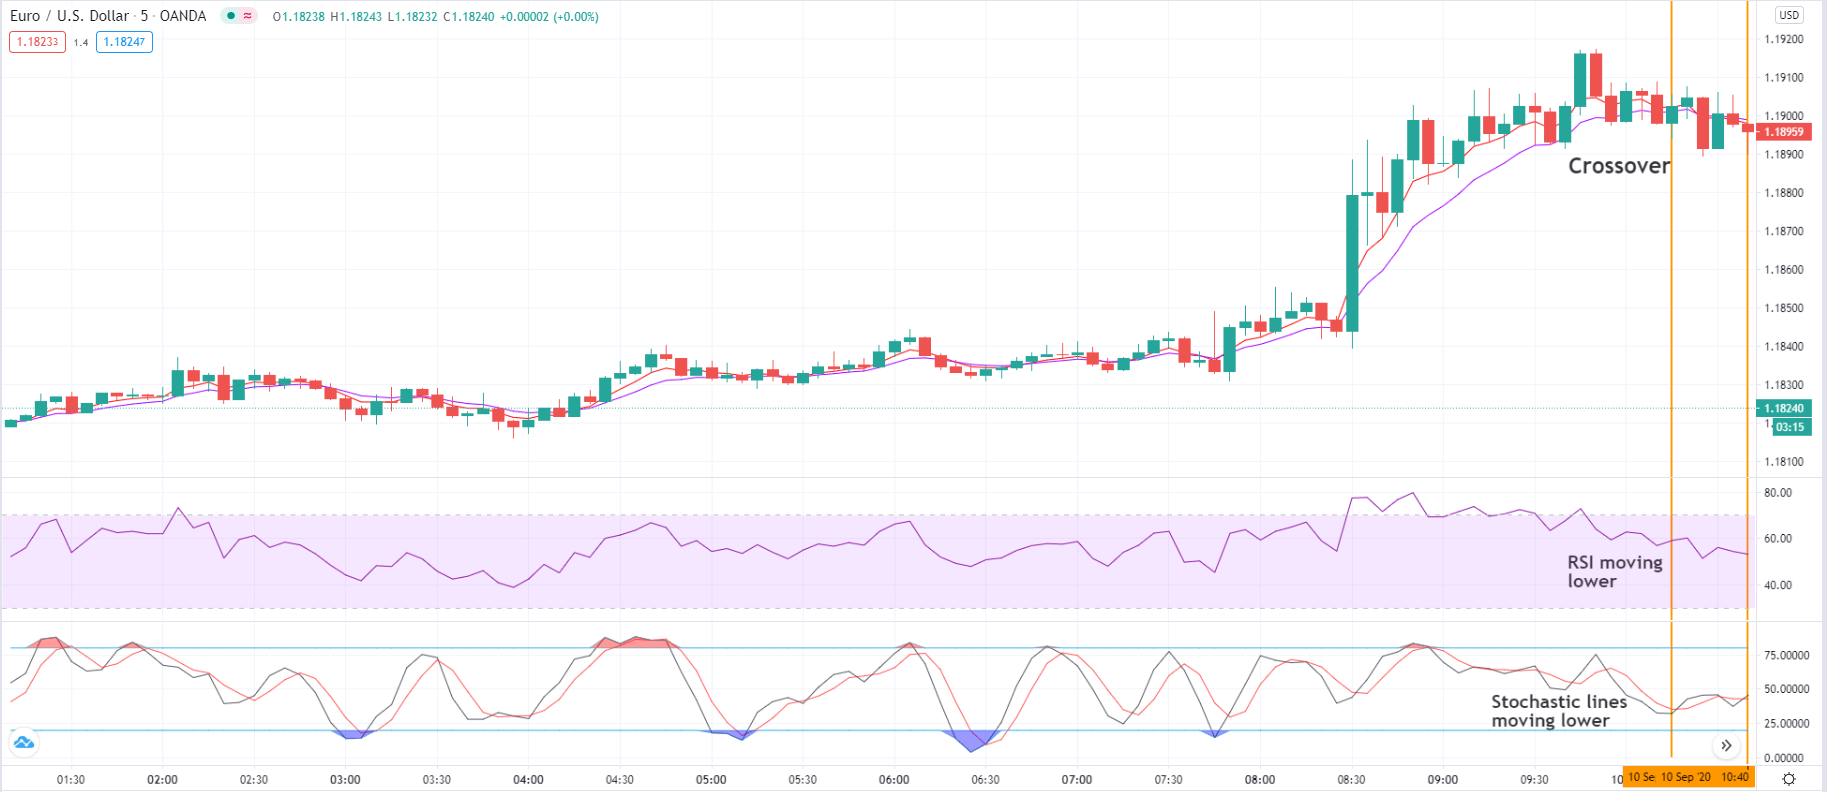
The rules of the strategy are quite simple and straightforward. We enter the market for a ‘long’ when the 5-period EMA crosses above the 10-period EMA after a prolonged downtrend. But this isn’t enough. Along with this, the RSI should be above the level of 50, and Stochastic slow and fast lines should move in the same direction (upward). Here we need to make sure that the Stochastic does not enter the overbought zone. Similarly, if the 5-period EMA crosses below the 10-period EMA after a prolonged uptrend, we prepare to enter ‘short.’ In this case, the RSI should be below the level of 50, and Stochastic lines should be moving downwards.

We exit the trade when 5-period EMA crosses beyond the 10-period EMA, where this is confirmed by the close of a candle beyond the latter. Another way to exit the trade is when the RSI drops below the 50 level. The several conditions which must be fulfilled in order to execute a trade make the strategy a good filter for trade entries. However, the two EMAs have a drawback as they can get choppy and generate false signals. We can avoid this by carefully monitoring the movement of EMA lines along with the other indicators. When the strategy is executed by following every rule of the strategy, wrong ‘trades’ can be eliminated to a great extent.

Trade Setup

In order to explain the strategy, we have considered the 5 minutes chart of EUR/USD, where we will be illustrating a ‘long’ trade. Here are the steps to execute the strategy.

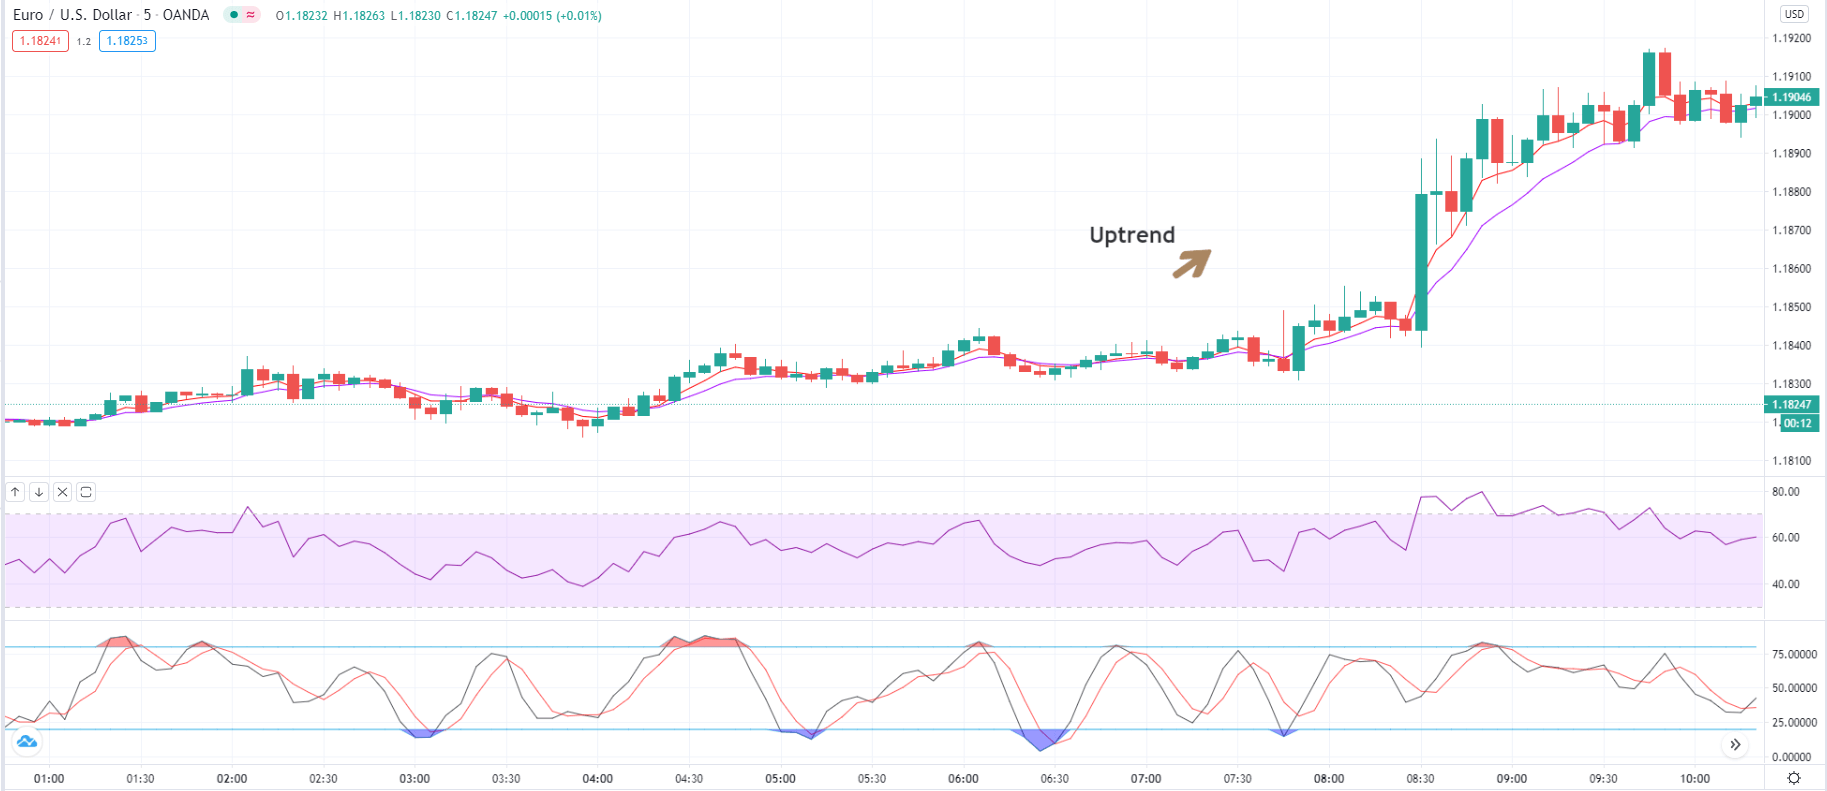
Step 1: The first step is to identify the trend of the market and plot all the indicators on the chart, as mentioned in the above section. An easier way to identify the trend is by looking at the price concerning 5 and 10 period EMA. If the 5-period EMA is above the 10-period EMA, we say that the market is an uptrend. Whereas, if the 5-period EMA is below the 10-period EMA, the market is said to be in a downtrend.

In the example considered, it clear from the below image that the market is in an uptrend, and at the end, the trend seems to be weakening.

Step 2: This is the most critical step where we combine all the rules of the strategy. Once the trend has been identified, we should wait for a crossover of the 5-period EMA below the 10-period EMA, during the reversal of an uptrend. We say that the market has made a ‘top’ when both RSI and Stochastic lines start moving lower after the crossover. We should make sure that RSI does not move into the oversold zone. In order to catch the reversal of a downtrend, we should see a crossover of the 5-period above the 10-period EMA. At the crossover, the RSI and Stochastic lines should head upwards but so much that they move into the overbought zone.

The below image shows the crossover of both the EMAs that is accompanied by a ‘moving down’ RSI and Stochastic.

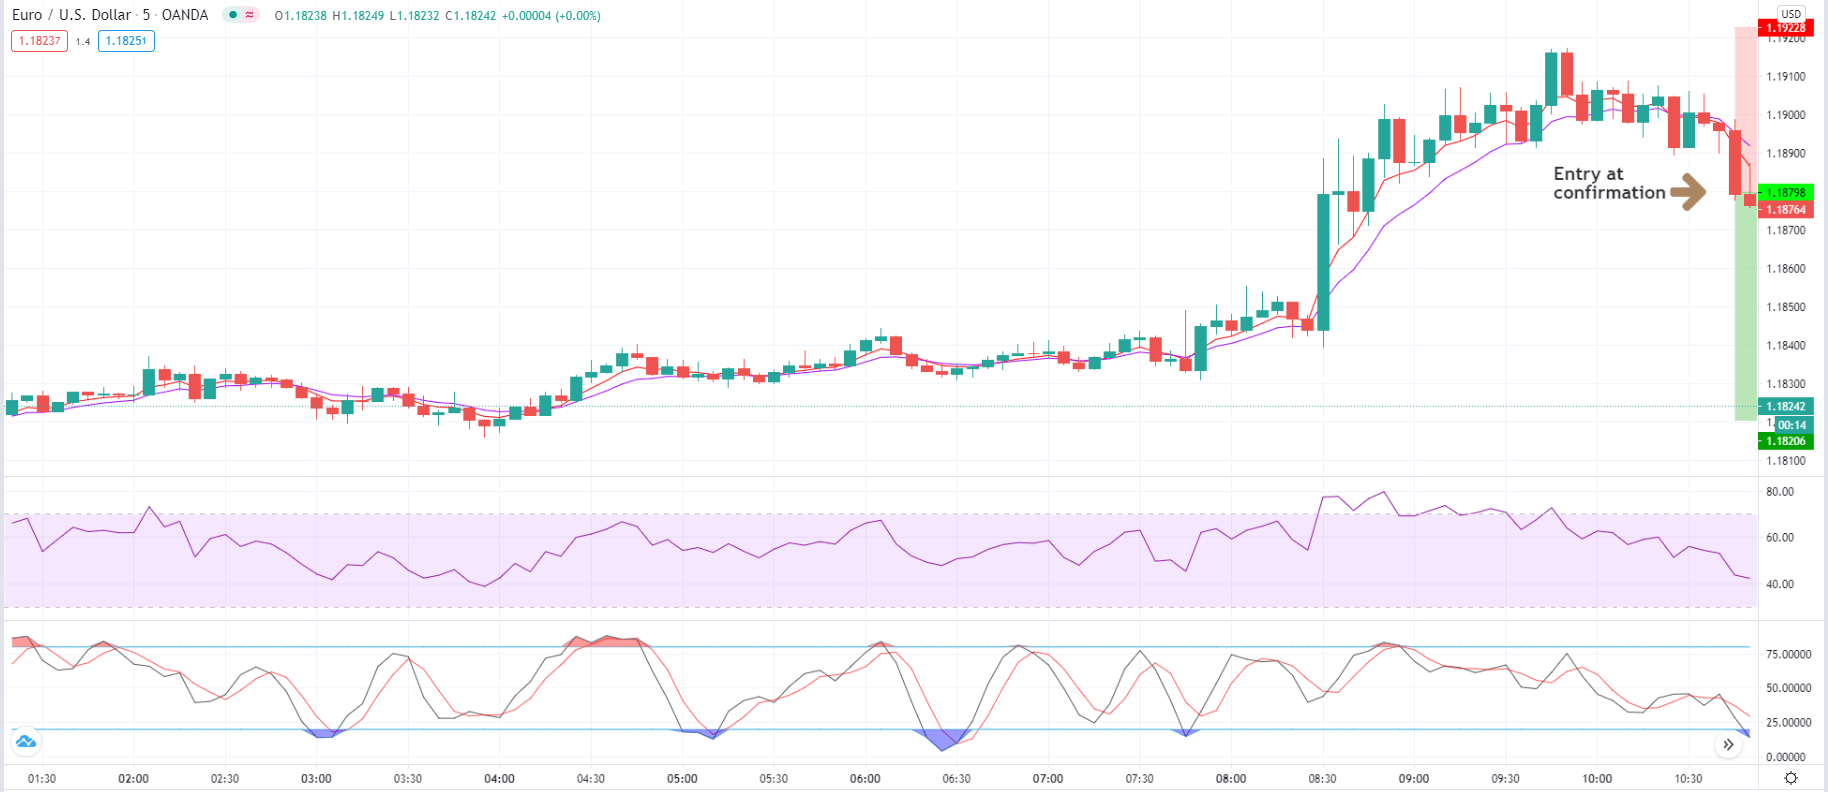
Step 3: Let us discuss the ‘entry’ of the strategy. We enter the market after a confirmation candle in the direction of the reversal. That means we enter ‘short’ after the close a bearish candle below both the EMAs. Similarly, we go ‘long’ after the appearance of a bullish candle, where the price closes above both the EMAs.

We can see in the below image that we are entering the market for a ‘sell’ right after at the close of the price below the 10-period EMA.

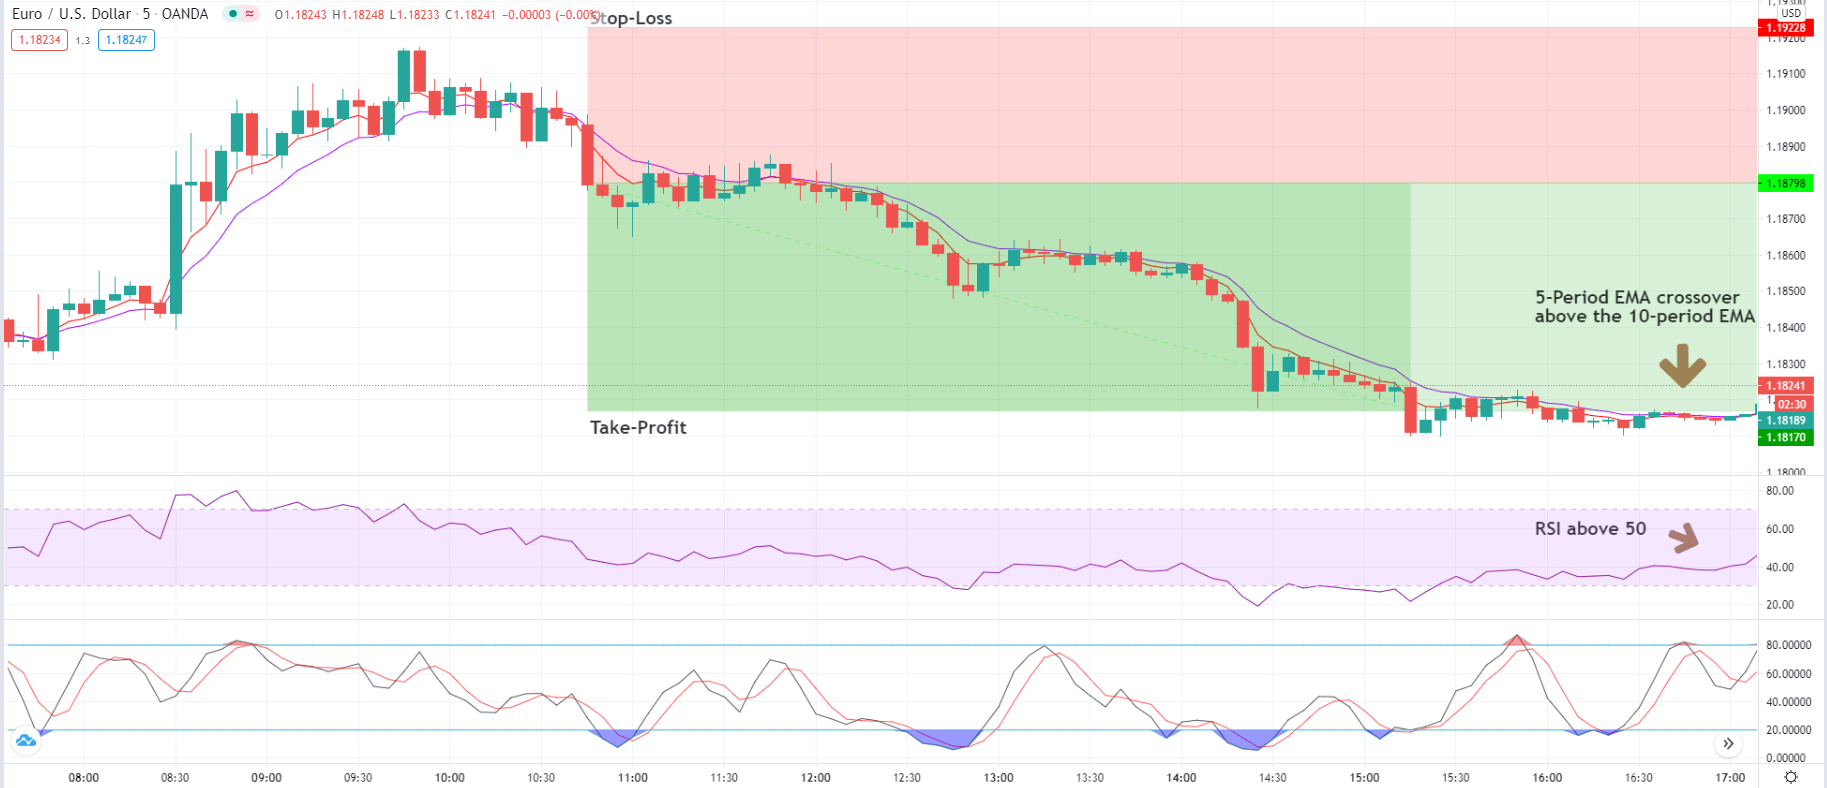
Step 4: In this step, we determine the stop-loss and take-profit for the strategy. The stop-loss is pretty straight forward where we place it just above the ‘highest’ or ‘lowest’ point. We take our profit and exit the position based on the signal provided by RSI. There two ways to exit the strategy. The first signal provided by the market to exit is when the crossover of the EMAs takes place. The second way to exit is when the RSI starts moving higher and crosses above the level of 50.

In the case of EUR/USD, as shown below, we take our profits when both the indicators indicated a reversal of the trend.

Final Words

The strategy actually generates various entry signals, and each of them can at least result in a profit for scalpers, by running very tight stops and keeping risk low. Thus, the strategy makes a reliable reversal trading system which relatively accurately pinpoints reversal points at the end of a trend and, more importantly, the ability to provide high risk-to-reward (RR) trades.

Categories
Forex Basic Strategies

The ‘Daily High Low’ Based Forex Trading Strategy

Introduction

The daily high low based forex trading strategy is a breakout trading strategy from the high and low prices in the daily timeframe. In forex trading, the daily timeframe is crucial as most of the significant market players use this time table in their trading. As a result, any trading strategy in the daily time frame provides better trading results compared to the lower time frame.

On the other hand, when the price creates a rally by breaking the high and low price of the daily timeframe will indicate a significant market momentum. If you can avoid the range market, the high low based strategy can provide a reliable trading result. If you can implement the trading strategy well as per the rule mentioned below, you can make a decent profit from it in any currency pair.

The Daily High Low Based Trading Strategy

The daily high low based forex trading strategy has a simple concept:

  • If the price breaks below the low of yesterday’s candle, it may move further low.
  • If the price breaks above the high of yesterday’s candle, it may move further high.

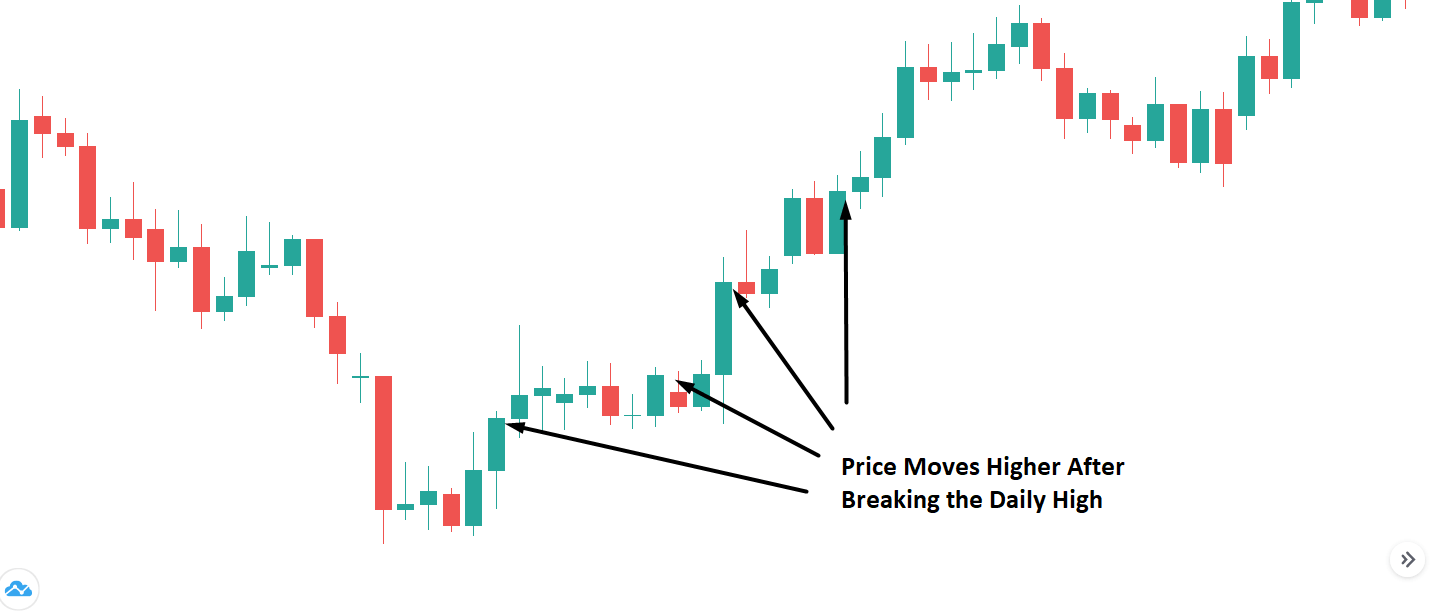
It is a standard brief of this trading strategy. Let’s have a look at the image below:

In this image above, the price has made a new higher high once it breaks above the candle high in the market area. However, there is some market condition where price moves to a range and violates the movement above or below the candle high.

If you are trading the breakout of a daily candlestick that is larger than the earlier candlesticks, you might be caught by the mean reversion of the price. In the forex market, it is often difficult to predict how long a trend could stay. Almost 70% of the time, the market moves within a range; therefore, you should find a location of the price where the breakout from a daily candle would be reliable.

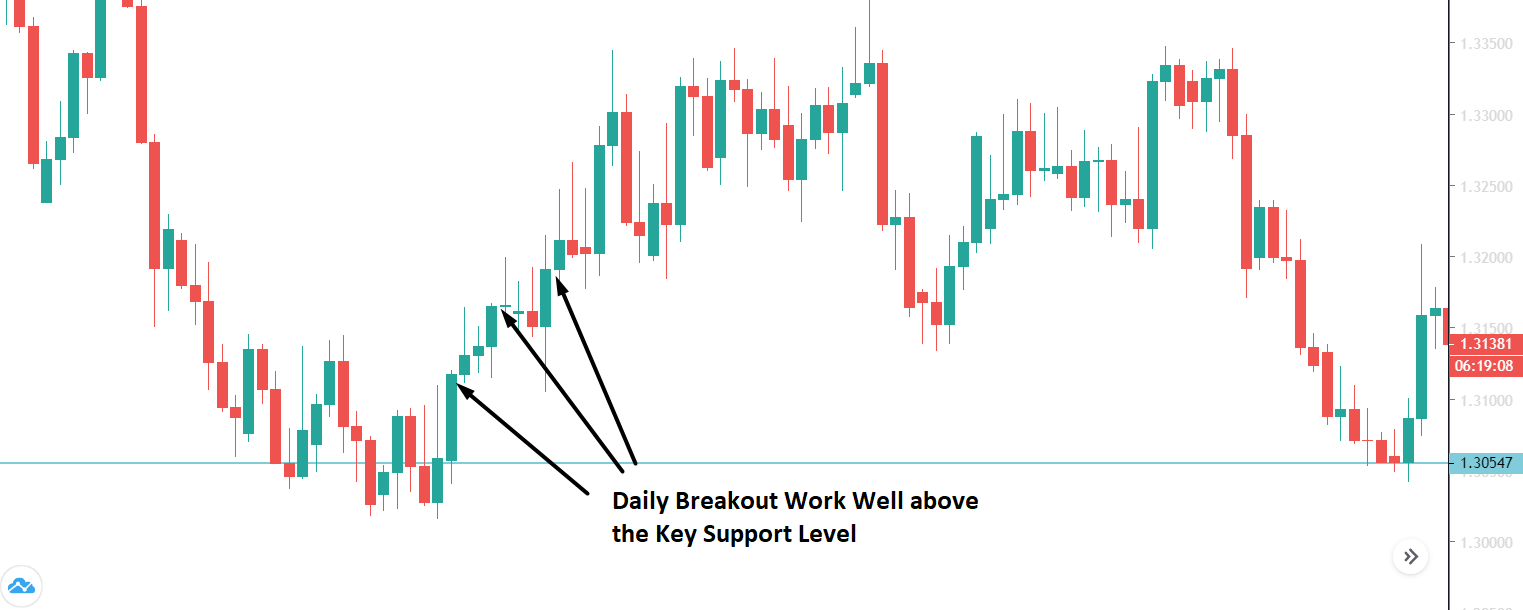
The basic concept of making a good profit from the forex market is to buy from low and sell from high. Therefore, any bullish breakout from a significant support level in a daily timeframe would indicate a reliable daily breakout strategy compared to a trade setup from the middle of a trend. Let’s have a look at the image below, how the price moved up once it got a breakout from a daily candle from a significant support level.

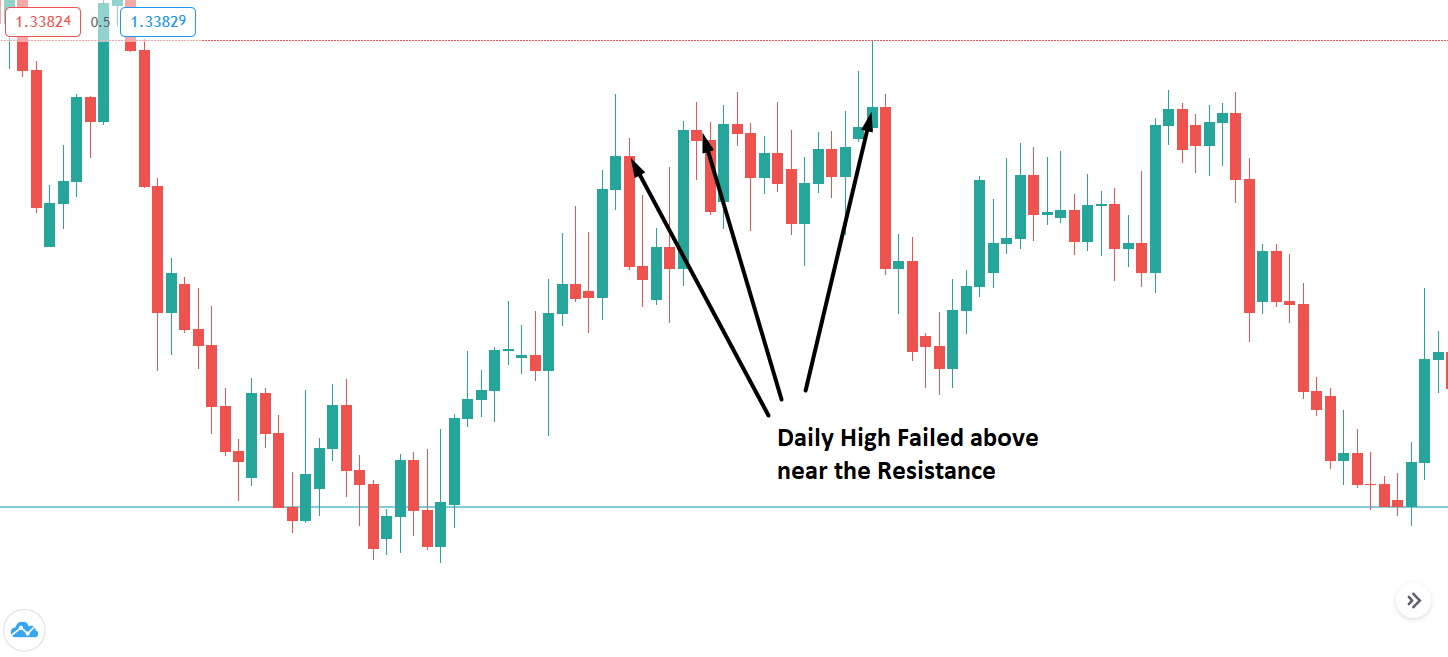
Now look at the image below and see how the price violates the daily breakout to the upside once it reached above 50% of the possible trend.

How to Trade the High Low Breakout Strategy?

This trading strategy is simple as you can make most of the trading decision a day before the movement is expected. The main of this trading strategy is to place two pending orders above or below the yesterday candle. Therefore, you can catch any movement either upside or downside from the previous day’s candle.

Timeframe

We should consider the daily timeframe to determine the high and low prices. Later on, move to the lower timeframe (usually H4) to enter the trade. However, for new traders, it is recommended to stick to the daily timeframe.

Currency Pairs

This trading strategy works well in all currency pairs, including EURUSD, GBPUSD, USDJPY, or AUDUSD. However, sticking to the major and minor currency pairs would provide a better trading result. Moreover, you should avoid exotic pairs as there is a risk of the false move by hitting the high or low and reverse back.

Breakout Rules

  • Identify the currency pair that is moving within a trending environment. You can predict the direction of the price based on the market context or support and resistance.
  • For example, suppose the price is aggressively creating a higher high or lower low. In that case, the price will likely continue the current momentum until it reaches the next resistance or support level. Moreover, any breakout from a significant key level often creates a fresh move either upside and downside.
  • When the daily candle of the previous day closes, place a buy stop above the daily high, and a sell stop below the daily low to catch the breakout.
  • Move your stop loss at 50% of the daily candle.
  • For the take-profit level, you can consider the average price of the last three days’ movement. For example, if the daily candle of the last three days shows the movement of 100 pips, 50 pips, and 100 pips, the total movement would be 250 pips (100+50+100). Therefore, the average price of the last three days would be 83 pips (250/3).

Example of Daily High Low Based Trading Strategy

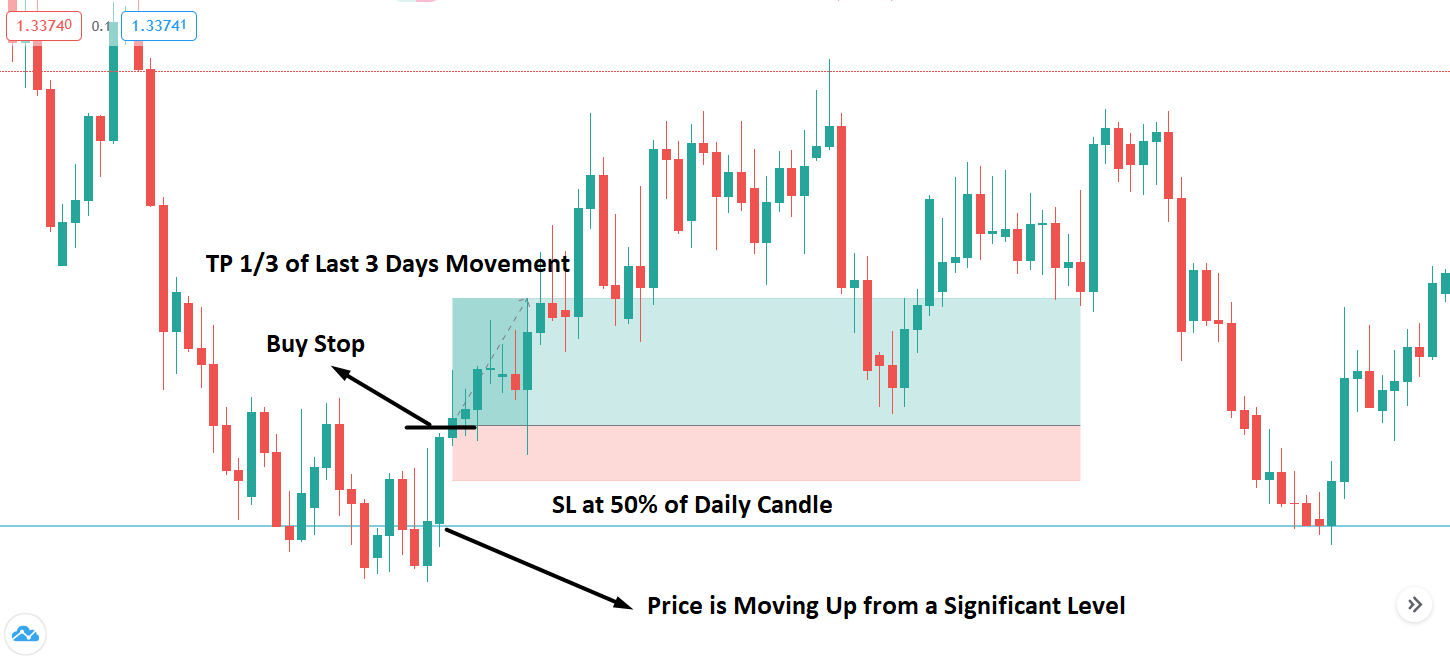
The image below represents the graphical view of the daily high low based trading strategy:

  • In the image above, we can see the price moved up from a significant support level with a daily close above it. A buy Stop is taken once the price had a bullish daily close from the key support level. A similar concept will apply to the bearish market once the price has a daily close from a significant resistance level.
  • The next day, the buy stop is taken, and the price moved to the take profit level. The take profit level is taken by calculating the average price of the last three candles.
  • The stop loss is set at 50% of the previous day’s candle. If the stop loss hit, it will indicate that the price will reverse or consolidate more. In that case, we should wait for a further breakout or move to another currency pair.

Summary

Let’s summarize the daily breakout trading strategy:

  • Identify the currency pair that is moving within a trend or likely to start a new trend.
  • Set buy stop above the candle if the price is moving up from a support level and put a sell stop if the price is moving down from a resistance level.
  • Stop-loss should be at 50% of the previous day’s candle.
  • Take profit will be the average price of the last three days’ movement.

In this trading strategy, the challenge is to avoid correction and choppy market. In that case, you should read the price action to determine the possible movement by measuring the price momentum. Moreover, to get the maximum benefit from this trading strategy, follow strong money management rules.
Categories
Forex Basic Strategies

You Must Know This ‘7-Day Period’ Forex Trading Strategy!

Introduction

Trying to pick the top or bottom is one of the favorite things a trader likes to do. We tried to do that using the ‘Dolphin Strategy.’ We did that with no indicator support. We are again going to unveil a strategy that does pick a top or bottom with no indicator support. This strategy is called the 7-Day period strategy. Let us take a step back and think, indicators are nothing but a mathematical representation of prices, which are calculated in different ways.

Therefore, sometimes it is important to look at prices alone. The 7-day period strategy is based on the idea that after every seven days of consecutive strength, a currency pair’s move is due for a retracement. The question arises, why seven days? This number is derived after constantly watching the market for years. Often, a new trend emerges at the beginning of the week, and if the trend is strong, it can last for several days with no retracement.

Many psychologists believe that human beings have the best retention rates on numbers that are in groups of seven or less. This is one of the reasons why phone numbers in the U.S. only have seven digits, aside from the area code. We have seen that the seven-day reversal pattern is more accurate in a trending market. We gave occasionally seen those periods when the market continues to move in the same direction after seven days of the exhaustive movement, i.e., from the 8th day onwards. Even though the setup is rare, when it does occur, it is significant.

Time Frame

As the name of the strategy suggests, it can be traded only in the daily time frame.

Indicators

In this strategy, no indicators are used. Simple Moving Average (SMA) can put on the chart to get a clear idea of the trend.

Currency Pairs

This strategy can be applied to all the currencies in the forex market. Exotic pairs should be avoided.

Strategy Concept 

The basic idea of the strategy is that when the market is strongly trending on the hourly chart, the retracement does not last more than seven days and changes its direction at the sixth or seventh day. This retracement is considered to over-extended, which leads to a strong reversal in the pair.

If the sixth or seventh candle coincides with a key technical level, the ‘move’ may very well stall at that level and continue its major trend. To implement the strategy effectively, we need to know trends and trend retracement. Since this strategy is based on fixed rules and price action, it is not necessary to know about technical indicators. However, SMA and ATR can be used for trend identification and measuring the momentum of the market.

Trade Setup

In order to understand how the strategy works, we will apply it on the USD/CAD currency pair and execute a ‘short’ trade using the strategy.

Step 1

The first step is to identify the direction of the market. As this is a trend trading strategy, we should be able to identify the major direction of the market. If the market is making higher highs and higher lows, it is an uptrend, or if the market is making lower lows and lower highs, it is a downtrend. A trend can also be determined using the Simple Moving Average (SMA) indicator. Very simply, if the price is below SMA, we say that the market is in a downtrend, and if the price is above the SMA, the market is said to be in an uptrend.

In the example we have considered, from the below image, it is clear that the market is in a strong downtrend.

Step 2

Next, wait for a retracement from the highest or the lowest point, which we will be evaluated based on our strategy rules. The retracement should be such that there are seven consecutive candles of the same color. One or two candles of the opposite color are okay, but we need to make sure that it does not impact the structure of the retracement. These seven candles represent an extended pullback, which can lead to reversal any moment.

In the below image, we can see seven days of the up movement, which is exactly the kind of retracement which we need for the strategy.

Step 3

In this step, we need to check the position of the price after seven straight days of the movement. The strategy works best if the price coincides with a key technical level of support and resistance. This is because, in these areas, the price action is very strong, and market moves as per expectations. But it is important to make sure that no step of the strategy is used individually. All of them need to be used collectively.

We enter the market once we get confirmation after the 7-day period. The confirmation is nothing but a bullish candle in case of a ‘long’ setup and a bearish candle in case of a ‘short’ setup.

In our example, we see that the price has approached the previous ‘lower high’ of the downtrend. This is an area where we can expect sellers to get active and take the price lower.

Step 4

Finally, we need to determine the ‘stop-loss’ and ‘take-profit‘ for the strategy. We place the stop-loss a little higher than the bullish candle when entering for a ‘long’ and little lower the bearish candle if entering for a ‘short.’ We take profit at two places in this strategy. The first take-profit is set at the previous higher high or lower low, while the second take-profit is set at 1:2 risk to reward.

Strategy Roundup

As there are many conditions associated with the strategy, the setup might be rare, but when it does occur, it is significant. We have seen trends where the retracement occurs for just a few days before it starts moving in the direction of the major trend. But these setups are not reliable. The most important condition of this setup is the continuous appearance of bullish or bearish candles for seven days.

Categories
Forex Basic Strategies

Heard Of The CCI (Commodity Channel Index) Trading Strategy?

Introduction

Often in life, taking the right action is the hardest decision to make. The same thing happens in trading as well. Most traders find it extremely difficult to buy at ‘bottom’ and sell at ‘top’ even though from a very early age, we are taught to look for value and buy “cheap.” That is why most traders who proclaim their love for trading with the trend fail to pick tops or bottoms.

While these types of ‘turn’ trades can be very profitable, they sometimes seem like tough tasks as the price can relentlessly trend in one direction, constantly stopping out the bottom and top pickers. Sometimes it is far easier and more comfortable to go with the flow. Yet, most traders are reluctant to buy breakouts for fear of being the last one to the party before prices reverse with a reprisal.

In today’s topic, we will solve the question of “how to trade breakouts confidently and successfully.” The Commodity Channel Index (CCI) Strategy is a setup designed to deal with just such a predicament.

Time Frame

One of the best parts of this strategy is that it works well on all time frames. That means we can use this strategy from very short time frames like 5-minutes to longer time frames such as the 4-hours or daily (D).

Indicators

In this strategy, we will use an indicator that is rarely used in forex. That is the Commodity Channel Index (CCI) indicator, devised by Donald Lambert in 1980 and originally designed to solve engineering problems. The primary focus of CCI is to measure the deviation of the currency pair’s price from its statistical average. As such, CCI is an extremely good measure of momentum that helps us to optimize only the highest probability entries for our setup.

Currency Pairs

This strategy applies to most of the currency pairs listed on the broker’s platform. We need to make that the pair we are choosing is fairly liquid.

Strategy Concept

The CCI is an unbounded oscillator with a reading of 100+ is typically considered to be overbought, and any reading of 100- indicates oversold. For this strategy, we will use these levels as our trigger points and change the CCI interpretation. We will look to buy the currency pair if it makes a new high above 100 and sell if it makes a new low below 100.

In this strategy, we are looking for new peaks or spikes that are likely to take the currency pair higher or lower due to its momentum. The thesis behind this setup is much like a body that will continue to remain in motion until it is hurtled by an external force or slowed down by counter forces. Similarly, new highs and lows in CCI will propel the currency in the further direction of the move until new prices halt the ongoing move.

Trade Setup

In order to illustrate the strategy, we have considered the EUR/JPY currency pair, where we will be applying the strategy on the 1-hour time frame chart.

Step 1

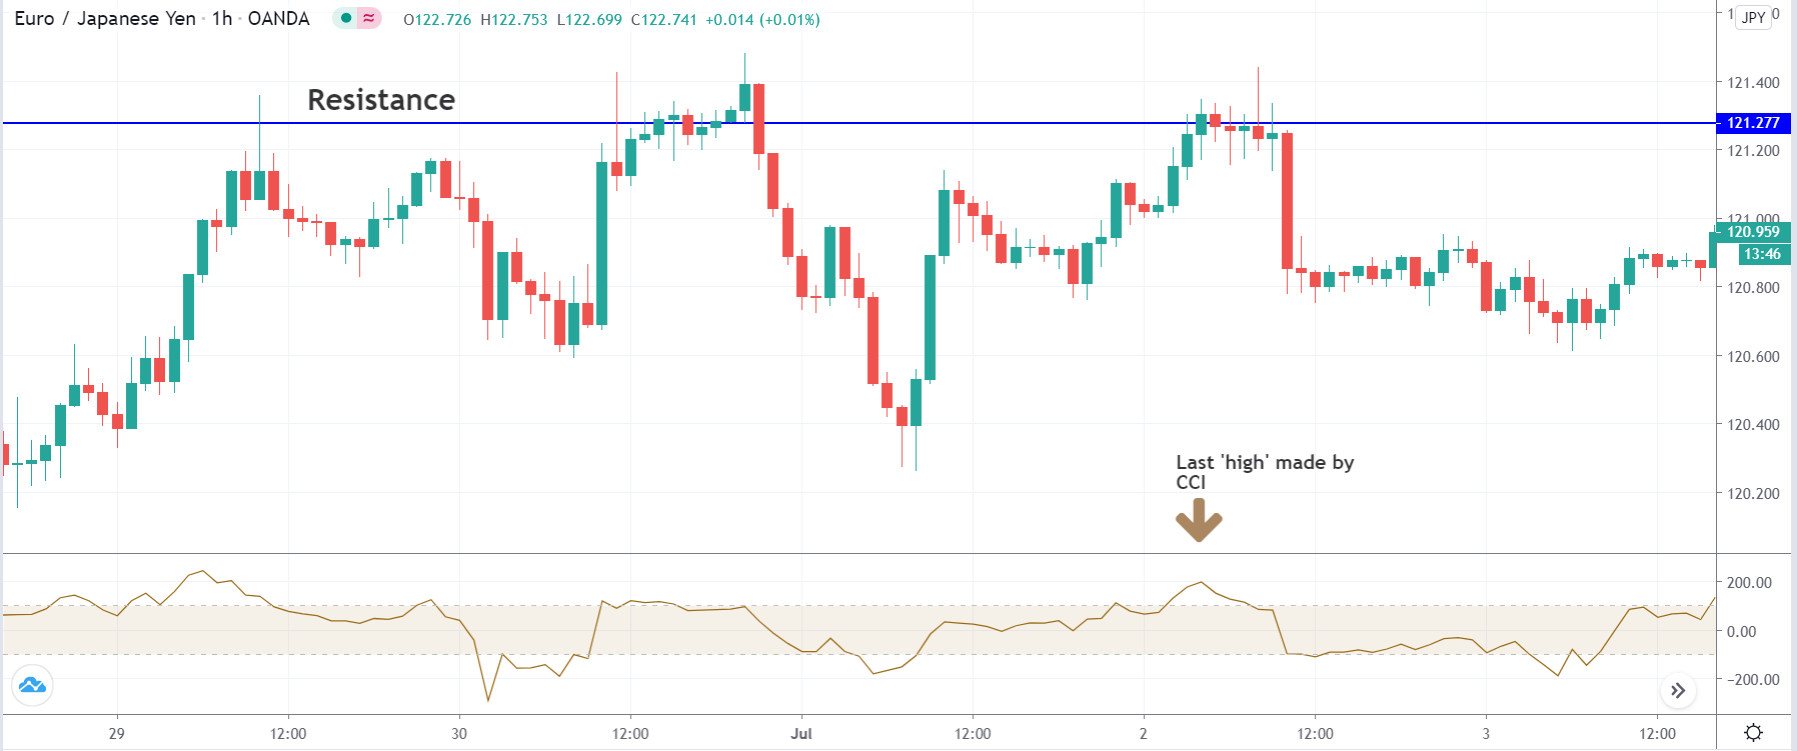
Firstly, open the chart of the desired currency pair and plot the Commodity Channel Index (CCI). Keep the input of the CCI index as 20. Then, mark key technical levels of support and resistance on the chart. For a ‘long’ trade, look for the last ‘high’ made by the CCI indicator and mark it out. That means its value should have crossed +100 during an upward price movement. Similarly, for a ‘short’ trade, look for the last ‘low’ made by the CCI indicator during the downward price movement.

In the below example, we have identified a ‘resistance’ and a ‘high’ that was made by the CCI indicator. Since the ‘high’ is more prominent on the chart, we will look for ‘long’ trades in the currency pair.

Step 2

This step is the most important part of the strategy. Here, we need to wait for the CCI indicator to market a new ‘high’ or new ‘low,’ which is higher than the previously identified ‘high’ or ‘low.’ This indicates a build-up of momentum in the market with the high chance that the market will continue moving strongly in the same direction. In the next step, we will see how to take an ‘entry’ after carrying the previous steps.

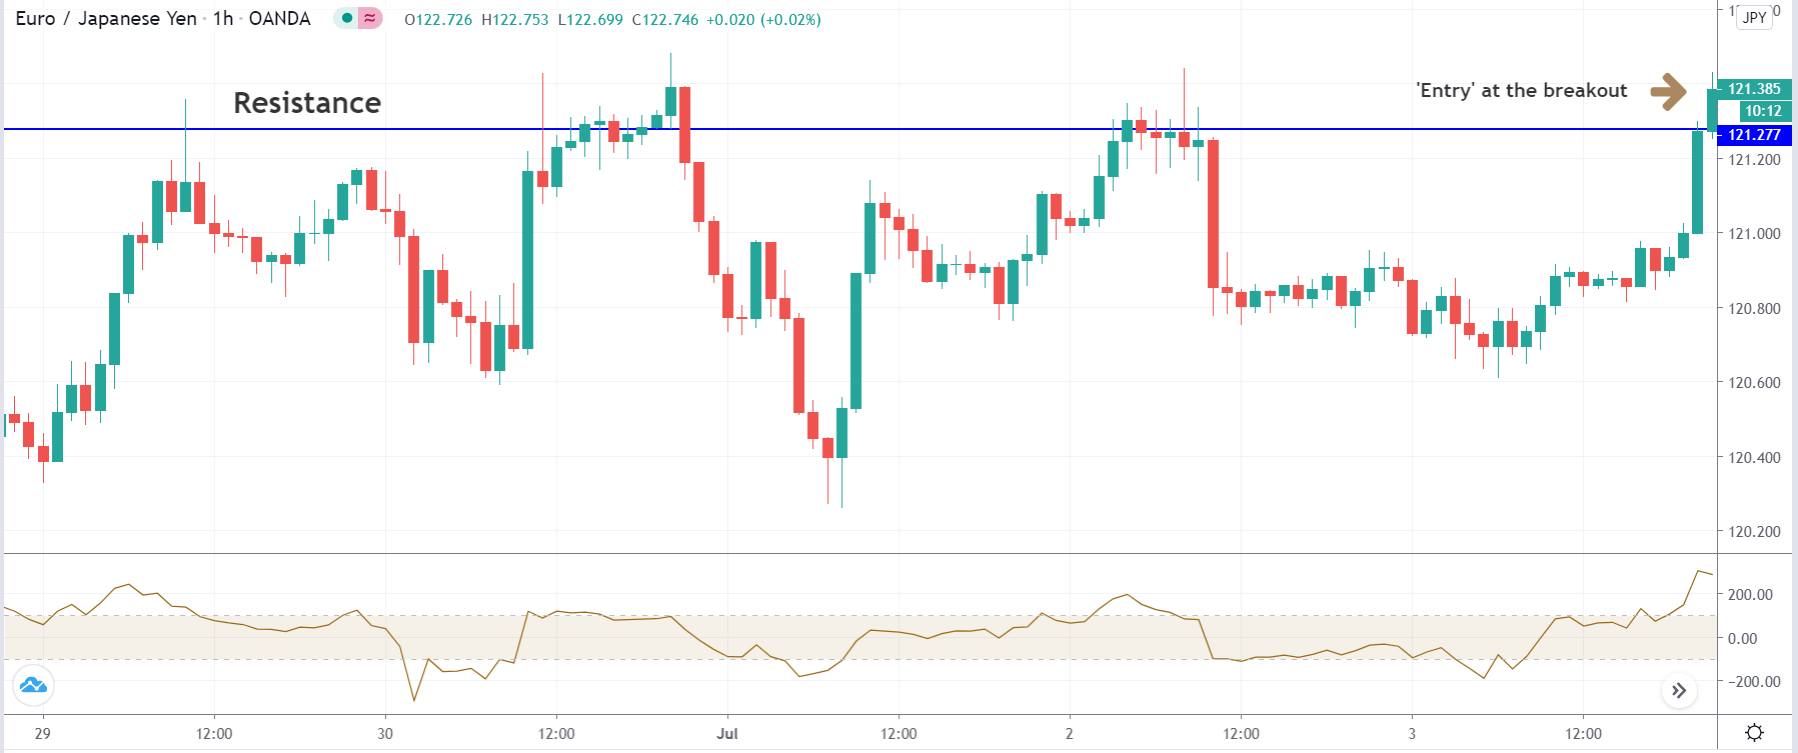
In the below image, we can see that the CCI index makes a new ‘high’ at the appearance of a bullish candle. At this moment, the price is exactly at resistance, which means we need to ‘sell’ from here. This is where the strategy comes into the picture.

Step 3

Once the market starts moving in our favor by about five pips, we enter with the appropriate position size. This is an aggressive form of ‘entry’ where we take advantage of the existing momentum. A conservative ‘entry’ would be to wait for a price retracement and enter after receiving a confirmation from the market.

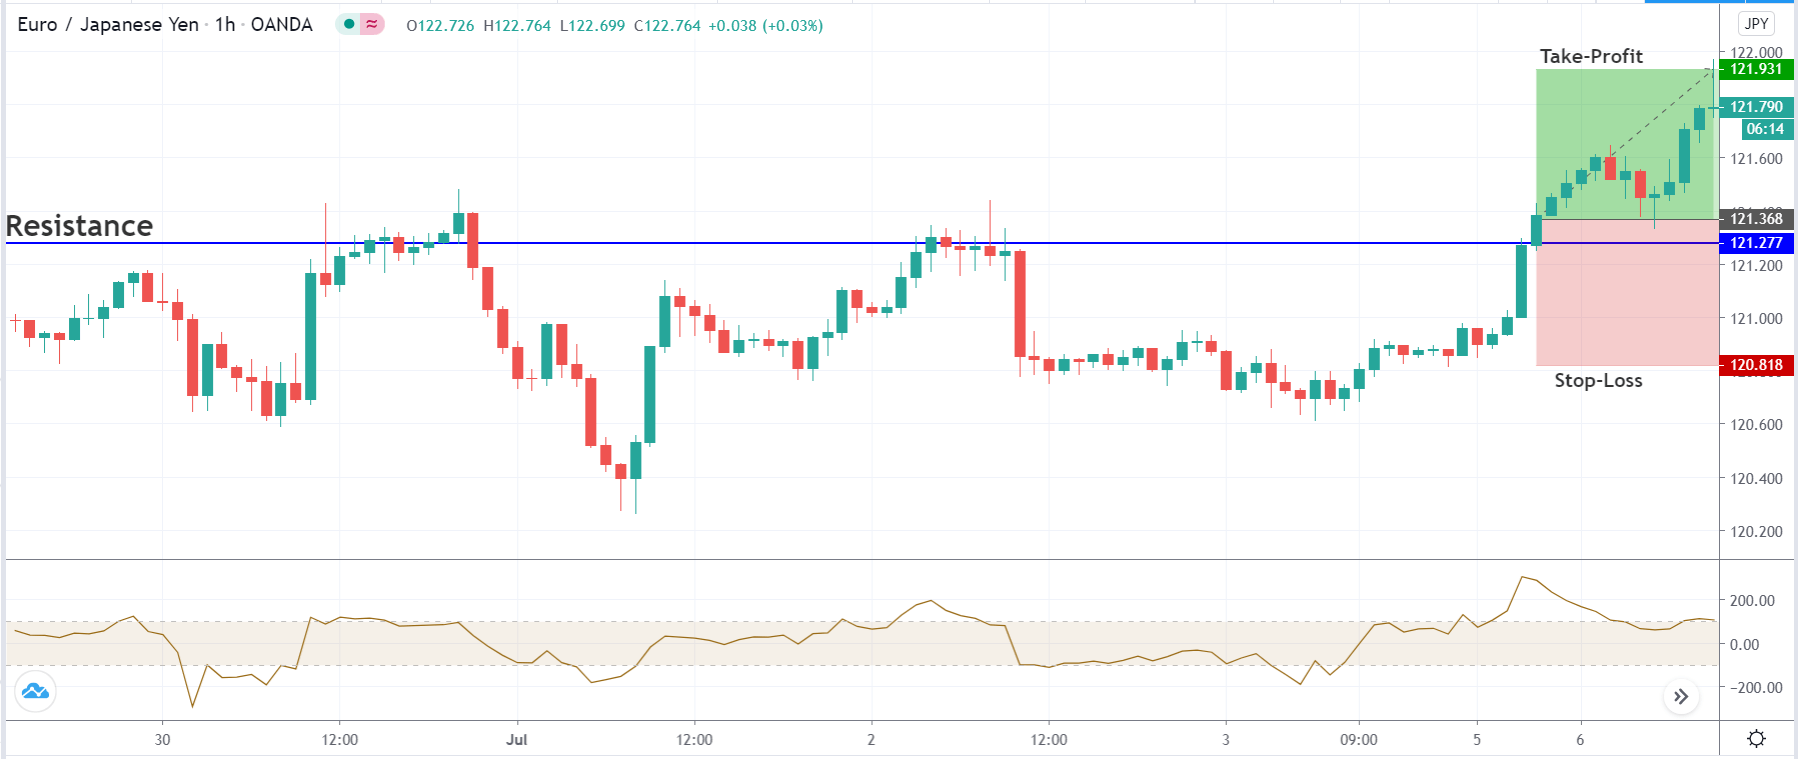
In our example, we are taking an aggressive entry, i.e., at the breakout of the resistance. All traders who will be selling here thinking it as resistance would get trapped. This is the application of the CCI indicator.

Step 4

In this step, we determine the stop-loss and take-profit for the strategy. Stop-loss is placed below the previous ‘low’ in case of a ‘buy’ and above the previous ‘high’ for a ‘sell’ trade. If the ‘high’ or ‘low’ is too far away, it could reduce the risk to reward ratio. In such cases, the stop-loss can be placed 20-25 pips from the entry point. The ‘take-profit’ is set at 1:1 risk to reward.

Strategy Roundup  

If the rules are strictly followed, we may not experience any serious drawdown as we are trading based on market momentum. The key is a high probability, and this is exactly what the ‘CCI strategy’ provides. This strategy exploits the application of the CCI indicator, which is highly underrated in the forex market.

Categories
Forex Course

122. Harmonic Pattern Trading – Gartley Pattern

Introduction

The Gartley is one of the most traded harmonic patterns in the market. Just like the AB=CD pattern that we discussed in the previous course lesson, the identification and confirmation of the Gartley pattern are based on the Fibonacci levels. Technical traders use this pattern to trade the retracement and continuation that occurs when the trend temporarily reverses before continuing to move in its original direction. This pattern is also referred to as a Gartley222 because the inventor of this pattern, H.M Gartley, first described this pattern on page number 222 in his famous book ‘Profits in The Stock Market.’

Moves Involved In The Formation Of Gartley Pattern 

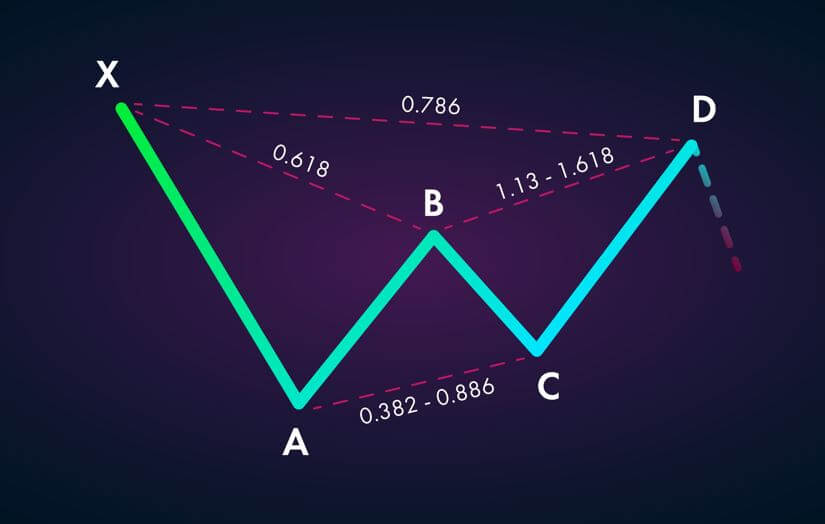
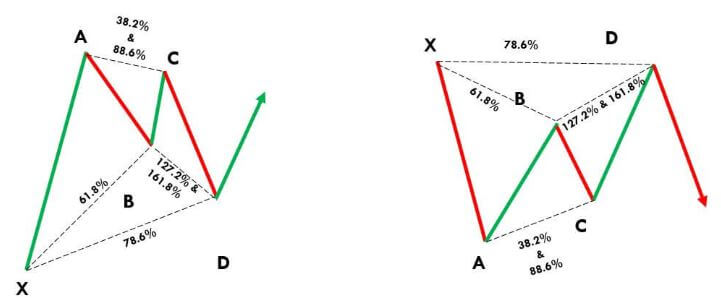
X-A – In the bullish version, the first leg forms when the price rises sharply from point X to point A.

A-B – The AB leg changes its direction and retraces to Fib level 61.8% of the XA leg.

B-C – In the BC leg, price action changes its direction and retraces from 38.2% to 88.6% of the distance that is covered by the AB leg.

C-D – This is the last leg of the pattern, and it reverses again to the downside. It must retrace to 78.6% of the XA leg.

Below is how the fully formed Bullish and Bearish Gartley Patterns look like:

Trading The Gartley Pattern

Bullish Gartley Pattern

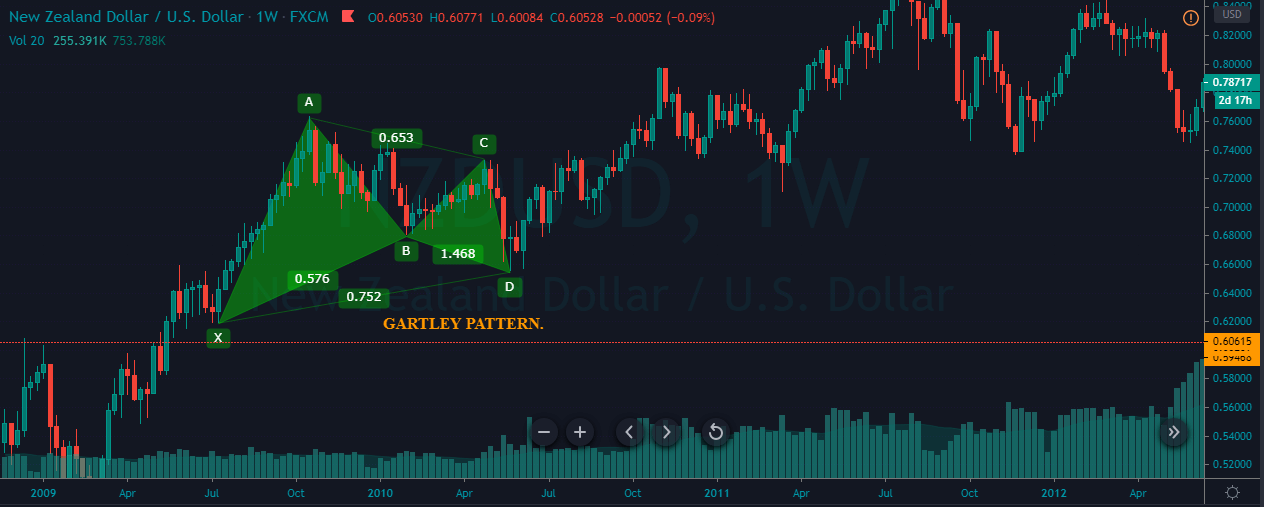
The chart below represents the formation of a bullish Gartley pattern on the NZD/USD weekly chart.

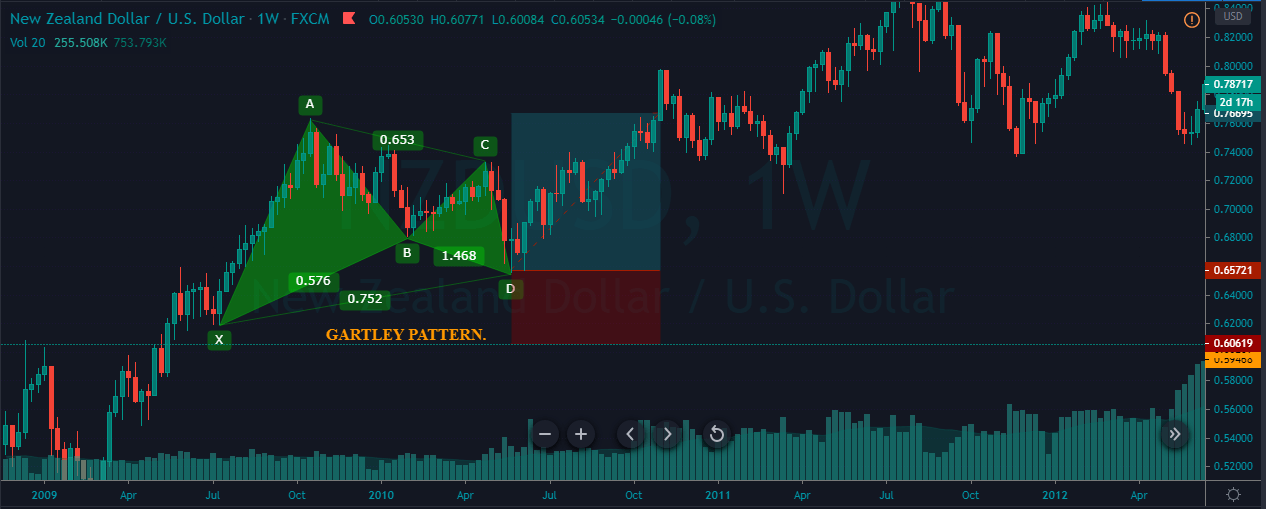
In the below chart, the four swing highs and swing lows bind together to form the bullish Gartly pattern. It is crucial to validate the fibs ratios on the price chart. The first XA leg was the bullish move, and the successive AB leg was a bearish move. We can see that the AB move was close to the 61.8% level of the AB leg.

Furthermore, BC is a bullish move, and it is retracing close to the 88.6% fib level of the AB move. The last step was the CD leg, and if this one goes wrong, the whole pattern gets invalidated. However, the CD move was bearish, and it is close to the 161.8% fibs level of the BC leg. The trade activation was at point D, and we have placed the take profit order at Point A.

Bearish Gartley Pattern

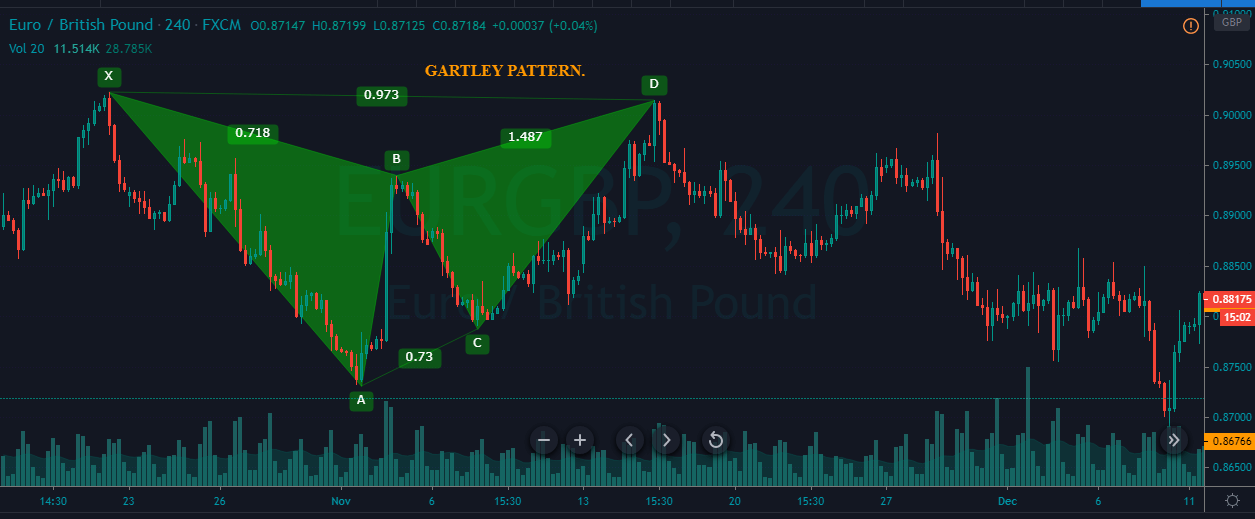
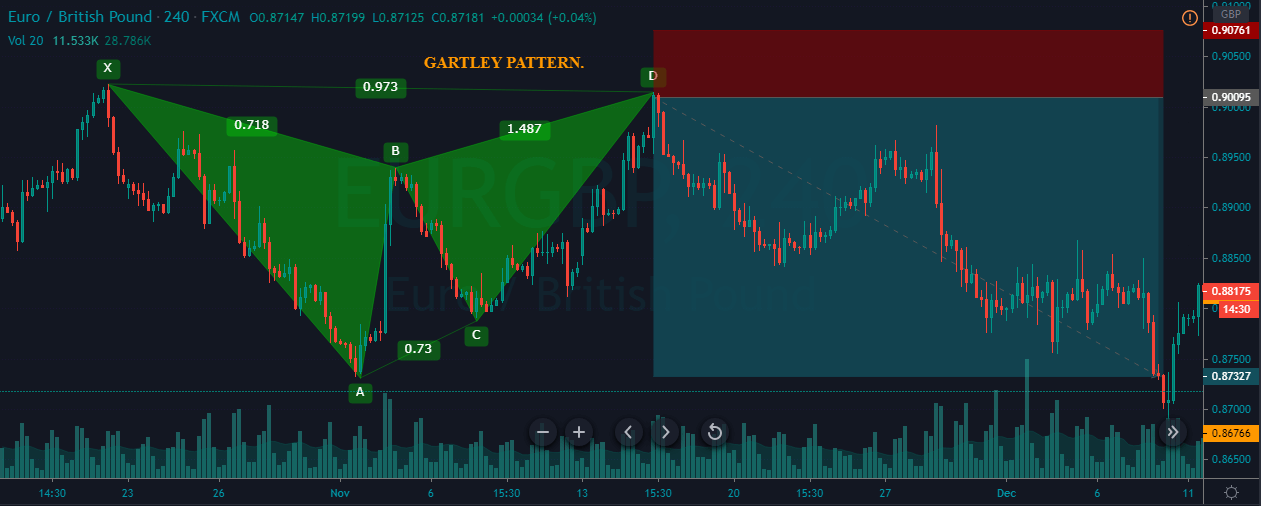
The price chart below represents the formation of a bearish Gartley pattern on the EUR/USD 240 Forex pair.

We can observe that the first leg of this pattern was XA, which is a bearish move. It is followed by the reverse in trend printing the AB leg, which is close to the 61.8% extension of the XA leg. The third leg, BC move, was bearish again, and it is close to the 88.6% fibs of the AB move. The last leg is the CD move, and this leg is 161.8% fibs ratios of the BC. The activation was at Point D, and the stop-loss is placed above point D. For take-profit, we have gone for the Point A. You can also partially book your profit at point C and exit your positions at point A.

Conclusion

The confirmation of the Gartley pattern must be done using the fib ratios alone. In the beginning, it can be difficult for you to spot this pattern on the price chart, but you will eventually get used to it. Hence, in the beginning, try to identify & trade this pattern on a demo account. Once you master all the rules involved while trading this pattern, you can go ahead and trade it on the live markets. Cheers!

[wp_quiz id=”76837″]
Categories
Forex Basic Strategies

How To Trade The ‘Double Top’ Chart Pattern Like A Pro

Introduction

There are some patterns in the market that are widely used by traders across the world, and the Double Top is one of them. It is a simple and straightforward method of identifying the potential selling trades in any given Forex pair. Most of the novice traders who trade this pattern tend to face problems as they do not know how to use it correctly. Hence, for those types of traders, we are putting this piece together. By the time you finish reading this article, you will exactly know to identify and maximize gains using the Double Top chart pattern.

Double Top Pattern

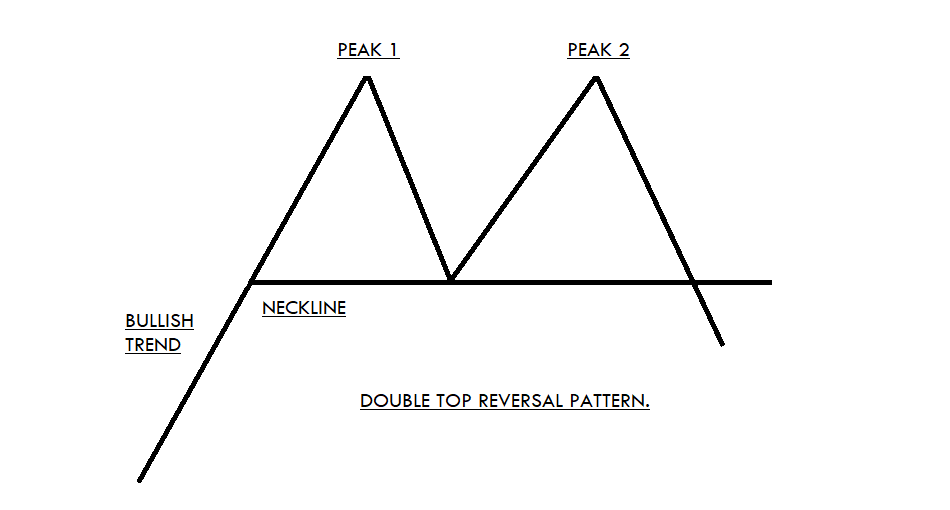
The Double Top is a bearish reversal pattern that is usually formed at the end of a bullish trend. The two consecutive rounding tops complete this pattern with approximately the same highs. The first rounding top should be formed at a significant resistance area. Most of the time, the momentum of the second round top is quite weak, and this indicates the buyers are getting exhausted.

This eventually means that the sellers are now going to take control. Both the round tops retrace at a significant support area, which we call the neckline. The identification of this pattern can be comprehended as the professional traders and investors trying to obtain the profits from the bullish trend. And now, the markets are ready to publish a new selling trend.

Psychology Behind The Double Top Pattern

We know that the Double Top pattern occurs at the major resistance area. This pattern indicates when the price action reaches a significant resistance area, the buyers are now afraid to buy because of resistance. On the other hand, the sellers are hitting the sell orders at the same resistance area.

At this point, when the price action is pulled back to a significant support area, which we called the neckline, it shows that the buyers are now buying again at major support areas to print brand new higher high. However, when the price action reaches the resistance area again, buyers fail to print a brand new higher high. As a result, they start to book the orders, and now the sellers are gaining control. Hence the price action tends to move in the opposite direction.

Double Top Pattern – Trading Strategies 

There are several ways to trade the Double Top chart pattern. But the strategies we are going to share here are well-proven methods. Also, we have backtested these strategies time and again to make sure they are accurate.

Double Top Pattern + Bearish Candlestick Patterns

There are various bearish candlestick patterns that are widely used by the traders in the market. For this strategy, you can use any of the bearish candlestick patterns. Some of the most commonly used bearish candlestick patterns are Bearish Engulfing, Evening Star, Shooting Star, Hanging Man, Three Black Crows, etc.

The idea is to identify any of the above mentioned bearish candlestick patterns near the second peak. If you find any of these patterns, you can go short. Make sure to place the stop-loss above the resistance line. We can place two or more TP orders. First, take-profit must be at the neckline, whereas the second one can be placed two times above the size of the pattern formed.

Identifying the Pattern

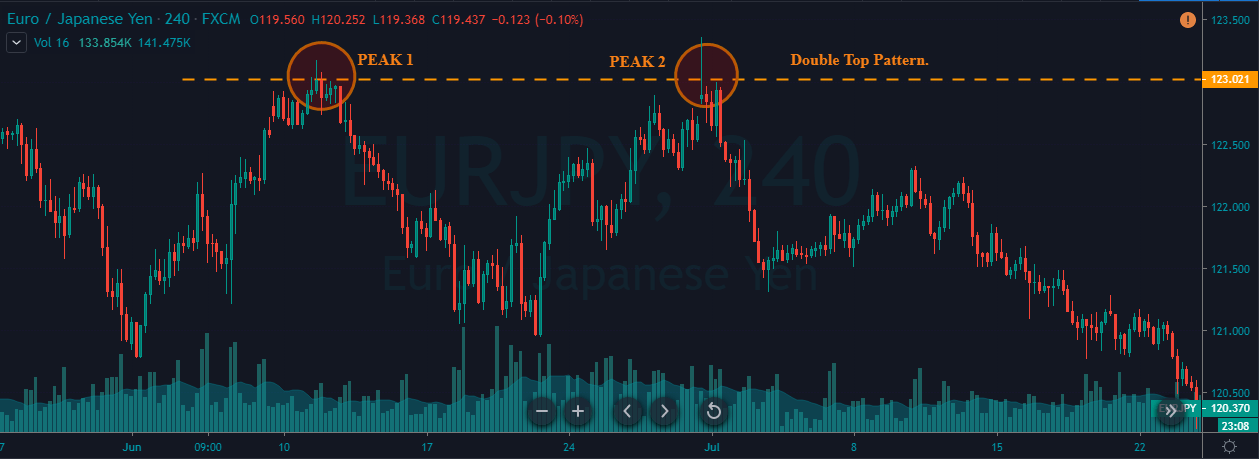
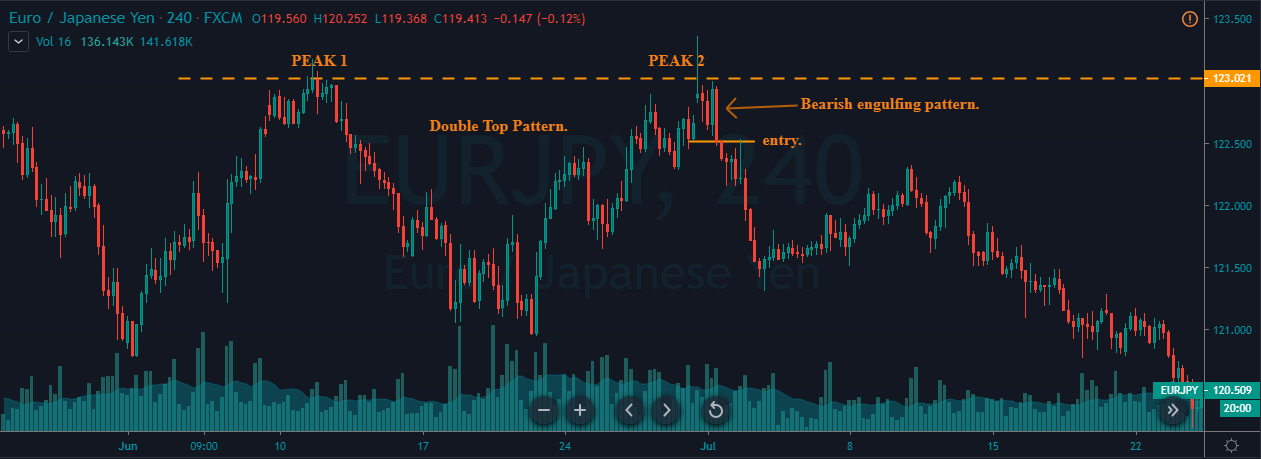
In the below EUR/JPY chart, we have identified the formation of a Double Top pattern.

Entry

As we can see in the below chart, the price action prints a Bearish Engulfing candlestick pattern right after the second top. This indicates that the sellers have completely absorbed the buyers, and now it’s time to go short in this pair. We took a sell entry at the close of the Bearish Engulfing candle.

Stop-Loss & Take-Profit Placements

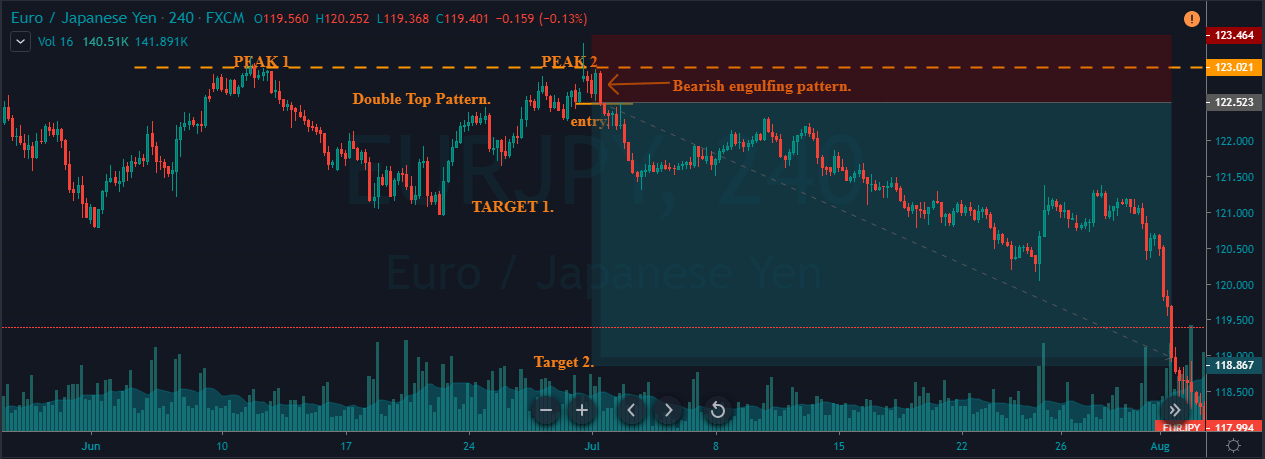
As we can see, we have entered the market at the closing of the Bearish Engulfing candle and placed the stop-loss just above the resistance line. This pattern has the highest odds of working in our favor; hence we can go with smaller stop-loss. Because, whenever this set-up is found, the price action has a very little chance to spike.

As discussed, the first take-profit was placed at the neckline of the pattern, and the second take-profit was placed double the size of the complete pattern. But, please decide the placement of TP according to your trading style. Remember that you can close your position wherever you want.

Double Top Pattern + RSI

In this strategy, we have paired the Double Top pattern with the RSI indicator to identify accurate shorting signals. As you might have probably known, RSI stands for the Relative Strength Index. It is a momentum indicator developed by the J. Welles Wilder Jr. in 1978. This indicator oscillates between the traditional levels of 70 and 30. When this indicator reaches the 70 level, it indicates that the market is in an overbought condition, and it indicates the market is oversold when the indicator reaches the 30 level.

Here, the strategy is simple. When the price action hits the second peak and starts to struggle, see if is the RSI is at the overbought market conditions. If it is, then it can be considered a potential sell signal.

Identifying the Pattern

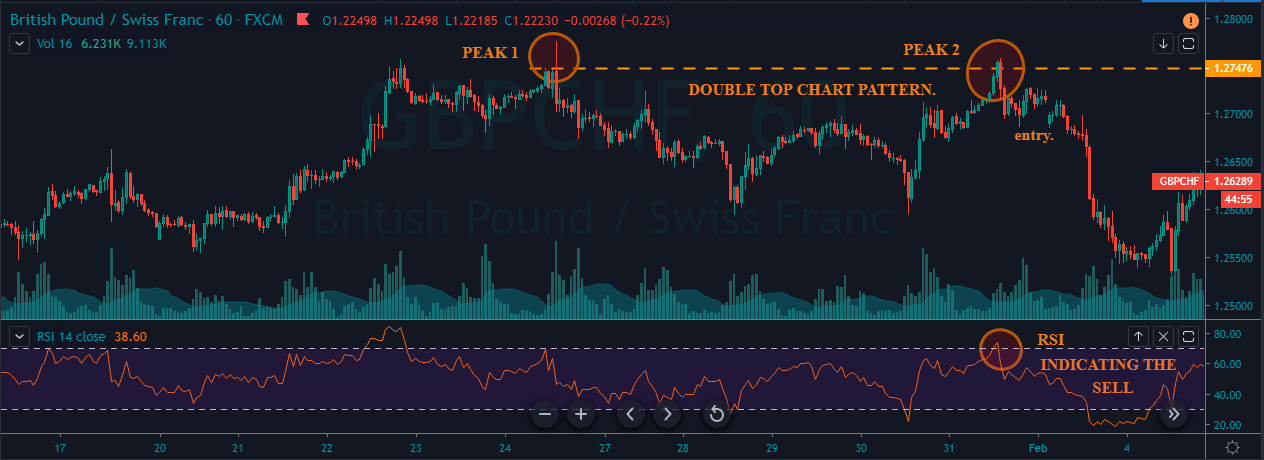
We have identified a Double Top chart pattern in the below GBP/CHF Forex pair.

Entry

In the below chart, we can see the first peak and second peak of the pattern being quite strong. When the price action approached the second peak, it dropped immediately. This shows that the buyers are exhausted, and sellers took over the show. At the same time, we can also see the RSI giving a sharp reversal in the overbought area. Hence we can confidently go short in this pair.

Stop-Loss & Take-Profit

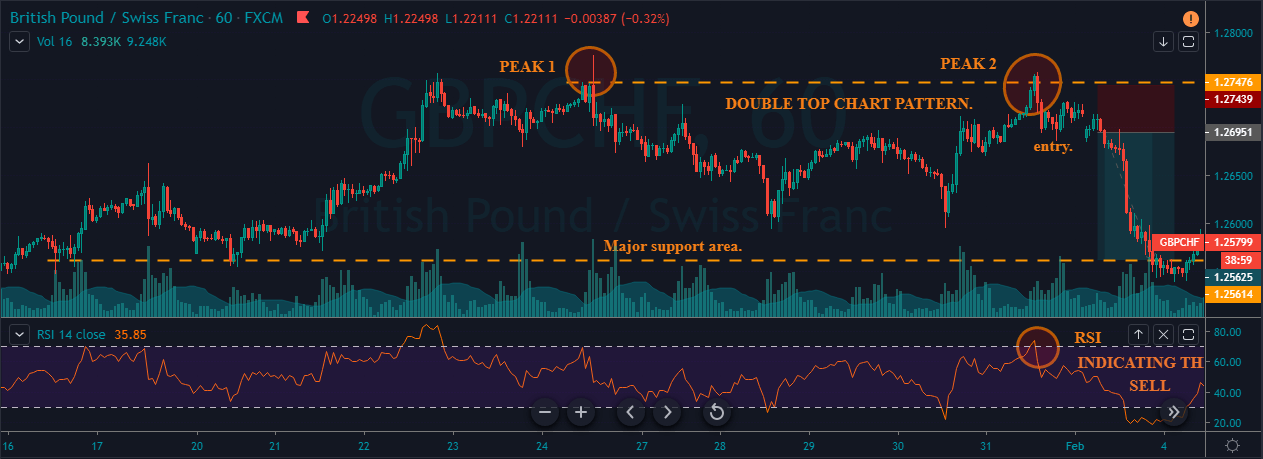
We went short when the criteria are fulfilled and placed the stop-loss just above the entry. Take-profit was placed at the higher timeframe’s support area. Overall, it was a 100+ pip trade. If there is no significant support area for you to exit your positions, you can close them when the RSI reaches the oversold area.

Conclusion

Pattern trading is the easiest way to make more profits in the market. Some patterns provide a great risk to reward trades, and some do not. The Double Top is one such pattern that offers some of the best risk-reward entries. This pattern works well on all the trading timeframes. Make sure to know the logic behind this pattern before trading so that any potential mistakes can be avoided. All the very best!

Categories
Forex Basic Strategies

Trading The ‘Wedge Pattern’ Like A Professional Technical Trader

Introduction

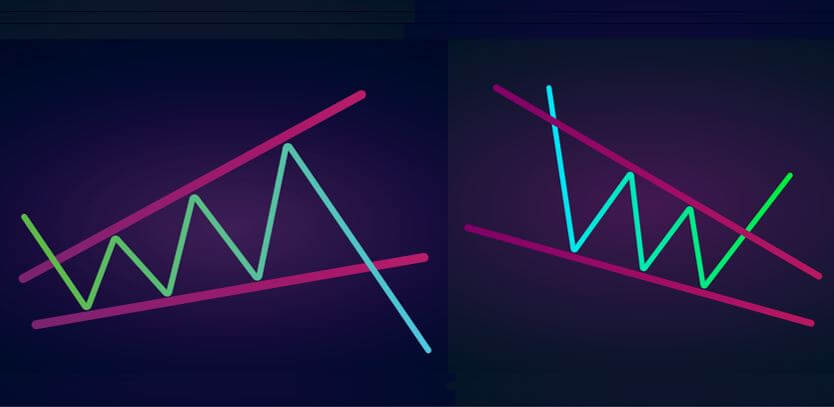
A Wedge is a technical chart pattern marked by converging trend lines on the price chart. The trend lines on the price chart are drawn to connect the highs and lows of price action over a specific period of time. The wedge pattern holds three significant characteristics:

  1. The converging trend lines.
  2. A major decline in volume as the price action progresses through the pattern.
  3. A major breakout on either of the sides.

The Two Types of Wedge Patterns

  • The Rising Wedge (signals a bearish reversal)
  • The Falling wedge (signals a bullish reversal)

The Rising Wedge

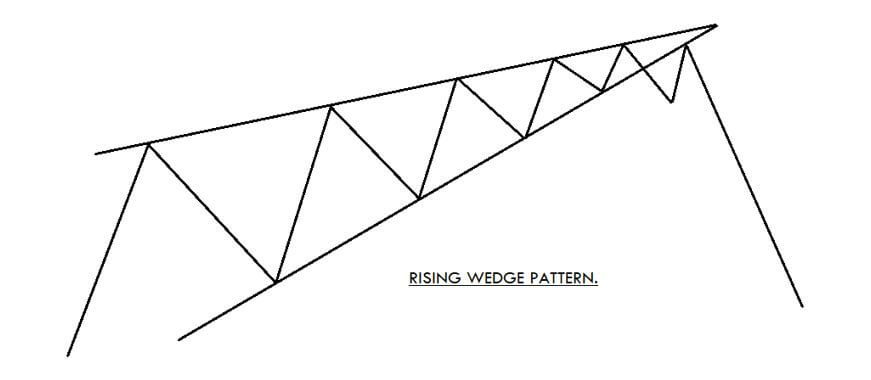
The Rising Wedge is a bearish trading pattern that begins with a wide bottom. The pattern contracts as the prices rise. This pattern typically appears in an uptrend, and on higher timeframes, it takes nearly 3 to 6 months of time to form. Upper and lower trend lines must have at least 3 to 4 higher highs and higher lows to consider that as a Rising Wedge pattern. The loss of volume on each successive high indicates that the price is losing its momentum, and soon we can expect the downside reversal.

The Falling Wedge

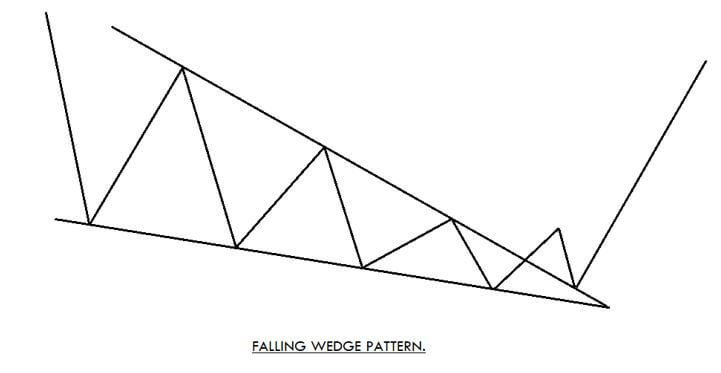
The Falling Wedge is a bullish pattern that begins wide at the top and contracts at the bottom. To confirm this pattern, see if the direction of the trend is downward. Most often, the Falling Wedge pattern forms at the end of the downtrend, as it prints the last lower low on the chart. Mostly this pattern takes almost three to four lower lows and lower highs to print on the price chart. As the price action drops, the loss of volume and momentum increases the probability of bullish reversal.

Wedge Pattern Trading Strategy

The Falling Wedge Pattern

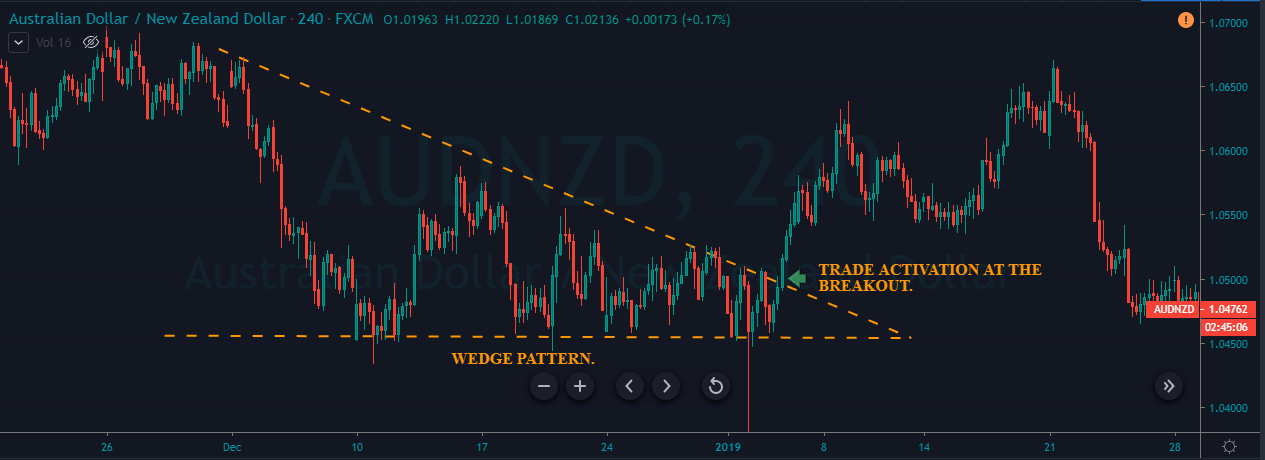
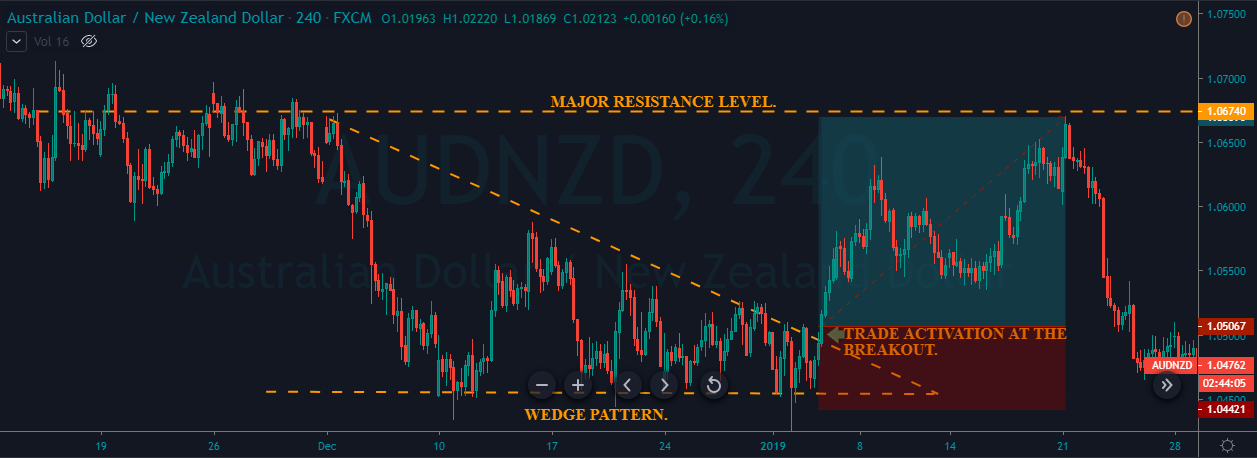
As discussed, a Falling Wedge indicates that the sellers are losing momentum in the market, and the buyers are gaining momentum. This means that we can soon expect a buy-side reversal in the trend. As we can see in the image below, we have identified a Falling Wedge pattern in the AUD/NZD Forex pair. We can clearly see that the price action is confined within the two lines, which gets closer together to create a Falling Wedge pattern. The loss of selling momentum indicates that the buyers are gaining control. When the price action breaks the upper trend line, it shows that the sellers are now out from the game, and this instrument is ready for brand new higher highs and higher lows.

The image below represents our entry, exit, and stop-loss in the AUD/NZD Forex pair. The entry was purely based on the breakout, and the stop-loss was just below the second line. In this example, we go for deeper stop-loss because the market was quite volatile. Most of the time, the breakout line acts as a strong support to the price action. So we can go for a smaller stop-loss just below the close of the recent candle as well. The placement of take-profit order entirely depends on you. Some of the common ways to exit our position are when the price hits the major resistance line, or when the buyers start to lose momentum. In this example, we have placed the take-profit order at the higher timeframe’s resistance area.

The Rising Wedge Pattern

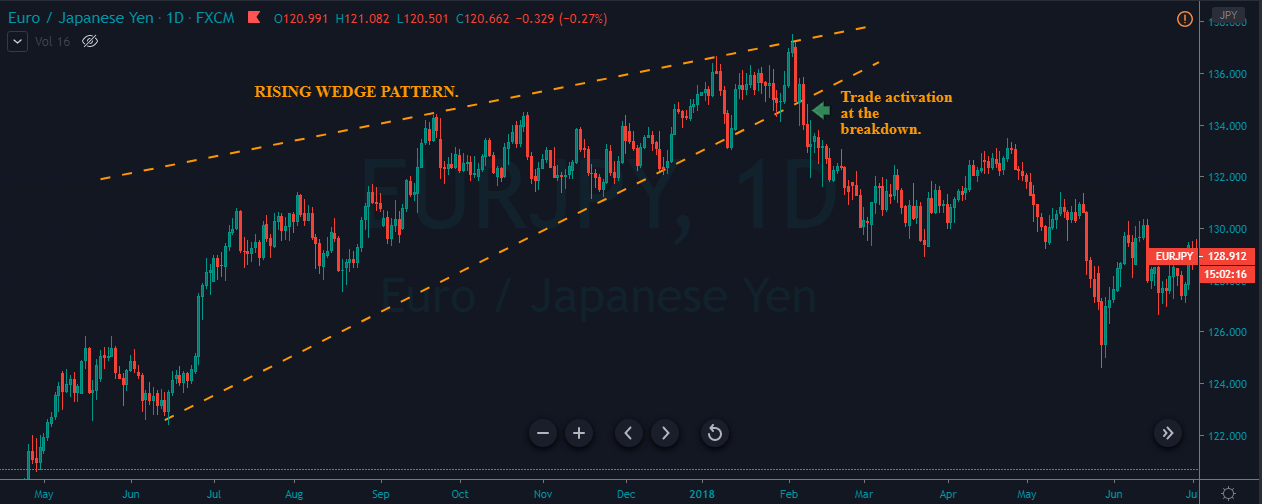
Markets prints the Rising Wedge pattern in an uptrend. When the two lines of the pattern get closer, it indicates that the uptrend is losing momentum, and the probability of the downside reversal is increasing. So when the price action breaks the lower trend line, it is an indication to go short. The below image represents the falling wedge pattern in the EUR/JPY Forex pair, and the entry was at the breakout of the lower trend line.

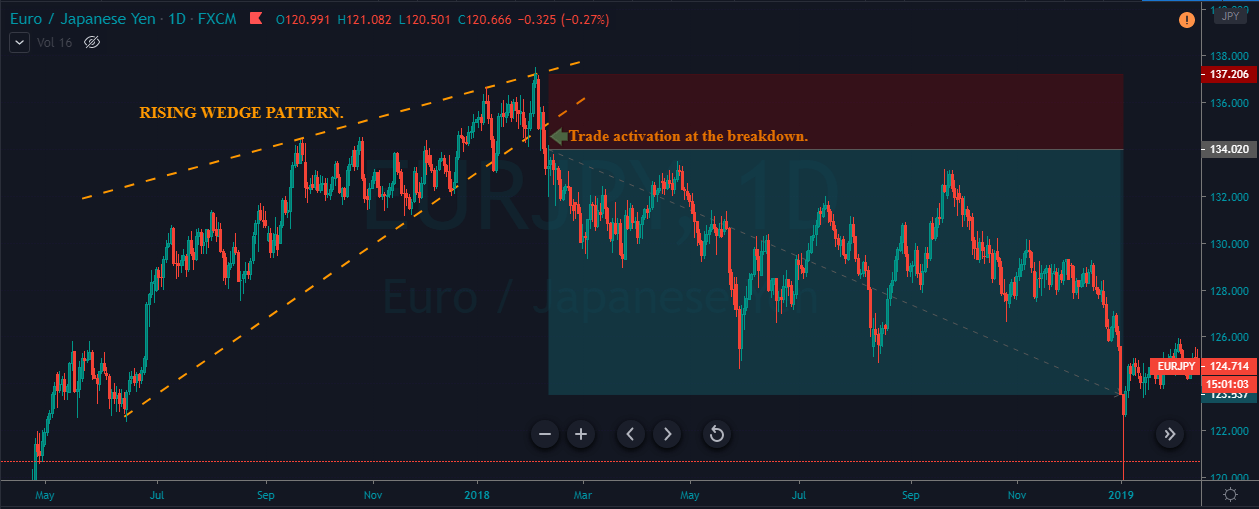
The below chart represents our entry, exit, and take profit in this pair. As mentioned, the entry was after the breakout, and the stop-loss was at the most recent higher high. To place the take-profit, we choose the major resistance line. But notice that on this daily chart, price action took so much time to hit our take profit. This is normal, and while trading this pattern, we will face these types of situations. Most of the time, this pattern offers very strong signals. So it is important to control our emotions and not panic. Holds your positions for the target you are looking for. If the price action came back to the breakeven, only then we suggest you close your position. Otherwise, place the stop-loss at breakeven and wait for the market to hit the take-profit.

Pros & Cons Involved

Just like any other technical trading pattern, the Wedge pattern also has its own pros and cons. The problem is that there is no specific benchmark for this pattern of where to enter and where to exit our positions. Some traders pair this pattern with the other technical indicators to take an entry while some traders wait for the trend line breakout to take entry.

Both ways work very well, and both have the chance to lead us to more significant profits. The biggest advantage we have is the leverage of more than two lines coming together. It is a warning for us to stop taking sell trades and expect a buy-side reversal soon. So with this, we know the shift in the direction of price action ahead of time. This will ultimately help us in entering the trend at the earliest.

Conclusion

For us to witness & confirm this pattern on the price chart, three things are required. Two trend lines must come close to each other as the price action moves and within those two lines, and that’s primary. The second rule is that one-party must be losing its momentum while the other party must show the sign of coming back in the show. The third thing is that the breakout of either one line according to the circumstances is necessary.

To take a trade, we can enter the breakout, or we can wait for the price to retest the trend line. The stop-loss should be set above/below the second line, and the take-profit order must be placed at the higher timeframe’s resistance area. Identifying this pattern is easy compared to the other trading patterns out there. We must train our eyes to find this pattern visually on the price chart and look for the best entry, exit, and stop-loss areas. All the best!

Categories
Forex Assets

What Should You Know Before Trading The EUR/RON Forex pair

Introduction

The abbreviation of the Euro Area’s euro against the Romanian Leu is written as EUR/RON. This pair is classified as an exotic currency pair. The volume traded in this pair is pretty low. Here, the EUR is the base currency, and the EGP is the quote currency.

Understanding EUR/RON

The value of the EUR/RON determines the value of RON equivalent to one EUR. It is quoted as 1 EUR per X RON. For example, if the value of EUR/RON is 4.8512, then exactly 4.8512 RON is required to buy one Euro.

Spread

The difference between the bid and the ask price for that currency pair is referred to as the spread. The spread is different on ECN and STP accounts.

ECN: 75 pips | STP: 80 pips

Fees

The fee is simply the commission on the trade. One has to pay a few pips of fee on the trade for entering as well as exiting the trade. However, this is only on ECN accounts. On STP accounts, there is no fee.

Slippage

The slippage is the difference between the trader’s required price for execution and the price the broker actually gave the trader. There is this difference due to the volatility of the market and the broker’s execution speed.

Trading Range in EUR/RON

A Trading range is the illustration of the pip movement of a currency pair in different timeframes. The values are obtained from the average true indicator. The volatility values help us in determining the number of pips our trade can move in a given time frame.

Procedure to assess Pip Ranges

  1. Add the ATR indicator to your chart
  2. Set the period to 1
  3. Add a 200-period SMA to this indicator
  4. Shrink the chart so you can assess a large time period
  5. Select your desired timeframe
  6. Measure the floor level and set this value as the min
  7. Measure the level of the 200-period SMA and set this as the average
  8. Measure the peak levels and set this as Max.

EUR/RON Cost as a Percent of the Trading Range

With the volatilities values obtained above, we can even determine the variation in the cost of the trade. Below are the cost variation tables for ECN and STP accounts.

ECN Model Account

Spread = 75 | Slippage = 5 |Trading fee = 3

Total cost = Slippage + Spread + Trading Fee = 5 + 75 + 3 = 83

STP Model Account

Spread = 80 | Slippage = 5 | Trading fee = 0

Total cost = Slippage + Spread + Trading Fee = 5 + 80 + 0 = 85

Trading the EUR/RON

Which timeframe to trade?

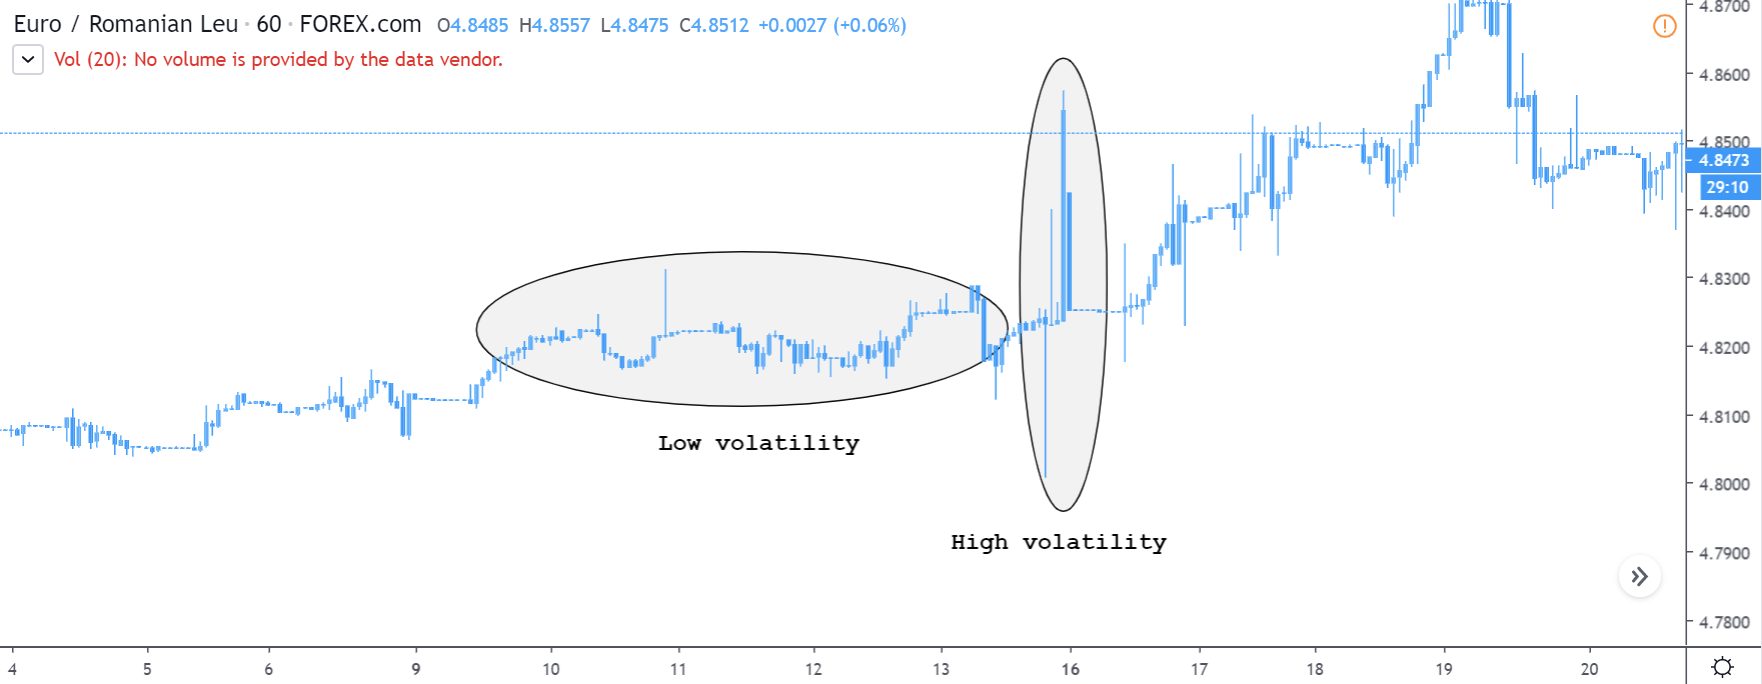
Consider the below chart on the 1H timeframe. We can clearly see that the volatility in this pair is very high. There is hardly any movement for a few hours, but a big spike up/down suddenly. And this type of movement is very risky for business. Hence, it is recommended to avoid trading smaller timeframes of this pair.

Nonetheless, considering the 1D chart of EUR/RON, we can see that the volatility is decent enough. Hence, this becomes a tradable timeframe for us. In fact, any timeframe above the daily can be traded efficiently.

How to manage costs?

In the trading cost table, we can see that the percentage values are large in the min column and small in the max column. This means that the costs are high for low volatilities and small for high volatilities. So, to have a balance between the volatility and costs, one may trade when the volatility is around average values.

Furthermore, trading through limit orders is another way to reduce costs. In doing so, the slippage on the trade will not be applied to the total costs.

Categories
Forex Basic Strategies

Trading The New York Breakout Forex Strategy

Introduction

Forex is a 24 hours market, and it is open five days a week. So there are a hell lot of opportunities this market offers to the traders across the world. However, to make more profits and be successful in this market, we don’t have to trade 24 hours on all the days it is open. On any given day, the Forex market shuts down in some continents and opens in some other continents. This leads to the opening and closing of different Forex sessions.

The two most essential sessions are the New York session and the London session. Most of the traders across the globe prefer trading the New York session because, in this session, instruments often have less spread. Also, the markets are quite volatile during this session, and prominent players prefer making most of the significant trades in this session only. In this article, let’s understand different trading techniques to catch the more notable moves that occur during the opening of the New York Session.

We will also be trading the Forex market when the New York session overlaps with the London session. At this point, the volatility will increase furthermore as it is an overlap of the two biggest Forex sessions. The idea is to trade in the direction of the larger players. For each country, the New York session opens at different times. For instance, if you are trading the Forex market from England, the US Session opens for you at around 13:00 GMT. Likewise, if you are trading the market from India, the US session begins at 18:30 IST.

If you are not sure of the exact time of the opening and closing of different trading sessions, you can follow the below link to accurately identify the opening and closing of the New York session according to your local time.

|Forex Time Zone Converter|

Breakout Trading Strategy

During the New York session, all the major, minor, & exotic currency pairs move very fast. Some traders believe that we must trade the currency pairs according to the corresponding session. For example, in the Asian session, we must trade only AUD, NZD, and JPY. In the London and Frankfurt session, we must only trade GBP, EUR, & CHF. Finally, in the New York session, go for USD and CAD currency pairs.

There might be a valid reason behind this, but this shouldn’t be taken seriously. Currency pairs do not move according to the session. Instead, they move according to market circumstances. So in the New York session, we can choose any pair, but we must follow the below rules in order to trade this session profitably.

  1. Before the opening of the New York session, find a currency pair that is in a strong uptrend.
  2. Price action must be held at the major resistance area.
  3. Wait for the breakout to happen in the New York Session.
  4. Let the price action hold above the breakout.
  5. Go long.
  6. Stop-loss below the breakout line.
  7. Take-profit must be at the next major resistance area.

The same is vice-versa for a currency pair if the market is in a strong downtrend.

Buy Example

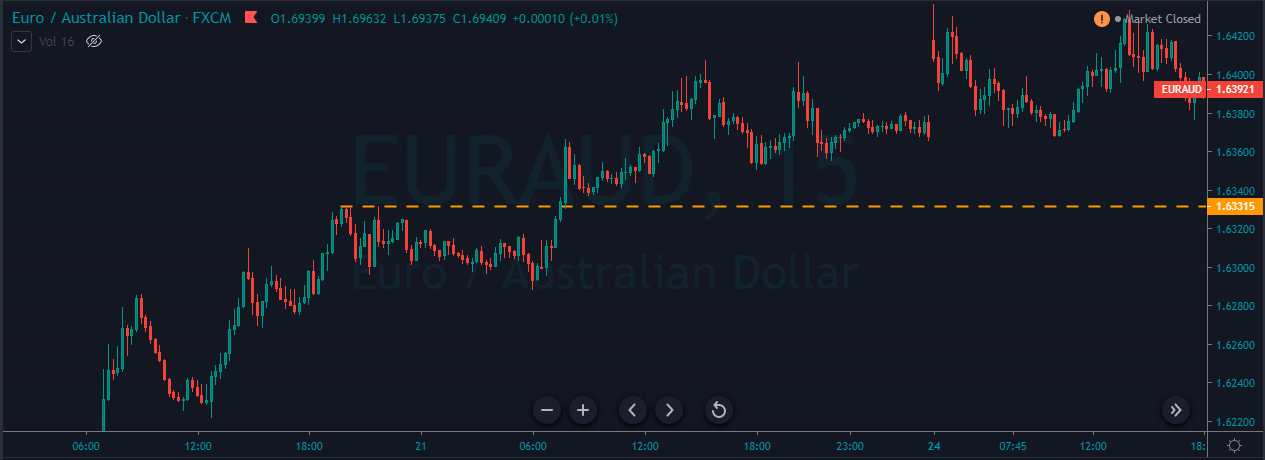
In the below image, we can clearly see that the EUR/AUD Forex pair is in a strong uptrend.

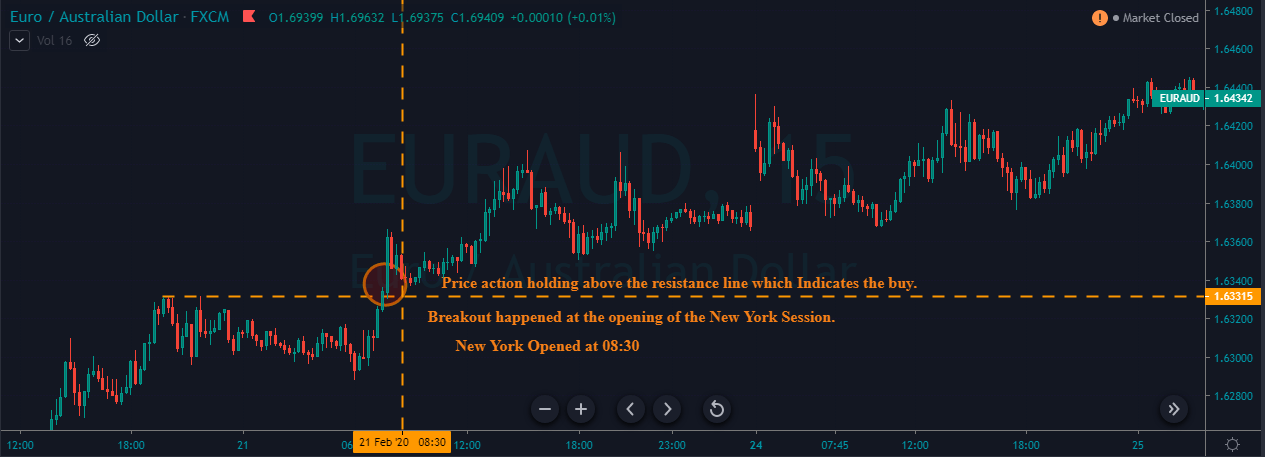
We can see the price breaking out at the opening of the US session. This indicates that the big players are ready to take over the market. The price action then holds above the breakout line, and this suggests that the breakout is real. Hence we can anticipate buy trades in this Forex pair.

Entry, Stop-loss & Take-profit

We have gone long in this pair as soon as the prices started to hold above the breakout line. The stop-loss is placed just below the support line. We can go for smaller stops when the price action respects the breakout line as it essentially indicates the opposite party giving up. Overall, it was swing trade, and we book the whole profit at the higher timeframe’s resistance area. This entire trade resulted in 150+ pip profit.

Most of the traders believe if they activate the trade in the New York session, they must close the trade in the New York session only no matter what. That’s just another myth. It is always advisable to milk the markets when there’s an opportunity to do so.

Breakout Trading Using Bollinger Bands

In this strategy, we are going to use the Bollinger Bands to trade the New York session. Bollinger Bands, as most of us know, is a quite popular indicator created by John Bollinger. This indicator consists of three lines, which are named as middle, upper, and lower band. These bands expand and contract according to market volatility. Most importantly, this indicator works very well in all types of market conditions.

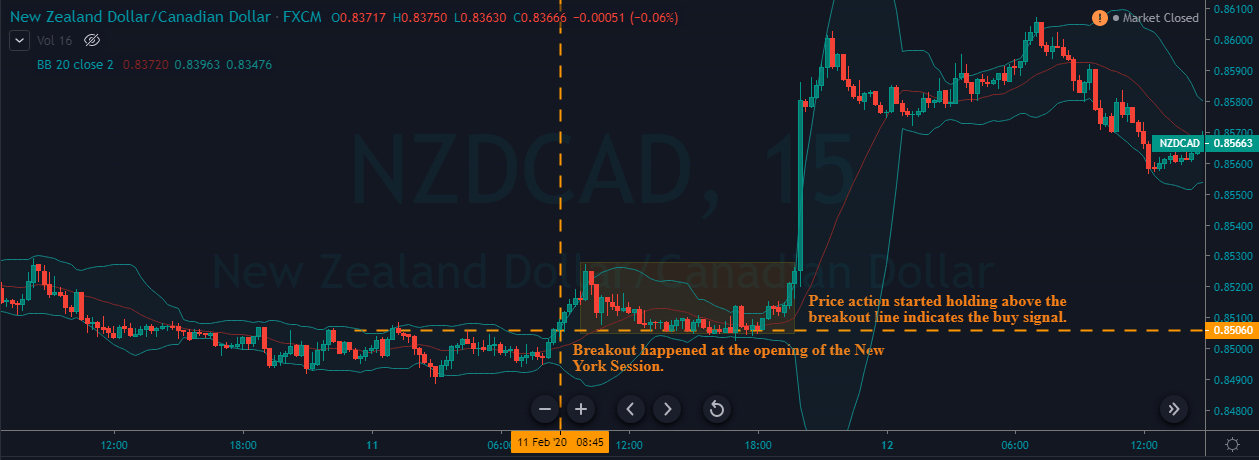
The below image represents the NZD/CAD Forex pair, which was in an overall uptrend. The price action breaks the major resistance level at the opening of the New York session on the 11th of February 2020. After the breakout, prices started to hold above the breakout line, which tells that the breakout is real, and any long trade anticipated from here will lead to a fruitful result.

Entry, Stop-loss & Take-profit

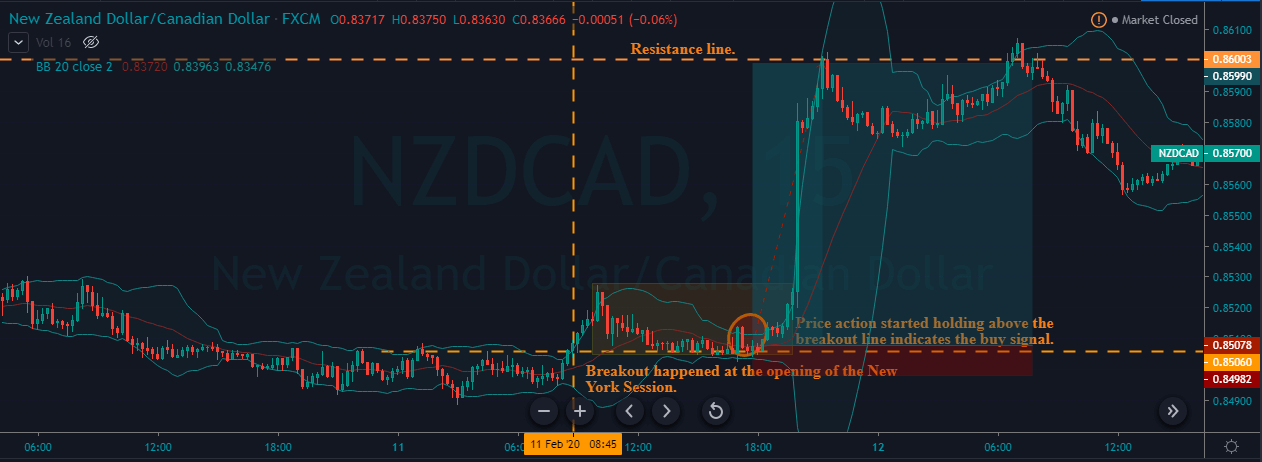
In the below image, you can see that we have taken a buy entry in the 2nd half of the New York session. Sometimes, the price action breaks the major S&R level in the morning, and it goes sideways for a while before blasting out in the evening. As professional technical traders, we must trust our analysis and be patient enough even when the market is not going in the anticipated direction. We must always let the price action to tell us what is going to happen next and act accordingly.

So right after the breakout, the momentum of sellers is very weak (can be seen in the above chart). So the stop-loss can be placed just below the breakout line. The take-profit was at the higher timeframe resistance area. At first, prices failed to break the resistance line, and during the second try, prices again failed to go higher. The failed second attempt is a clear indicator to close our winning position. Overall it was a good trade, which gave us nearly 90+ pips in just a couple of hours.

Conclusion

Both of the strategies mentioned above are simple and straightforward. Did you observe that in both of our examples, we didn’t choose USD pairs? Instead, we went for minor pairs, and both of the pairs performed really well in the New York session. This proves that it is not about the currency pair of that particular session. It is about what is happening in that pair. It is critical to follow all the rules first and then make a trading decision. It is always advisable to try these strategies on a Demo account and then use it in the live markets. Happy Trading.