Introduction
Often in life, taking the right action is the hardest decision to make. The same thing happens in trading as well. Most traders find it extremely difficult to buy at ‘bottom’ and sell at ‘top’ even though from a very early age, we are taught to look for value and buy “cheap.” That is why most traders who proclaim their love for trading with the trend fail to pick tops or bottoms.
While these types of ‘turn’ trades can be very profitable, they sometimes seem like tough tasks as the price can relentlessly trend in one direction, constantly stopping out the bottom and top pickers. Sometimes it is far easier and more comfortable to go with the flow. Yet, most traders are reluctant to buy breakouts for fear of being the last one to the party before prices reverse with a reprisal.
In today’s topic, we will solve the question of “how to trade breakouts confidently and successfully.” The Commodity Channel Index (CCI) Strategy is a setup designed to deal with just such a predicament.
Time Frame
One of the best parts of this strategy is that it works well on all time frames. That means we can use this strategy from very short time frames like 5-minutes to longer time frames such as the 4-hours or daily (D).
Indicators
In this strategy, we will use an indicator that is rarely used in forex. That is the Commodity Channel Index (CCI) indicator, devised by Donald Lambert in 1980 and originally designed to solve engineering problems. The primary focus of CCI is to measure the deviation of the currency pair’s price from its statistical average. As such, CCI is an extremely good measure of momentum that helps us to optimize only the highest probability entries for our setup.
Currency Pairs
This strategy applies to most of the currency pairs listed on the broker’s platform. We need to make that the pair we are choosing is fairly liquid.
Strategy Concept
The CCI is an unbounded oscillator with a reading of 100+ is typically considered to be overbought, and any reading of 100- indicates oversold. For this strategy, we will use these levels as our trigger points and change the CCI interpretation. We will look to buy the currency pair if it makes a new high above 100 and sell if it makes a new low below 100.
In this strategy, we are looking for new peaks or spikes that are likely to take the currency pair higher or lower due to its momentum. The thesis behind this setup is much like a body that will continue to remain in motion until it is hurtled by an external force or slowed down by counter forces. Similarly, new highs and lows in CCI will propel the currency in the further direction of the move until new prices halt the ongoing move.
Trade Setup
In order to illustrate the strategy, we have considered the EUR/JPY currency pair, where we will be applying the strategy on the 1-hour time frame chart.
Step 1
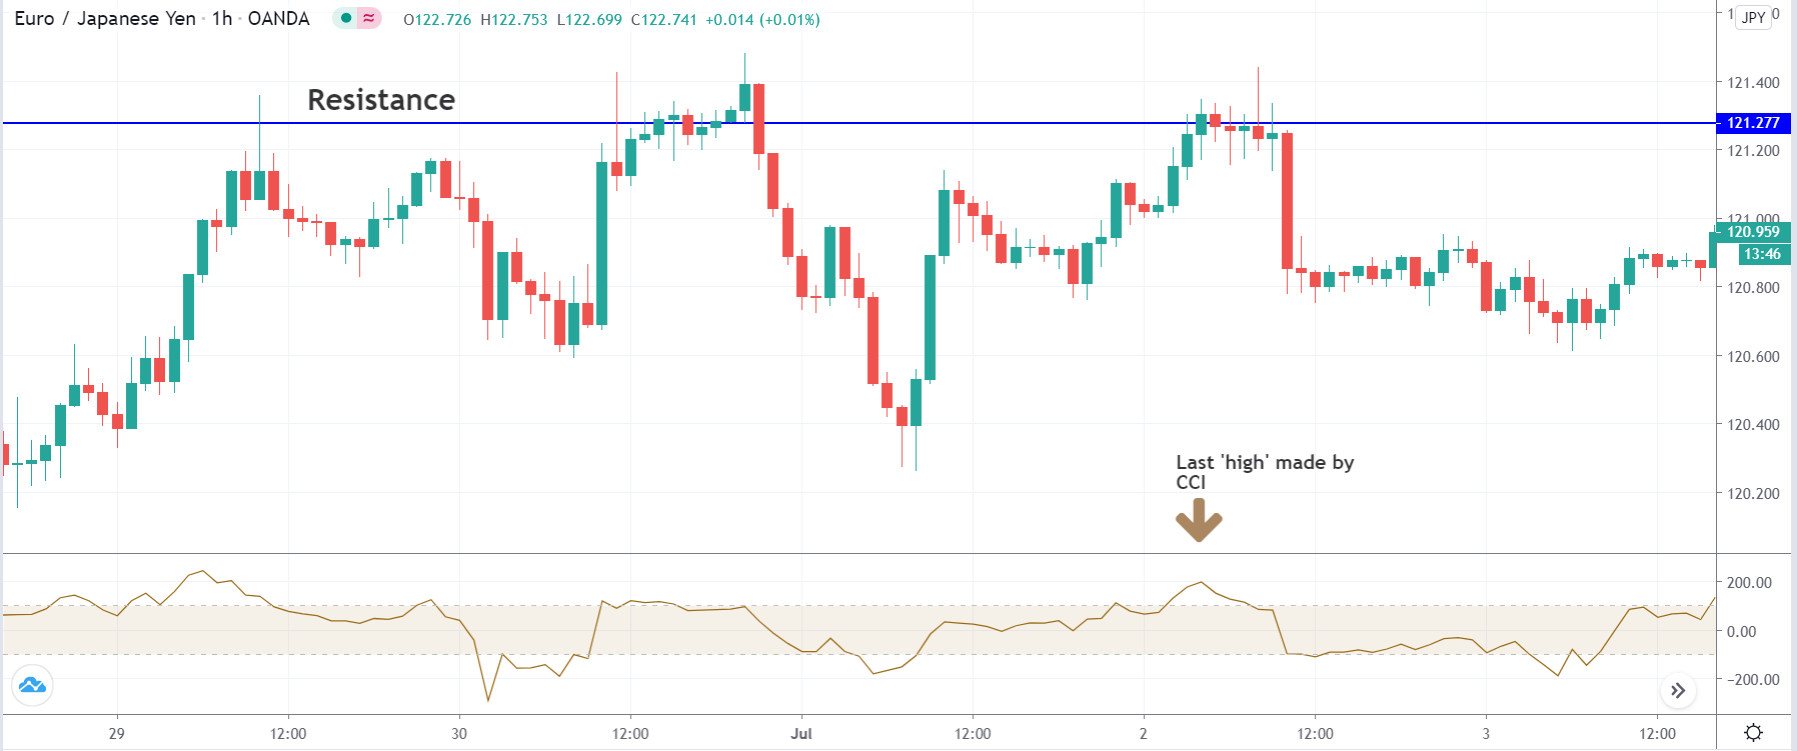
Firstly, open the chart of the desired currency pair and plot the Commodity Channel Index (CCI). Keep the input of the CCI index as 20. Then, mark key technical levels of support and resistance on the chart. For a ‘long’ trade, look for the last ‘high’ made by the CCI indicator and mark it out. That means its value should have crossed +100 during an upward price movement. Similarly, for a ‘short’ trade, look for the last ‘low’ made by the CCI indicator during the downward price movement.
In the below example, we have identified a ‘resistance’ and a ‘high’ that was made by the CCI indicator. Since the ‘high’ is more prominent on the chart, we will look for ‘long’ trades in the currency pair.
Step 2
This step is the most important part of the strategy. Here, we need to wait for the CCI indicator to market a new ‘high’ or new ‘low,’ which is higher than the previously identified ‘high’ or ‘low.’ This indicates a build-up of momentum in the market with the high chance that the market will continue moving strongly in the same direction. In the next step, we will see how to take an ‘entry’ after carrying the previous steps.
In the below image, we can see that the CCI index makes a new ‘high’ at the appearance of a bullish candle. At this moment, the price is exactly at resistance, which means we need to ‘sell’ from here. This is where the strategy comes into the picture.
Step 3
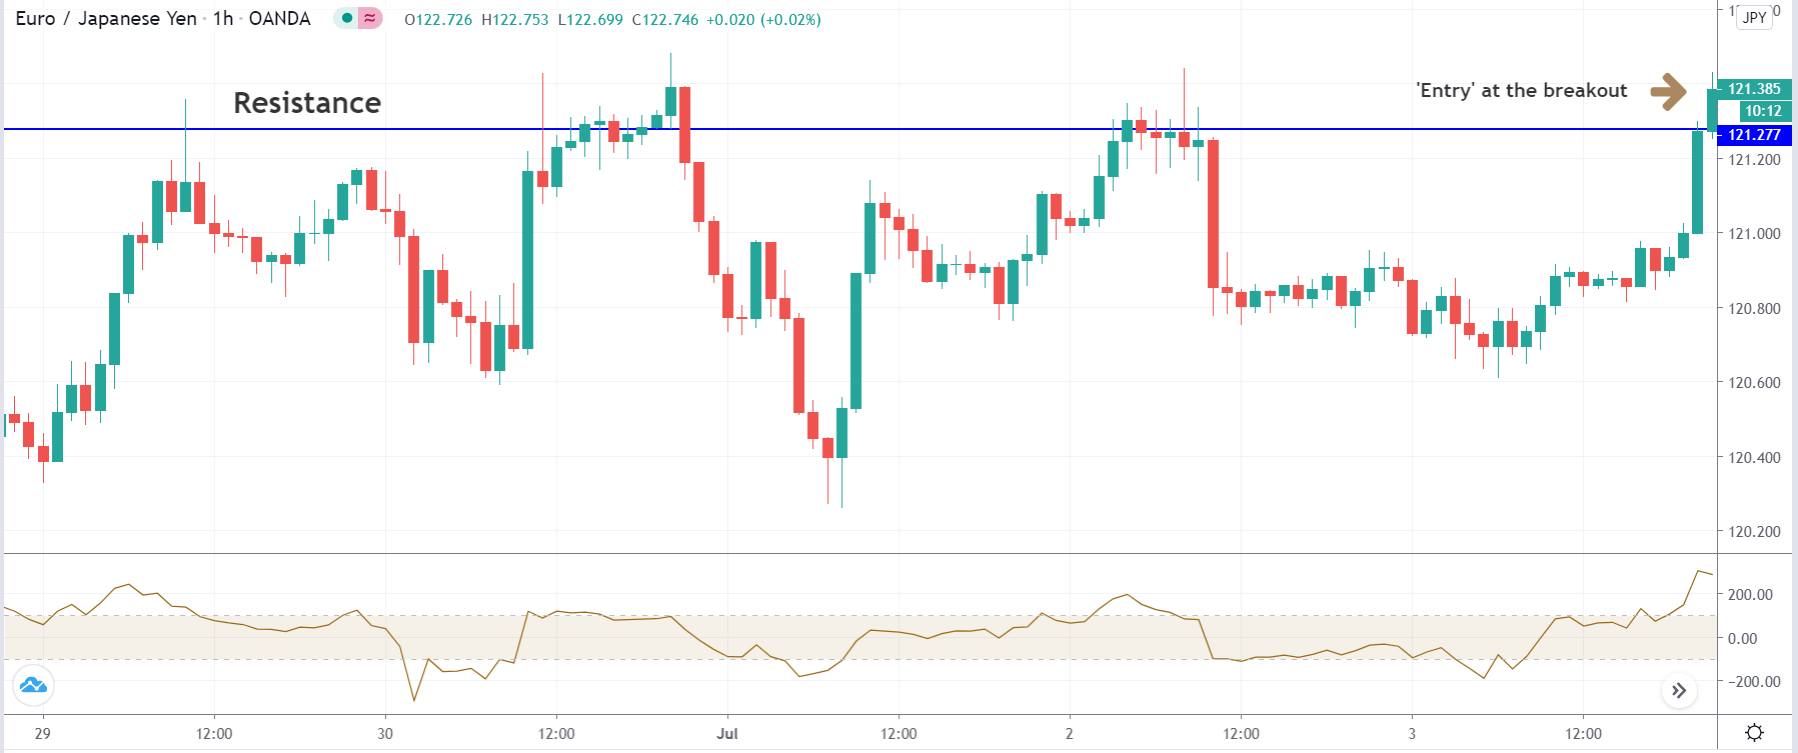
Once the market starts moving in our favor by about five pips, we enter with the appropriate position size. This is an aggressive form of ‘entry’ where we take advantage of the existing momentum. A conservative ‘entry’ would be to wait for a price retracement and enter after receiving a confirmation from the market.
In our example, we are taking an aggressive entry, i.e., at the breakout of the resistance. All traders who will be selling here thinking it as resistance would get trapped. This is the application of the CCI indicator.
Step 4
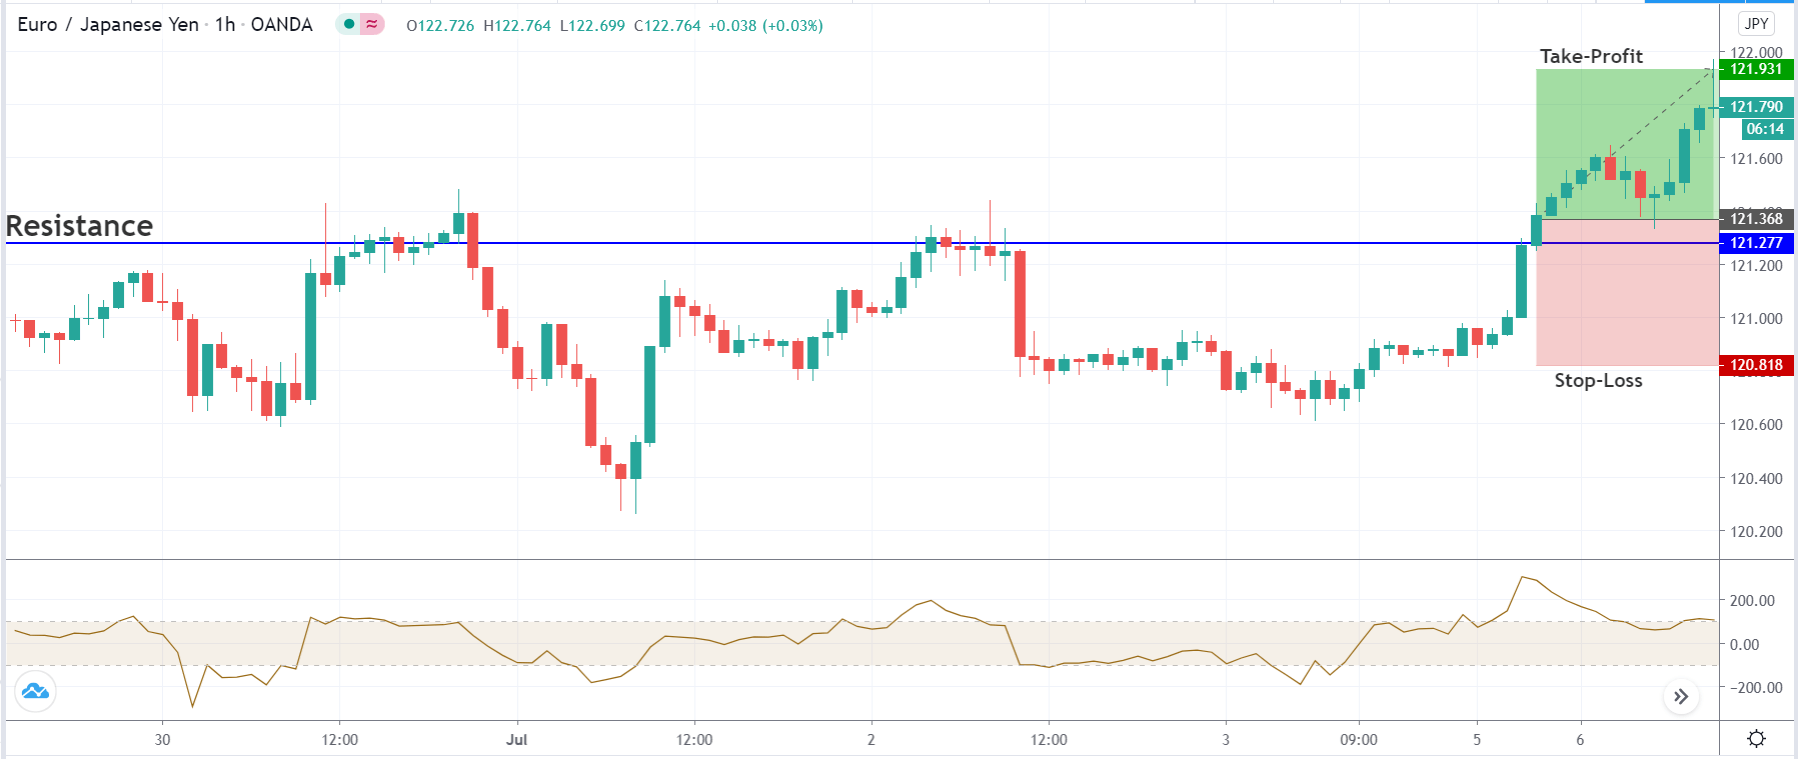
In this step, we determine the stop-loss and take-profit for the strategy. Stop-loss is placed below the previous ‘low’ in case of a ‘buy’ and above the previous ‘high’ for a ‘sell’ trade. If the ‘high’ or ‘low’ is too far away, it could reduce the risk to reward ratio. In such cases, the stop-loss can be placed 20-25 pips from the entry point. The ‘take-profit’ is set at 1:1 risk to reward.
Strategy Roundup
If the rules are strictly followed, we may not experience any serious drawdown as we are trading based on market momentum. The key is a high probability, and this is exactly what the ‘CCI strategy’ provides. This strategy exploits the application of the CCI indicator, which is highly underrated in the forex market.


