Categories
Forex Basic Strategies

Heard Of The CCI (Commodity Channel Index) Trading Strategy?

Introduction

Often in life, taking the right action is the hardest decision to make. The same thing happens in trading as well. Most traders find it extremely difficult to buy at ‘bottom’ and sell at ‘top’ even though from a very early age, we are taught to look for value and buy “cheap.” That is why most traders who proclaim their love for trading with the trend fail to pick tops or bottoms.

While these types of ‘turn’ trades can be very profitable, they sometimes seem like tough tasks as the price can relentlessly trend in one direction, constantly stopping out the bottom and top pickers. Sometimes it is far easier and more comfortable to go with the flow. Yet, most traders are reluctant to buy breakouts for fear of being the last one to the party before prices reverse with a reprisal.

In today’s topic, we will solve the question of “how to trade breakouts confidently and successfully.” The Commodity Channel Index (CCI) Strategy is a setup designed to deal with just such a predicament.

Time Frame

One of the best parts of this strategy is that it works well on all time frames. That means we can use this strategy from very short time frames like 5-minutes to longer time frames such as the 4-hours or daily (D).

Indicators

In this strategy, we will use an indicator that is rarely used in forex. That is the Commodity Channel Index (CCI) indicator, devised by Donald Lambert in 1980 and originally designed to solve engineering problems. The primary focus of CCI is to measure the deviation of the currency pair’s price from its statistical average. As such, CCI is an extremely good measure of momentum that helps us to optimize only the highest probability entries for our setup.

Currency Pairs

This strategy applies to most of the currency pairs listed on the broker’s platform. We need to make that the pair we are choosing is fairly liquid.

Strategy Concept

The CCI is an unbounded oscillator with a reading of 100+ is typically considered to be overbought, and any reading of 100- indicates oversold. For this strategy, we will use these levels as our trigger points and change the CCI interpretation. We will look to buy the currency pair if it makes a new high above 100 and sell if it makes a new low below 100.

In this strategy, we are looking for new peaks or spikes that are likely to take the currency pair higher or lower due to its momentum. The thesis behind this setup is much like a body that will continue to remain in motion until it is hurtled by an external force or slowed down by counter forces. Similarly, new highs and lows in CCI will propel the currency in the further direction of the move until new prices halt the ongoing move.

Trade Setup

In order to illustrate the strategy, we have considered the EUR/JPY currency pair, where we will be applying the strategy on the 1-hour time frame chart.

Step 1

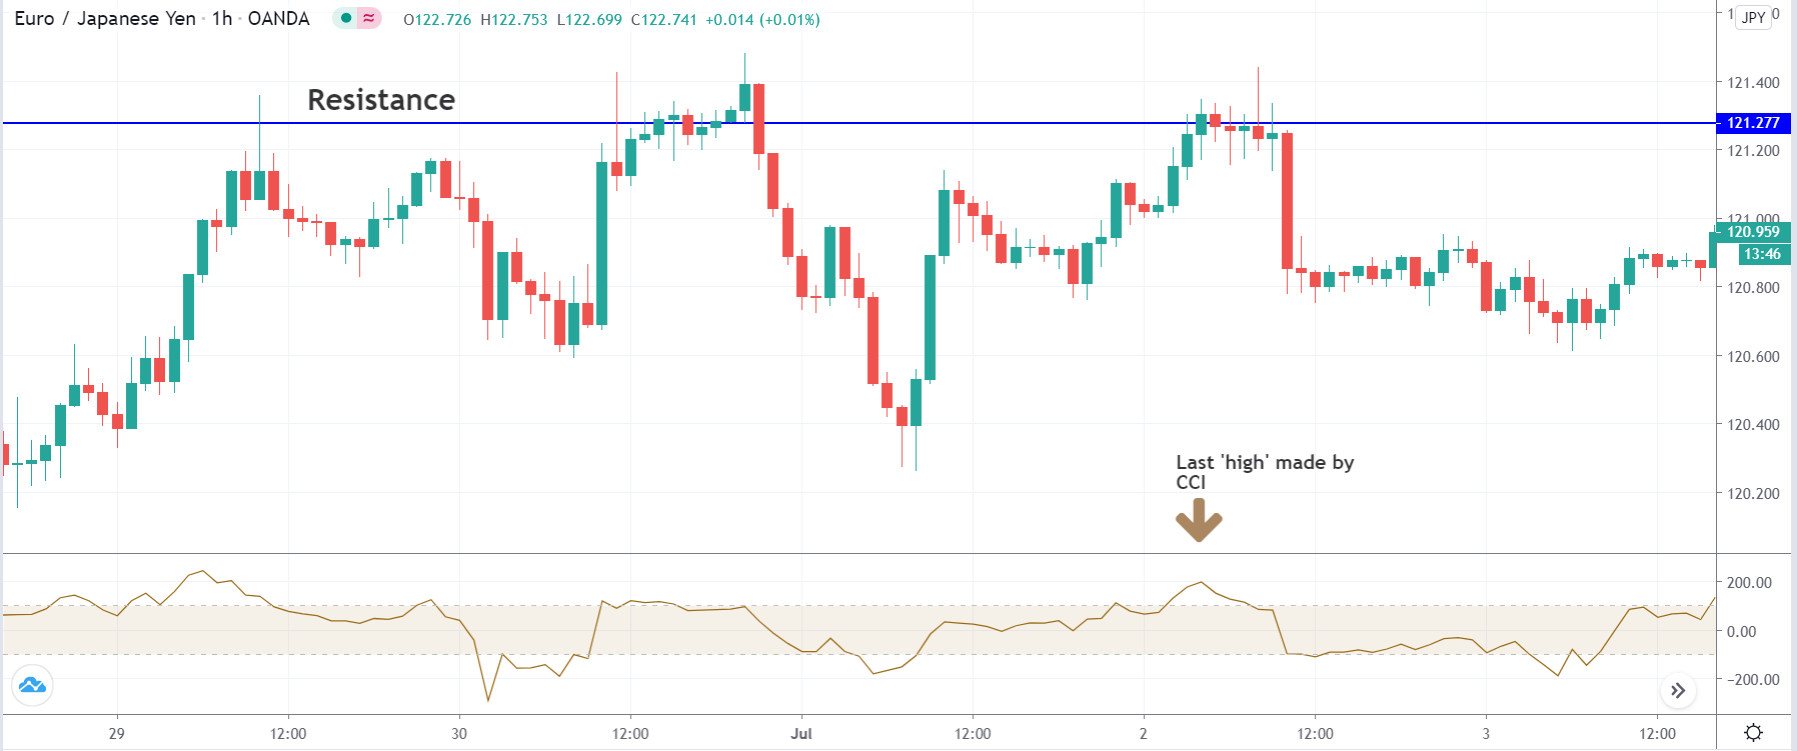
Firstly, open the chart of the desired currency pair and plot the Commodity Channel Index (CCI). Keep the input of the CCI index as 20. Then, mark key technical levels of support and resistance on the chart. For a ‘long’ trade, look for the last ‘high’ made by the CCI indicator and mark it out. That means its value should have crossed +100 during an upward price movement. Similarly, for a ‘short’ trade, look for the last ‘low’ made by the CCI indicator during the downward price movement.

In the below example, we have identified a ‘resistance’ and a ‘high’ that was made by the CCI indicator. Since the ‘high’ is more prominent on the chart, we will look for ‘long’ trades in the currency pair.

Step 2

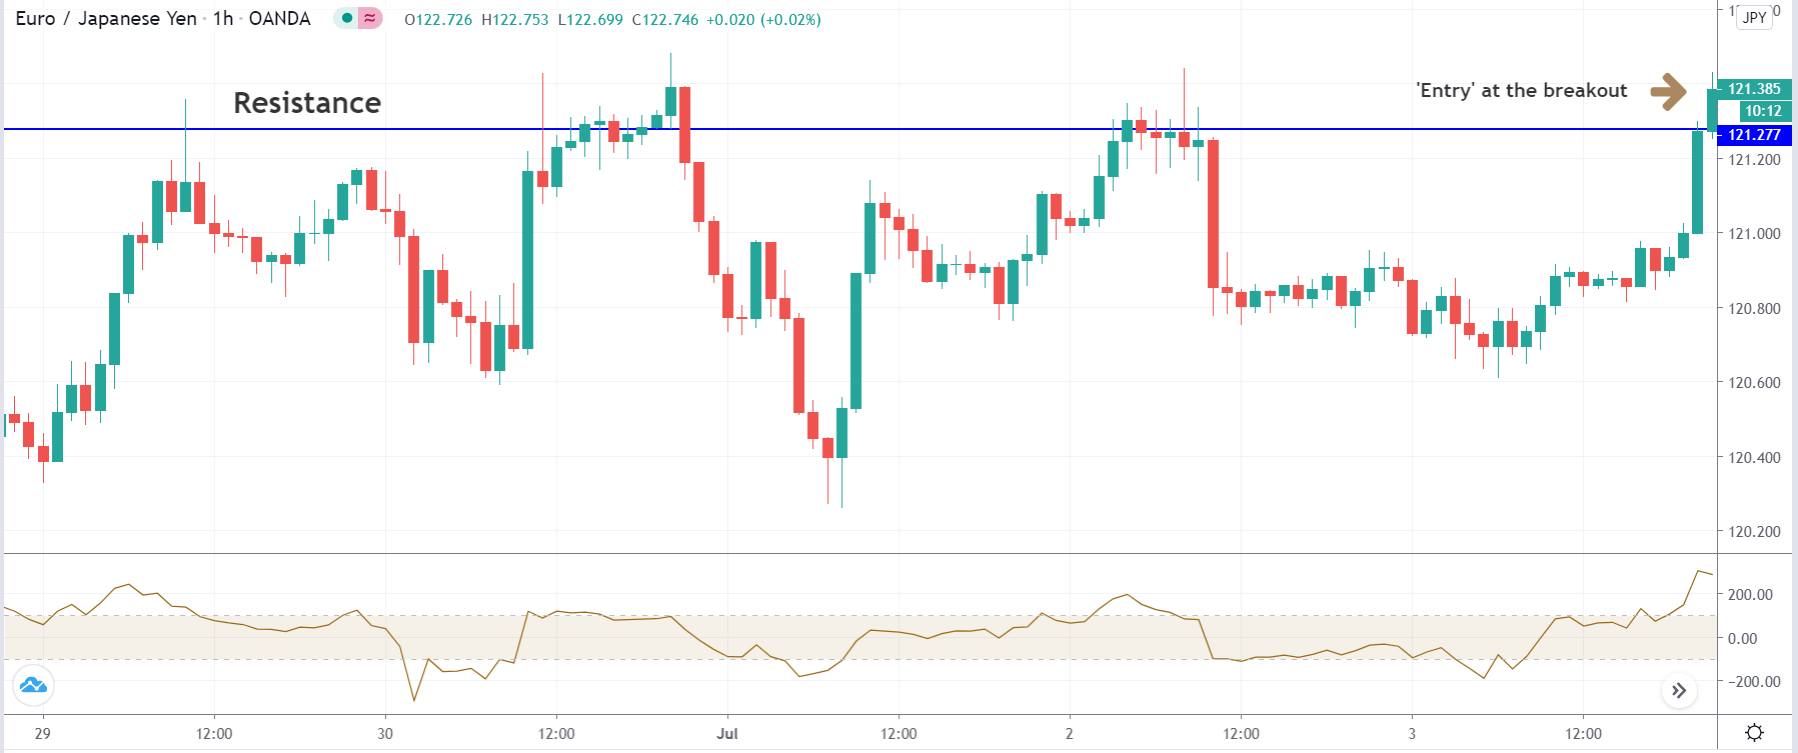
This step is the most important part of the strategy. Here, we need to wait for the CCI indicator to market a new ‘high’ or new ‘low,’ which is higher than the previously identified ‘high’ or ‘low.’ This indicates a build-up of momentum in the market with the high chance that the market will continue moving strongly in the same direction. In the next step, we will see how to take an ‘entry’ after carrying the previous steps.

In the below image, we can see that the CCI index makes a new ‘high’ at the appearance of a bullish candle. At this moment, the price is exactly at resistance, which means we need to ‘sell’ from here. This is where the strategy comes into the picture.

Step 3

Once the market starts moving in our favor by about five pips, we enter with the appropriate position size. This is an aggressive form of ‘entry’ where we take advantage of the existing momentum. A conservative ‘entry’ would be to wait for a price retracement and enter after receiving a confirmation from the market.

In our example, we are taking an aggressive entry, i.e., at the breakout of the resistance. All traders who will be selling here thinking it as resistance would get trapped. This is the application of the CCI indicator.

Step 4

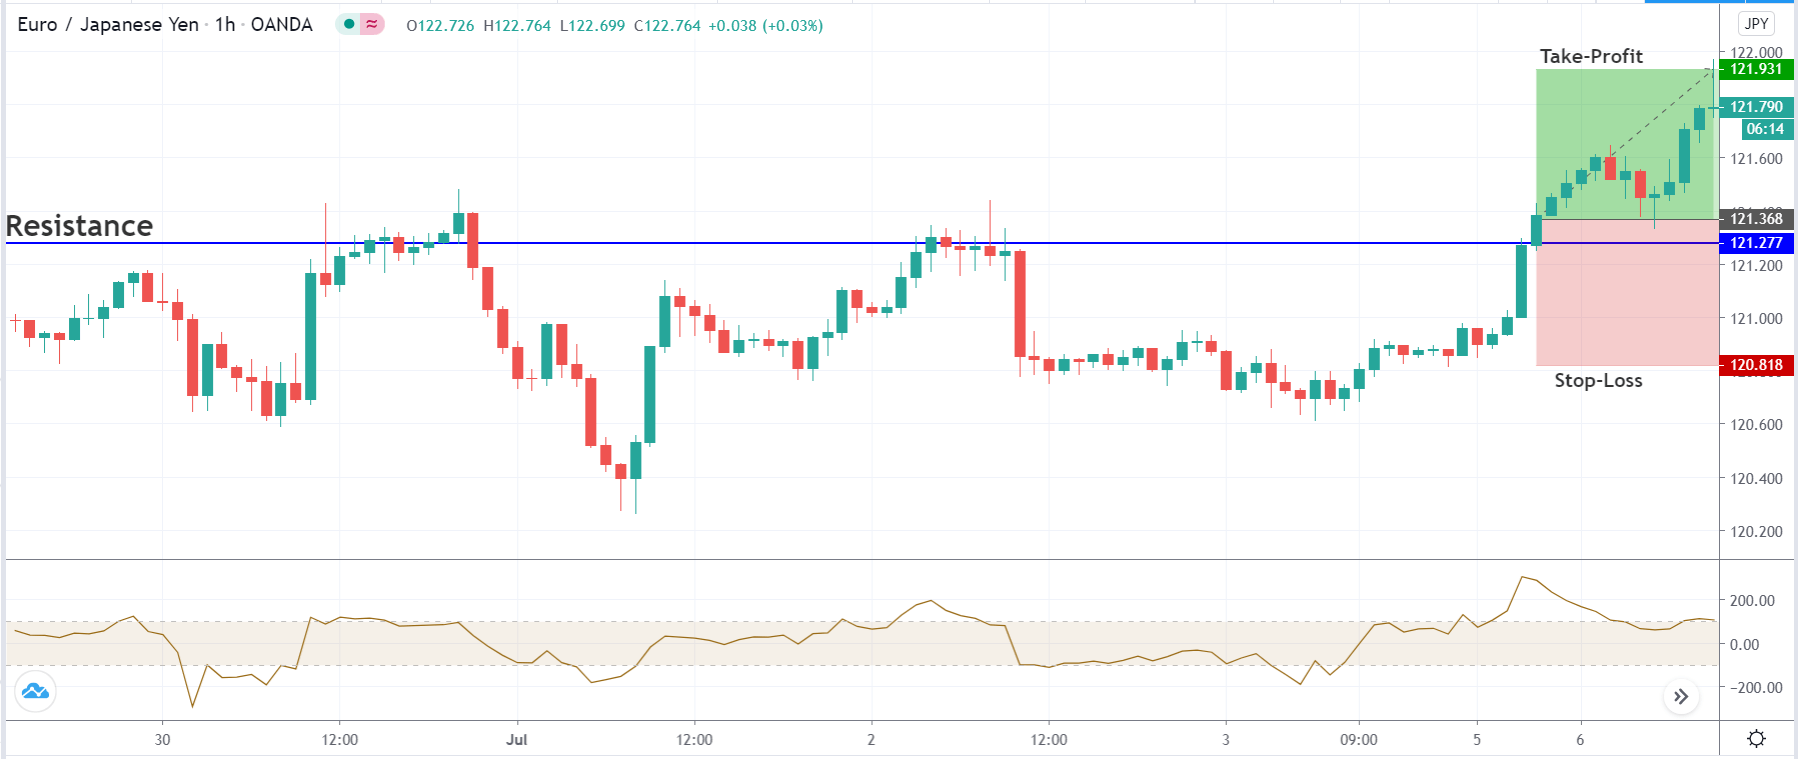
In this step, we determine the stop-loss and take-profit for the strategy. Stop-loss is placed below the previous ‘low’ in case of a ‘buy’ and above the previous ‘high’ for a ‘sell’ trade. If the ‘high’ or ‘low’ is too far away, it could reduce the risk to reward ratio. In such cases, the stop-loss can be placed 20-25 pips from the entry point. The ‘take-profit’ is set at 1:1 risk to reward.

Strategy Roundup  

If the rules are strictly followed, we may not experience any serious drawdown as we are trading based on market momentum. The key is a high probability, and this is exactly what the ‘CCI strategy’ provides. This strategy exploits the application of the CCI indicator, which is highly underrated in the forex market.

Categories
Forex Videos

Fundamental Analysis For Novices – Consumer Confidence


Fundamental Analysis For Novices – Consumer Confidence

Thank you for joining the fundamental analysis for novices’ educational video. This time we will be reviewing consumer confidence.
Hopefully, you will be reviewing all the fundamental analysis for novices videos in the series is comprehensive, and we fully recommend that you work through each educational video.


As a trader, it is imperative that you regularly refer to an economic calendar, such as this one, which is provided by most brokers. Consider this to be your Bible. Use it as a tool to plan your trades, and most importantly, use it as a facility to tell you when to trade and, more importantly, not to trade, especially at times of release of very important and potentially highly volatile producing economic data releases.


The key information that you need to take particular attention to is the time of the event, the economic event itself, the day and date, the impact level, which typically comes as low, medium, and high, the actual economic data release as listed at the time of the event, which is usually subject to an Embargo, and before this pay particular attention to the general consensus of what the actual figure might be. This is put together by leading economists and market analysis. Also, pay attention to the previous release of this data.

So what is Consumer Confidence?

The consumer confidence index, or CCI, is an economic barometer that tells the story via the consumer. This measure is how optimistic or pessimistic consumers are regarding their financial circumstances. If consumers are optimistic, they tend to spend more money, and if they are pessimistic, they tend to save more. If consumers aren’t spending, economies are failing, and if consumers are spending, it usually follows that economies are doing well.
The CCI is conducted by Nielson Inc. as a survey of over 5000 households within the United States, as an example, and is administered by the US conference board on the last Tuesday of every month. Households are asked five questions, 1: their view of the current business conditions, 2: their view of current employees conditions, 3: their expectations regarding business conditions in the next six months, 4: their expectations regarding employment conditions for the next six months and 5: their expectations regarding total family income for the next six months.
Financial markets look towards this barometer with regard to the varying degrees of the fluctuations up and down.


On Wednesday the 10th of June at 1:30 AM BST, Australia released its consumer confidence data for the month of June, which was considered to be a medium level of impact and which came out at 6.3%. No consensus was offered, and the previous figure was 16.4%. Straight away, we noticed that the actual figure is lower than the previous figure, and we will explore this further on in the video.
In Australia, the CCI is produced by the Melbourne Institute and published by the Westpac Banking Group. Countries vary slightly with regard to the questions asked of households. In Australia for example 1200

Australian adults asked their opinions on the household financial situation currently, compared to 12 months ago, their expected household financial situation for the coming year, their anticipated economic conditions over the coming year, their anticipated economic conditions over the next five years, and their buying conditions for major household items.
However, essentially the results are treated almost identically on a country-by-country basis.


Upon the release of the data, traders look for the actual figure, and in this case, it comes in lower than the previous, which suggests that consumer confidence is lower during the month of June and below the figure released for May.
Potentially this means consumers are spending less, and this is therefore bad for the Australian economy, and we might expect a weakening of the Australian dollar against its counterparts. This is referred to as bearish.
Had the figure been higher than 16.4% for May, the reverse would have been true and would have shown the economy growing, with consumers more confident and potentially spending more money, and this would have been good for the Australian dollar against its counterparts. This is referred to as bullish.

Categories
Forex Fundamental Analysis

‘Consumer Confidence’ & The Impact Of Its News Release On The Forex Price Charts

Introduction

Changes in Consumer Confidence drives macroeconomic indicators like Consumer Spending, which is a significant driver for Gross Domestic Product. Understanding what Consumer Confidence Surveys mean and imply are essential for predicting current and upcoming economic conditions. When understood properly, Consumer Sentiment can give us a hint regarding the direction of economic activity as an advanced or leading indicator.

What is Consumer Confidence?

The Consumer Confidence Statistics reflects the outlook of consumers on the future economic conditions and their financial status. The uniqueness of this indicator lies in the fact that this is a very subjective indicator and may be biased to some extent as it depends largely on the people’s opinion. Two people having the same current job and financial status may give a different outlook on it, but since the scope of the survey is broad, it irons out such exceptions and inconsistencies.

Consumer Confidence reflects how positive or negative people are feeling towards their future in the context of financial security, income, and employment. It is essentially a measure of the Consumer Sentiment in economic and monetary terms.

The numbers shown by Consumer Confidence surveys are not some monetary numbers derived from calculations, but instead, they are opinions rated on a scale in a numeric form similar to how we give a rating to movies on corresponding websites with stars or a ranking from 0-10.

How is Consumer Confidence scaled and assessed?

There are two major survey reports which show Consumer Confidence:

Consumer Confidence Index

It is released monthly by the Conference Board and reflects the general public’s expectations about their economic prospects for the next six months. The Conference Board expertise in these types of surveys (watching Consumer Spending and Buying habits) and take into account a plethora of data and survey information into account (about 5000 households) for their indices. Hence, it is considered a very reliable indicator by many.

Consumer Confidence Index is composed of the Present Situation Index, intended to be a coincident or current economic indicator, and the Expectations Index, expected to indicate future financial health.

Consumer Sentiment Index

The University of Michigan releases a preliminary report on the second Friday and a final report on the fourth Friday of every month. Their Consumer Research center conducts a telephonic survey asking 500 consumers a series of questions on personal finances and their opinions on business conditions. Two components, namely, Expectations Index and Current Conditions Index, make up the questions of Consumer Sentiment Survey.

Is Consumer Confidence necessary for our analysis?

The idea behind Consumer Confidence Surveys is that when consumers are confident of their economic prospects, they will spend more on personal expenses beyond the basic needs. For instance, when you assuredly receive 100$ daily, and the necessary daily requirements are taken care of with 50$. Naturally, we will spend the remaining 50$ for personal enjoyment as the next 50$ take care of tomorrow’s primary needs. In another case, if we were to receive the same 100$ on alternate days, then that money goes only for basic requirements, which cuts off the personal enjoyment expenditure.

Consumer Confidence drives Consumer Spending, which is more than a two-third component of GDP. Consumer Spending is the maker of GDP, and Consumer Confidence is a prime component of Consumer Spending.

How can Consumer Confidence be Used for Analysis?

The University of Michigan’s Consumer Sentiment Index historical data goes back to 1978, which is pretty decent for an economic indicator. Historically it has shown an excellent 85% correlation with the GDP growth rate, and this is a remarkable percentage to rely on these survey indices as leading indicators for the economy’s direction.

A low Consumer Confidence Index is a danger sign showing what is the probable economic crisis ahead in extreme cases. Weak confidence indicates there is a threat to the economy, and a contraction is on its way. Central Authorities may also use this to take corrective measures to change this. On the contrary, A healthy Consumer Confidence Index signals an economic expansion on its way, which stimulates growth and improves the standard of living of the citizens. Consumer Confidence can also be used by businesses to identify recessionary periods and take appropriate steps to minimize their risk and adapt accordingly.

Traders and Investors will always benefit the most from the leading or advanced indicators in comparison to coincident or lagging indicators. With such strong confidence leading indicators, we can significantly reduce our risk on financial investments and come out of trades before the danger signals manifest in the economy or go into the market and ride the economic growth ahead of others.

Sources of Consumer Confidence Indices

The Conference Board, which is a not-for-profit organization, has excellent data analysis for Consumer Confidence Indices. We can go through their surveying methodologies, historical records, samples on their official website. A sample issue of Consumer Confidence Survey pdf file can be found here.

The Michigan Consumer Sentiment Index numbers and corresponding data can be found here. The same is available on the St. Louis FRED website, where we can perform graphical analysis and plot against GDP rates for better understanding.

Impact of the Consumer Confidence news release on the price charts 

After understanding the Consumer Confidence economic indicator, we will now extend our discussion and analyze the impact of the same on the currency. It is a leading indicator that measures the overall economic activity. The reading is compiled after carrying out a survey of about 5000 consumers, which asks them to evaluate future economic prospects. When respondents give high ratings, it shows consumer optimism. Consumer Confidence data does not have a major effect on the monetary policy and the decision of policy-makers. Hence it does not cause severe volatility in the currency pair.

For illustrating the impact, we have considered the Consumer Confidence data of Europe, which is published by the European Commission. The below figure shows the previous, forecasted, and actual Consumer Confidence data in the Euro Zone, which was collected for the month of March. It shows that there was a decrease in the value from the previous month but higher than what was expected. A higher than expected reading is believed to be positive for the currency while a lower than expected reading is considered to be negative.

EUR/AUD | Before The Announcement

We begin our analysis with EUR/AUD, where the above chart shows the state of the currency pair before the news announcement. We see that the market is moving in a range and currently is at the bottom of the range. Since the impact of the news release is less, we need to rely more on technical analysis and trade based on technical indicators, rather than on the outcome of the news. Technically we are at the bottom of the range, so positive Consumer Confidence data is the ideal case for going ‘long’ in the currency pair.   

EUR/AUD | After The Announcement

After the Consumer Confidence data is released, volatility in the market increases on both sides, and the candle closes, forming a ‘Doji’ pattern. The reason behind this indecision is that the Consumer Confidence numbers were better than before but lesser than the forecasted numbers. Some traders took this to be positive, while some felt the numbers were not too great. From the trading point of view, since the market does not break the ‘support’ area, one can enter for a ‘buy’ with a ‘take-profit’ near the ‘resistance’ area.

EUR/JPY | Before The Announcement


EUR/JPY | After The Announcement

The above images represent the EUR/JPY currency pair, and the characteristics of this pair appear to be very different from that of the above-discussed pair. Before the announcement, the market is in a strong uptrend and currently at a point from where the market had reversed earlier. As the market is at a critical point, it is better to wait for the Consumer Confidence data and then trade based on the change in volatility.

After the news release, the price initially goes up but later gets sold into and closes in red. We need to note here that even though the market reaction was bearish, the price did not break the moving average. Instead, volatility increases on the upside and results in a continuation of the trend. One can trade the above pair after price retracement to an appropriate Fibonacci level and then taking a ‘buy.’

EUR/NZD | Before The Announcement 

EUR/NZD | After The Announcement

Now we shall discuss the impact of Consumer Confidence data on EUR/NZD currency pair. The behavior of the chart is similar to that of the EUR/AUD pair where here also the price is moving within a range, and recently the price has broken below the range. Since the selling pressure has increased, it can be risky to go ‘long’ in the market, even if the data proves to be positive for the economy.

After the news release, the market moves higher as a consequence of positive Consumer Confidence data, and the price closes, forming a bullish candle. As mentioned earlier, going ‘long’ can be risky due to the increased selling pressure, and thus conservative traders should not take such trades. Another reason why the up move might not be sustainable is that the impact of Consumer Confidence data on currency is not as much.

That’s about Consumer Confidence and its impact on the Forex Market. Let us know if you have any questions in the comments below. Cheers.