Categories
Forex Market Analysis

Daily F.X. Analysis, September 28 – Top Trade Setups In Forex – ECB President Lagarde Speaks

The Asian session has exhibited thin trading volume and volatility amid Chinese banks will be closed in observance of the Mid-Autumn Festival. However, the eyes will remain on the ECB President Lagarde Speak later during the European session.

Economic Events to Watch Today  


EUR/USD – Daily Analysis

The EUR/USD pair was closed at 1.16299 after placing a high of 1.16848 and a low of 1.16120. Overall the movement of the EUR/USD pair remained bearish throughout the day. The pair dropped to its 2-months lowest level below 1.16200 level on Friday as the risk-sentiment was dropped in the market, and the U.S. dollar gained renewed strength. The strength of the greenback was the main driver of the EUR/USD pair on Friday.

The greenback posted the biggest weekly gain on Friday since March and rose to 2-months high level after the safe-haven momentum rose amid the weak economic data. The safe-haven appeal was also supported by the ongoing worries about the economic fallout from a delayed U.S. stimulus measure.

On Friday, the U.S. Dollar Index rose to its 2-months highest level above 96.6 level and weighed heavily on the EUR/USD pair. The M3 Money Supply from the E.U. dropped to 9.5% from the projected 10.0% at 13:00 GMT on the data front. Private Loans from the European Union remained flat with expectations of 3.0%. The depressing data from the E.U. added further losses in the EUR/USD pair.

From the U.S. side, the Core Durable Goods Orders in August dropped to 0.4% against the projected 1.0%, and the Durable Goods Orders also declined to 0.4% from the anticipated 1.1% and weighed on the greenback. The declining goods orders raised concerns for the economic recovery and raised the safe-haven appeal that ultimately supported the greenback. The strong U.S. dollar added further in the downward momentum of the EUR/USD pair. On the coronavirus front, the second wave of the pandemic in Europe was hitting the European countries hard as the number of coronavirus infections increased day by day. The daily count of infected people rose to an all-time high in France and the U.K. on Thursday. 

France recorded 16,096 new cases in a single day, and the U.K. reported 6634 cases in 24 hours. Meanwhile, other countries also saw the highest number of infected cases since the pandemic started earlier this year. 

The European Union health commissioner said that coronavirus’s situation was even worse in some member states than during the peak in March, and this weighed heavily on the local currency Euro. The declining Euro currency supported the downward momentum of the EUR/USD pair on Friday.

The rising safe-haven market sentiment kept the EUR/USD pair under heavy pressure due to its riskier nature. The U.S. dollar regained its safe-haven status and was further supported by the uncertainty in the market related to the rising number of coronavirus cases and the rising tensions between the U.S. & China that could also lead to a new cold war. The strength of the greenback kept the pair EUR/USD under pressure throughout the whole week.

Daily Technical Levels

Support Resistance

1.1636       1.1698

1.1600       1.1724

1.1573       1.1760

Pivot point: 1.1662

EUR/USD– Trading Tip

The bearish bias of the EUR/USD continues to dominate the market as it’s providing selling bias at 1.1650. Staying below 1.1650 level can extend the selling trend until 1.1590 level while resistance stays at the 1.1680 level today. A bullish breakout of the 1.1686 level can drive the buying trend until the 1.1760 level. Mixed bias prevails in the market today. The ECB President Lagarde Speech will remain in highlights today.


GBP/USD – Daily Analysis

The GBP/USD currency pair extended its early-day bullish bias and took some further bids around well above the mid-1.2750 level despite the U.K. preparing to impose a total social lockdown across much of Northern Britain and potentially London. However, the reason for the bullish trend in the currency pair could be associated with the bearish sentiment surrounding the broad-based U.S. dollar ahead of the U.S. presidential debate on Tuesday and the release of U.S. economic data. 

Adding to the U.S. dollar’s problem could also be the market risk-on sentiment, which tends to undermine the safe-haven U.S. dollar and contributed to the currency pair gains. Apart from this, the bullish tone around the currency pair was further bolstered by the latest positive report suggesting brighter odds of success for the key Brexit talks. On the contrary, the latest fears of strict lockdown conditions in the U.K. hampering global economic growth seem to challenge the currency pair bulls and become the key factor that kept the lid on any additional currency gains pair. At this particular time, the GBP/USD currency pair is currently trading at 1.2776 and consolidating in the range between 1.2752 – 1.2778. Moving on, the currency pair traders seem cautious to place any strong position ahead of the U.S. presidential debate on Tuesday and the release of U.S. economic data later in the week.

The market trading sentiment rather unaffected by the fears of rising COVID-19 cases in the UK, Spain, and some of the notable Asian nations like India, which keeps fueling worries that the economic recovery could be halt. However, the market trading sentiment has been reporting gains since the Asian session started, possibly due to the latest headlines suggesting a strong immune response to the coronavirus vaccine with a single dose in the early trial stages. Besides this, the market sentiment was further bolstered by the hopes of the U.S. stimulus to combat the coronavirus (COVID-19). Apart from this, the Brexit optimism also exerted a positive impact on market sentiment. 

This, in turn, the broad-based U.S. dollar failed to gain any positive traction and edged lower on the day ahead of the U.S. presidential debate on Tuesday and the release of U.S. economic data later in the week. Besides, the upbeat market sentiment also keeps the USD bulls on the defensive. However, the losses in that U.S. dollar kept the GBP/USD currency pair higher. Whereas, the U.S. Dollar Index that tracks the greenback against a bucket of other currencies edged down by 0.04% to 94.588 by 10 PM ET (2 AM GMT). 

At home, the Confederation of British Industry (CBI) head Carolyn Fairbairn showed some readiness about the Brexit trade deal ahead of the 9th-phase of talks starting from Tuesday. Also on the positive side is the Internal Market Bill (IMB) has ripped off the latest round of Brexit talks. This, in turn, underpinned the British Pound and extended some support to the currency pair. 

On the contrary, the Irish leader Taoiseach Micheál Martin’s latest statement that the U.K. headed for no-deal Brexit eventually fueled the worries of losing a trade deal and becoming the key factor that cap further gains in the currency pair. It is worth reporting that the cost of losing a trade deal is estimated as near 1.0 million British jobs, as per the Financial Times. Meanwhile, the further burden on the economy that is yet to overcome the COVID-19 woes seems to push the BOE policymakers to defend the negative rate policies.

Across the ocean, the U.K. policymakers are ready to a strict ban on socializing due to the recent surge in the coronavirus (COVID-19) cases, which also keeps challenging the currency pair upside momentum. The re[orts also revealed that the new lockdown measures put forward a complete closure for all pubs, restaurants, and bars for two weeks initially. Looking ahead, the market traders will keep their eyes on headlines concerning Brexit, pandemic, and U.S. Presidential Election, which may offer important clues. Meanwhile, the USD price dynamics will be key to watch. 

Daily Technical Levels

Support Resistance

1.2698       1.2791

1.2647       1.2833

1.2605       1.2884

Pivot point: 1.2740

GBP/USD– Trading Tip

The cable is consolidating in a sideways trading range of 1.2770 to 1.2725 level, as it has formed an ascending triangle pattern on the hourly timeframe. A bullish breakout of 1.2770 level can lead the Sterling price towards 1.2819 level on the higher side. Bullish bias will be more substantial over the 1.2770 level and bearish below the same level today.


USD/JPY – Daily Analysis

The USD/JPY currency pair extended it’s early-day losing momentum and picked up further offers around 105.30 level mainly due to the broadly weaker U.S. dollar. That was triggered by traders’ cautious mood ahead of Tuesday’s U.S. presidential election debate between President Donald Trump and Democratic candidate Joe Biden. Apart from this, the upticks in the U.S. stock futures, which refer to market risk-on sentiment, also undermined the safe-haven U.S. dollar. This, in turn, kept the currency pair under pressure. The reason for the currency pair losses could be associated with the stronger Japanese yen across the pond. Despite the upbeat tone in the Japanese stocks, the Japanese yen remains in demand across the board, which keeps the currency pair down. 

On the contrary, the upbeat market mood, backed by the recently positive coronavirus (COVID-19) vaccine news and stimulus hopes, tends to undermine the safe-haven Japanese yen, which might help the currency pair to limit its deeper losses. Meanwhile, the latest Japanese Chief Cabinet Secretary Kato’s latest report that the government will not hesitate to deploy additional economic measures could also be considered one of the key factors that kept the lid on any additional losses in the currency pair. 

Despite the rise in the COVID-19 cases, coupled with the expected return of lockdown conditions in major economies, the market trading sentiment started to flash green during the Monday’s Asian session amid hopes of the American stimulus, which keeps the broad-based U.S. dollar under pressure. Moreover, the cautious mood of traders ahead of Tuesday’s U.S. presidential election debate between President Donald Trump and Democratic candidate Joe Biden also kept the U.S. dollar bulls on the defensive. 

The broad-based U.S. dollar failed to keep its early-day gains and edged lower before the European trading hours due to the risk-on market sentiment. Moreover, the U.S. dollar losses could also be associated with lingering doubts about the U.S. economic recovery ahead of plenty of economic data and political developments in the United States. However, the losses in the U.S. dollar kept the USD/JPY currency pair under pressure. Whereas, the U.S. Dollar Index that tracks the greenback against a bucket of other currencies edged down by 0.04% to 94.588 by 10 PM ET (2 AM GMT). 

However, the market trading sentiment was supported by the hopes of the U.S. stimulus to combat the coronavirus (COVID-19). As per the latest report, the U.S. House Speaker Nancy Pelosi thinks that the COVID-19 aid package deal is possible while considering the Democratic preparation for a new package. Besides this, the New York Times alleged U.S. President Donald Trump over income tax returns of $750 for 2016 and 2017, which initially left the negative impact on the government. Afterward, the Democratic leader proved it as “fake news” while showing strong belief to have tremendous victory in the election. 

Across the pond, the reason for the upbeat market mood could also be associated with the latest reports suggesting that the Confederation of British Industry (CBI) head Carolyn Fairbairn is confident about the Brexit trade deal ahead of the 9th-round of discussions, which is scheduled to start from Tuesday.  

As in result, the S&P 500 Futures keeps its Friday’s upbeat performance of Wall Street while rising 0.36% to 3,298 as of writing. Although, the risk barometer seems to await clearer signals to extend the latest recovery.

At home, the new Japanese Chief Cabinet Secretary Kato told that the government would not hesitate to deploy additional economic measures if needed. This, in turn, undermined the Japanese yen currency and helped the currency pair limit its deeper losses. Looking ahead, the market traders will keep their eyes on headlines concerning Brexit, pandemic, and U.S. Presidential Election, which may offer important clues. Meanwhile, the USD price dynamics will be key to watch. 

Daily Technical Levels

Support Resistance

105.22       105.56

105.04       105.72

104.88       105.90

Pivot point: 105.38


USD/JPY – Trading Tips

The USD/JPY is consolidating with a bullish bias to trade at 105.460 level, and the series for EMA is now extending at 105.550 level. On the lower side, the support holds at 104.840 level. The MACD also supports the bullish bias amid a stronger U.S. dollar and diminished safe-haven appeal. A Bullish crossover of the 105.550 level may drive more buying until 106.258. The idea is to stay bearish below 105.470 today. Good luck! 


Categories
Forex Market Analysis

Daily F.X. Analysis, September 08 – Top Trade Setups In Forex – European Data in Focus! 

On Tuesday, the economic calendar offers low impact economic events that may not drive any solid movement in the market. However, the eyes will remain on the German Trade Balance, French Trade Balance, and Revised GDP figures from the Eurozone. EUR currency pairs can show some price action during the day today.

Economic Events to Watch Today  


EUR/USD – Daily Analysis

The EUR/USD pair was closed at 1.18120 after placing a high of 1.18485 and a low of 1.18114. The EUR/USD pair dropped on Monday and extended its previous day’s losses due to decreased risk appetite and negative industrial production data from Germany. However, the change in prices was little as the U.S. financial markets were closed for the Labor Day Holiday.

The U.S. Dollar was steady on Monday with a little change in U.S. Dollar Index at 92.895 level. However, the greenback sentiment remained weak after the dovish comments from Jerome Powell on Friday that interest rates will remain lower for longer. The dollar was also steady because of the slow growth in the job sector was reported in August.

On Friday, the U.S. Department of Labor showed slow growth and increased permanent job losses as the government funding was running out. It has raised doubts about the sustainability of the economic recovery. On the Euro front, traders’ focus has shifted to the European Central Bank’s meeting on Thursday this week. As it is expected, ECB will not change policy stance, but the focus will solely remain on the message the ECB will deliver on its inflation forecasts.

The local currency Euro marked a 2-year high at the beginning of the month, and after that, the European Central Bank meeting will hold more importance. Because officials were concerned about the higher Euro prices, it would impact the exports and prices.

On the data front, at 11:00 GMT, the German Industrial Production in July decreased to 1.2% from the expected 4.5% and weighed on the local currency Euro. At 13:30 GMT, the Sentix Investor Confidence for September came in as -8.0 against the expected -11.4 and supported single currency Euro. The decreased German Industrial Production raised concerns over the economic growth and weighed on the Euro that dragged the currency pair EUR/USD on the downside.

The EUR/USD pair was down on Monday because of the European Union’s rising coronavirus cases. On Monday, Spain became the first European country to surpass 500,000 coronavirus cases after the second surge in infections caused after schools were reopened. On Tuesday, the Trade Balance from Germany and France and the Retail Sales data from Italy will be under traders’ focus for finding fresh impetus.

Daily Technical Levels

Support Pivot Resistance
1.1803 1.1826 1.1841
1.1788 1.1864
1.1764 1.1879

EUR/USD– Trading Tip

The EUR/USD is trading with a selling bias around 1.1801 level, heading lower towards the next support area of 1.1780 level. On the 4 hour timeframe, the EUR/USD may find support at 1.1780, the triple bottom level, which is extended by an upward trendline. Below this, the next support is likely to be found around the 1.1725 level.


GBP/USD – Daily Analysis

The GBP/USD failed to stop its previous session losing streak and took further offer below the 1.3150 level while represented 0.96% losses on the day mainly due broad-based U.S. dollar on-going strength, supported by the combination of factors. On the other hand, the reason behind the currency pair declines could also be associated with the rising fears of a no-deal Brexit, which joined the on-going pessimism around the Cable and contributed to the currency pair losses. At this time, the GBP/USD currency pair is trading at 1.3155 and consolidating in the range between 1.3145 – 1.3267.

The GBP currency took a hit on the 1st-day of the week manly after the British Prime Minister Boris Johnson set October 15 as the deadline for a Brexit trade agreement with the European Union, which eventually bolstered the risk of a messy end to the Brexit transition period on December 31. As per the keywords, “U.K. will be ready to trade with the E.U. on Australia type terms if no deal agreed.” He further added, “If no deal reached by October 15 with the E.U., both sides should accept this and move on. Also, fuel the fears could be the reports that the U.K. 

However, the Brexit fears played a major role in weakening the market trading sentiment as the U.S. is on the labor day holiday. Across the pond, the intensifying tensions between the U.S. and China also added a burden around the market trading sentiment. After the U.S. punished Chinese technologies and diplomats by imposing several sanctions, China’s Foreign Ministry urged the U.S. to stop abusing private companies. As per the keywords of China’s Foreign Ministry, “Without evidence, the U.S. has abused national power to take measures on Chinese companies.” This ultimately exerted downside pressure on the trading sentiment and contribute to the currency pair losses.

As in result, the broad-based U.S. dollar flashed green and took the safe-haven bids on the day amid market risk-off sentiment. However, the U.S. dollar gains could also be associated with the upbeat U.S. labor market report, which showed a decline in the unemployment rate and a rise in U.S. Treasury yields. Thus, the gains in the U.S. dollar kept the currency pair under pressure. Whereas, the U.S. Dollar Index that tracks the greenback against a basket of other currencies rose by 0.18% to 92.882 by 12:05 AM ET (5:05 AM GMT).

 Daily Technical Levels

Support Pivot Resistance
1.3109 1.3197 1.3254
1.3052 1.3342
1.2964 1.3398

GBP/USD– Trading Tip

The GBP/USD is trading with a selling bias at 1.3125 level, set to test the support level of 1.3120 level. The Cable is trading within a downward channel, which may extend support at 1.3120 level along with resistance at 1.3186. On the downside, the GBP/USD pair may find support at 1.3051 level upon the violation of the 1.3125 level. The MACD is also supporting selling bias; therefore, we will be looking for selling trades below the 1.3165 level. 


USD/JPY – Daily Analysis

The USD/JPY pair was closed at 106.227 after forming a high of 106.503 and 106.055. Overall the movement of the USD/JPY pair remained bullish throughout the day. The pair USD/JPY moved in the upward direction and posted gains on Monday. The currency pair extended its bullish streak for the 5th consecutive day despite the sow job growth in the U.S. and increasing US-China tensions.

The tensions between U.S. & China further escalated on Monday after the U.S. administration of President Donald Trump announced a ban on the usage of products made from cotton from China’s Xinjiang region. The ban was imposed against the human rights violation in Xinjiang over the forced labor on Muslim minorities.

China’s response to such a ban is yet to come, but it is expected that the latest ban would only increase the lingering tensions between both nations. These conditions helped fade the market risk sentiment and capped on additional gains in the USD/JPY pair on Monday. The greenback gathered strength against its rivals on the back of upbeat macroeconomic data released in the previous week. But the pair’s upside momentum was limited after a sharp decline in the major equity indexes in the U.S. that helped the JPY to find demand as safe-haven.

On the data front, at 10:00 GMT, the leading indicators in July rose to 86.9% compared to June’s 83.8%; it failed to impact USD/JPY’s pair prices as it came in line with the forecast. However, traders’ focus has now shifted towards the second quarter Gross Domestic Product (GDP) and Trade Balance data from Japan that will be released on Tuesday. Markets expect the Japanese economy to contract by 8.1% every quarter. Any better than expected reading would give strength to the Asian stock markets and hurt the Japanese Yen that will add further gains in USD/JPY pair.

According to Johns Hopkins University data on the coronavirus front, the total number of coronavirus cases reached 27 million on Monday. These fears kept the risk sentiment under pressure and weighed on the USD/JPY pair’s gains.

However, the risk sentiment was favored by the latest comments from Steven Mnuchin on Sunday. He said that the new stimulus measures’ details would be delivered by the end of this week. He reiterated that the new bill would provide funds to the federal government through the start of December.

The White House and Congress agreed on the same terms to extend the funding, as confirmed by Nancy Pelosi and Steven Mnuchin. The announcement came to avoid the economic shutdown as the current funding was near to expire at the end of this month. These positive comments from Mnuchin raised the risk sentiment and weighed on the Japanese Yen and pushed the USD/JPY pair higher.


Daily Technical Levels

Support Pivot Resistance
106.1100 106.2500 106.3800
105.9900 106.5100
105.8500 106.6400

USD/JPY – Trading Tips

The USD/JPY is consolidating at 106.250 area, having a resistance mark of 106.485 level. An upward crossover of 106.505 level may extend further, buying into the next resistance mark of 106.850. On the downside, the safe-haven USD/JPY currency may gain support at 106.028 and 105.628. Let’s consider taking a bullish trade over 106.028 level as the MACD and RSI also suggest neutral bias. Good luck! 

Categories
Forex Basic Strategies

Trading The Forex Market Using ‘Price Action With Context’ Strategy

Introduction

Price action with context is a process to predict a currency pair’s movement by reading the chart. The key price driver of a currency pair is fundamental events, but we can predict the future movement based on the present and past activity of the chart.

Central banks and financial institutes drive the forex market. Therefore, when they make the price move, they left some signs of their activity. As a price action trader, we will read their activity and anticipate what they might do in the future.

What is Price Action?

Price action is a process to inquiry about a currency pair’s price development. The main aim of the price action trading is to understand buyers’ and sellers’ sentiment in the price and predict future movement based on these. The price action trading is based on the combination of several trading indicators and price behaviors. Therefore, you might have to use multiple trading tools as a price action weapon.

The price of a currency pair moves based on the sentiment of buyers’ and sellers’. Therefore, using price action is logical that can provide accurate trading signals. In the price action with context trading strategy, we will identify a market direction by reading the chart and then enter a trade from the correction to get the maximum return with a minimum risk.

What are Price Action Weapons?

There are many parts in the price action trading that a trader should know, like- candlestick, support and resistance, trend, market flow, event level, key Level, and market context.

Candlestick

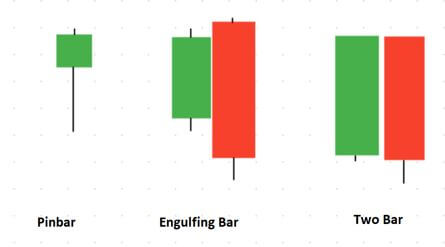
Candlestick represents the price movement of a currency pair for a specific timeframe. The four major parts of candlestick trading are- opening price, closing price, high price, and low price. Candlestick represents both continuation and reversal price direction based on the opening, closing, high and low. There are many candlestick patterns in the market, but in this trading strategy, we will focus on reversal candlesticks only.

Example of reversal candlestick – Pinbar, Engulfing Bar, and Two Bar, etc.

Support & Resistance

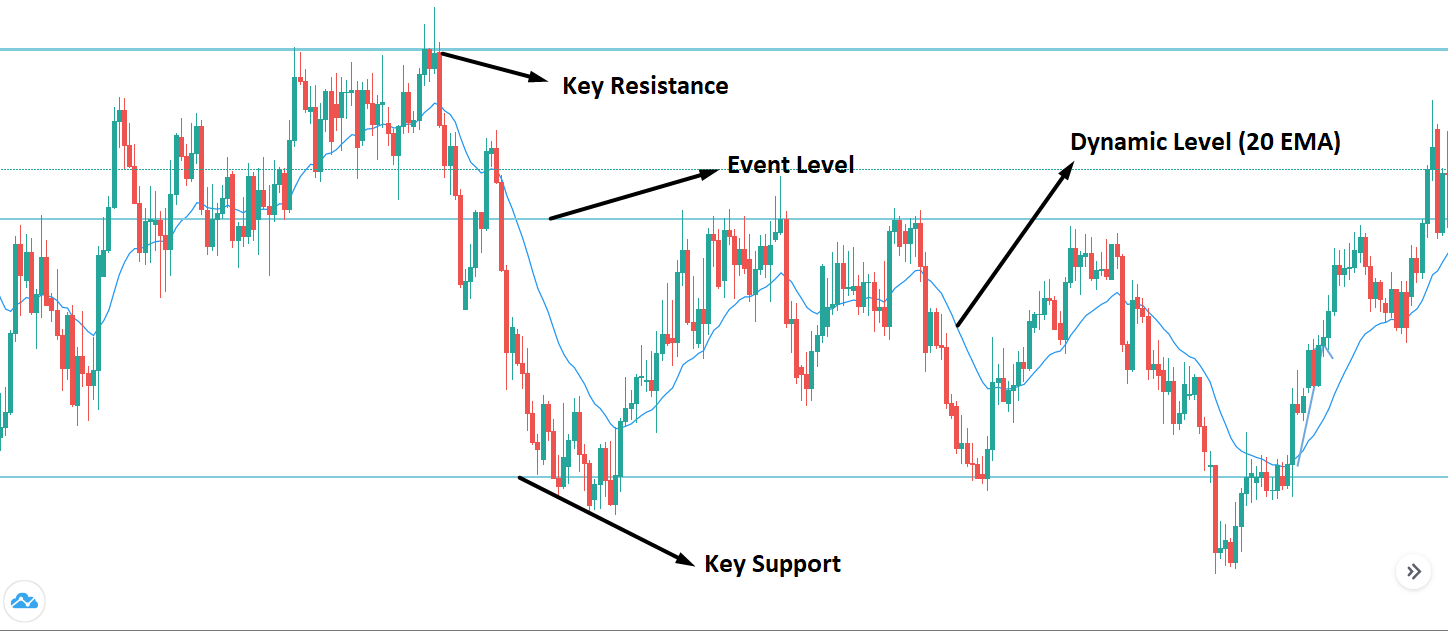
Support and resistance are a price zone from where the price is likely to change the direction. When the price is moving up, it will reverse as soon as it finds resistance. On the other hand, the price will stop moving down as soon as it finds a support level. There is more to know about the support and resistance in this trading strategy-

Event Level – Event level is a price zone that works as both support and resistance. It is the most important Level as both buyers and sellers put attention to it.

Key Level – key levels are a significant level in the daily or weekly timeframe to understand the price’s top and bottom.

Dynamic Level – Dynamic levels move with the price rather than a specific horizontal zone. In this trading strategy, we will use 20 Exponential Moving Average as the dynamic Level.

Market Context

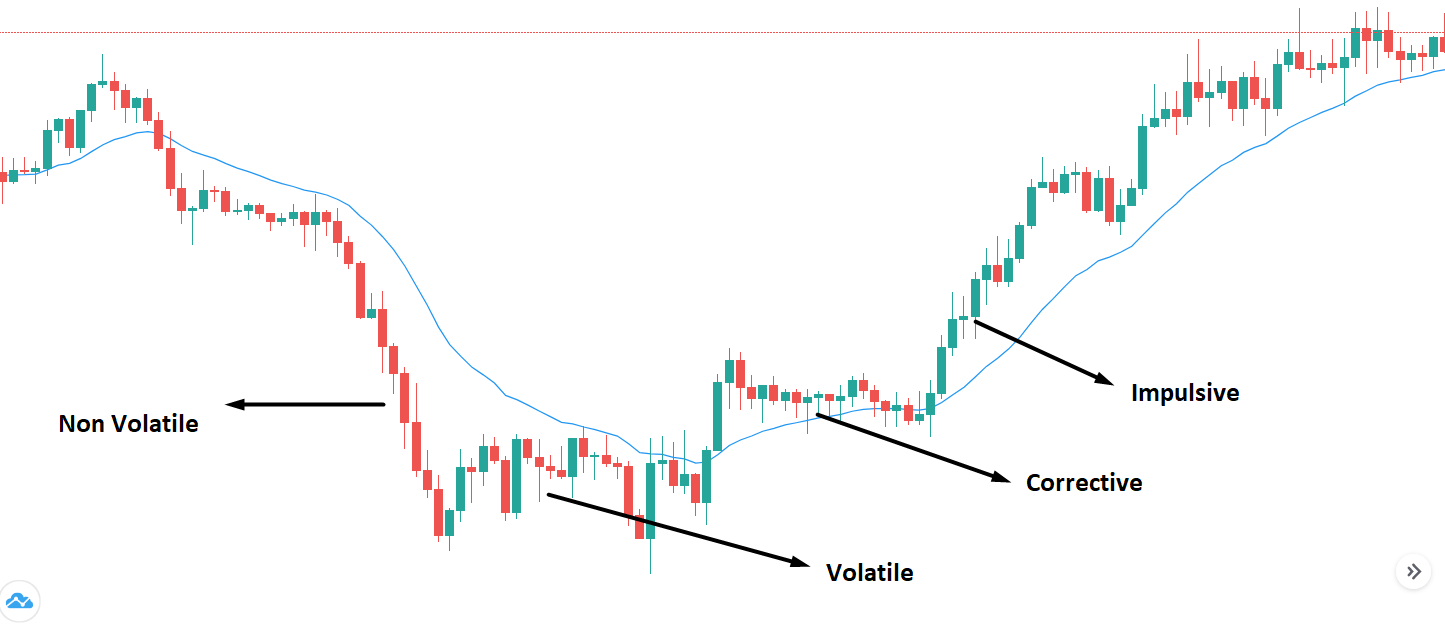
Market context is a process to identify the nature of a trend. It has four elements:

Impulsive – When the price aggressively creates new highs and lows, it is considered as an impulsive trend. It indicates that the price will continue the current trend.

Corrective – In a corrective market structure, price barely creates new higher highs or lower lows. It is an indication of market reversal.

Volatile Trend – In volatile trends, the market follows the corrective structure and indicates a market reversal.

Non Volatile Trend – Non-volatile trend appears with the impulsive market momentum when the price tries to continue the current movement.

Bullish Price Action Trade Setups

Find the market in an impulsive bullish pressure in H4 or daily timeframe. Identify the Key support level and consider buy trades only as soon as the price is trading above it.

Entry

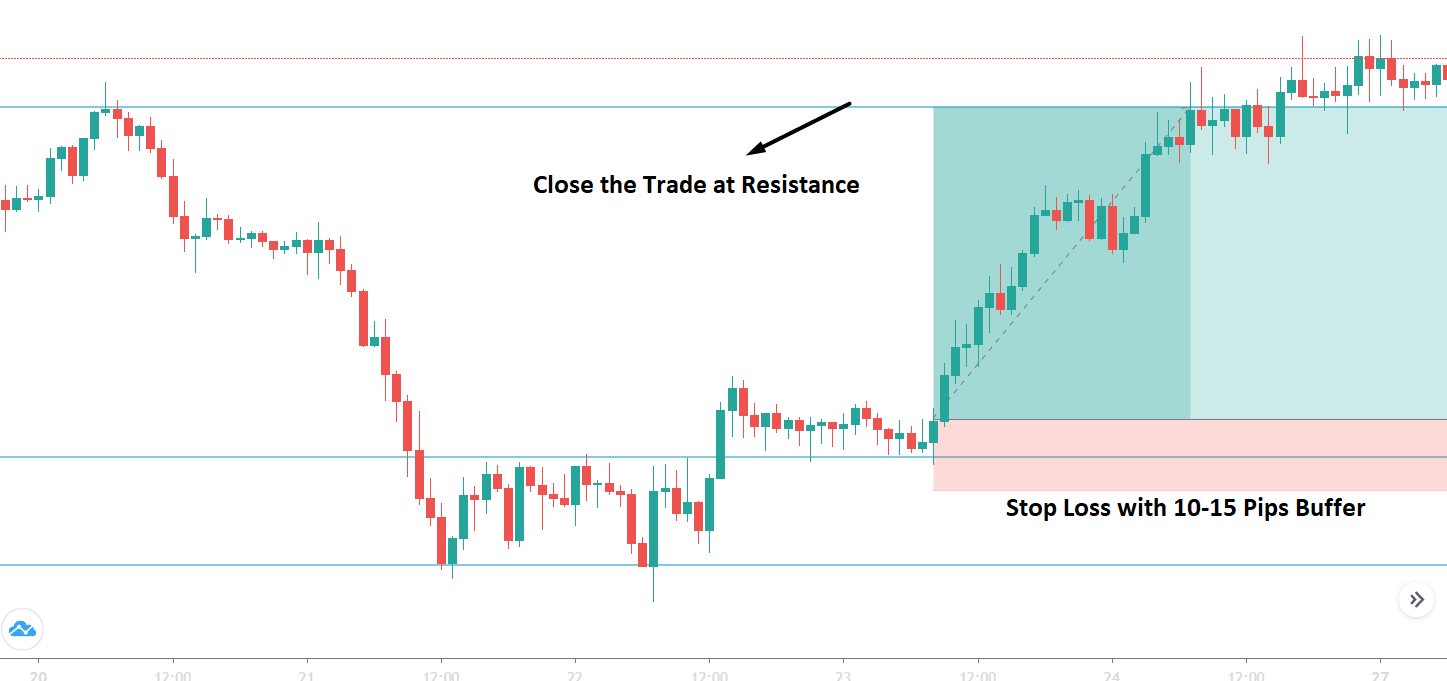
To enter the trade, you have to wait until the price comes down towards an event level with a corrective structure in 1 Hour timeframe. Enter the trade as soon as the price rejects and closes above the event level with a reversal candlestick.

Stop Loss

Put the stop loss below the recent swing low with 10-15 pips buffer. Here the buffer means you should put the stop loss 15 pips below the swing low.

Take Profit

The primary target of the take profit would be the next event level. However, if the bullish trend remains impulsive, you can extend the take profit. On the other hand, you can close earlier if the price barely creates new higher highs.

In the example below, we can see a visual representation of how to take the entry with stop loss and take profit level.

Bearish Price Action Trade Setups

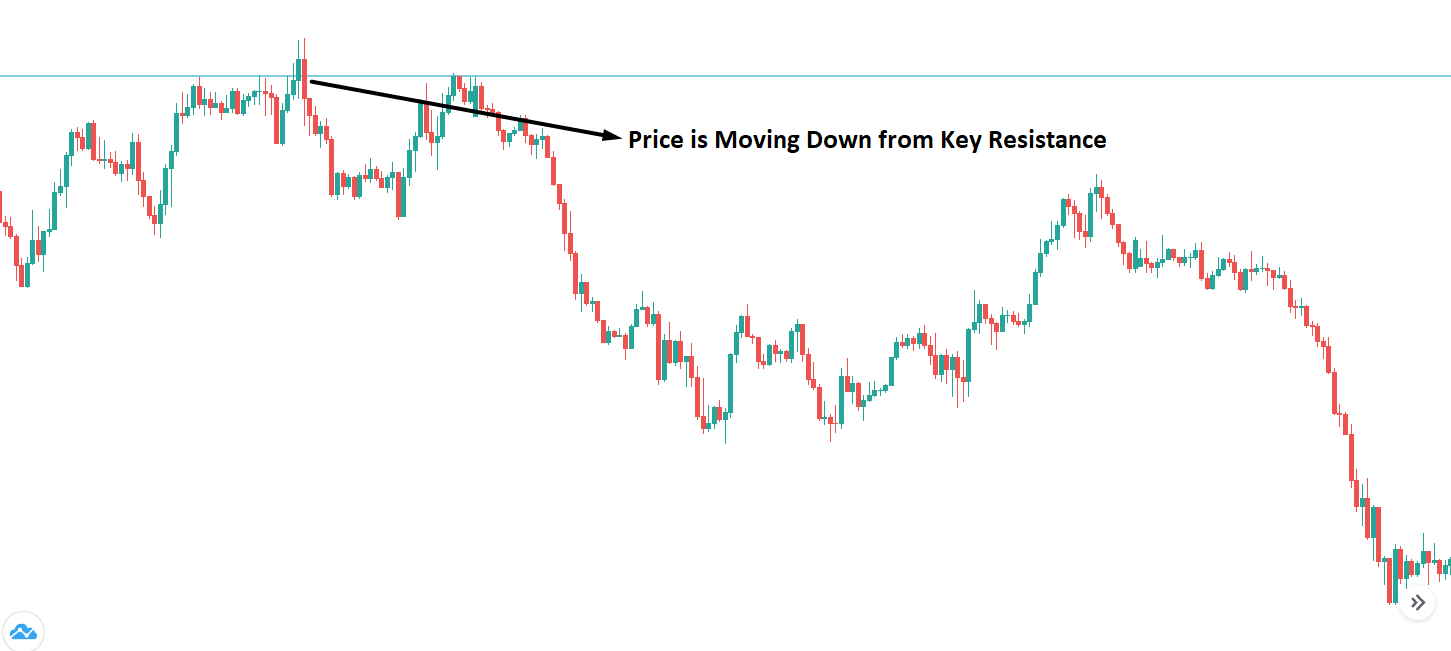
Find the market in an impulsive bearish pressure in H4 or daily timeframe. Identify the key resistance level and consider sell trades only as soon as the price is trading below it.

Entry

To enter the trade, you have to wait until the price comes down towards an event level with a corrective structure in 1 Hour timeframe. Enter the trade as soon as the price rejects and closes below the event level with a bullish reversal candlestick.

Stop Loss & Take Profit

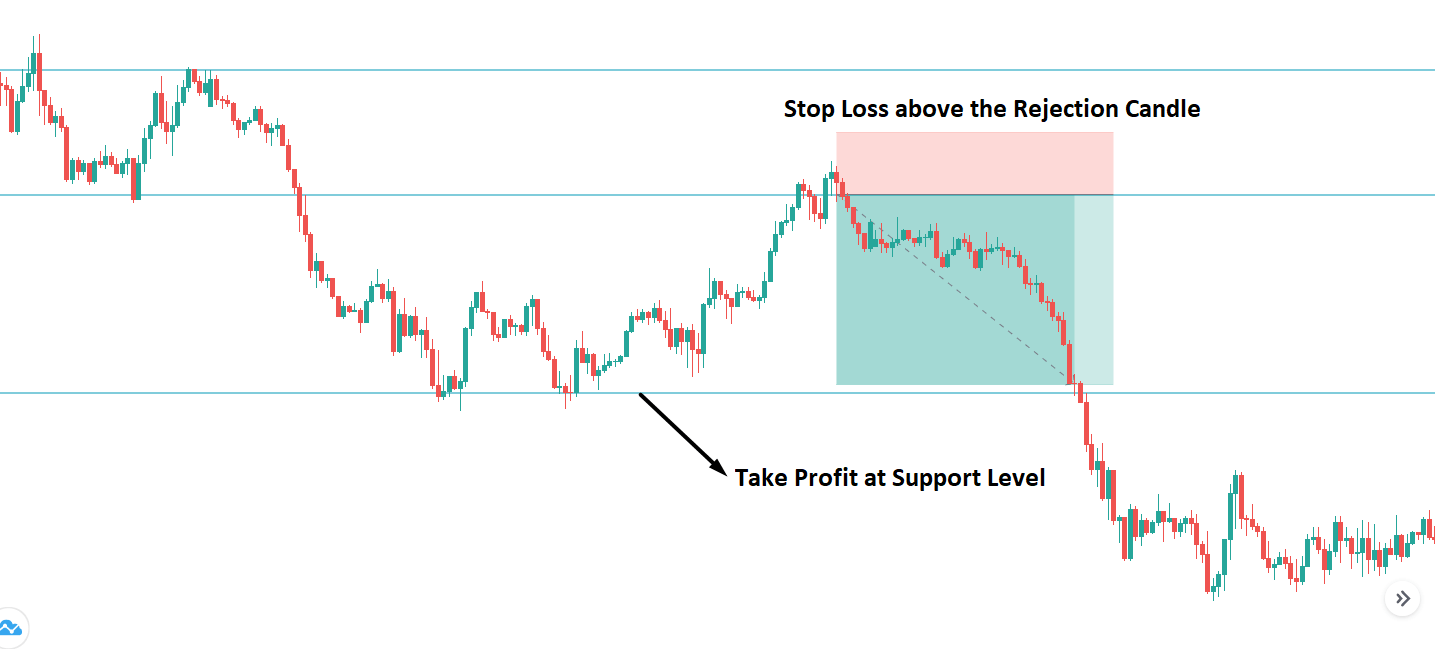
Put the stop loss above the recent swing high with 10-15 pips buffer. Here the buffer means you should put the stop loss 15 pips above the swing high.

The primary target of the take profit would be the next event level. However, if the bearish trend remains impulsive, you extend the take profit. On the other hand, you can close earlier if the price barely creates new Lower lows.

In the example below, we can see a visual representation of how to take the sell entry with stop loss and take profit level.

Final Thoughts – Trade Management Idea

In the above section, we have seen how to trade using the price action with context. In this trading strategy, buy and sell trades come after filtering out unusual market movements from the volatile market conditions.

However, no forex trading strategy in the world can guarantee a 100% profit, so your trades might go wrong even if you strictly followed all rules. If you want to grow your account with a consistent profit, you should follow strong trade management tools, as mentioned below:

  • Ensure that you are not taking over a 2% risk per trade of your trading balance.
  • Move your stop loss at breakeven as soon as the price creates a new higher high or lower low.
  • If you face a 3 or 4 consecutive losses, take a break and observe the market until it follows the trend accurately.
  • Make sure to keep your mind free from any bias while you are analyzing the market.

Overall, price action is the core element of trading that every trader should know. There are many trading strategies combining price action and other trading tools. The strategy we have seen above has a good history of providing profitable trades. Therefore, if you can implement it properly, you can consistently grow your trading account.

Categories
Forex Basic Strategies

Heard Of The CCI (Commodity Channel Index) Trading Strategy?

Introduction

Often in life, taking the right action is the hardest decision to make. The same thing happens in trading as well. Most traders find it extremely difficult to buy at ‘bottom’ and sell at ‘top’ even though from a very early age, we are taught to look for value and buy “cheap.” That is why most traders who proclaim their love for trading with the trend fail to pick tops or bottoms.

While these types of ‘turn’ trades can be very profitable, they sometimes seem like tough tasks as the price can relentlessly trend in one direction, constantly stopping out the bottom and top pickers. Sometimes it is far easier and more comfortable to go with the flow. Yet, most traders are reluctant to buy breakouts for fear of being the last one to the party before prices reverse with a reprisal.

In today’s topic, we will solve the question of “how to trade breakouts confidently and successfully.” The Commodity Channel Index (CCI) Strategy is a setup designed to deal with just such a predicament.

Time Frame

One of the best parts of this strategy is that it works well on all time frames. That means we can use this strategy from very short time frames like 5-minutes to longer time frames such as the 4-hours or daily (D).

Indicators

In this strategy, we will use an indicator that is rarely used in forex. That is the Commodity Channel Index (CCI) indicator, devised by Donald Lambert in 1980 and originally designed to solve engineering problems. The primary focus of CCI is to measure the deviation of the currency pair’s price from its statistical average. As such, CCI is an extremely good measure of momentum that helps us to optimize only the highest probability entries for our setup.

Currency Pairs

This strategy applies to most of the currency pairs listed on the broker’s platform. We need to make that the pair we are choosing is fairly liquid.

Strategy Concept

The CCI is an unbounded oscillator with a reading of 100+ is typically considered to be overbought, and any reading of 100- indicates oversold. For this strategy, we will use these levels as our trigger points and change the CCI interpretation. We will look to buy the currency pair if it makes a new high above 100 and sell if it makes a new low below 100.

In this strategy, we are looking for new peaks or spikes that are likely to take the currency pair higher or lower due to its momentum. The thesis behind this setup is much like a body that will continue to remain in motion until it is hurtled by an external force or slowed down by counter forces. Similarly, new highs and lows in CCI will propel the currency in the further direction of the move until new prices halt the ongoing move.

Trade Setup

In order to illustrate the strategy, we have considered the EUR/JPY currency pair, where we will be applying the strategy on the 1-hour time frame chart.

Step 1

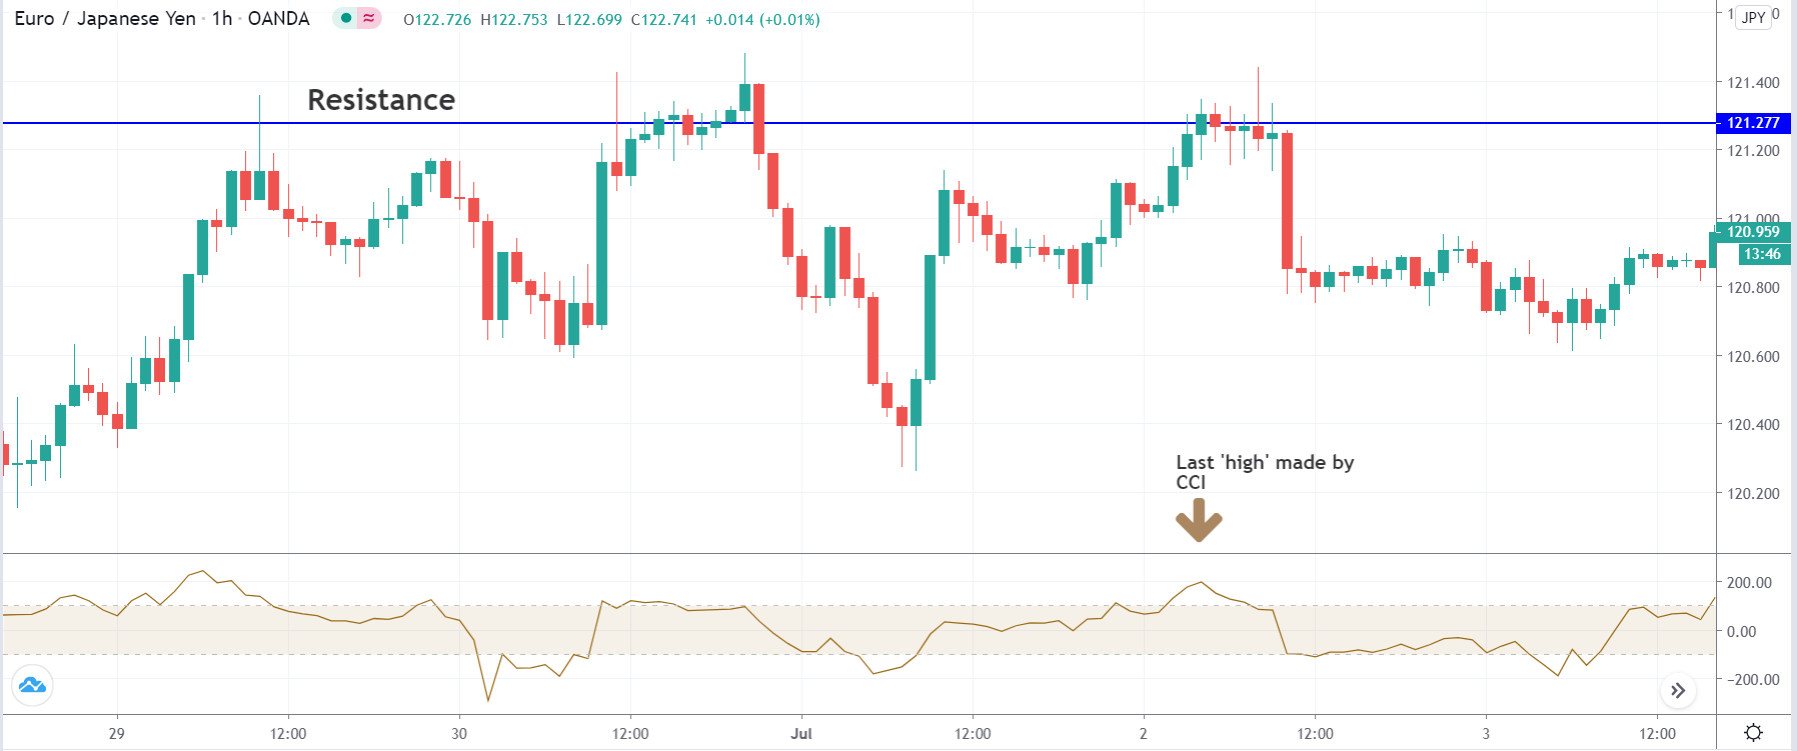
Firstly, open the chart of the desired currency pair and plot the Commodity Channel Index (CCI). Keep the input of the CCI index as 20. Then, mark key technical levels of support and resistance on the chart. For a ‘long’ trade, look for the last ‘high’ made by the CCI indicator and mark it out. That means its value should have crossed +100 during an upward price movement. Similarly, for a ‘short’ trade, look for the last ‘low’ made by the CCI indicator during the downward price movement.

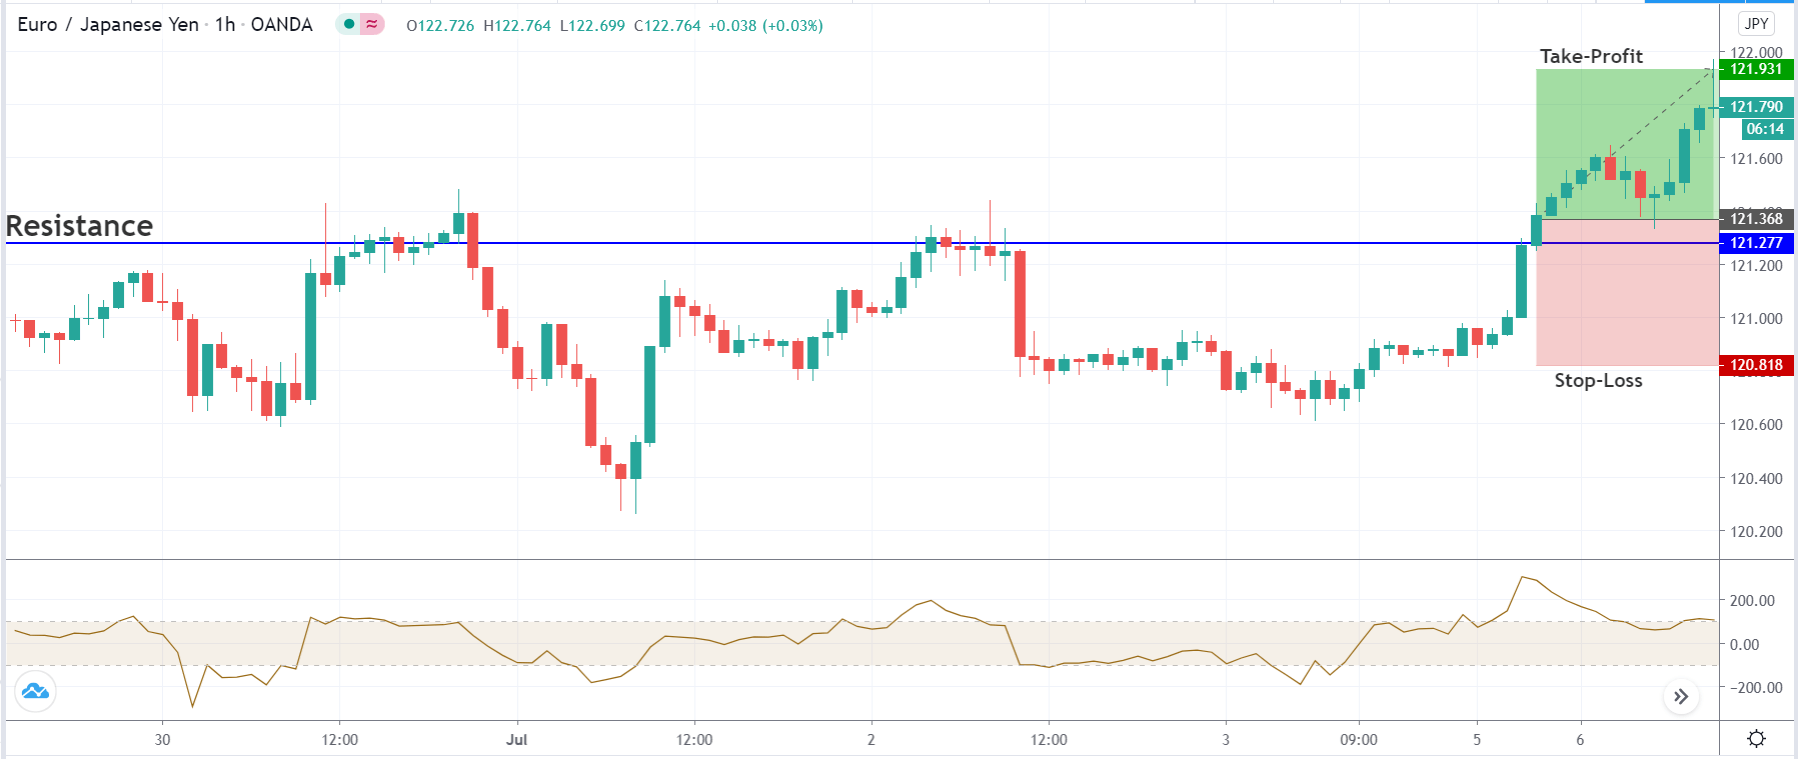
In the below example, we have identified a ‘resistance’ and a ‘high’ that was made by the CCI indicator. Since the ‘high’ is more prominent on the chart, we will look for ‘long’ trades in the currency pair.

Step 2

This step is the most important part of the strategy. Here, we need to wait for the CCI indicator to market a new ‘high’ or new ‘low,’ which is higher than the previously identified ‘high’ or ‘low.’ This indicates a build-up of momentum in the market with the high chance that the market will continue moving strongly in the same direction. In the next step, we will see how to take an ‘entry’ after carrying the previous steps.

In the below image, we can see that the CCI index makes a new ‘high’ at the appearance of a bullish candle. At this moment, the price is exactly at resistance, which means we need to ‘sell’ from here. This is where the strategy comes into the picture.

Step 3

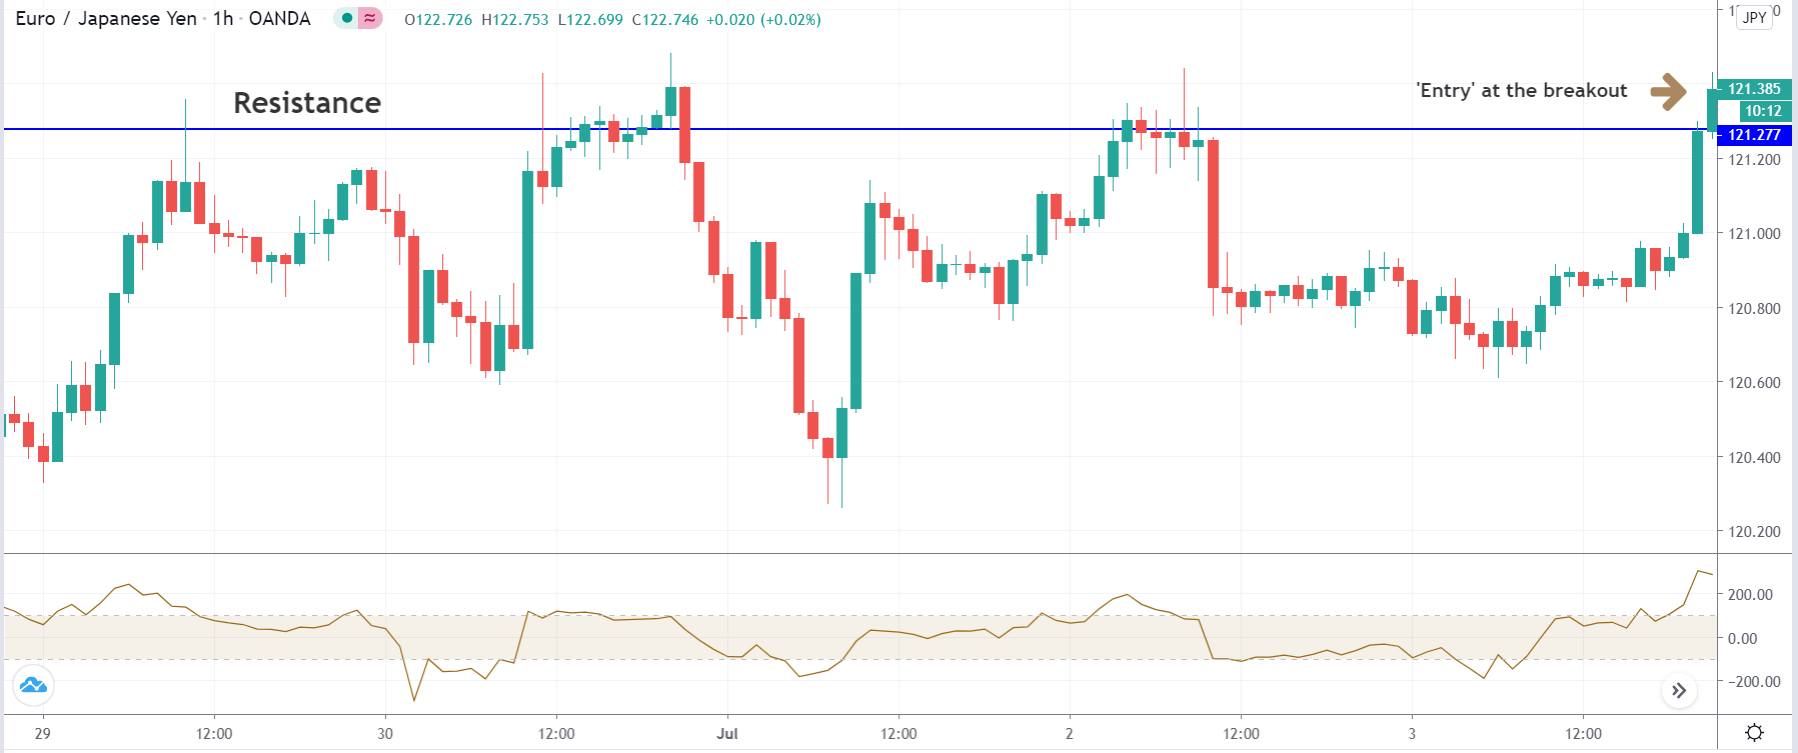
Once the market starts moving in our favor by about five pips, we enter with the appropriate position size. This is an aggressive form of ‘entry’ where we take advantage of the existing momentum. A conservative ‘entry’ would be to wait for a price retracement and enter after receiving a confirmation from the market.

In our example, we are taking an aggressive entry, i.e., at the breakout of the resistance. All traders who will be selling here thinking it as resistance would get trapped. This is the application of the CCI indicator.

Step 4

In this step, we determine the stop-loss and take-profit for the strategy. Stop-loss is placed below the previous ‘low’ in case of a ‘buy’ and above the previous ‘high’ for a ‘sell’ trade. If the ‘high’ or ‘low’ is too far away, it could reduce the risk to reward ratio. In such cases, the stop-loss can be placed 20-25 pips from the entry point. The ‘take-profit’ is set at 1:1 risk to reward.

Strategy Roundup  

If the rules are strictly followed, we may not experience any serious drawdown as we are trading based on market momentum. The key is a high probability, and this is exactly what the ‘CCI strategy’ provides. This strategy exploits the application of the CCI indicator, which is highly underrated in the forex market.

Categories
Forex Basic Strategies

Trading ‘Cable’ Using The ‘English Breakfast Tea Strategy’

Introduction

When traders deal with a particular currency pair for a long time, they start to observe certain characteristics and behavior of that currency pair. Such common behavior could be observed during market opening hours, closing hours, or major news releases. Traders may notice common behavior before and after the holiday season, such as Christmas or New Year.

Day traders enjoy the volatility of the market opening. This could be either Tokyo open, London open, or New York open. Some traders are familiar are with the pattern developed during the Tokyo open while some are comfortable trading the New York open. While some traders like to trade when the market is not extremely volatile, they prefer to trade when the market is quiet and less volatile.

The strategy we will be discussing today is based on the peculiar behavior observed in the GBP/USD currency pair. This behavior is mostly observed during the London opening hours.

Time Frame

The English breakfast tea method works well on the 15-minutes time frame. This means each candle represents 15 minutes of price movement.

Indicators

This strategy is based on pure price action; hence we will not be using any indicators.

Currency Pairs

This strategy applies only to the GBP/USD currency pair.

Strategy Concept

The pattern is observed in GBP/USD before, and after the London market opens in the morning, we have named this strategy an ‘English breakfast tea strategy.’

We have observed that when GBP/USD trends in one direction from 04:15 hours to 8:30 hours London time, it tends to move in the other direction after 8:30 hours. We now compare the closing price of the 15-minute candle that corresponds to 04:15 AM and 08:15 AM London time to determine the direction of the GBP/USD. We then enter the market in the opposite direction at 08:30 AM London time.

For example, if the closing price of the 15-minutes candle at 08:15 hours is lower than the closing price at 04:15 hours, we go long at 08:30 hours. If the closing price of the 15-minutes candle at 08:15 hours is higher than the closing price at 04:15 hours, we go ‘short’ at 08:30 hours.

The stop-loss for the strategy is fixed at 20-30 pips depending on the point of entry on the chart and risk appetite. There are two profit targets for the strategy with risk to reward ratios of 1:1 and 1:2. In other words, the ‘take-profit‘ would be at around 30 pips and 60 pips, respectively.

Trade Setup

Since this strategy is based on the London time zone, we need to make sure that we change the trading platform’s time zone to ‘London.’ If this is not possible, we should know London’s corresponding time opening with respect to our time zone. Let us see the steps required to execute the strategy.

Step 1

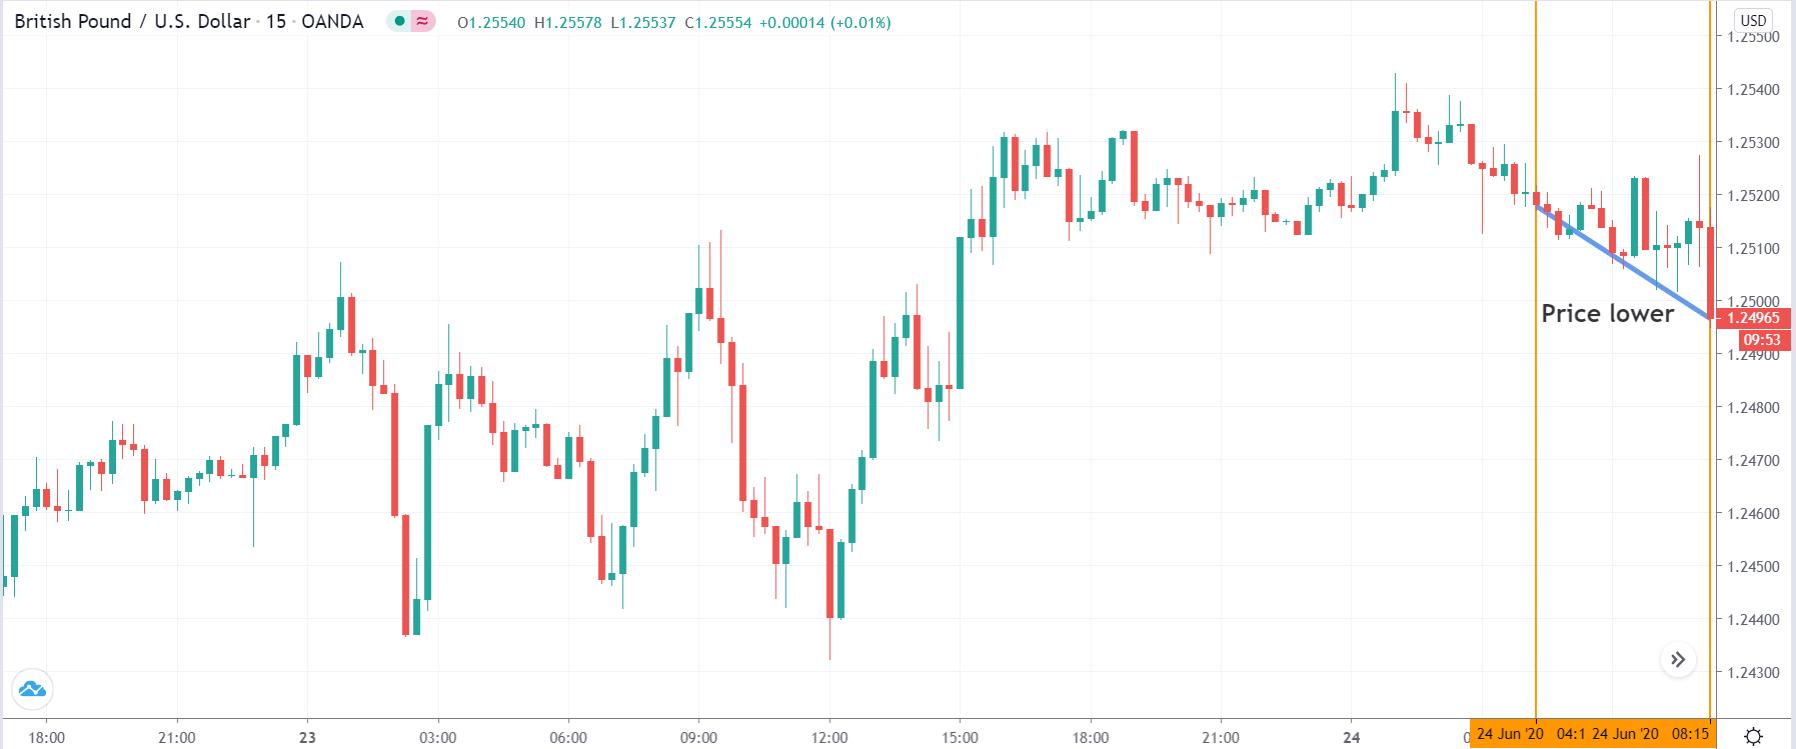
In the first step, we mark 04:15 hours and 8:15 hours London time on the chart. Then we look at the difference between the two candles. If the closing price of 8:15 hours is lower than the closing price of 04:15 hours, we then look for buying GBP/USD. On the other hand, if the closing price of 8:15 hours’ candle is higher than the closing price of 04:15 hours’ candle, we will for ‘short’ trades in the currency pair.

In the following example, we see that the market moves lower between 04:15 hours and 8:15 hours London time. The closing price of the latter is below the former. Therefore, we will take a ‘long’ position by executing further steps.

Step 2

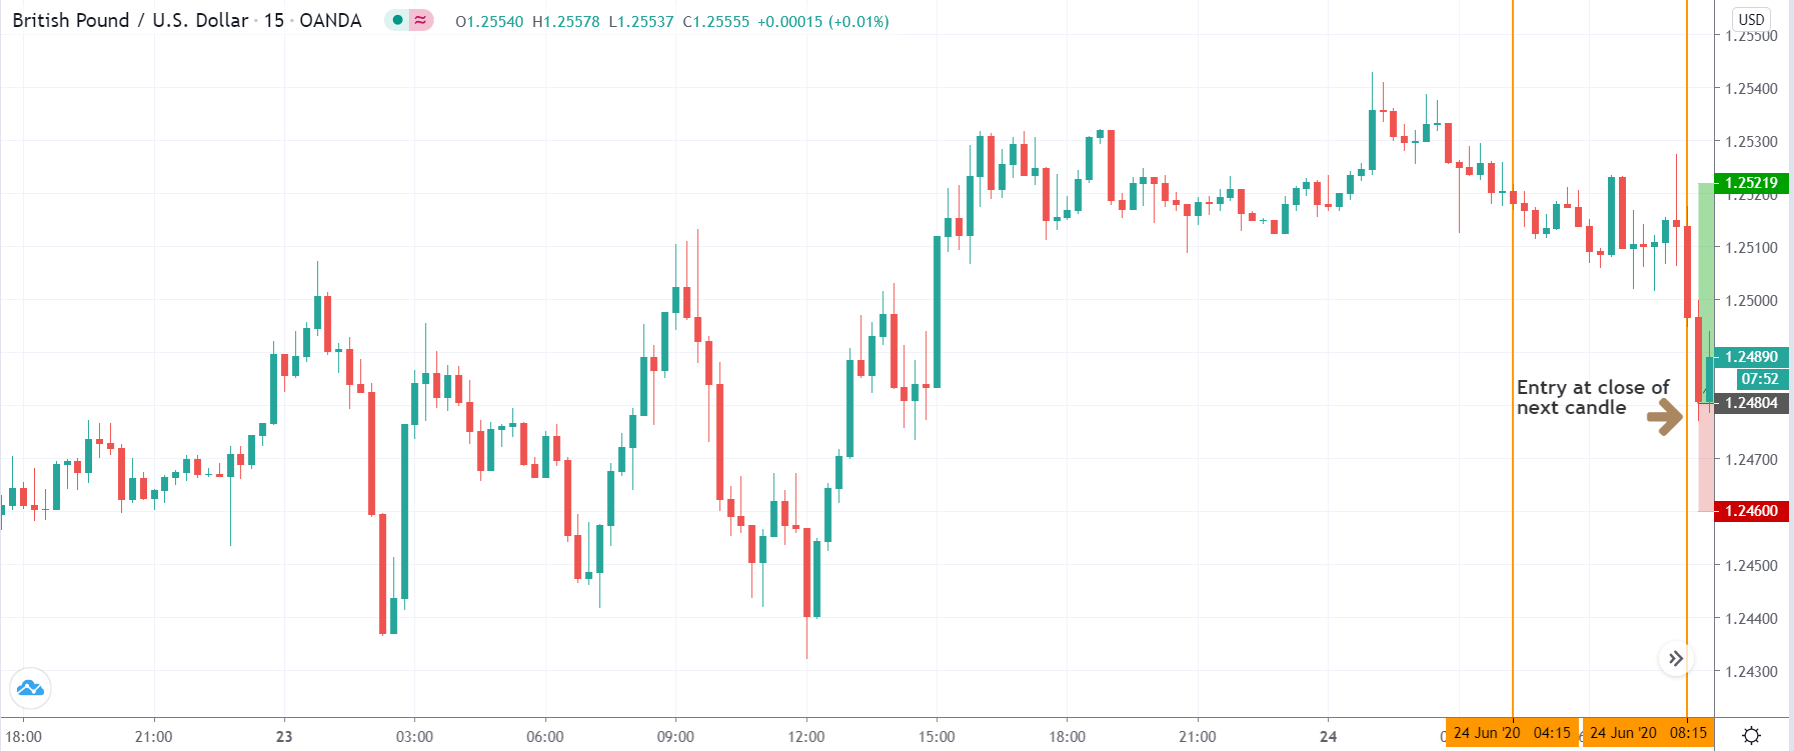
In this step, we examine the ‘entry’ part of the strategy. ‘Entry’ is the simplest part of the strategy where we enter the market at the close of the 08:30 hours’ candle. If the difference between the two candles marked in the previous step is negative, we enter for a ‘buy’ at the subsequent candle. If the difference between the two candles is positive, we enter for a ‘sell’ at the subsequent candle.

We can see in the below image that the subsequent candle dropped significantly lower. As per our strategy, we will take a ‘long’ trade at the close of this candle. Let us see what happens later.

Step 3

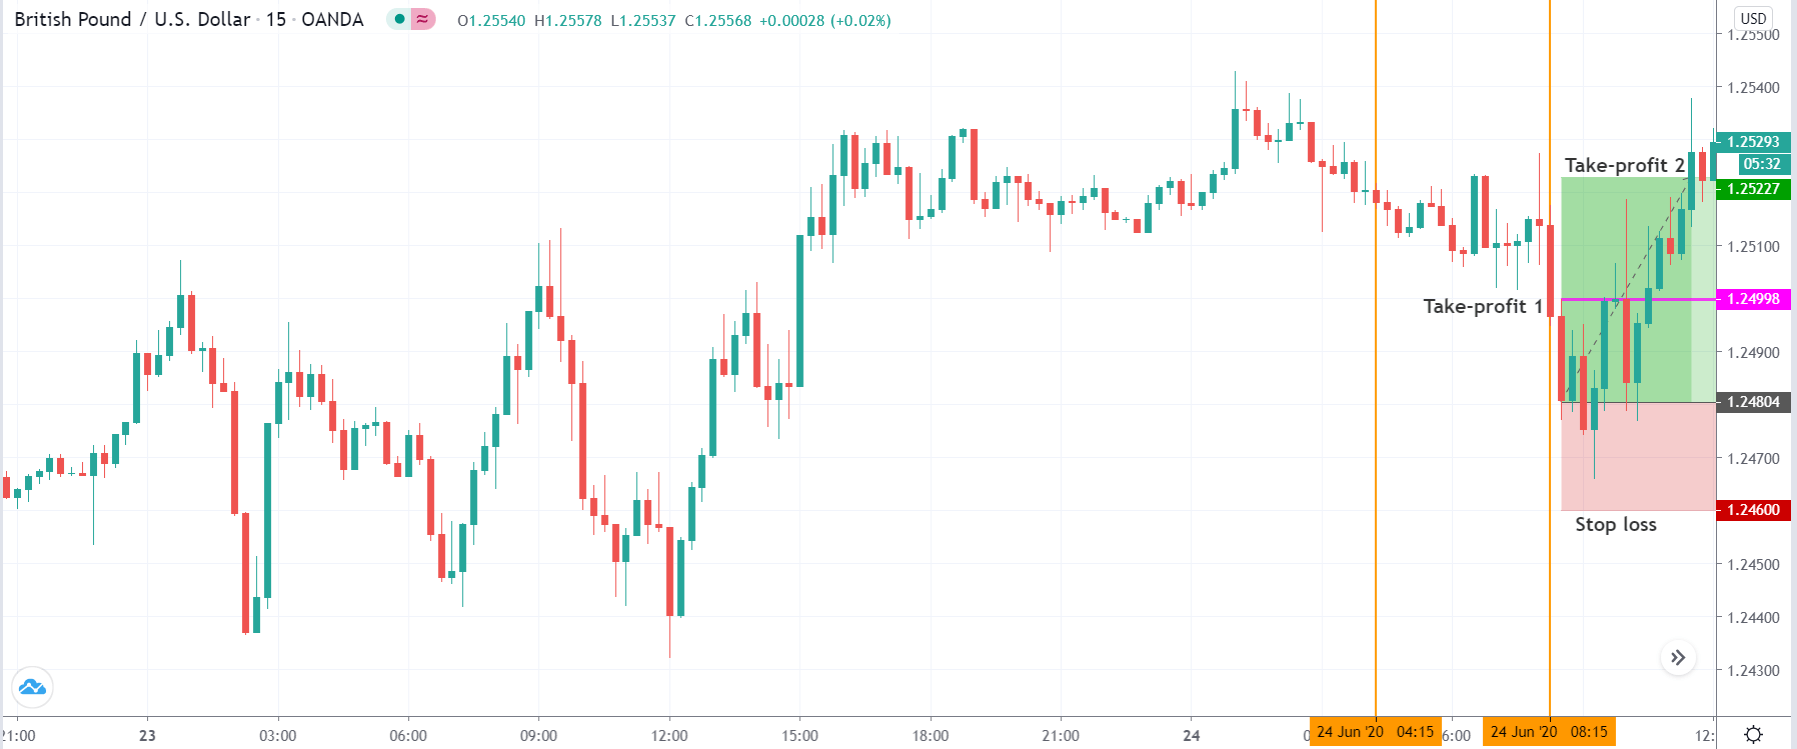
In this step, we determine the stop-loss and profit targets for the strategy. The stop loss is usually set at 20-30 pips depending on the risk appetite of the trader. However, a technical approach for setting the stop loss is that, if the trade is taking place in the direction of the major trend of the market, we keep a small stop loss. If the trade is taking place against the major trend of the market, we opt for a larger stop loss. The first profit target is at 1:1 risk to reward, and the second one is set at 1:2 risk to reward. If we are trading against the trend, the first ‘take-profit’ ensures that we don’t lose any money even if the market turns around mid-way.

In the below image, we can see that the price hits our final ‘take-profit’ after taking an entry at the close of the red candle. Since the market was in an uptrend, we kept a small stop loss.

Strategy Roundup

This strategy is based on a fixed time period, i.e., during the market opening hours. The rules are simple and specific. Any trader can try out this strategy to benefit from the volatility associated with the market opening. However, the currency pairs will change for other market openings. Since we are not giving much importance to the market trend, we might have some losing trades in the beginning until we become expert in the strategy.