Categories
Forex Assets

Why Are Digitized Gold and Silver Perfect for Diversification?

Today, people have more and more investment options, from classics like gold and silver to recent innovations like Bitcoin and other cryptocurrencies. But there is one type of asset that has stood the test of time: precious metals. Here’s why what may seem like an old-school outdated product is still very interesting from the point of view of a young digital native investor.

A Brief History of Gold and Silver

The civilization of the Incas referred to silver and gold as “sun sweat” and “moon tears”. In ancient Greek mythology, gold represented the glory of the immortals. And even historical figures like Sir Isaac Newton believed in the long-discredited pseudo-science of “alchemy,” which aimed to turn basic metals into gold. The history of gold as money dates back to around 550 B.C. and government-issued fiat coins, such as the US dollar, used to be directly linked to gold in a monetary system known as the gold standard. And let’s not forget the statues of the Academy Awards, the World Cup trophy, or the medals for first place in the Olympics. All bright, beautiful, solid gold.

In January 2019 the purchase of gold by central banks reached its peak of the last 50 years, mainly because countries like Russia are changing their reserves from US dollar to gold. At the present time, the world consumption of newly produced gold is around 50% in jewelry, 40% in investments, and 10% in the industry. With 440 tons per year, China is the world’s largest gold-producing country. In January 2019 the purchase of gold by central banks reached its peak of the last 50 years, mainly because countries like Russia are changing their reserves from US dollar to gold.

Silver, on the other hand, remains the second most popular precious metal just behind gold. It is also used for jewelry, as an investment asset, and as an industrial resource. Many investors appreciate silver as an investment, as it tends to be more volatile than gold due to its lower trading volume.

Inflation-Proof Investment and Portfolio Diversification

Analysts have long argued that gold acts as a hedge against inflation and protects investors against market volatility and unpredictability. A general rule is to have 5-10% gold exposure in the portfolio.

For younger investors with higher risk tolerance and higher return expectations, gold might look like a conservative investment. But it can complement and enhance an investor’s overall portfolio by balancing technology-oriented assets with a time-tested commodity.

Gold is both a creator of wealth and a keeper of wealth. As young investors, you have to keep your eyes on the finish line, probably several decades in the future. Since people now live and work longer, long-term investment strategies that include stabilizing asset classes are crucial.

Why Digitize Gold and silver?

Possessing physical gold and silver has always been desirable for many. There is something tangible about it. Its physical quality means that you can see it, feel it, weigh it and admire its beauty. From a golden calf, a golden fleece and gold crowns to streets paved with gold, this metal has constituted a fundamental element of our collective human history and its images have filtered even into our language (for example, “as good as gold”, “worth its weight in gold”, etc.). In a word, gold is timeless.

There are companies that offer the best of both worlds: Purchases and possess digitized physical gold or silver. But you can exchange it with the same convenience and user experience you’re used to with other digital assets.

But possessing physical gold or silver has its disadvantages. You need to visit a gold trader or at least order physical coins or gold bullion at your store. Then you have to take care of security on your own and keep it at home. In case someone comes in and steals it, you need proper insurance and also a special safe to cover it. An alternative is to keep it in a safe deposit box at the bank or on a gold trader, which means you have to move there and pay relatively high commissions for it.

Categories
Forex Daily Topic Forex System Design

Trading Algorithms IX – RSI Failures System

Trading the naked RSI system depicted in this series’s previous video as an overbought/oversold signal generator is too risky, and its long-term results questionable. The system is profitable only in sideways movements. Thus, a trending filter or a detrending step will be needed to avoid the numerous fake signals.

Divergences and Failure swings

Welles Wilder remarks on two ways to trade the RSI: Divergences and Top/Bottom failure swings.

Divergences

A divergence forms when the price makes higher highs (or lower lows), and the RSI makes the opposite move: lower highs (or higher lows). RSI divergences from the oversold area show the market action starts to strengthen, an indication of a potential swing up. In contrast, RSI divergences in the overbought area show weakness and a likely retracement from the current upward movement.

Failures

An RSI Top failure occurs with the following sequence of events:

  1. The RSI forms a pivot high in the overbought area.
  2. An RSI pullback occurs, and an RSI pivot low forms.
  3. A new RSI pivot high forms, which is lower than the previous pivot high

Fig 1 – RSI TOP failures in the EURUSD 4H 2H Chart

An RSI Bottom failure occurs with the following sequence of events:

  1. The RSI forms a pivot low below the oversold area.
  2. An RSI pullback occurs, and an RSI pivot high forms.
  3. A new RSI pivot low forms, which is higher than the previous pivot high.

Fig 2 – RSI Bottom failures in the ETHUSD 1H Chart.

According to Welles Wilder, trading the RSI failure swings can be more profitable than trading the RSI overbought-oversold system. Thus, we will test it.

The RSI Failure algorithm

To create the RSI Failure algorithm, we will need to use the Finite State Machine concept, presented in this series’s seventh video.

The Easylanguage code of the RSI system failure is the following:

inputs:  Price( Close ), Length( 14 ), OverSold( 30 ), Overbought( 70 ), 
takeprofit( 3 ), stoploss( 1 ) ;
variables: state(0), state1 (0), state2(0), state5 (0), state6(0), rsiValue(0),
 var0( 0 ), rsi_Pivot_Hi(0), rsiPivotHiFound(False), 
rsiPivotLoFound (False),rsi_Pivot_Lo(0)  ;

rsiValue = RSI(C,Length);

If rsiValue[1] > rsiValue and rsiValue[1] > rsiValue[2] then
      begin
         rsiPivotHiFound = true;
         rsi_Pivot_Hi= rsiValue[1];
     end

else
     rsiPivotHiFound = False;

If rsiValue[1] < rsiValue and rsiValue[1] < rsiValue[2] then
      begin
         rsiPivotLoFound = true;
        rsi_Pivot_Lo = rsiValue[1];
     end

else
     rsiPivotLoFound = False;

If state = 0 then
      begin
        if rsiPivotHiFound = true and rsi_Pivot_Hi> Overbought then
             state = 1    {a bearih setup begins}
     else
           if rsiPivotLoFound = True and rsi_Pivot_Lo < OverSold then
                 state = 5; {a bullish Setup begins}
     end;

{The Bearish setup}    

If state = 1 then
      begin
         state1 = rsi_Pivot_Hi;
         if rsiValue > state1 then state = 0;
         if rsiPivotLoFound = true then
             state = 2;
     end;
    
If state = 2 then
      begin
         state2 = rsi_Pivot_Lo ;
         if rsiValue > state1 then state = 0;
         if rsiPivotHiFound = true then
         if rsi_Pivot_Hi< 70 then state = 3;
     end;

If state = 3 then
     if rsiValue < state2 then state = 4;

If state = 4 then
      begin
        sellShort this bar on close;
        state = 0;
     end;


{The bullish setup}

If state = 5 then
      begin
       state5 = rsi_Pivot_Lo;
       if rsiValue < state5 then state = 0;
       if rsiPivotHiFound = true then
             state = 6;
     end;


If state = 6 then
      begin
         state6 = rsi_Pivot_Hi;
         if rsiValue < state5 then state = 0;
         if rsiPivotLoFound = true then
             if rsi_Pivot_Lo > OverSold then state = 7;

     end;
           

If state = 7 then
     if rsiValue > state6 then state = 8;

 If state = 8 then
      begin
         buy this bar on close;
         state = 0;
     end;
   

If state > 0 and rsiValue < OverSold then state = 0;
If state > 0 and rsiValue > Overbought then state = 0;    

{The Long position management section}

If marketPosition =1 and close < entryprice - stoploss* avgTrueRange(10) then
    sell this bar on close;

If marketPosition =1 and close < entryPrice + takeprofit* avgTrueRange(10) then
    sell this bar on close;


{The Short position management section}


If marketPosition =-1 and close > entryprice + stoploss* avgTrueRange(10) then
     BuyToCover this bar on close;

If marketPosition =-1 and close < entryPrice - takeprofit* avgTrueRange(10) then
     BuyToCover this bar on close;

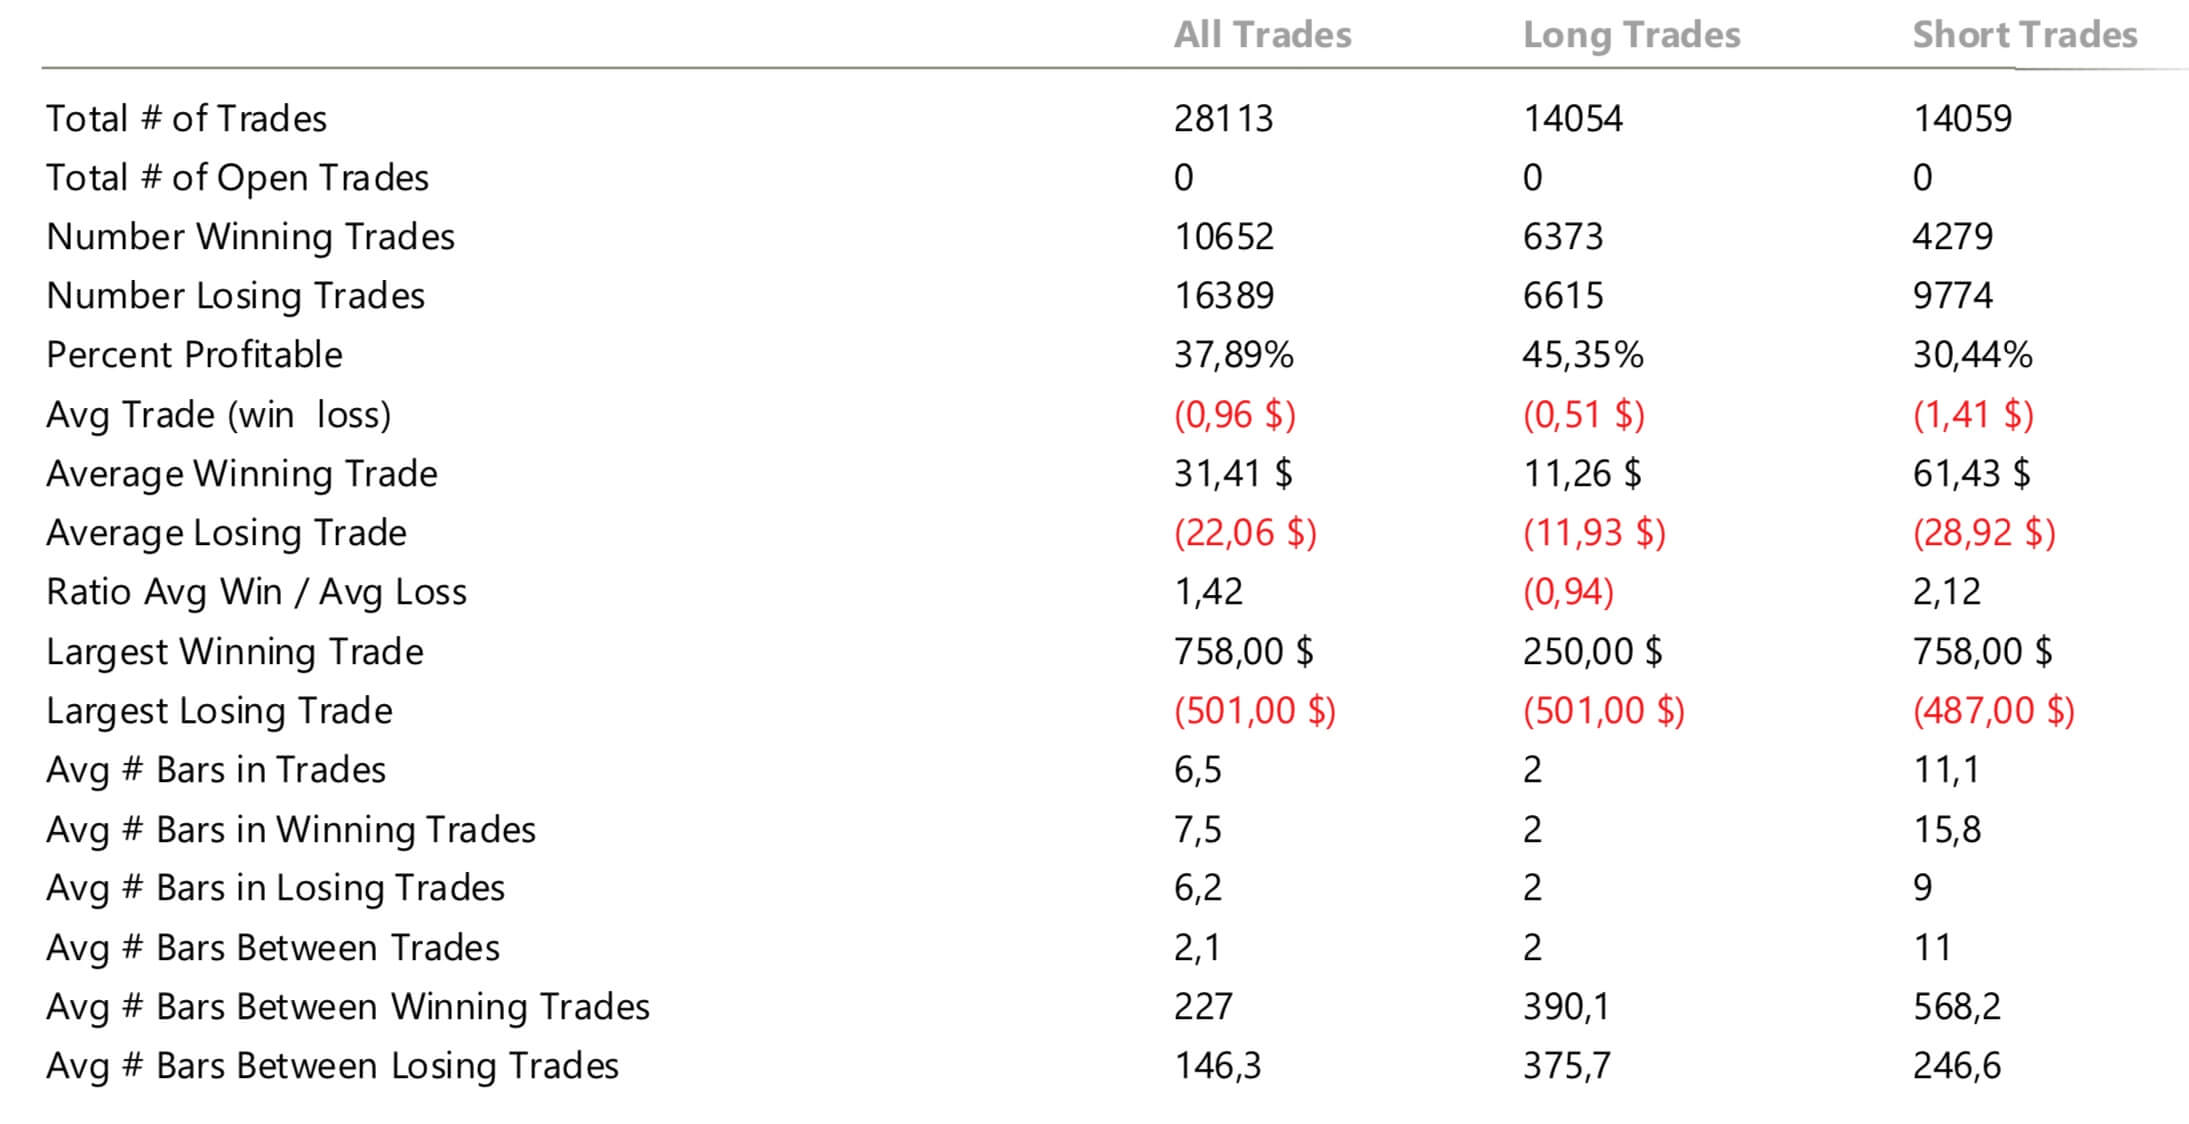
The results, measured on the EURUSD, are not as brilliant as Mr. Welles Wilder stated.

The trade analysis shows that the RSI Failures system, as is, is a losing system. This fact is quite common. It takes time to uncover good ideas for a profitable trading system. In the meantime, we have developed a practical exercise using the finite state machine concept, handy for the future development of our own trading ideas.

Categories
Forex Fundamental Analysis

GBP/CAD Global Macro Analysis – Part 3

GBP/CAD Exogenous Analysis

The UK and Canada Current Account Differential

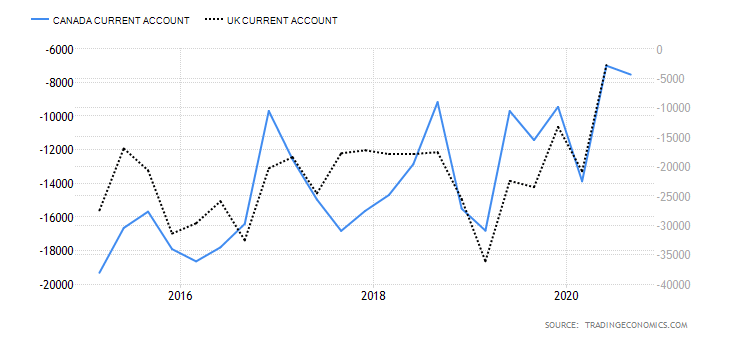
The current account differential between the UK and Canada can determine if the GBP/CAD pair is bullish or bearish. If the differential is positive, it means that the UK has a higher current account balance than Canada. This would imply that the GBP is in higher demand in the forex market than the CAD; hence, it is a bullish trend for the pair. Conversely, if the current account differential is negative, it means that the UK has a lesser current balance than Canada. It would imply that the GBP has a lower demand than the CAD in the forex market; hence, a bearish trend for the pair.

In Q3 of 2020, the UK had a current account deficit of $20.97 billion while Canada had a $5.83 billion deficit. Thus, the current account differential is -$15.14 billion. We assign a score of -2.

The interest rate differential between the UK and Canada

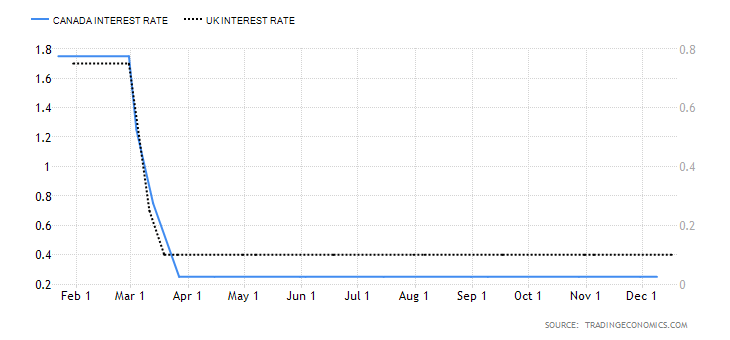
The interest rate differential is the difference between the Bank of England’s interest rate and that by the Bank of Canada. In the forex market, carry traders use the interest rate differential to decide whether to buy or short a currency pair. When the interest rate differential is positive, traders will earn the differential by going long. If the differential is negative, traders can earn the differential by shorting the currency pair.

Therefore, if the GBP/CAD pair’s interest rate differential is positive, the pair is bound to adopt a bullish trend. Conversely, if negative, the pair is bound to be bearish.

In 2020, the interest rate in the UK dropped from 0.75% to 0.1%. In Canada, the BOC cut interest rates from 1.75% to 0.25%. Therefore, the interest rate differential is -0.15%. The interest rate differential between the UK and Canada has a score of -1.

The differential in GDP growth rate between the UK and Canada

This differential measures the changes in the growth rate between the two economies. It is a preferred method of comparison since economies are of different sizes. Naturally, the economy with a higher GDP growth rate will have its currency appreciate more. Therefore, if the GDP growth rate differential is positive, it means that the GBP/CAD pair is bullish. If negative, then the pair is bearish.

During the first three quarters of 2020, the UK economy has contracted by 5.8%, while the Canadian economy has contracted by 3.3%. This makes the GDP growth rate differential -2.5%. Hence, a score of -1.

Conclusion

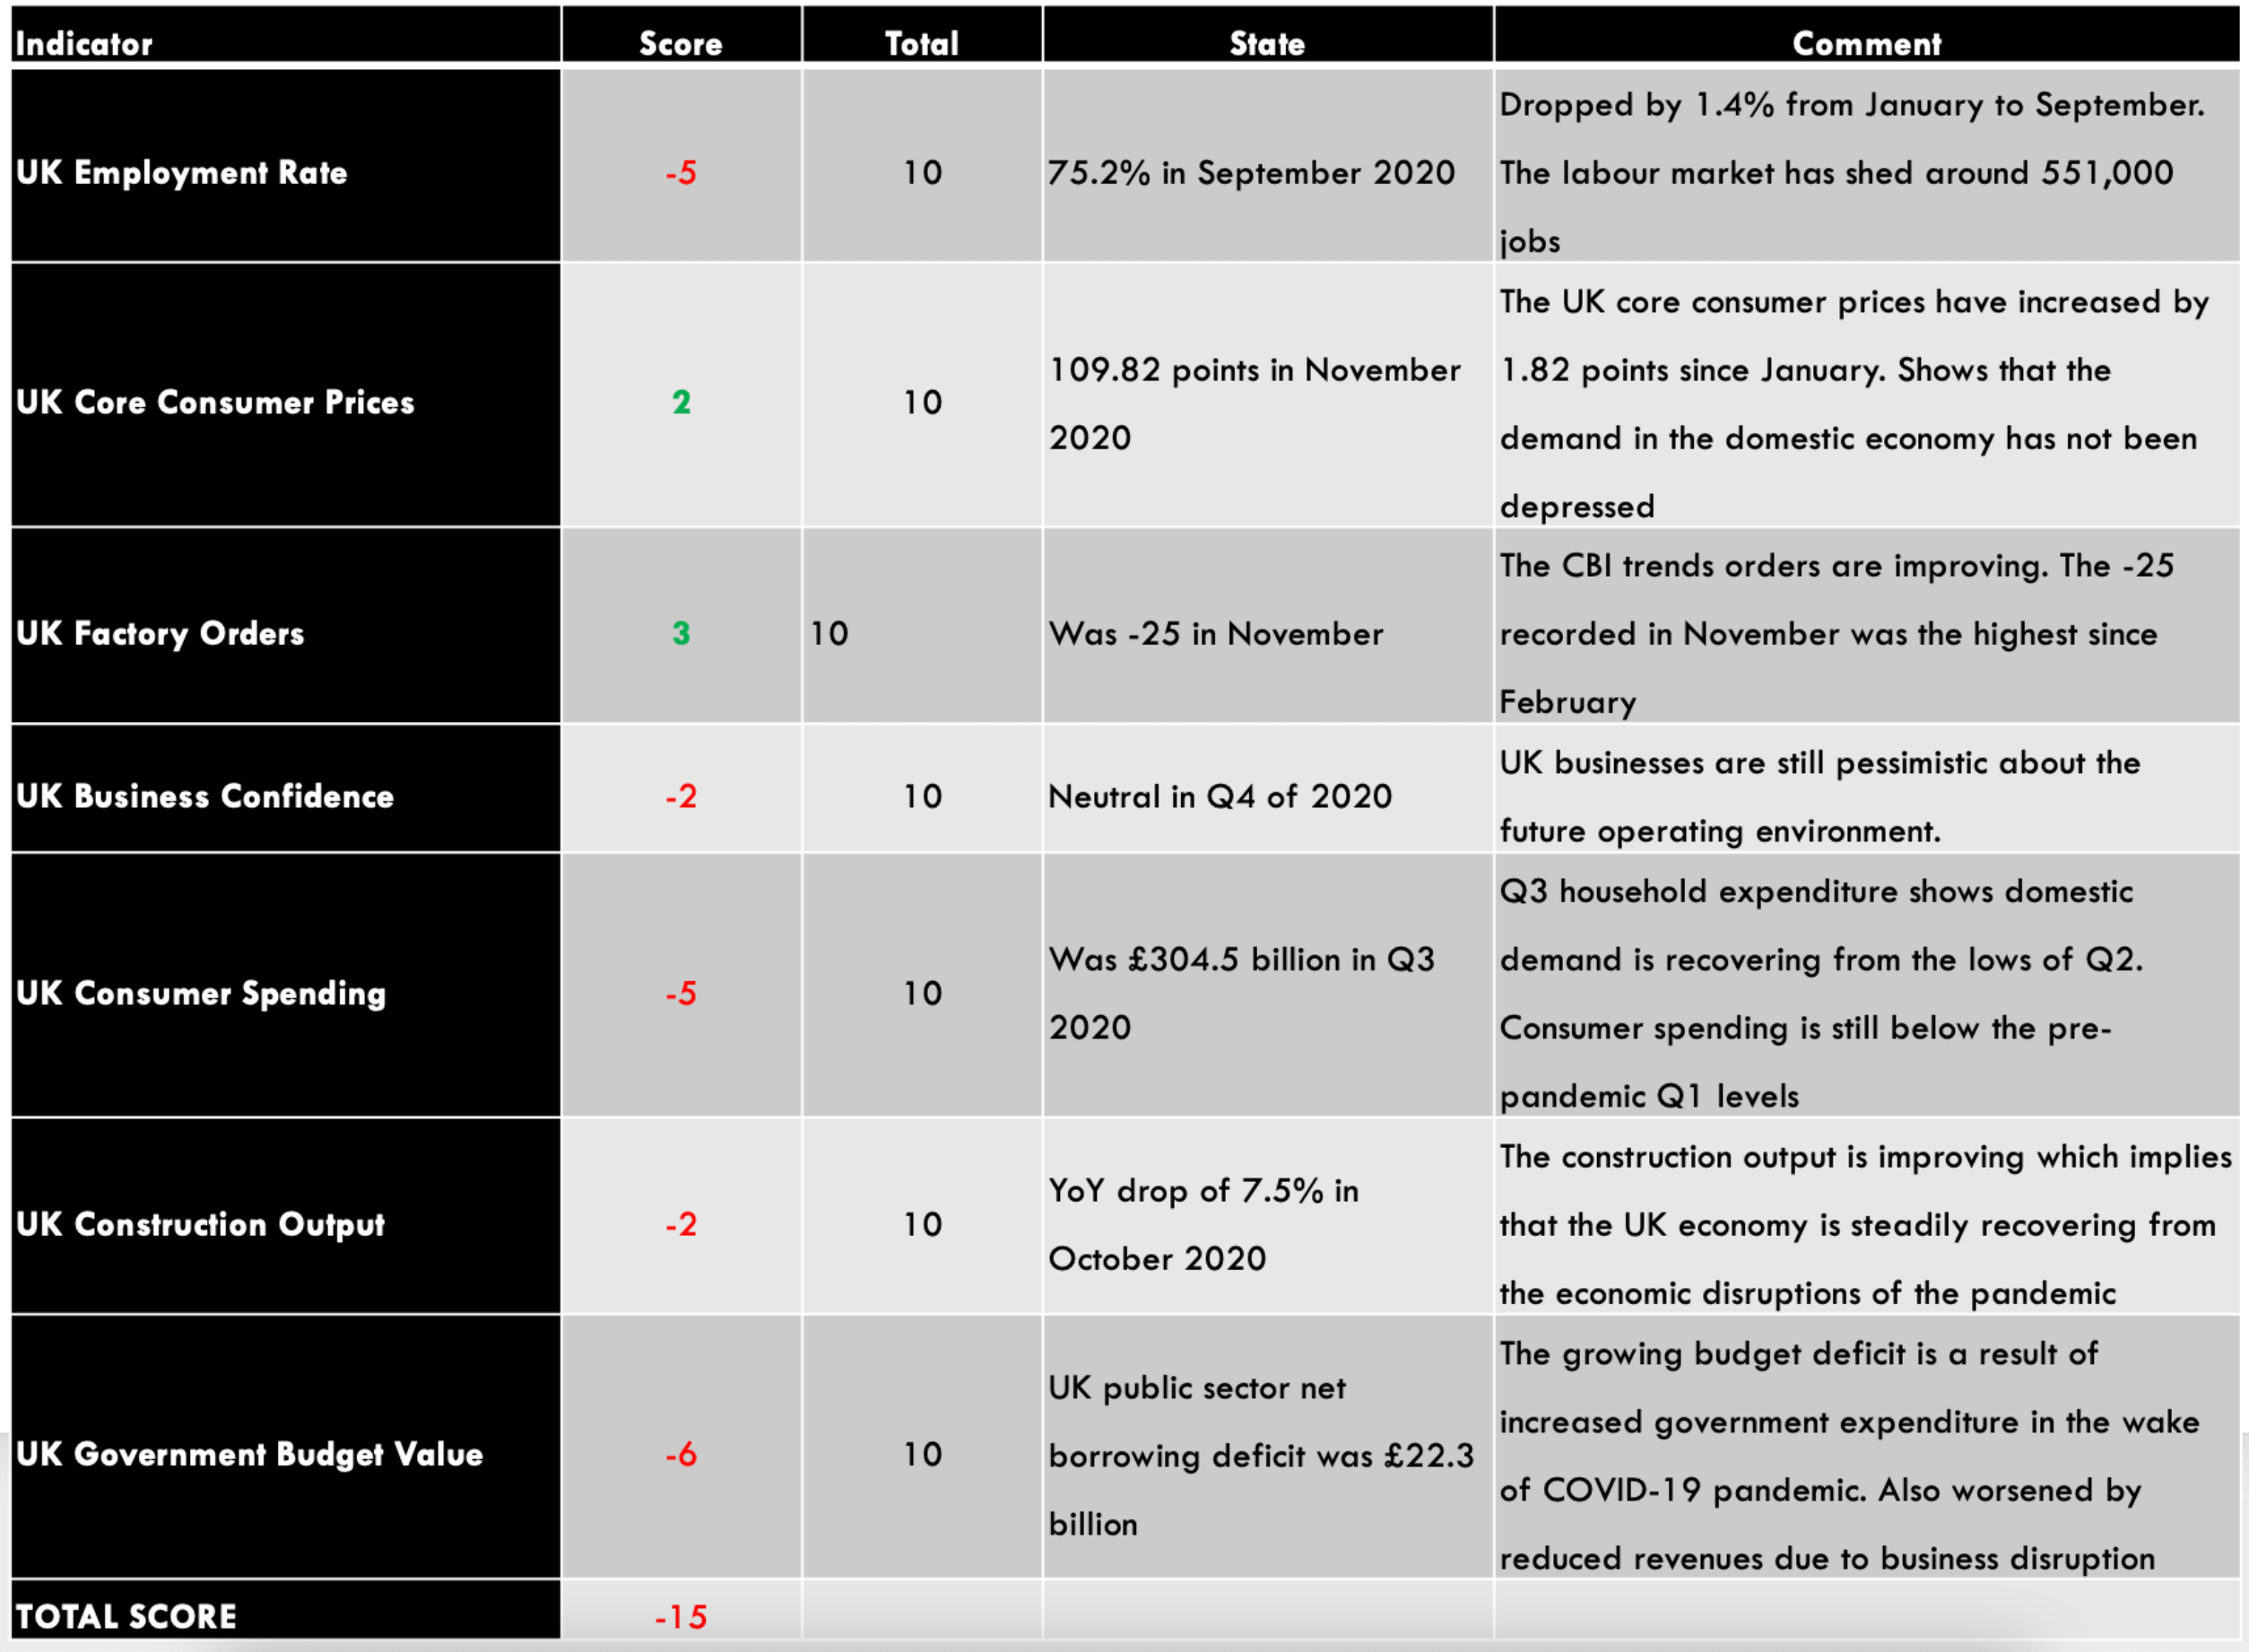
Indicator Score Total State Comment
The UK and Canada Current Account Differential -2 10 A differential of – $15.14 The UK has a higher deficit than Canada
The interest rate differential between the UK and Canada -1 10 -0.15% Expected to remain at -0.15% until either economy have recovered
The differential in GDP growth rate between the UK and Canada -1 10 3.30% The Canadian economy contracted at a slower pace than the UK economy
TOTAL SCORE -4

The cumulative score for the exogenous factors is -4. This means that we can expect the GBP/CAD pair to trade in a downtrend in the short term.

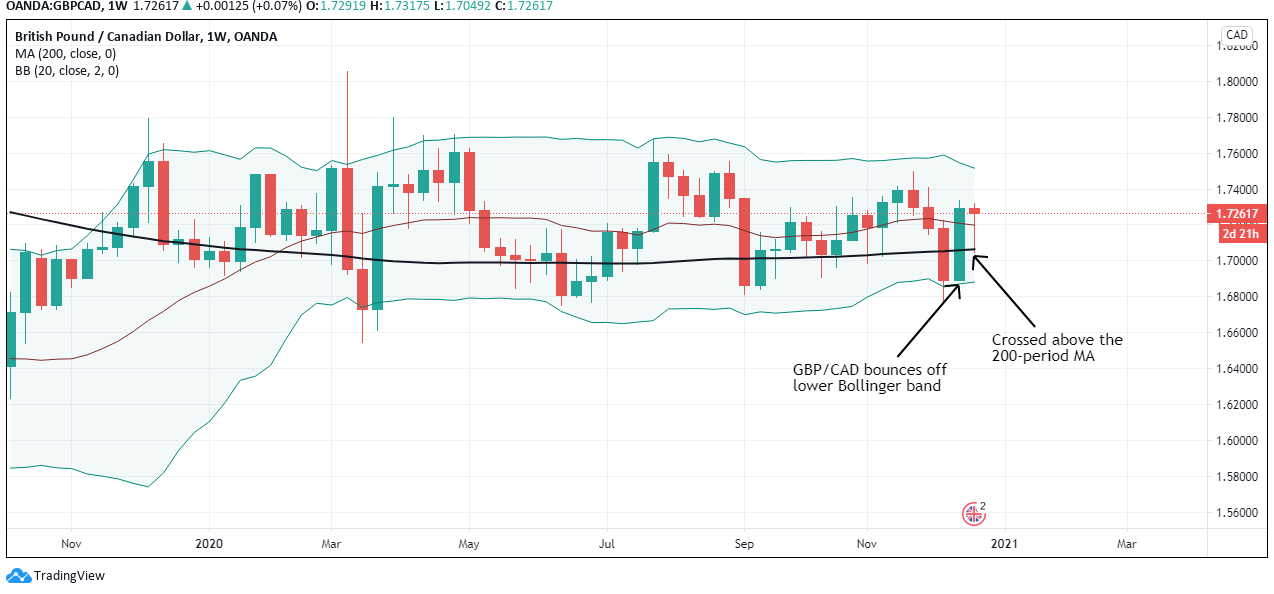
However, technical analysis shows the pair adopting a bullish trend with the weekly chart trading above the 200-period MA. More so, the pair is seen bouncing off the lower Bollinger band. Keep an eye on the near-term changes in the exogenous factors.

Categories
Forex Fundamental Analysis

GBP/CAD Global Macro Analysis – Part 1 & 2

Introduction

This analysis will evaluate the endogenous factors that affect the domestic economy in both the UK and Canada. We’ll also cover exogenous factors that influence the price of the GBP/CAD pair.

Ranking Scale

After analysis, we will rank both the exogenous and the endogenous factors on a scale from -10 to +10.

Endogenous factors will be ranked after a correlation analysis with the GDP growth rate. If negative, it means that either the GBP or the CAD have depreciated. If positive, it means that the domestic currency has appreciated.

The exogenous factors are ranked based on their correlation with the GBP/CAD pair’s exchange rate. When negative, it means that the price will drop. The price will be expected to increase if the exogenous analysis is positive.

Summary – GBP Endogenous Analysis

-15 score on Pound’s Endogenous Analysis indicates that this currency has depreciated since the beginning of 2020.

Summary – CAD Endogenous Analysis

  • Canada Employment Rate

The Canadian employment rate measures the percentage of the labor force that is employed during a particular period. The developments in the labor market are a leading indicator of overall economic growth. When the economy is expanding, there are more job openings, hence a higher employment rate. Conversely, when the economy is going through a recession, businesses close down, leading to a dropping employment rate.

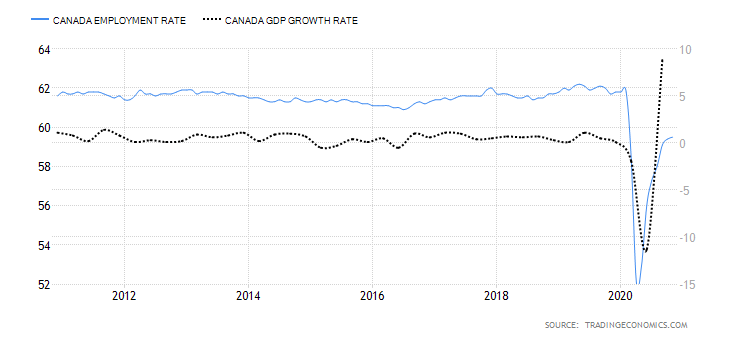
In November 2020, the employment rate in Canada rose to 59.5% from 59.4% in October. Although the employment rate has been steadily increasing from the lows of 52.1% in April, it is still lower than in January. Canada’s employment rate has a score of -6.

  • Canada Core Consumer Prices

This index measures the overall change in Canada’s inflation rate based on a survey of price changes for a basket of consumer goods. The rate of inflation gauges the increase in economic activity. Typically, when demand is depressed in an economy, prices drop, resulting in lower inflation. Conversely, when demand increases, prices tend to increase, resulting in a higher rate of inflation.

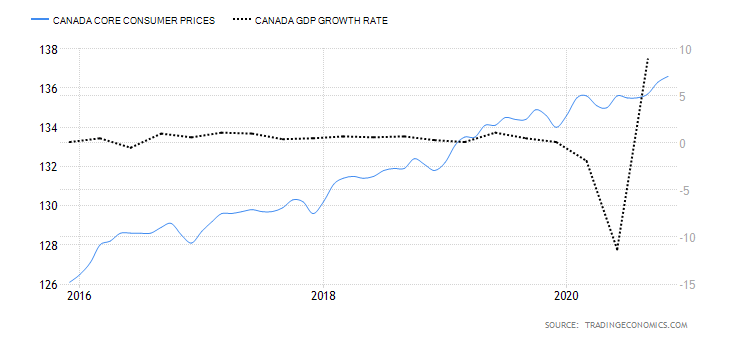
In November 2020, Canada’s core consumer prices rose to 136.6 points from 136.3 in October. Between January and November, the index has increased by 2 points. It has a score of 3.

  • Canada Manufacturing Production

This index measures the YoY change in the value of the output from the Canadian manufacturing sector. Canadian manufacturing is a significant contributor to the labor market and economic growth. In the age of the coronavirus disruption, changes in manufacturing production show how faster the economy is bouncing back.

In September 2020, the YoY manufacturing production in Canada dropped by 4.24%. This is an improvement compared to the 5.34% drop recorded in August. Canadian manufacturing production has a score of -2.

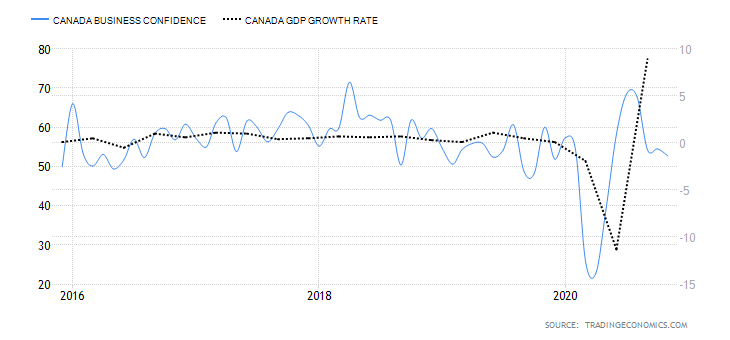
  • Canada Business Confidence

The Ivey Purchasing Managers Index (PMI) measures monthly business confidence in Canada. In the survey, private and public companies rate whether the current business activity is higher or lower than the previous month. The index survey aspects including inventories, purchases, deliveries from suppliers, output prices, and employment.

When the index is over 50, it means that purchases have increased from the preceding month. Reading of below 50 shows a decrease in purchases.

In November 2020, Canadian business confidence dropped to 52.7 from 54.5 in October. This was the lowest reading since May, when the economy began rebounding from the shocks of  COVID-19. Consequently, Canada’s business confidence has a score of 1.

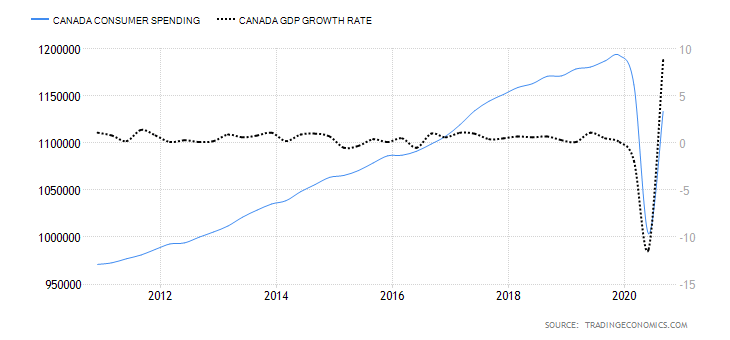
  • Canada Consumer Spending

This measures the final market value of all household expenditures on goods and services. It also includes expenditure by non-profit organizations that serve households in Canada but excludes purchases of homes. Consumer spending plays a critical role in economic growth.

In Q3 of 2020, consumer spending in Canada rose to CAD 1.13 trillion from CAD 1 trillion in Q2. However, it is still lower than consumer spending recorded in Q1. Thus, Canada’s consumer spending has a score of -4.

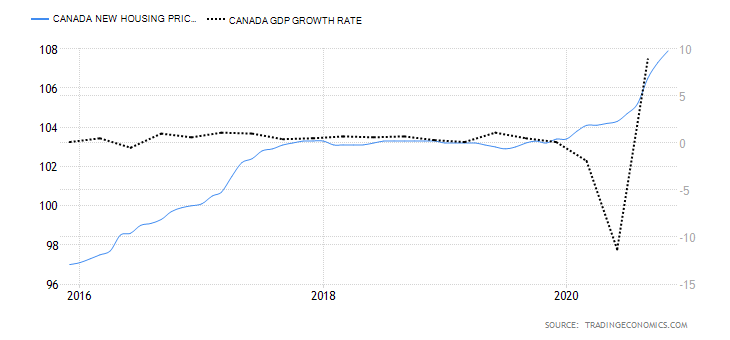
  • Canada New Housing Price Index

The Canadian NHPI measures the changes in the selling price of newly built residential houses. The price measured is that paid by the home buyers to the contractors. Note that the price comparison is strictly between houses of the same specification. The NHPI shows the construction sector’s growth trends; hence, it corresponds to changes in the labor market and GDP growth.

In November 2020, the Canadian NHPI rose to 107.9 from 107.3 in October. Thus, we assign a score of 3.

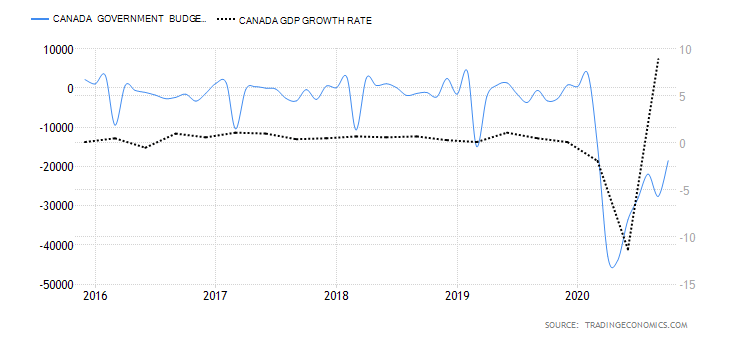
  • Canada Government Budget Value

This indicator tracks the changes in the difference between the Canadian government revenues and expenditures. It shows whether the government is running a surplus or a deficit. It also breaks down the changes in the receipts by the government. This helps to show how the overall economy is fairing.

In October 2020, the Canadian government budget had a deficit of CAD 18.51 billion compared to CAD 27.59 billion in September. Throughout the year, the budget deficits have been due to the economic shocks brought on by the coronavirus pandemic. The Canadian government had to ramp up expenditure through its Economic Response Plan, while revenues dropped in the same period. We assign it a score of -5.

Conclusion

Indicator Score Total State Comment
Canada Employment Rate -6 10 59.5% in November 2020 The employment rate is steadily increasing. It is, however, still below January levels
Canada Core Consumer Prices 3 10 136.6 points in November 2020 Since January, it has increased by 2 points. That shows demand in the economy has kept prices higher
Canada Manufacturing Production -2 10 YoY dropped by 4.24% in September 2020 A slight increase from -5.34% recorded in August. This shows that the manufacturing production is returning to the pre-pandemic levels
Canada Business Confidence 1 10 52.7 in November November level was the lowest since the economy began to recover in May. It’s expected to improve as mass vaccinations against COVID-19 rolls out
Canada Consumer Spending -4 10 Was CAD 1.13 trillion Q3 2020 Recovered from CAD 1 trillion in Q2 but still lower than Q1. This shows that demand is increasing in the economy
Canada New Housing Price Index 3 10 November NHPI was 107.9 It has been increasing, which shows that output in the construction industry is improving
Canada Government Budget Value -5 10 a budget deficit of CAD 18.51 billion in October The deficit widened in 2020, driven by unprecedented fiscal policies to curb recessionary pressure from the pandemic
TOTAL SCORE -10

A score of -10 indicates that the CAD has depreciated since the beginning of the year 2020.

In the next article, you can find the exogenous analysis of GBP/CAD where we have forecasted this pair’s future price movements. Cheers.

GBP/CAD Exogenous Analysis

  • The UK and Canada Current Account Differential

The current account differential between the UK and Canada can determine if the GBP/CAD pair is bullish or bearish. If the differential is positive, it means that the UK has a higher current account balance than Canada. This would imply that the GBP is in higher demand in the forex market than the CAD; hence, it is a bullish trend for the pair. Conversely, if the current account differential is negative, it means that the UK has a lesser current balance than Canada. It would imply that the GBP has a lower demand than the CAD in the forex market; hence, a bearish trend for the pair.

In Q3 of 2020, the UK had a current account deficit of $20.97 billion while Canada had a $5.83 billion deficit. Thus, the current account differential is -$15.14 billion. We assign a score of -2.

The interest rate differential is the difference between the Bank of England’s interest rate and that by the Bank of Canada. In the forex market, carry traders use the interest rate differential to decide whether to buy or short a currency pair. When the interest rate differential is positive, traders will earn the differential by going long. If the differential is negative, traders can earn the differential by shorting the currency pair.

Therefore, if the GBP/CAD pair’s interest rate differential is positive, the pair is bound to adopt a bullish trend. Conversely, if negative, the pair is bound to be bearish.

In 2020, the interest rate in the UK dropped from 0.75% to 0.1%. In Canada, the BOC cut the interest rate from 1.75% to 0.25%. Therefore, the interest rate differential is -0.15%. The interest rate differential between the UK and Canada has a score of -1.

  • The differential in GDP growth rate between the UK and Canada

This differential measures the changes in the growth rate between the two economies. It is a preferred method of comparison since economies are of different sizes. Naturally, the economy with a higher GDP growth rate will have its currency appreciate more. Therefore, if the GDP growth rate differential is positive, it means that the GBP/CAD pair is bullish. If negative, then the pair is bearish.

During the first three quarters of 2020, the UK economy has contracted by 5.8%, while the Canadian economy has contracted by 3.3%. This makes the GDP growth rate differential -2.5%. Hence, a score of -1.

Conclusion

Indicator Score Total State Comment
The UK and Canada Current Account Differential -2 10 A differential of – $15.14 The UK has a higher deficit than Canada
The interest rate differential between the UK and Canada -1 10 -0.15% Expected to remain at -0.15% until either economy have recovered
The differential in GDP growth rate between the UK and Canada -1 10 3.30% The Canadian economy contracted at a slower pace than the UK economy
TOTAL SCORE -4


The cumulative score for the exogenous factors is -4. This means that we can expect the GBP/CAD pair to trade in a downtrend in the short term. However, technical analysis shows the pair adopting a bullish trend with the weekly chart trading above the 200-period MA. More so, the pair is seen bouncing off the lower Bollinger band.

Keep an eye on the near-term changes in the exogenous factors.


Categories
Uncategorised

Daily F.X. Analysis, January 29 – Europe’s GDP’s / Consumer Sentiment + Join Forex Academy’s Telegram Signal Channel! 

Dear traders,

We are moving signals from website to telegram channel. If you enjoyed our signals and want to continue to receive ing them, please subscribe to our telegram channel:

The German Prelim GDP q/q, French Flash GDP q/q, and Spanish Flash GDP q/q report will remain in highlights today on the news front. Later Revised UoM Consumer Sentiment and Pending Home Sales m/m can drive market movements today.

Economic Events to Watch Today  


EUR/USD – Daily Analysis

The EUR/USD closed at 1.21220 after placing a high of 1.21422 and a low of 1.20806. The EUR/USD pair remained higher on Thursday amid the broad-based U.S. dollar weakness and the positive macroeconomic data from the European side. Behind the gradual upward momentum in EUR/USD pair was the U.S. dollar’s weakness driven by the improvement in the market’s appetite for risk. The U.S. Dollar Index that measures the greenback’s value against major currencies dropped by 0.3% and weighed on the U.S. dollar, supporting the upward momentum in EUR/USD pair on Thursday.

On the data front, from the U.S. side, at 18:30 GMT, the Advance GDP for the quarter declined to 4.0% against the forecasted 4.2% and weighed on the U.S. dollar that capped further gains in EUR/USD pair. The Unemployment Claims from last week were declined to 847K against the forecasted 880K and supported the U.S. dollar that also limited the upward momentum in EUR/USD pair. The Goods Trade Balance from December declined to -82.58B from the forecasted -83.4B and supported U.S. dollar. For December, the Prelim Wholesale Inventories also fell to 0.1% against the forecasted 0.5% and supported the U.S. dollar.

At 18:32 GMT, the Advance GDP Price Index for the quarter declined to 2.0% against the forecasted 2.2% and weighed on the U.S. dollar hat added further gains in EUR/USD pair. At 20:00 GMT, the C.B. Leading Index for December came in line with a 0.3% forecast. In December from the U.S., the New Home Sales declined to 842K against the forecasted 860K and weighed on U.S. dollar to and pushed the EUR.USD pair are even higher.

From the European side, the German Prelim CPI in January raised to 0.8% against the expected 0.4% and supported Euro that ultimately pushed EUR/USD pair higher. At 13:00 GMT, the Spanish Unemployment Rate dropped to 16.1% against the expected 16.7% and supported Euro to add further gains in EUR/USD pair on Thursday. 

Moreover, Wall Street suffered its biggest one-day percentage decline in three months overnight, with declines accelerated in the wake of the U.S. Federal Reserve’s policy statement. The Fed signaled a worrying slowdown in the pace of recovery of the world’s top economy and sworn continued support until a full economic rebound was in place. This also weighed on the U.S. dollar and supported an upward momentum in EUR/USD pair.


Daily Technical Levels

Support   Resistance

1.2054      1.2167

1.1999     1.2225

1.1940      1.2280

Pivot point: 1.2112

EUR/USD– Trading Tip

The direct currency pair EUR/USD is trading with a bearish bias at 1.2090, facing immediate resistance at 1.2132 level. The EUR/USD is again forming three black crows on the hourly chart, dispensing the selling trend in the EURUSD pair. On the downside, the pair is expected to go after the 1.2090 and 1.2055 level. The 50 periods EMA are signaling the selling trend in Euro today. Violation of 1.2050 will determine long term trend.


GBP/USD – Daily Analysis

The GBP/USD closed at 1.37267 after placing a high of 1.37458 and a low of 1.36299. The U.S. dollar’s fresh weakness and the rise in British Pound against other major currencies lifted the currency pair GBP/USD on Thursday. Prime Minister Boris Johnson announced no schools until 8-March and laid out a lengthy exit strategy from the lockdown this week. However, a detailed plan will be out on the week of February 22. This showed that Johnson may have learned from past promises and was now going wrong on the side of caution. Because people were expecting an earlier exit from the restrictions and this announcement killed their expectations.

In December, Johnson rejected calls for a lockdown and refused to cancel Christmas, only to back down several days later. However, the U.K. has been vaccinating its population rapidly, which should have led to the lifting restrictions not extending them. Despite all these lockdown developments in the U.K., the British Pound remained amongst the top three best performing G10 currencies on Thursday and supported the upward momentum in GBP/USD pair.

On the data front, from the U.S. side, at 18:30 GMT, the Advance GDP for the quarter fell to 4.0% against the anticipated 4.2% and weighed on the U.S. dollar that added more gains in GBP/USD pair. The Unemployment Claims from last week dipped to 847K against the anticipated 880K, supported the U.S. dollar, and capped further GBP/USD pair gains. The Goods Trade Balance fell to -82.58B from the anticipated -83.4B and supported the U.S. dollar from December. The Prelim Wholesale Inventories for December also fell to 0.1% against the anticipated 0.5% and supported the U.S. dollar. 

At 18:32 GMT, the Advance GDP Price Index for the quarter fell to 2.0% against the anticipated 2.2% and weighed on the U.S. dollar that pushed the currency pair GBP/USD higher. At 20:00 GMT, the C.B. Leading Index for December came in line with the anticipation of 0.3%. The New Home Sales in December from the U.S. fell to 842K against the anticipated 860K and weighed on the U.S. dollar and supported the rising prices of the GBP/USD pair.

The declining GDP numbers from the world’s largest economy in the last quarter of 2020 added weight on the local currency U.S. dollar and supported the GBP/USD pair’s rising prices on Thursday. Furthermore, the market’s risk sentiment was somehow supported by the rally in precious metals markets triggered by speculation that retail traders who had been focusing on pumping stocks like GameStop were now turning their focus to silver. The rising risk sentiment in the market also helped the risk perceived GBP/USD pair rise on Thursday.


Daily Technical Levels

Support   Resistance

1.3643      1.3746

1.3600      1.3804

1.3541      1.3848

Pivot point: 1.3702

GBP/USD– Trading Tip

A day before, the GBP/USD pair traded bullish after violating the narrow trading range of 1.3680 – 1.3670. It placed a high of around 1.3753 level, and it later reversed back to trade between the same trading range of 1.3696 – 1.3646. The GBP/USD may find support around the 1.3647 level, and violation of this level can extend selling bias until 1.3610. Approaching the 2-hour timeframe, the GBP/USD is holding below 10 and 20 periods EMA, and it may extend the selling trend today. Let’s consider taking a sell trade until 1.3645 and 1.361 level.  


USD/JPY – Daily Analysis

The USD/JPY pair was closed at 104.259 after placing a high of 104.460 and a low of 104.053. The currency pair USD/JPY extended its gains on Thursday amid the pickup in risk appetite in the market that drove weakness in both the U.S. dollar and Japanese Yen versus most of their major G10 counterparts due to their safe-haven status. 

However, nominal U.S. yields rose on Thursday, with U.S. Treasury yields on the 10-year note up more than 4bps at 1.06%. It drove an increase in U.S./Japanese rate differentials that favor Japanese Yen flows into the U.S. dollar, supporting the currency pair USD/JPY. On the data front, at 04:50 GMT, the Retail Sales from Japan in December dropped to -0.3% against the expected -0.4% and supported Japanese Yen, and capped further upside in the USD/JPY pair.

From the U.S. side, at 18:30 GMT, the Advance GDP for the quarter decreased to 4.0% against the projected 4.2% and weighed on the U.S. dollar and limited further upside momentum in the USD/JPY pair. Last week, the Unemployment Claims decreased to 847K against the projected 880K and supported the U.S. dollar that added further gains in the USD/JPY pair. The Goods Trade Balance from December decreased to -82.58B from the projected -83.4B and supported the U.S. dollar and pushed the currency pair USD/JPY higher.

 For December, the Prelim Wholesale Inventories also decreased to 0.1% against the projected 0.5% and supported the U.S. dollar that extended gains in the USD/JPY pair. At 18:32 GMT, the Advance GDP Price Index for the quarter decreased to 2.0% against the projected 2.2% and weighed on the U.S. dollar and capped further upside in the USD/JPY pair. At 20:00 GMT, the C.B. Leading Index for December came in line with the projection of 0.3%. In December from the U.S., the New Home Sales decreased to 842K against the projected 860K and weighed on the U.S. dollar and capped further gains in the USD/JPY pair.

Risk appetite in the market took a meaningful turn on Thursday, with U.S. equities erasing losses incurred on Wednesday leading up to the FOMC monetary policy decision event. The ultra-dovish tone of the Federal Reserve was actually seen as positive for the risk appetite as Wednesday’s risk-off was a result of overvaluation fears as well as because of the short-selling hedge funds being forced to liquidate profitable large-cap stock long positions as speculative retail trade-driven mania continued in the likes of GameStop. Furthermore, another reason behind the rising USD/JPY pair prices was that the U.S. stimulus package proposed by Joe Biden did not receive approval from Republicans as of yet. This also supported the U.S. dollar that ultimately added gains in the USD/JPY pair.


Daily Technical Levels

Support   Resistance

103.71      104.34

103.33      104.58

103.09      104.96

Pivot point: 103.96

USD/JPY – Trading Tips

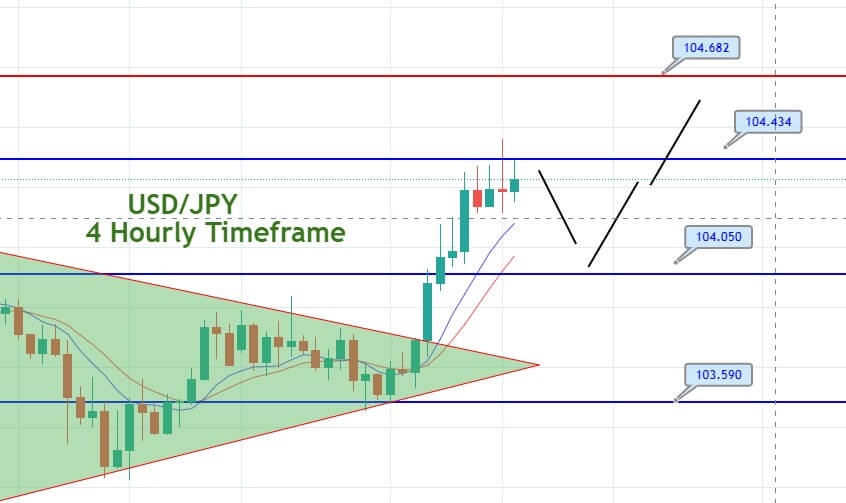
On Friday, the USD/JPY pair is trading with a bullish bias at 104.475, and it has violated the resistance level of 104.385. It’s likely to lead the USD/JPY pair until the 104.745 level. On the lower side, the USD/JPY may find support at the 104.300 level. The USD/JPY pair is likely to stay bullish as MACD and EMA suggest bullish bias in the USD/JPY pair on the four hourly timeframes. We can expect USDJPY to bounce off upon 104.300 to continue buying trend today. Good luck! 

Categories
Forex Signals

USD/JPY Double Top Pattern Set to Drive Selling – Signal Update! 

The USD/JPY pair is trading with a bullish bias at 104.350, and violation of this level is likely to lead the USD/JPY pair until the 104.745 level. On the lower side, the USD/JPY may find support at the 104.198 level. We can expect USDJPY to bounce off upon the 104.198 level today. On the 4 hour timeframe, the USDJPY pair is likely to close a doji candle below 104.368 level. If this happens, we may see a bearish correction in the USD/JPY pair. 


Entry Price – Sell 104.22

Stop Loss – 104.62

Take Profit – 103.82

Risk to Reward – 1:1

Profit & Loss Per Standard Lot = -$400/ +$400

Profit & Loss Per Micro Lot = -$40/ +$40

Fellas, now you can check out forex trading signals via Forex Academy mobile app. Follow the links below.

iPhone Users: https://apps.apple.com/es/app/fasignals/id1521281368

Andriod Users: https://play.google.com/store/apps/details?id=academy.forex.thesignal&hl=en_US

Categories
Forex Videos

Beginners – Analysis Feature of MT4 Helps You Fund A Trading Strategy!


Beginners: analysis feature of MT4 to help find a trading strategy

Thank you for joining this forex academy educational video. 

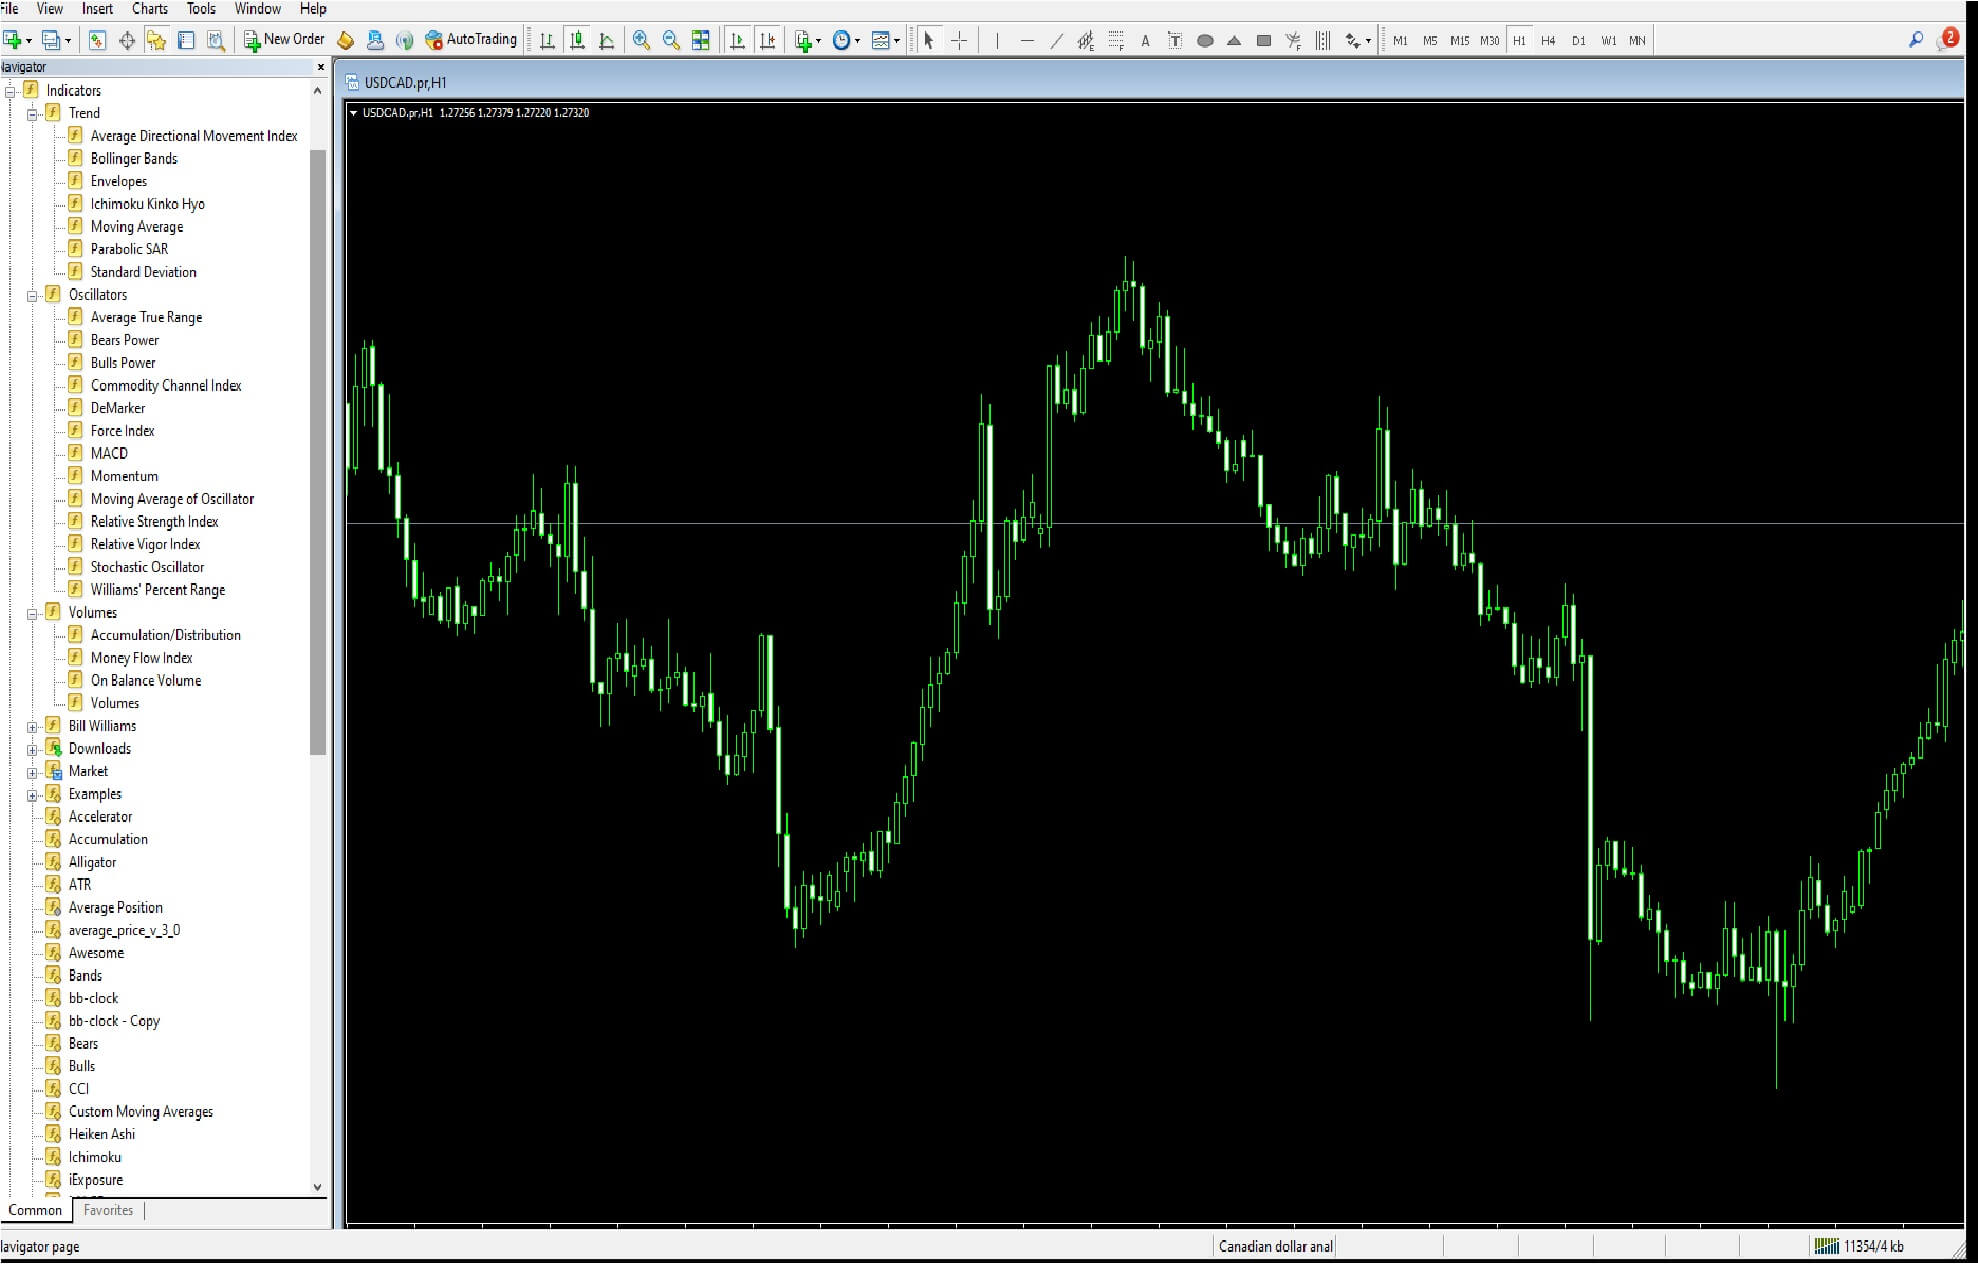
In this session, we will be looking at an analysis feature of the MT4 platform, which helps traders to find a winning trading strategy.

The Metatrader mt4 platform is one of the widest the most available trading platforms on earth.  It is fully customisable….

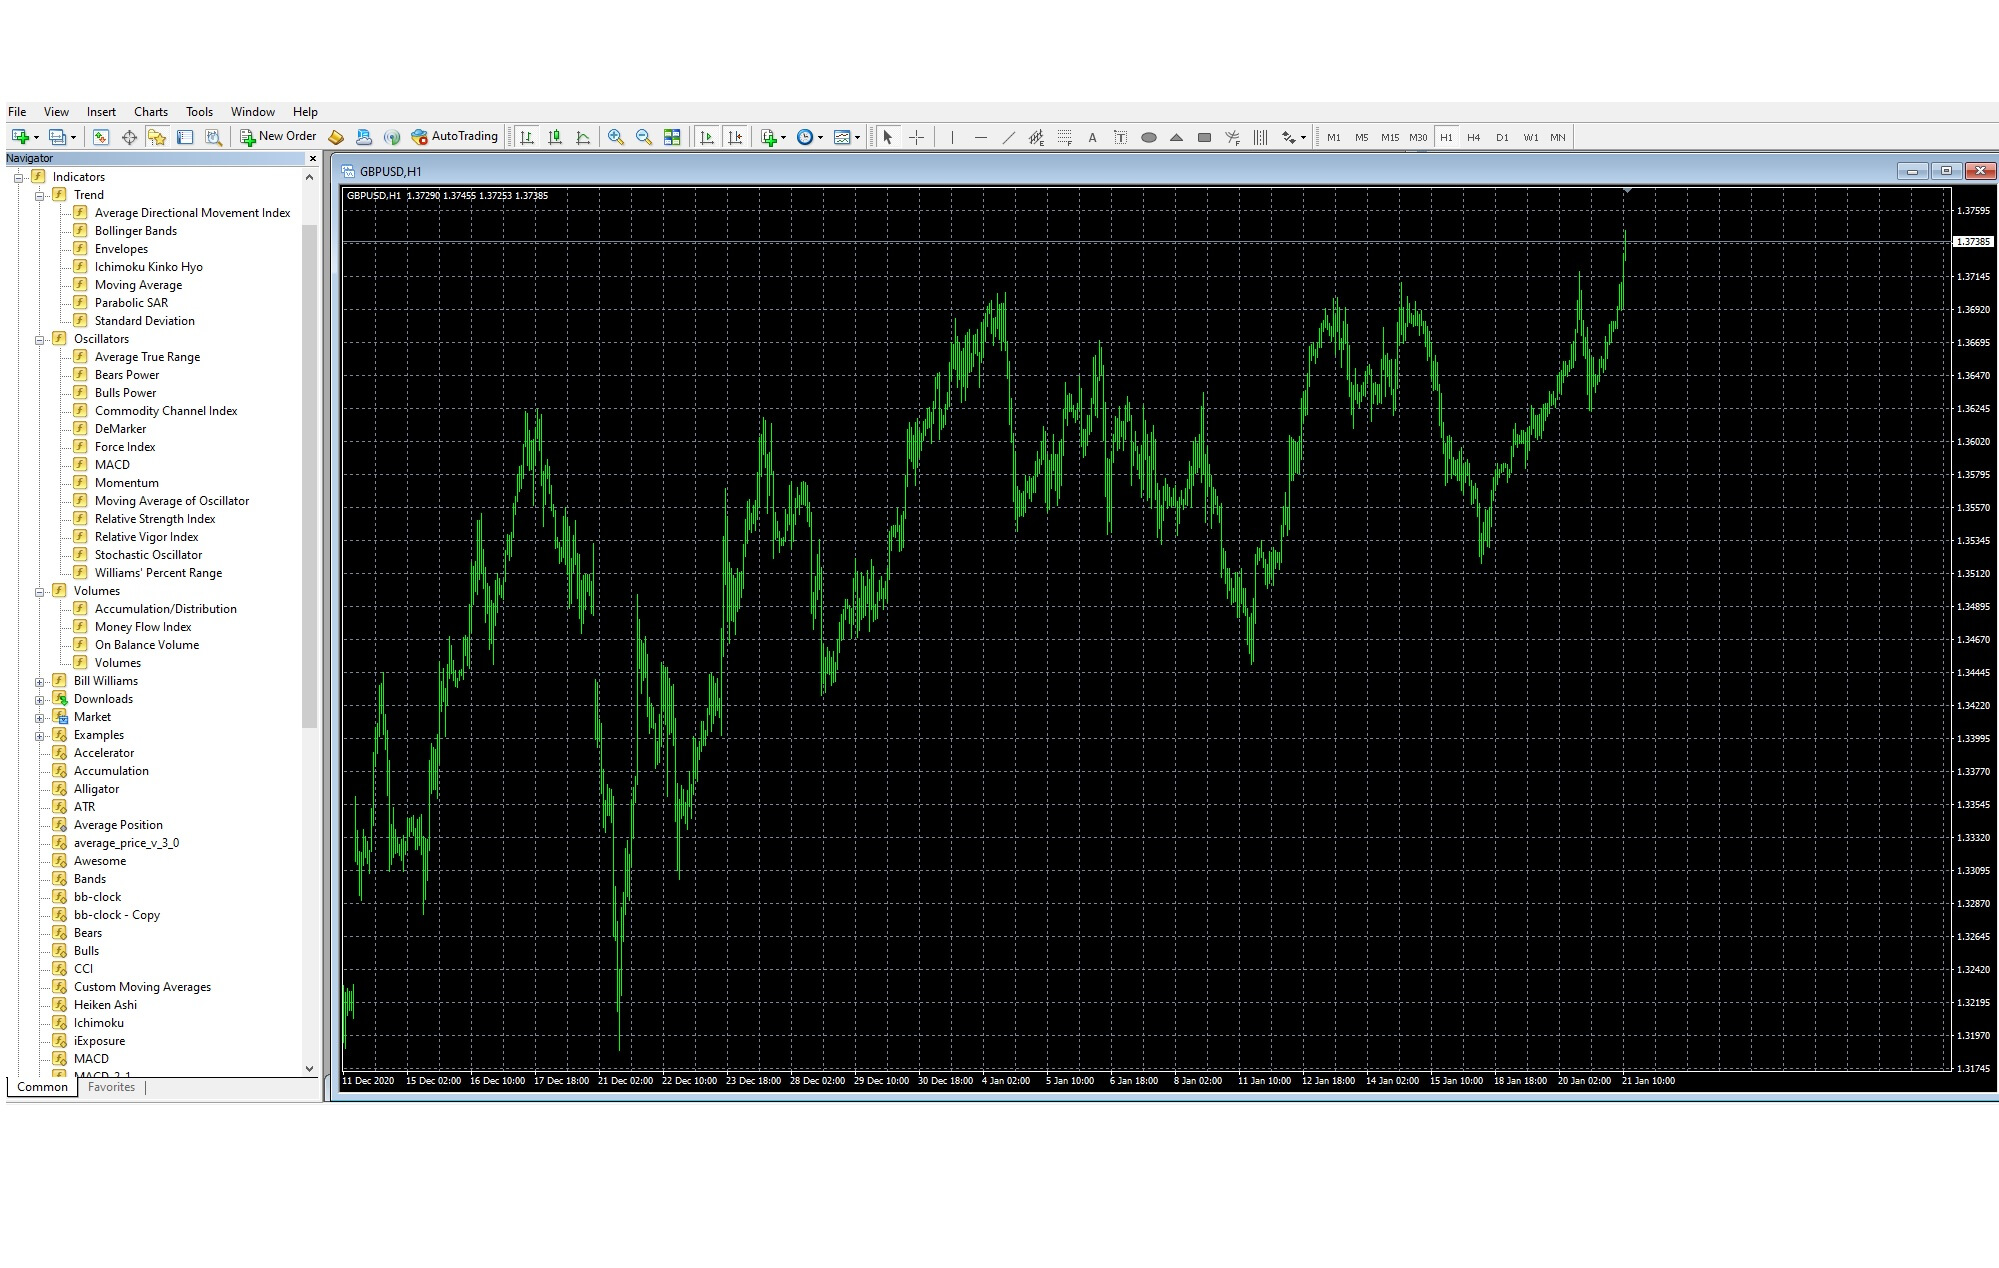
And there are a host of technical analysis tools available in the Navigator section, which are freely available from most brokers, and which can be added to, either freely found ones on the internet or paid tools, which can be mostly found on the mql5 website.

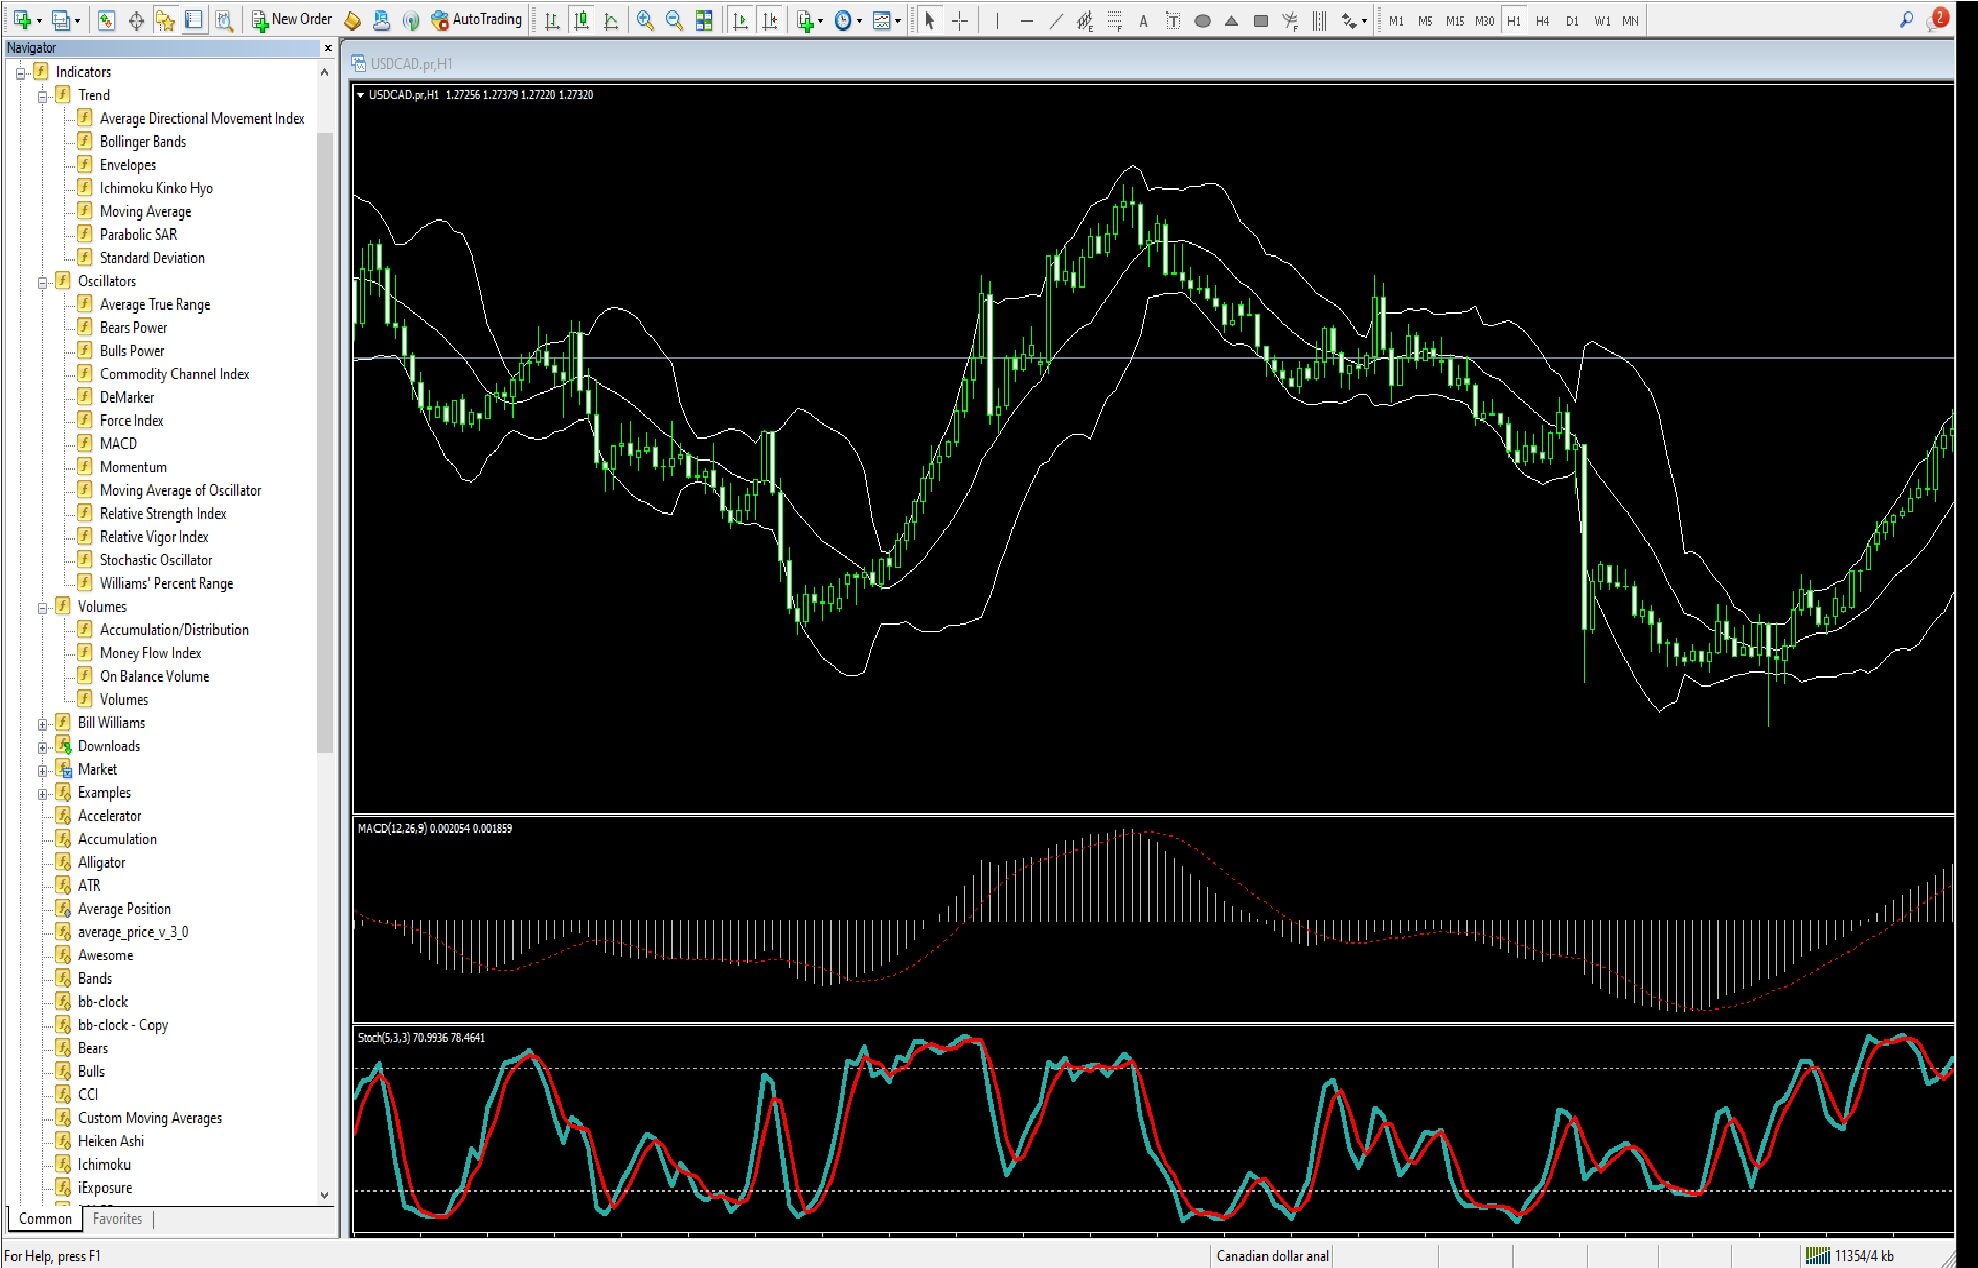
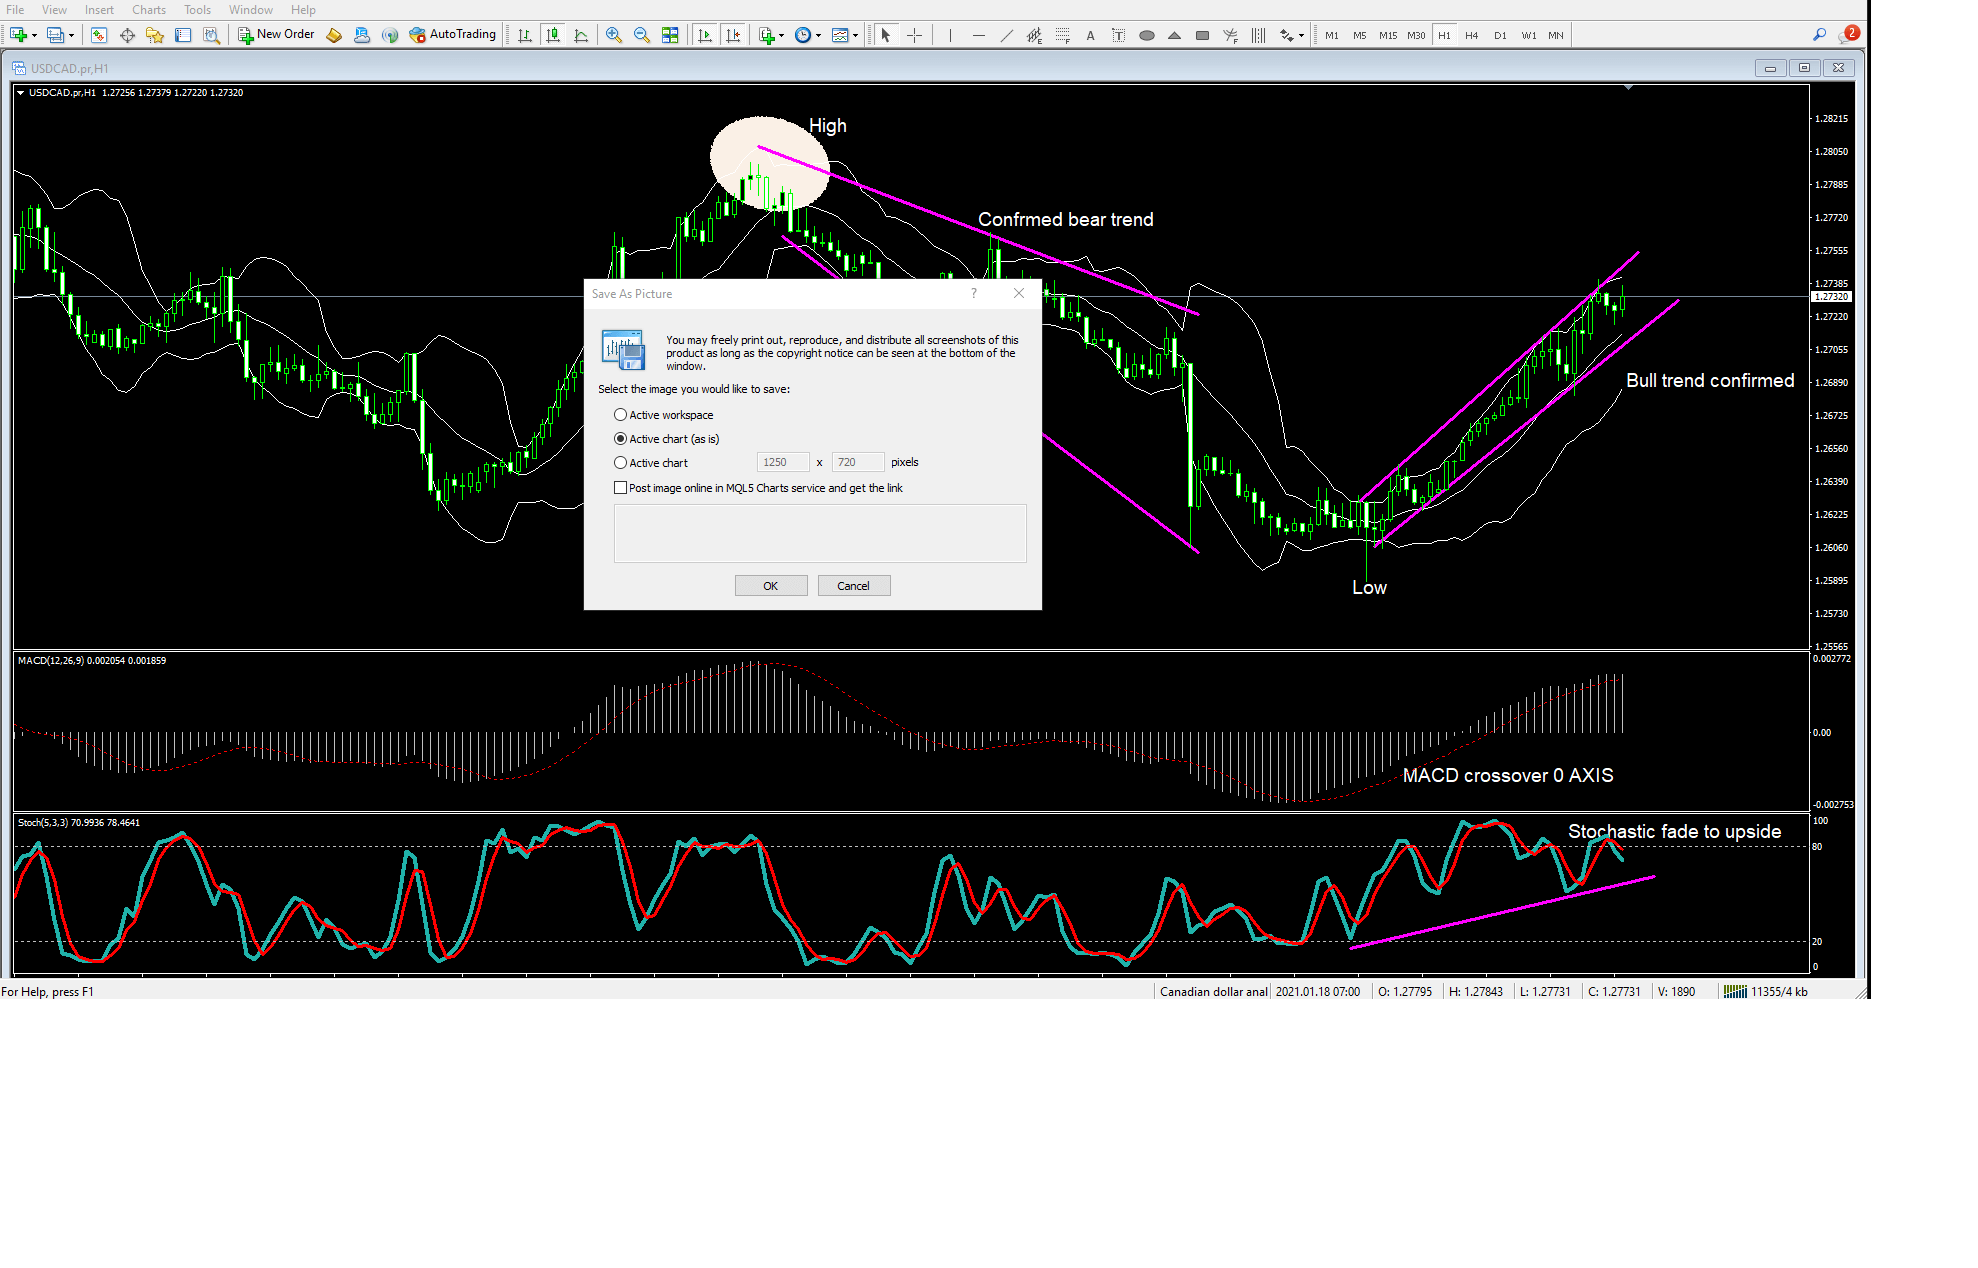
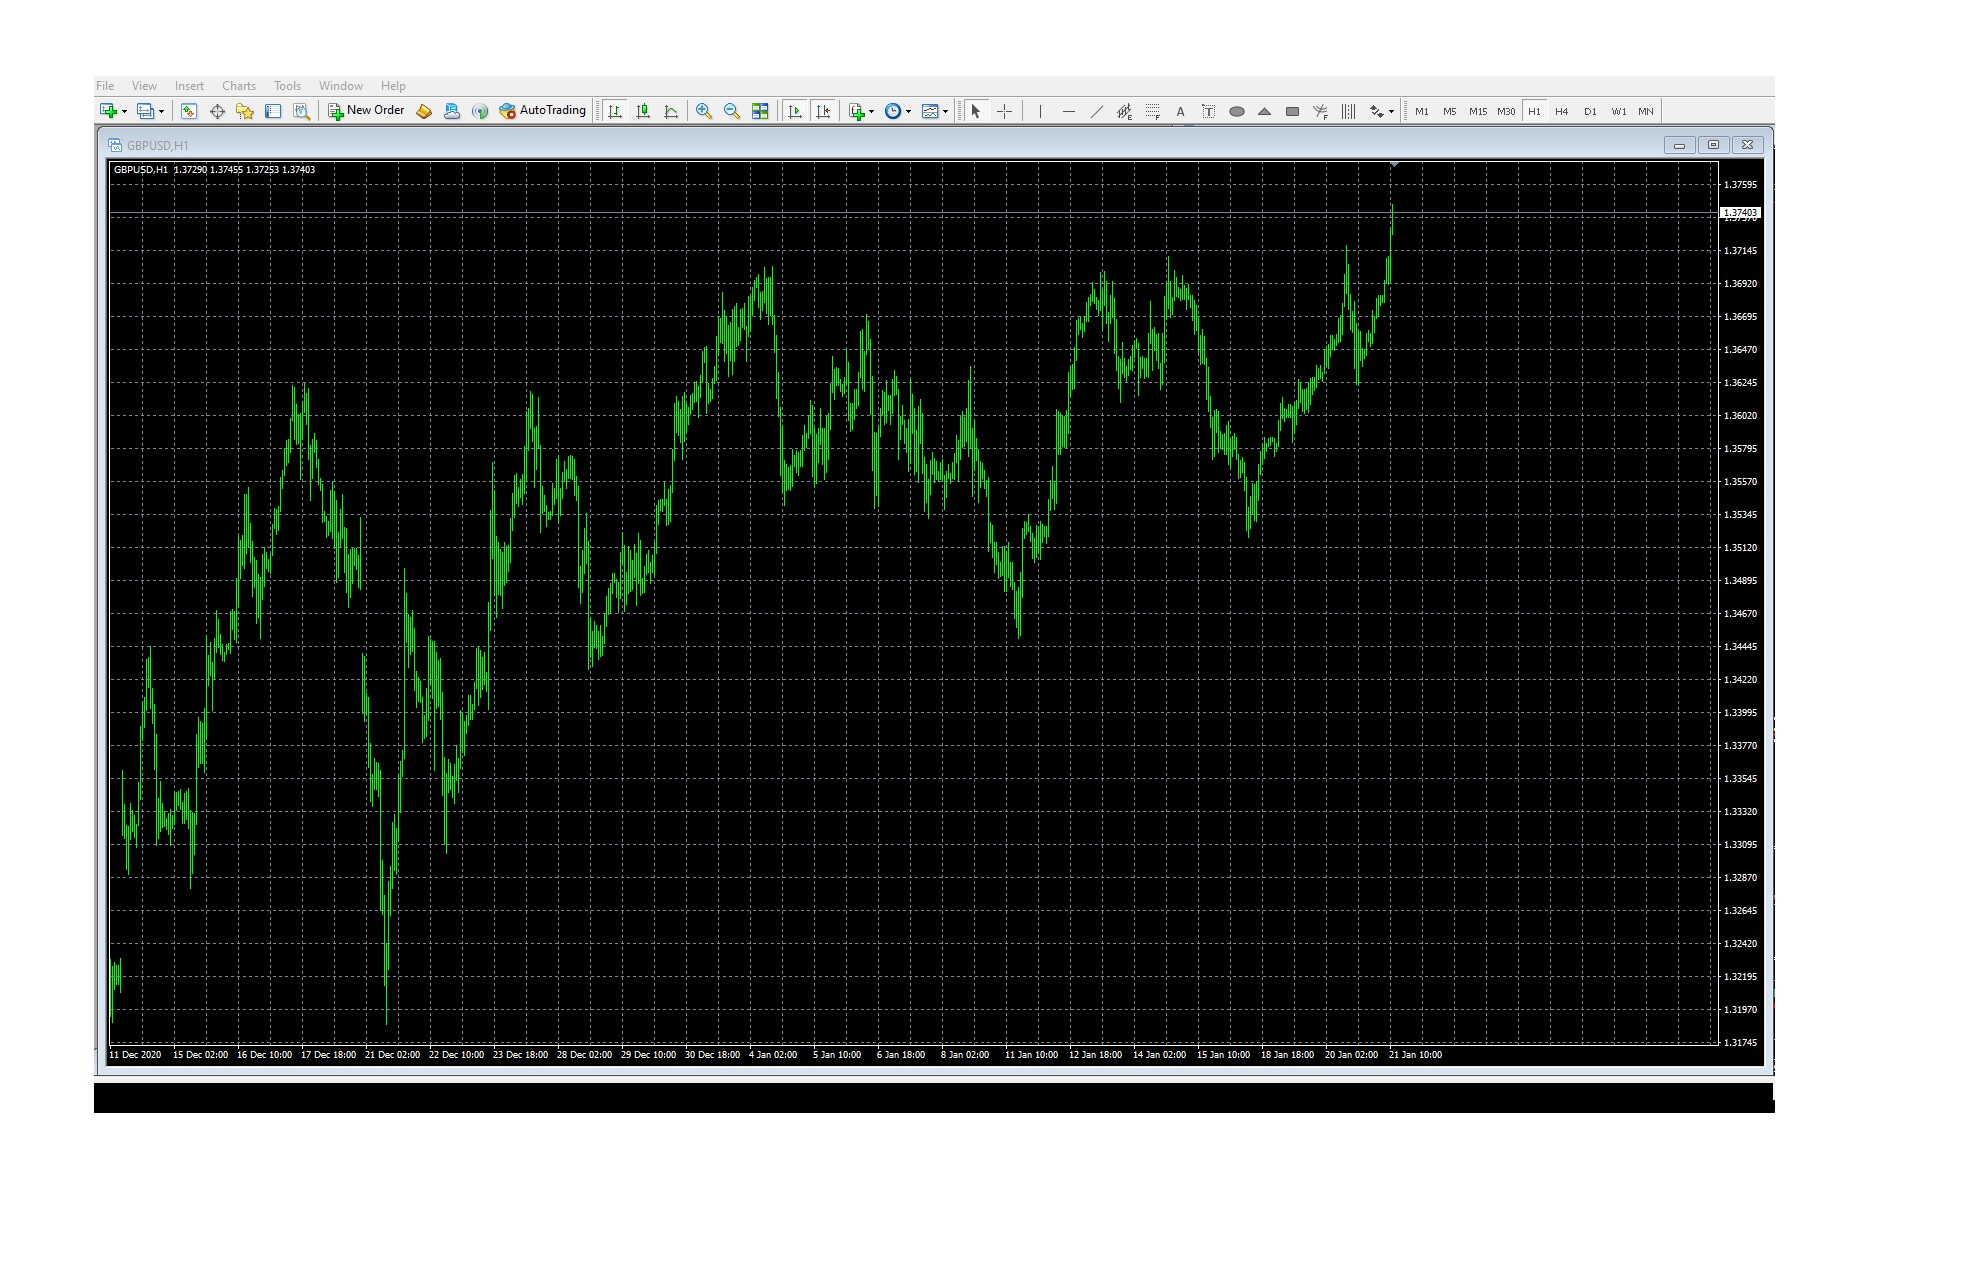
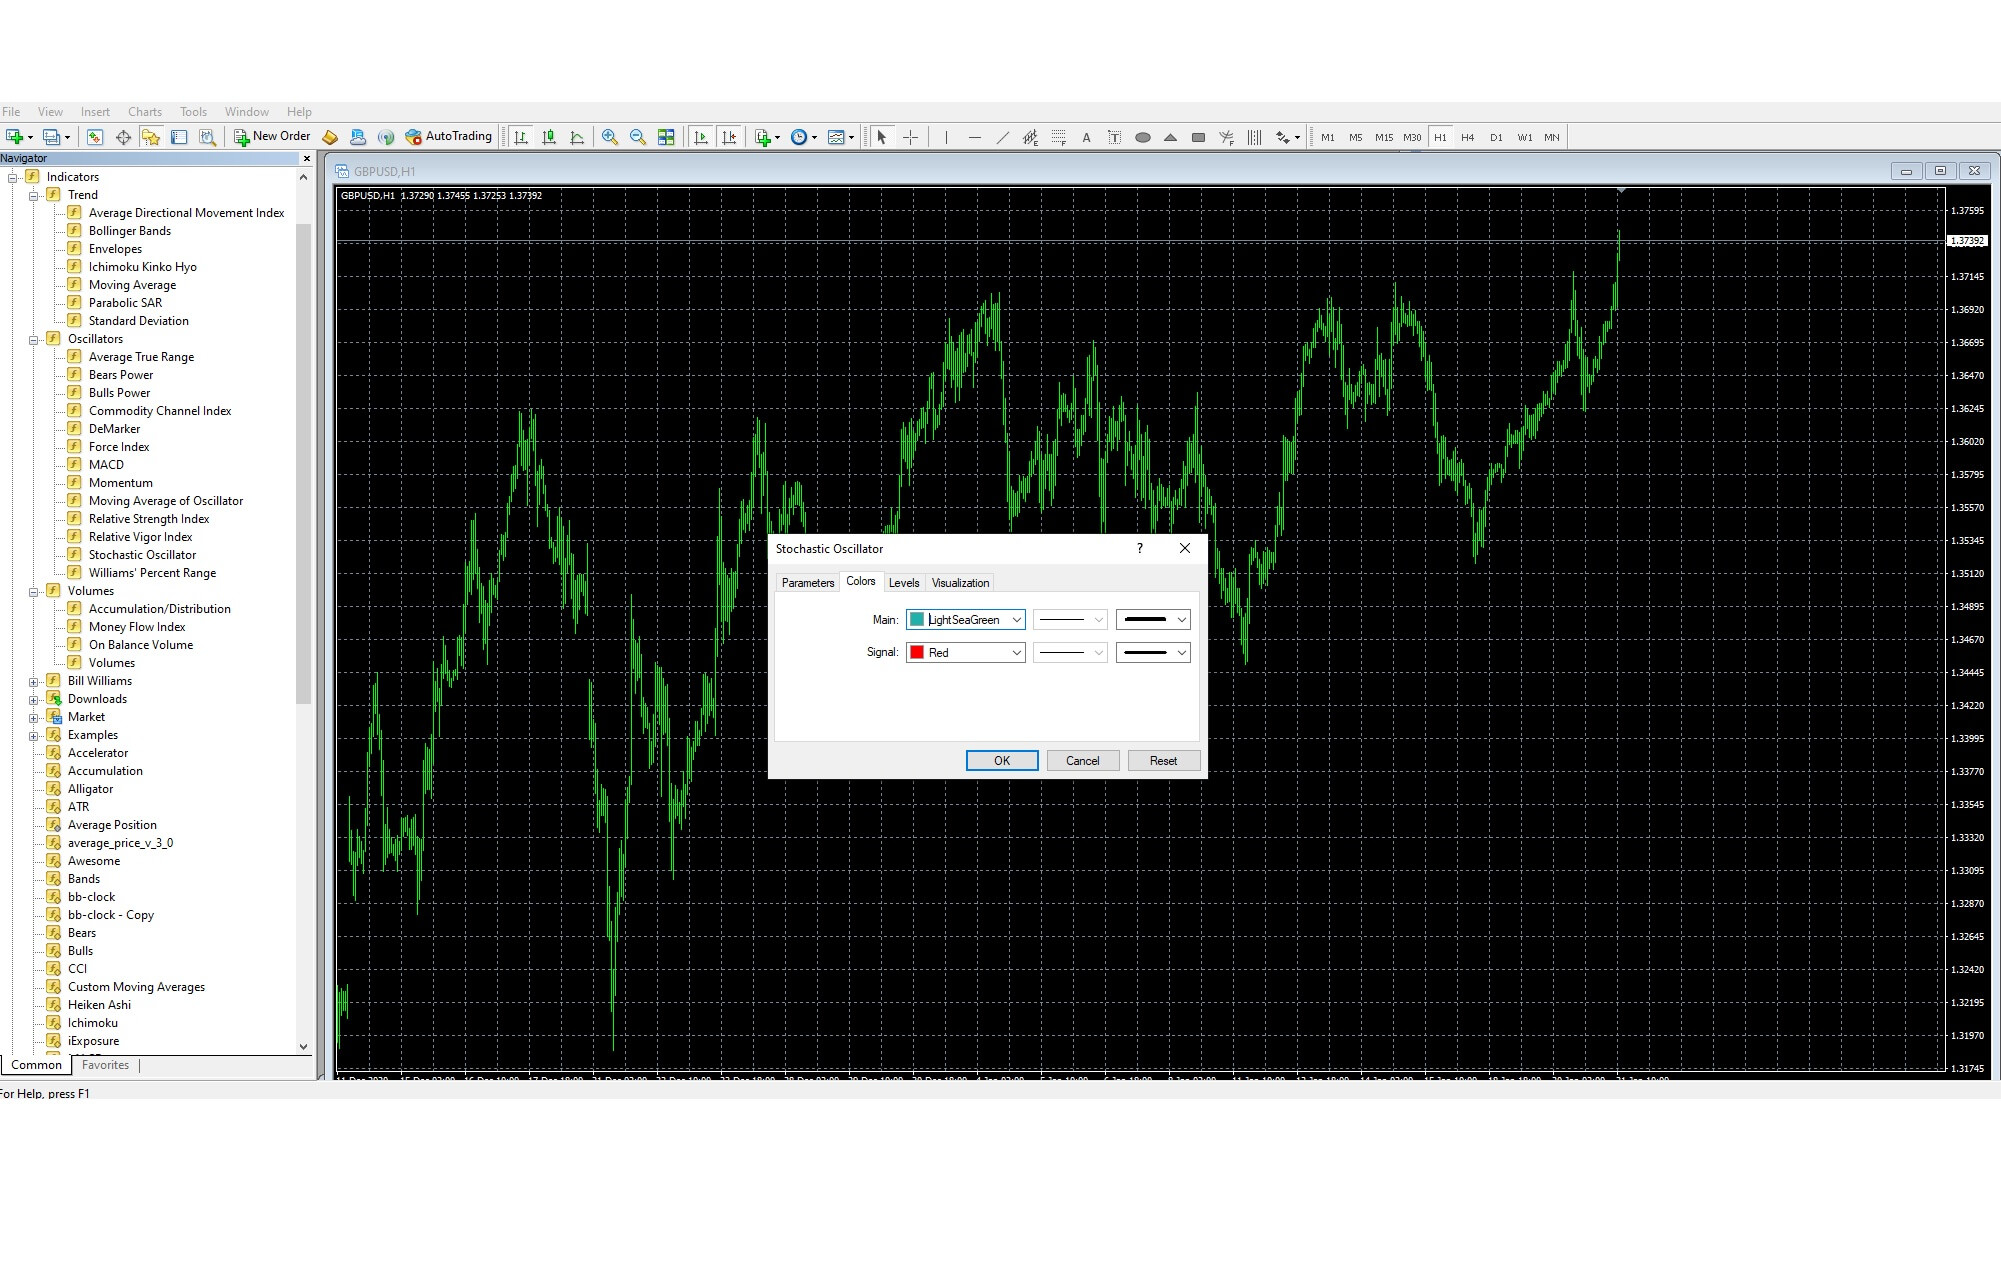
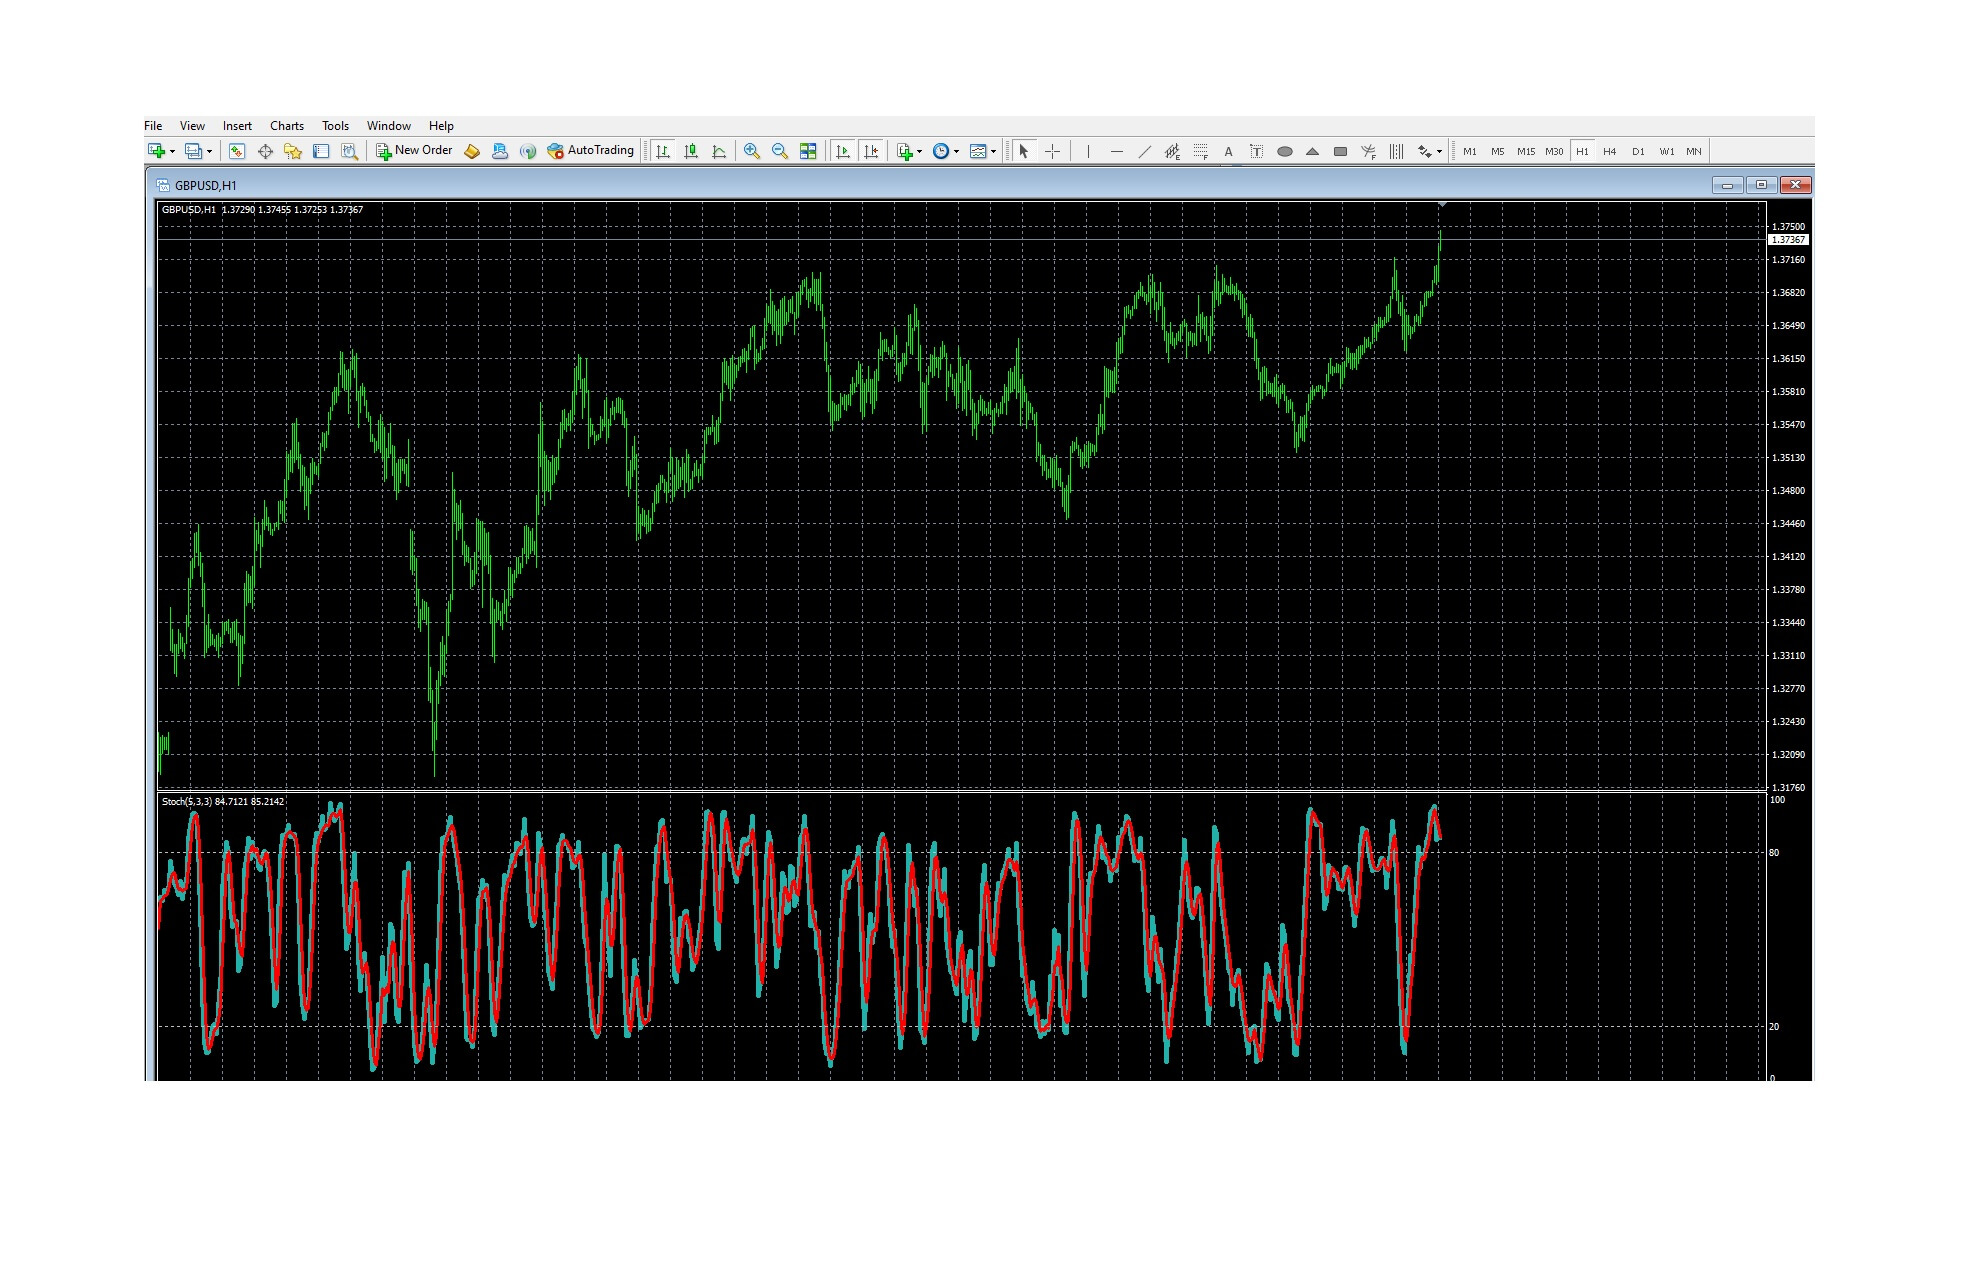
On this one-hour chart of the US dollar CAD pair, we have selected three widely used and popular technical analysis tools from the navigator section, which are Bollinger bands, moving average convergence divergence commonly known as the MACD, and the stochastic oscillator indicator.

 Although as a new trader, we must consider many factors when trading, such as fundamental analysis, the time of day while trading, whether or not economic data is due to be released, whether or not political or policymaker decisions, which might affect the particular currency pair we are interested in, are about to make an announcement, which could affect our trade, without doubt, the most critical aspect to trading, and which has the most influence on the movement of a currency exchange rate, is technical analysis.  Technical analysis often overrides fundamental analysis and even economic data releases.

While we cannot be in control, as traders, of fundamental reasons for why a particular currency pair is moving in any particular direction, and nor can we control political events, we can become masters of technical analysis, and where we can study our charts and seek out regular and consistent screen trading patterns which can stack the odds in our favour with regard to consistent winning trades, and with regard to knowing where to place tight stop losses to maintain the health of our account balance.

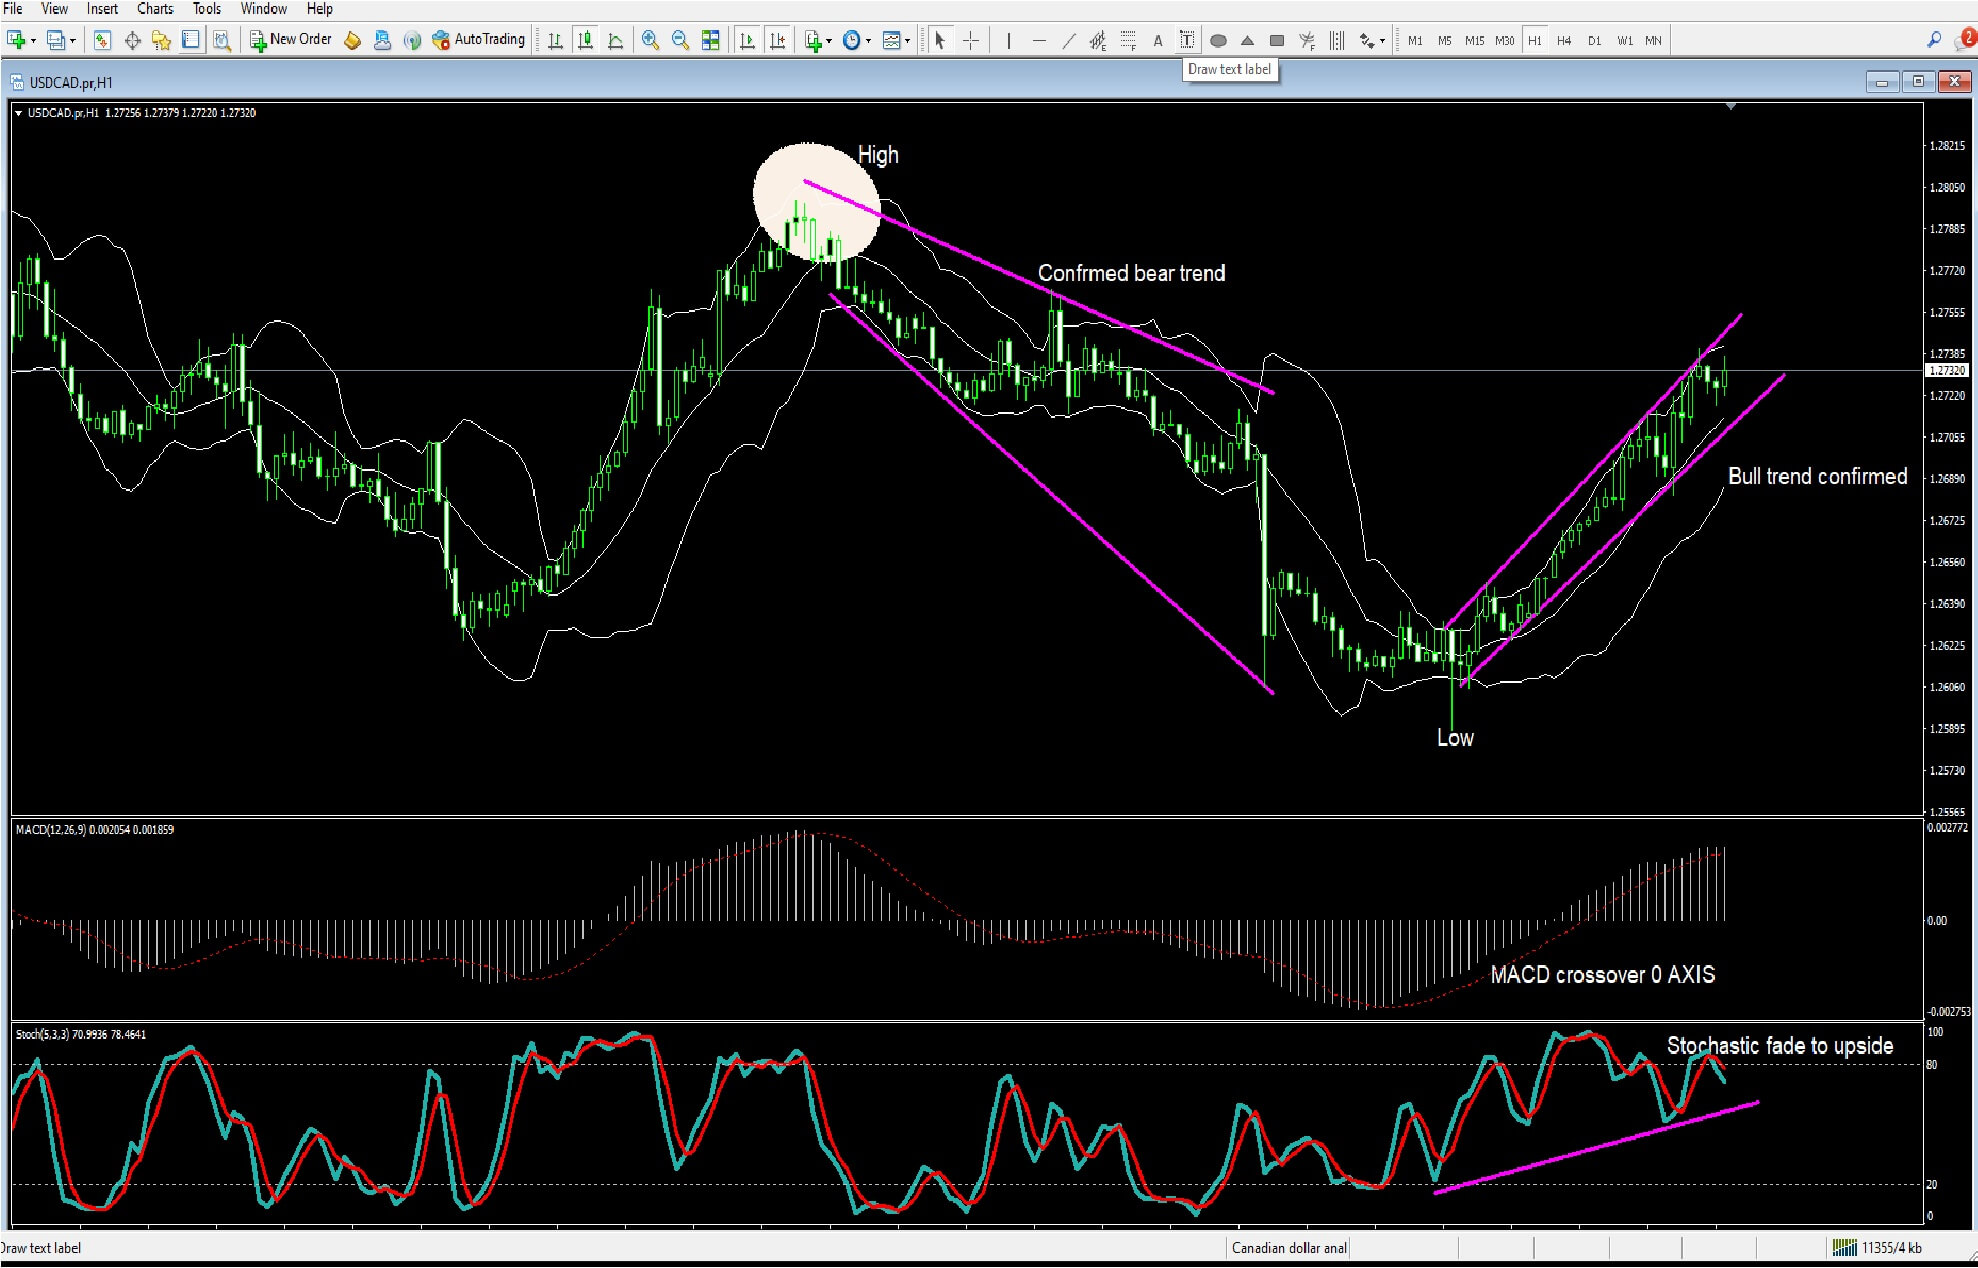
Now chart patterns have a habit of reoccurring, and technical analysis traders know this.  Therefore, as new traders, we must find regular and consistent winning setups, and this takes a lot of time as a new trader, and this requires a lot of patience and a whole lot of studying.

Only when we have found regular setups, which consistently work, can we then build a successful trading methodology, which should be adhered to.

Because these chart patterns are always changing, we can take advantage of the drawing tools such as the ‘’draw text label’’ as highlighted, and where we can make notes on the chart, and because of the flexibility of the MetaTrader platform…..


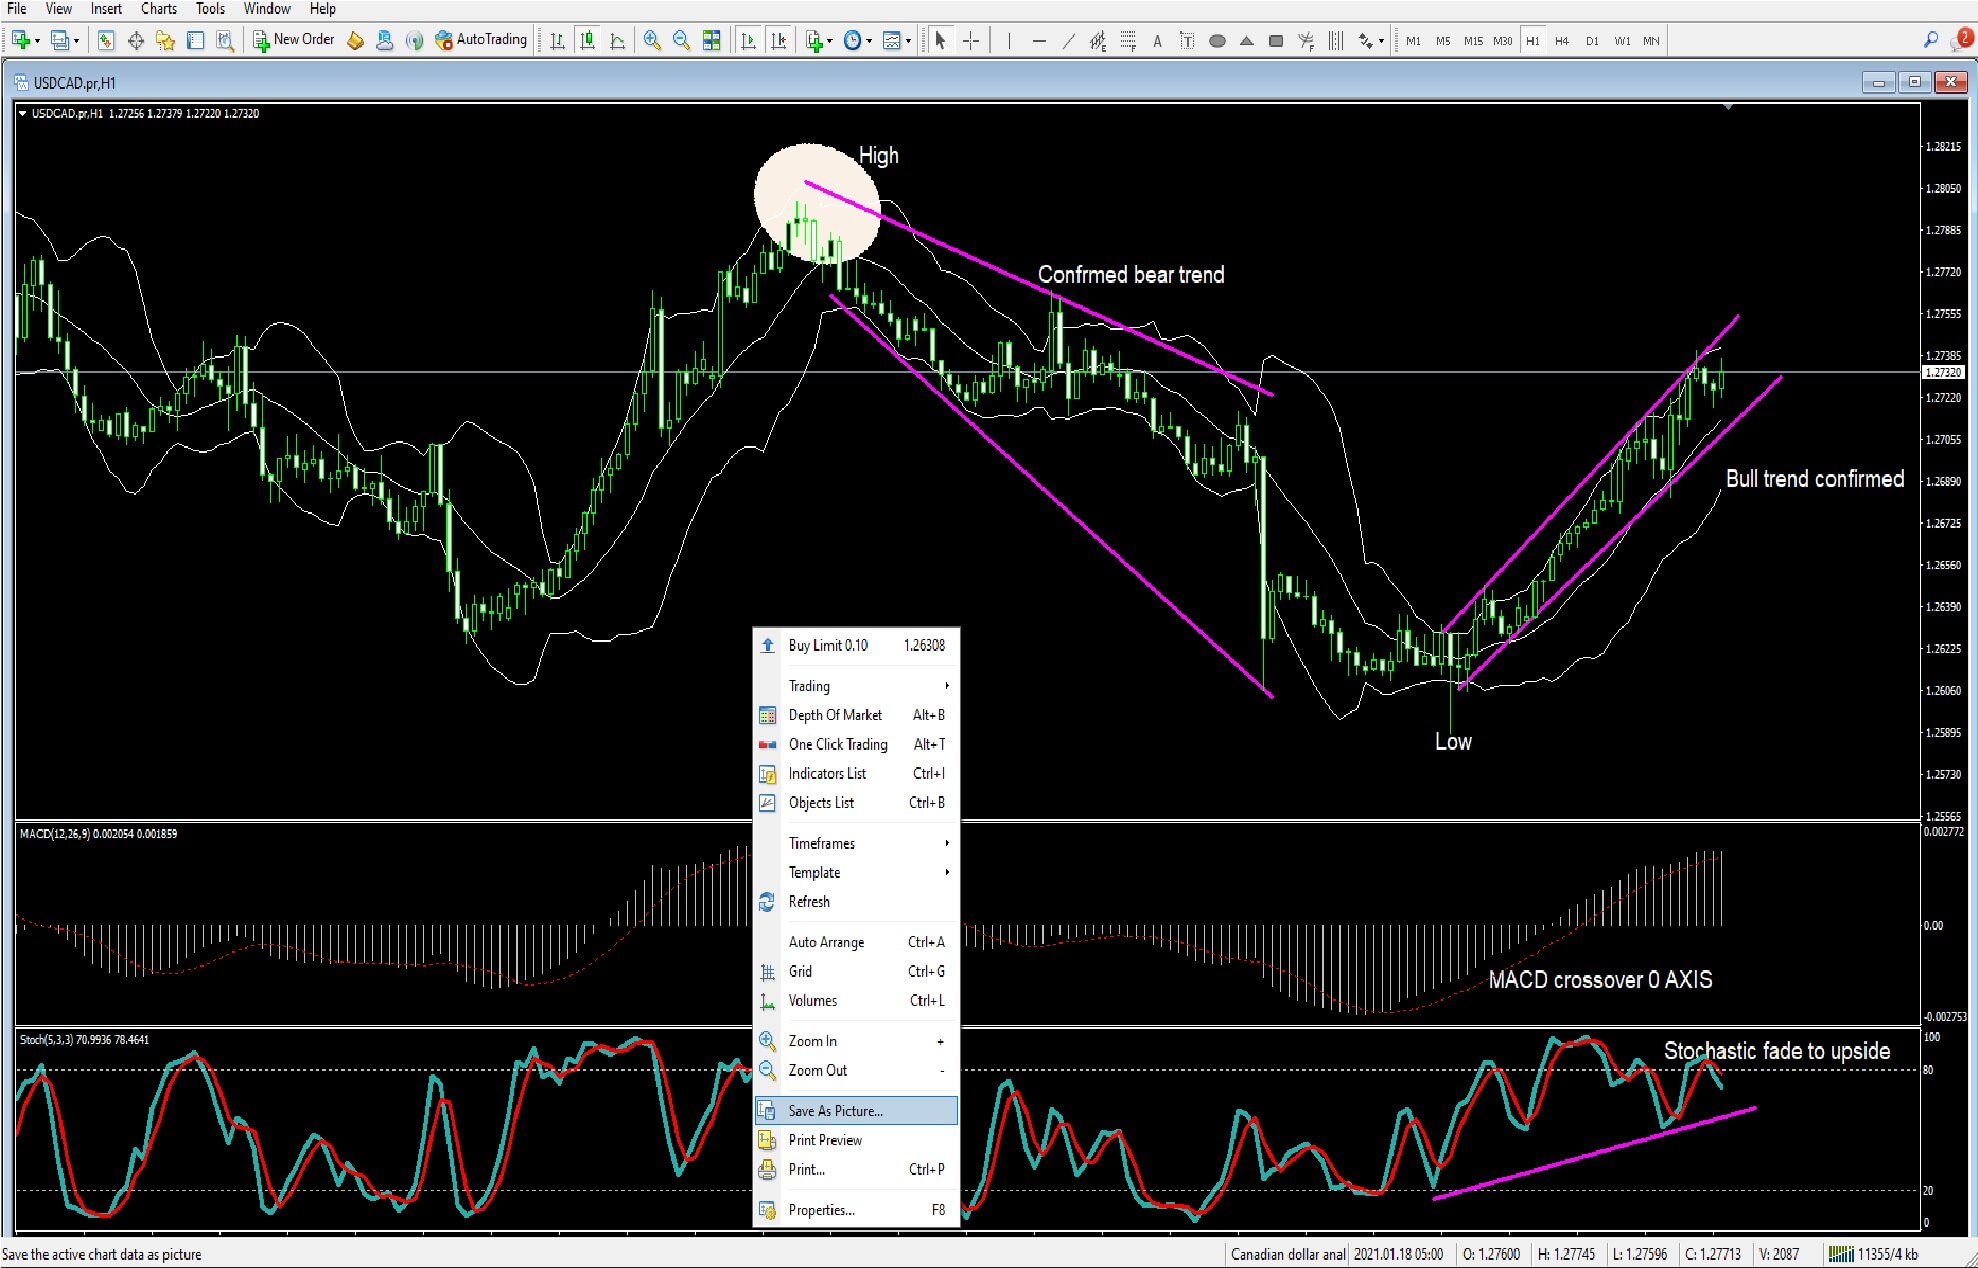
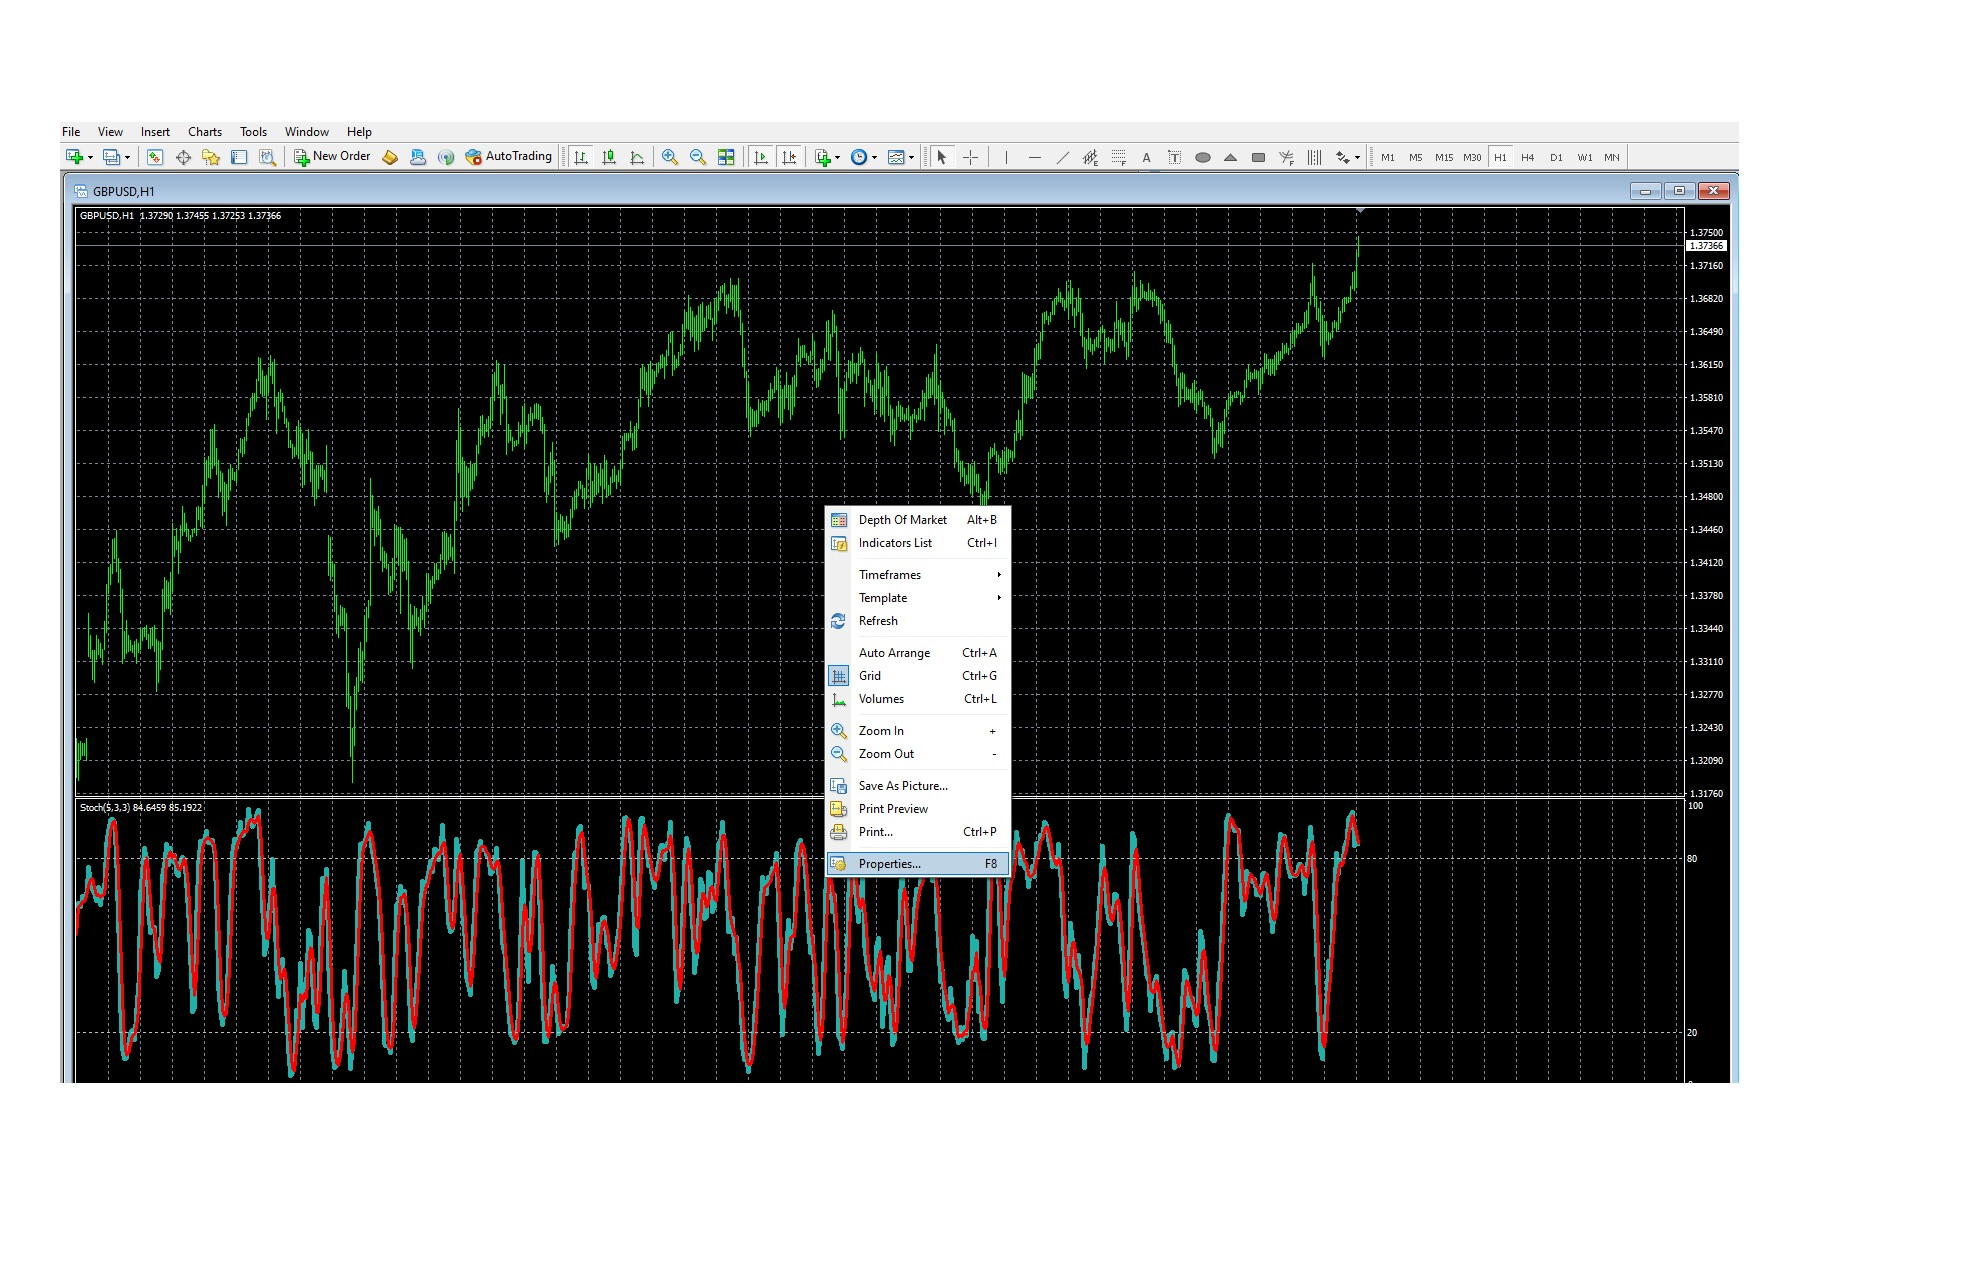
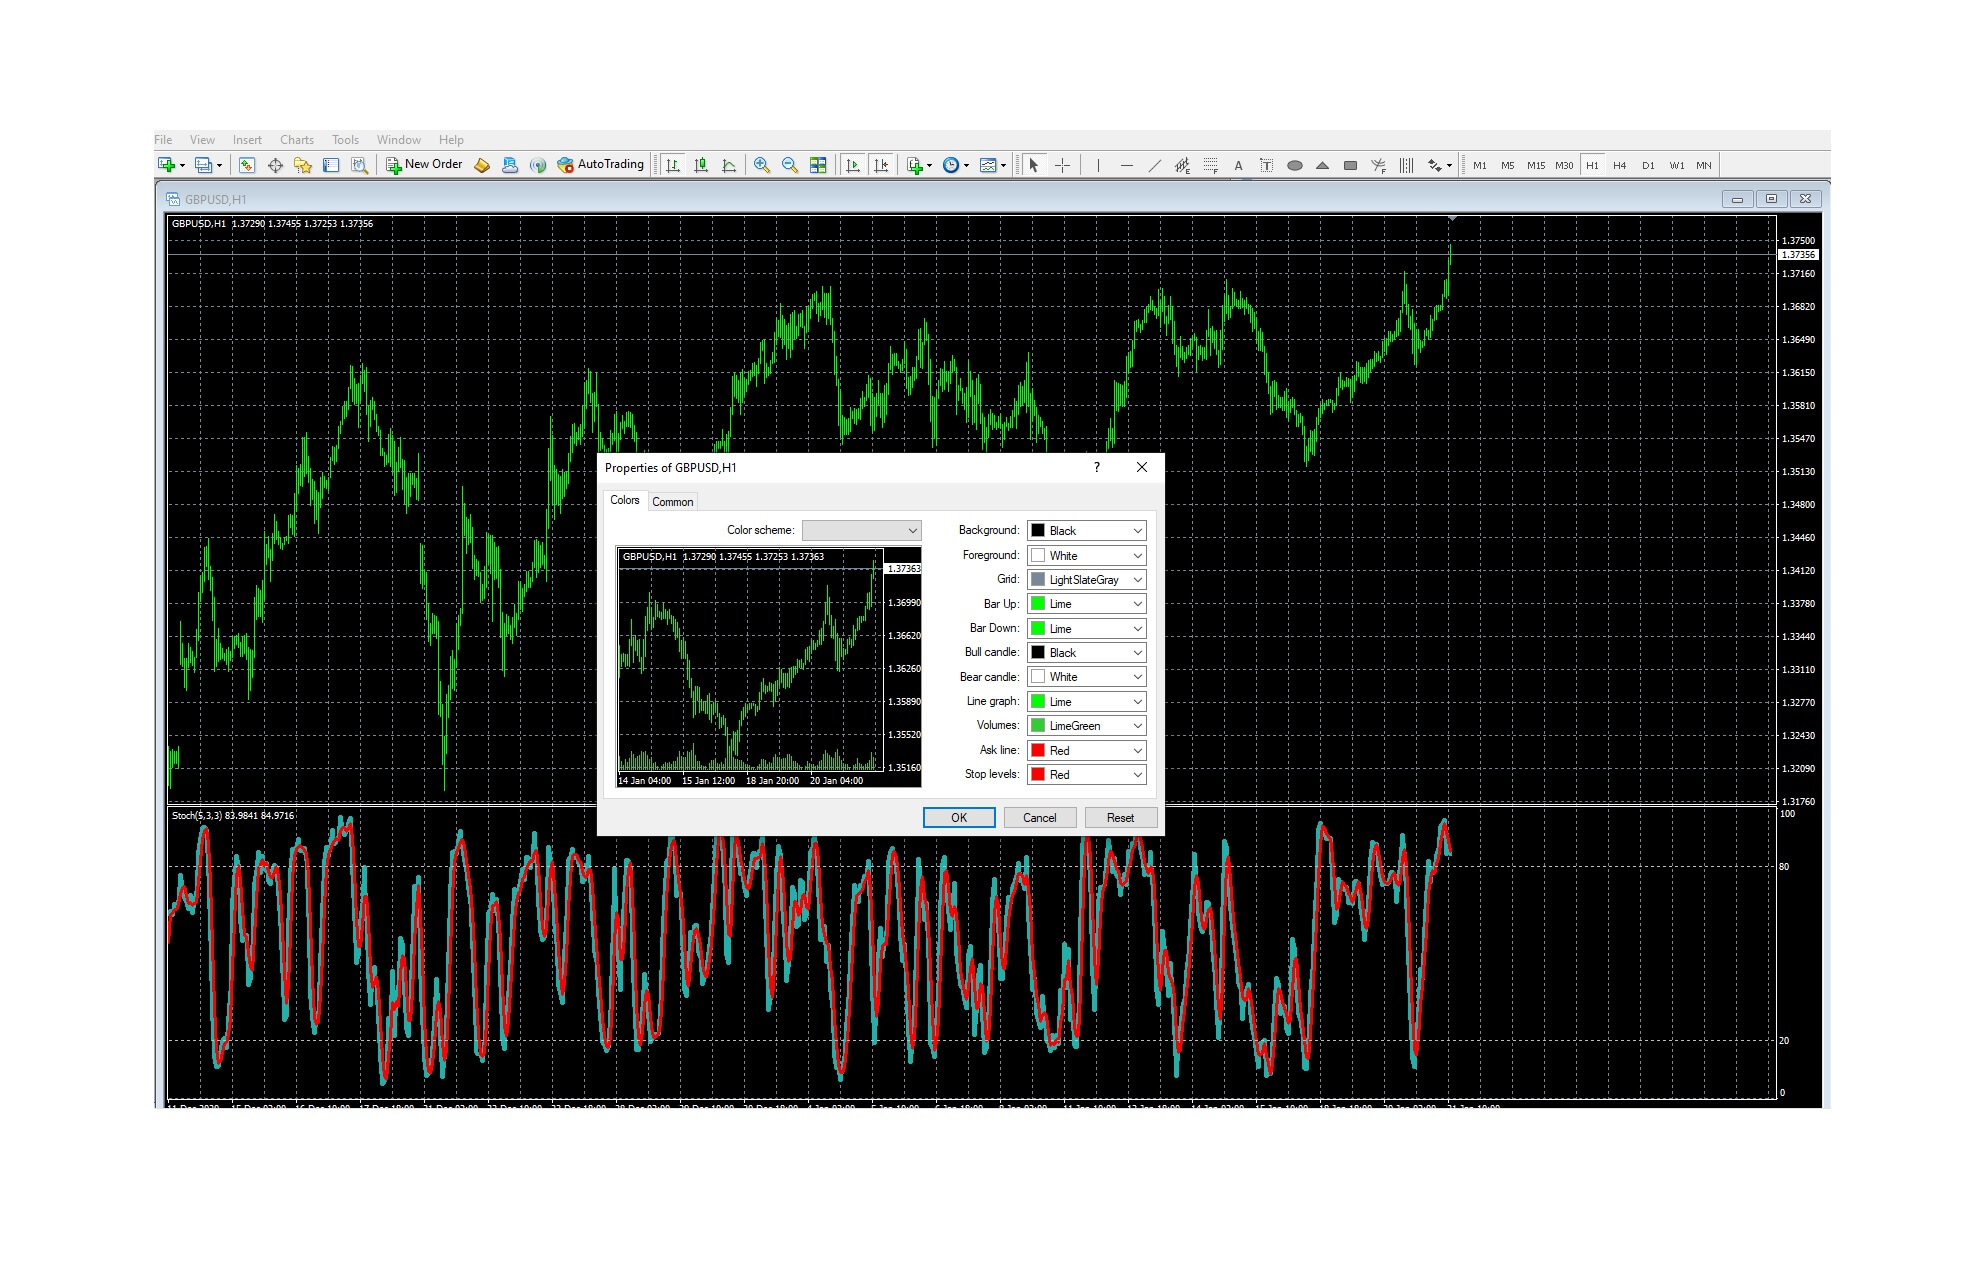
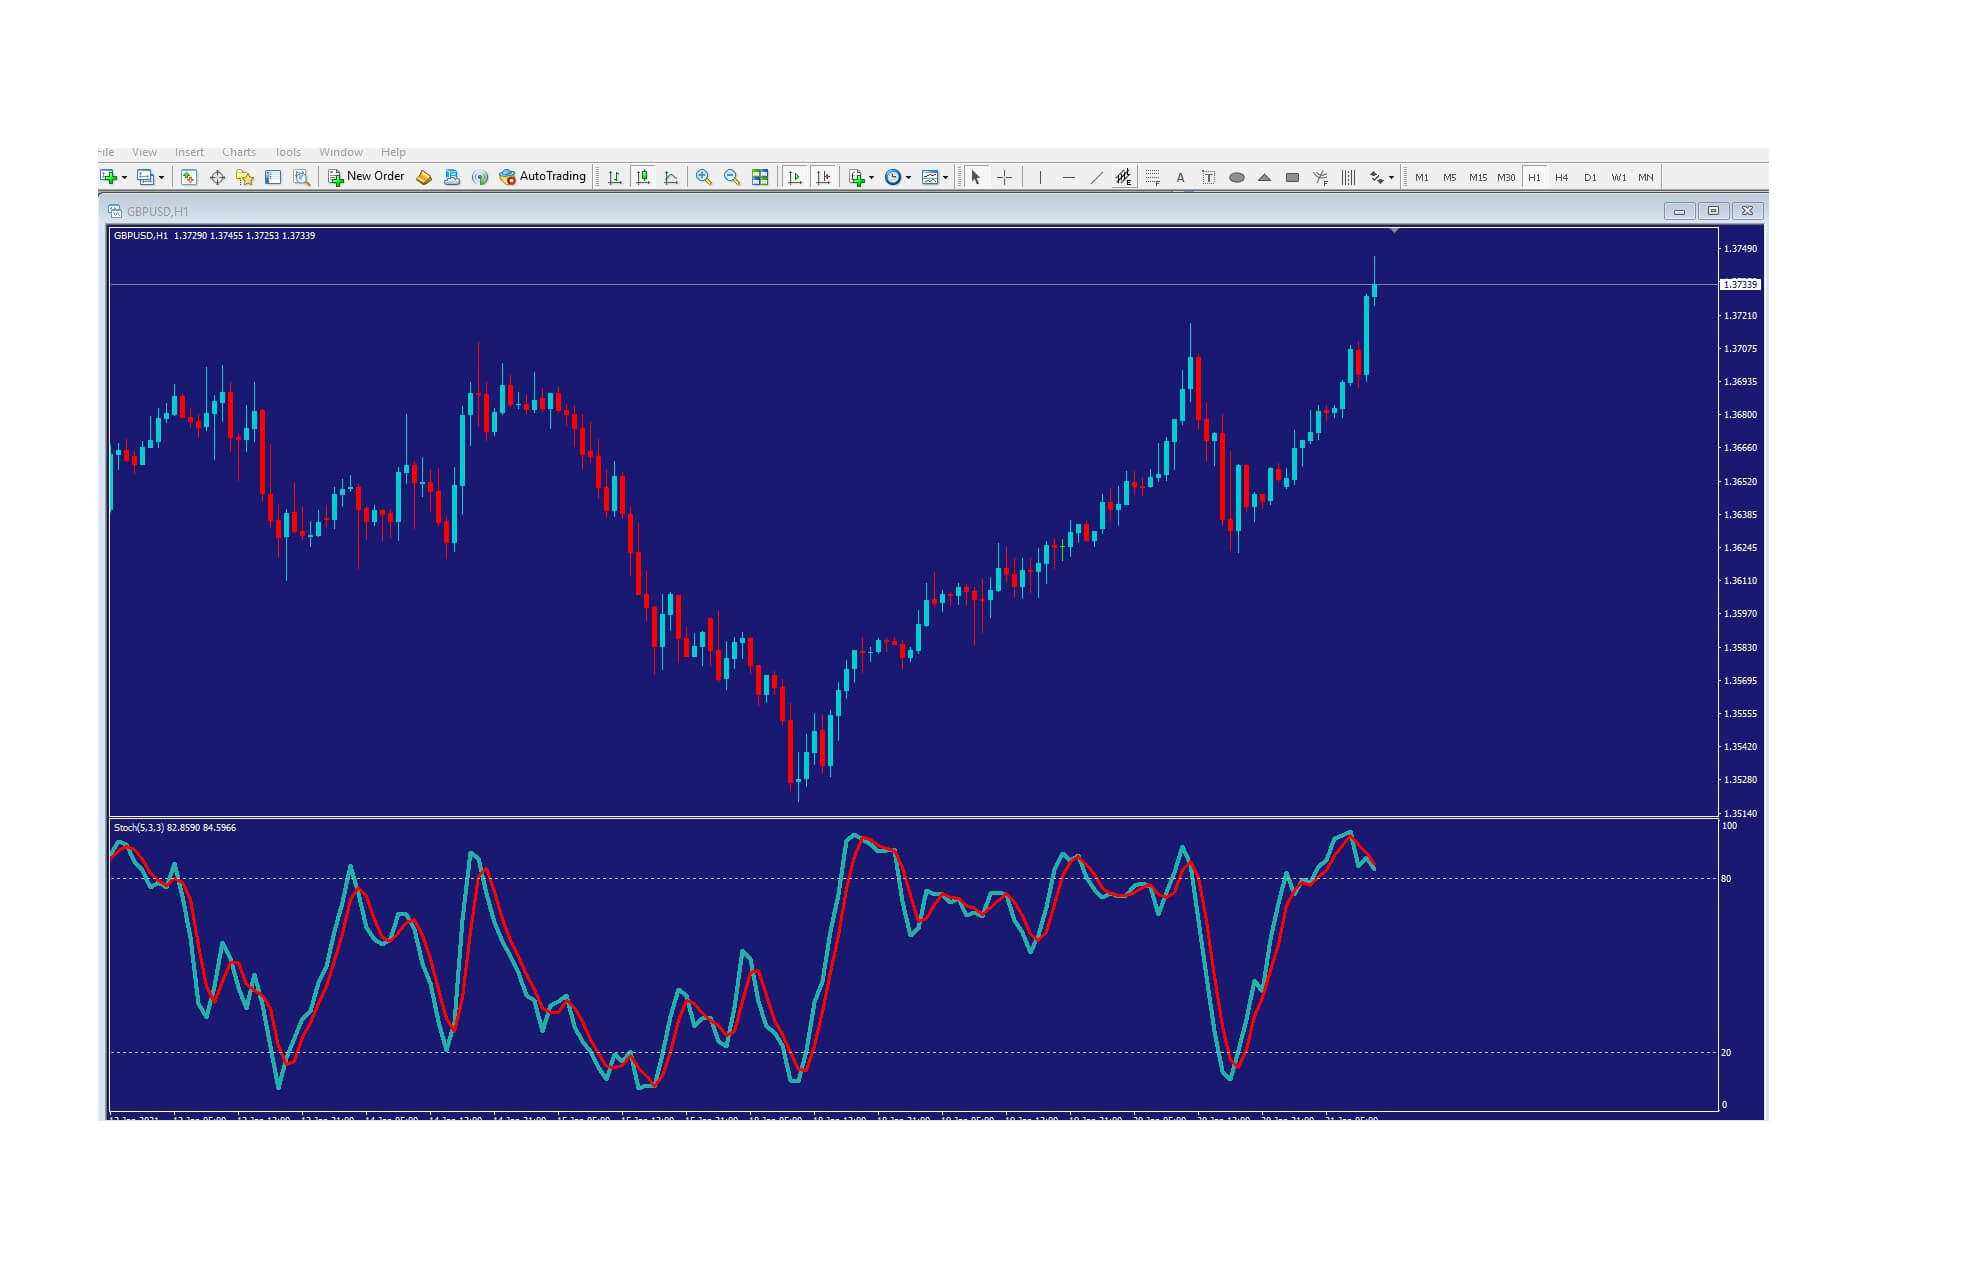
If we right-click on the chart, we have the option to save the chart as a picture for further analysis at a later time.  

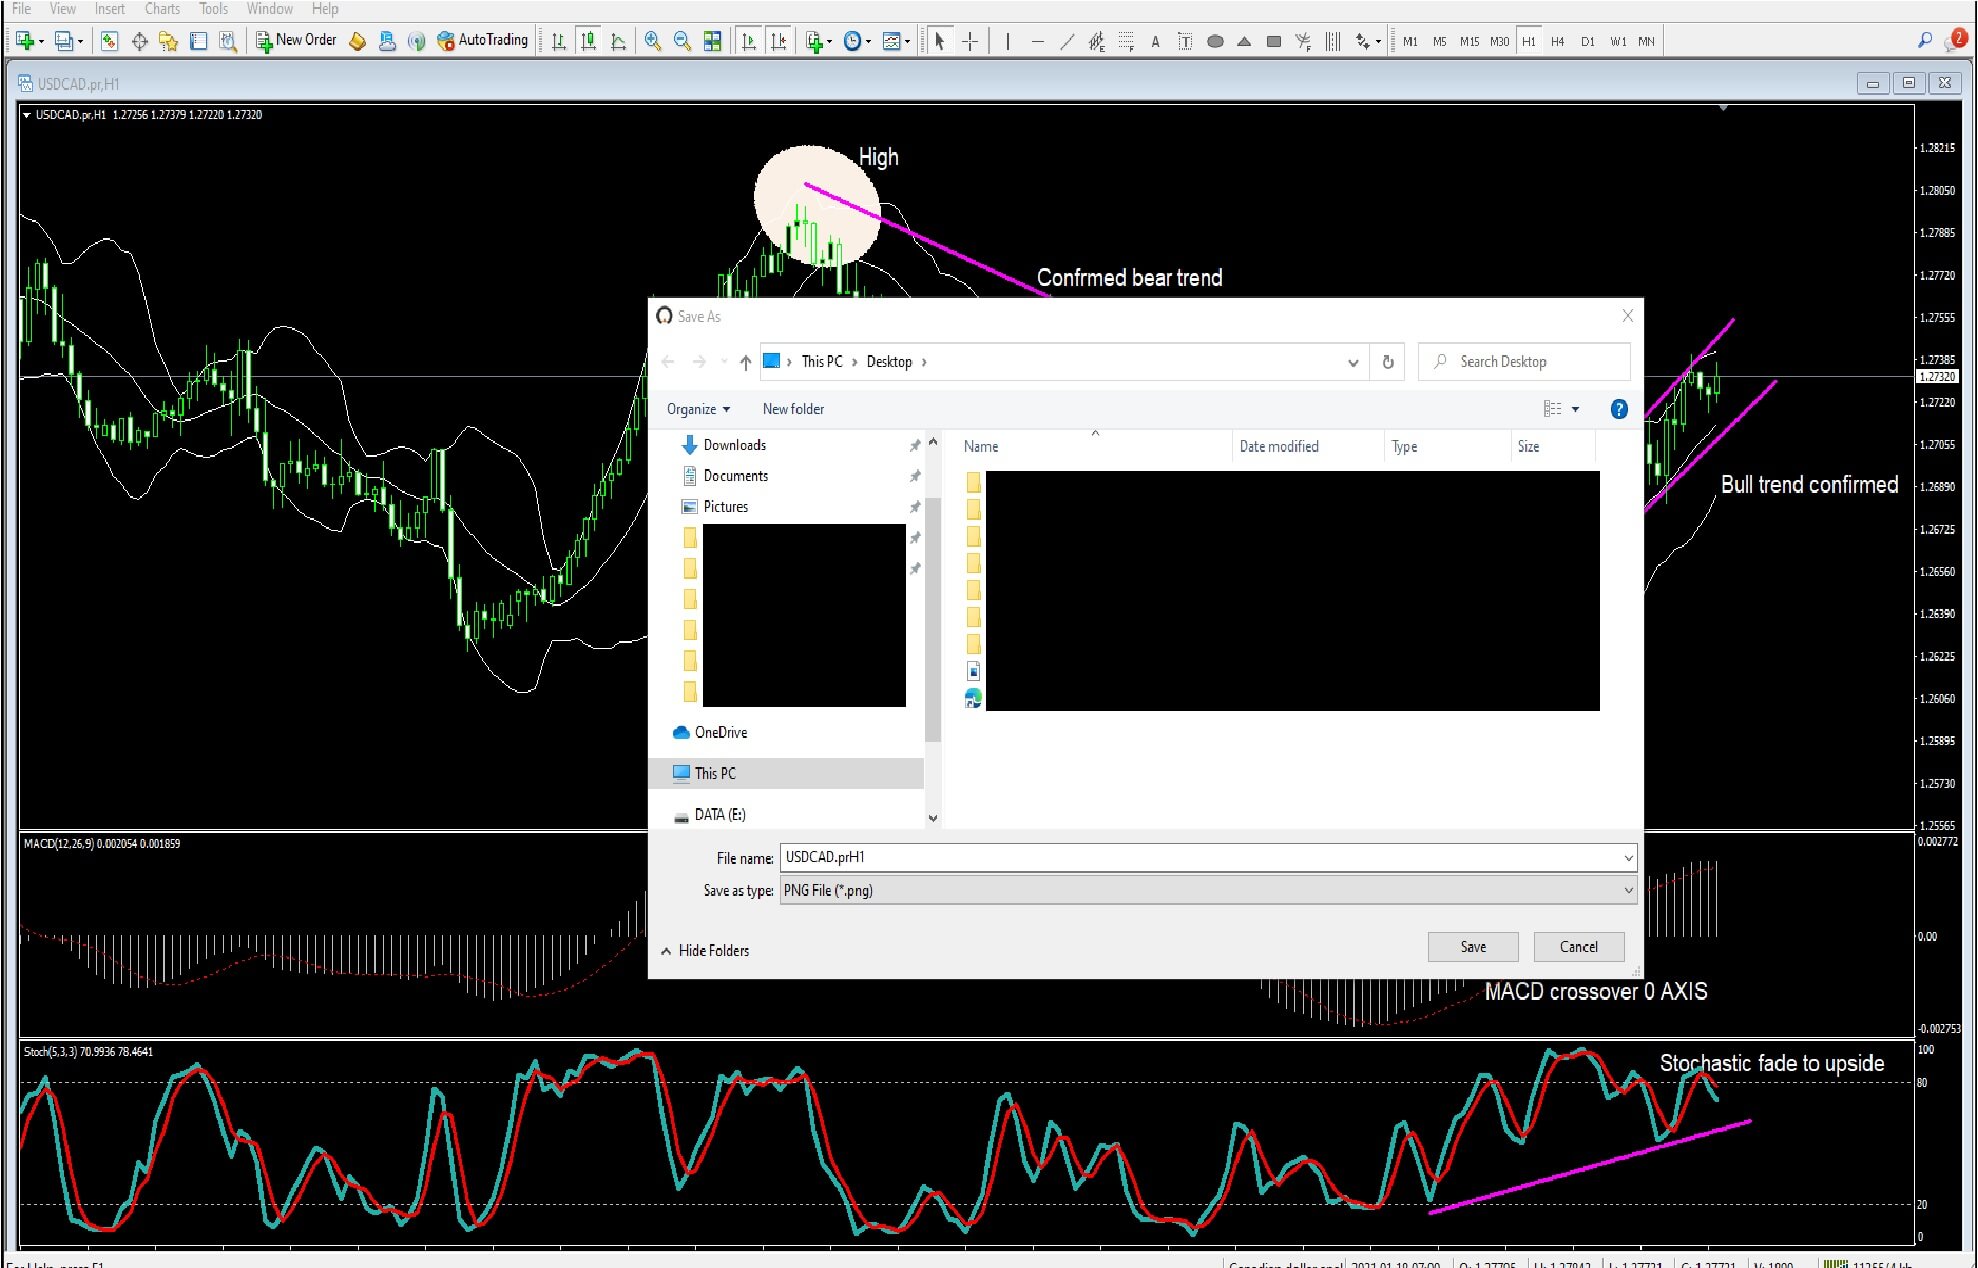
As we see here, to save the chart as a picture, we can set the desired parameters, including the size, and then click ok….

You will then be asked where to save it on your computer, select your destination folder, and save it.

This saves an awful lot of time and alleviates the need to scroll back through hours and hours of charts just to find the setup which you may have been interested in. 

Categories
Forex Videos

Beginners How to save a profile in Metatrader MT4!


Beginners: How to save a profile in Metatrader MT4

Thank you for joining this forex academy educational video.

In this session, we will show you how to save a profile in the Metatrader MT4 platform.

The MetaTrader mt4 platform is one of the most widely used technical analysis platforms in the world.  Some traders use it for technical analysis only, and will trade on a different type of platform. And some prefer to use it for both analysis and direct trading.

It is used the world over and is extremely reliable and robust.  The platform comes with the widest range of technical analysis tools than any other platform available, and most brokers will offer the platform free of charge. The reason it is so widely used is because of its ease of customization and the huge range of technical analysis tools available both free of charge and to purchase on the MQL5 market place. 

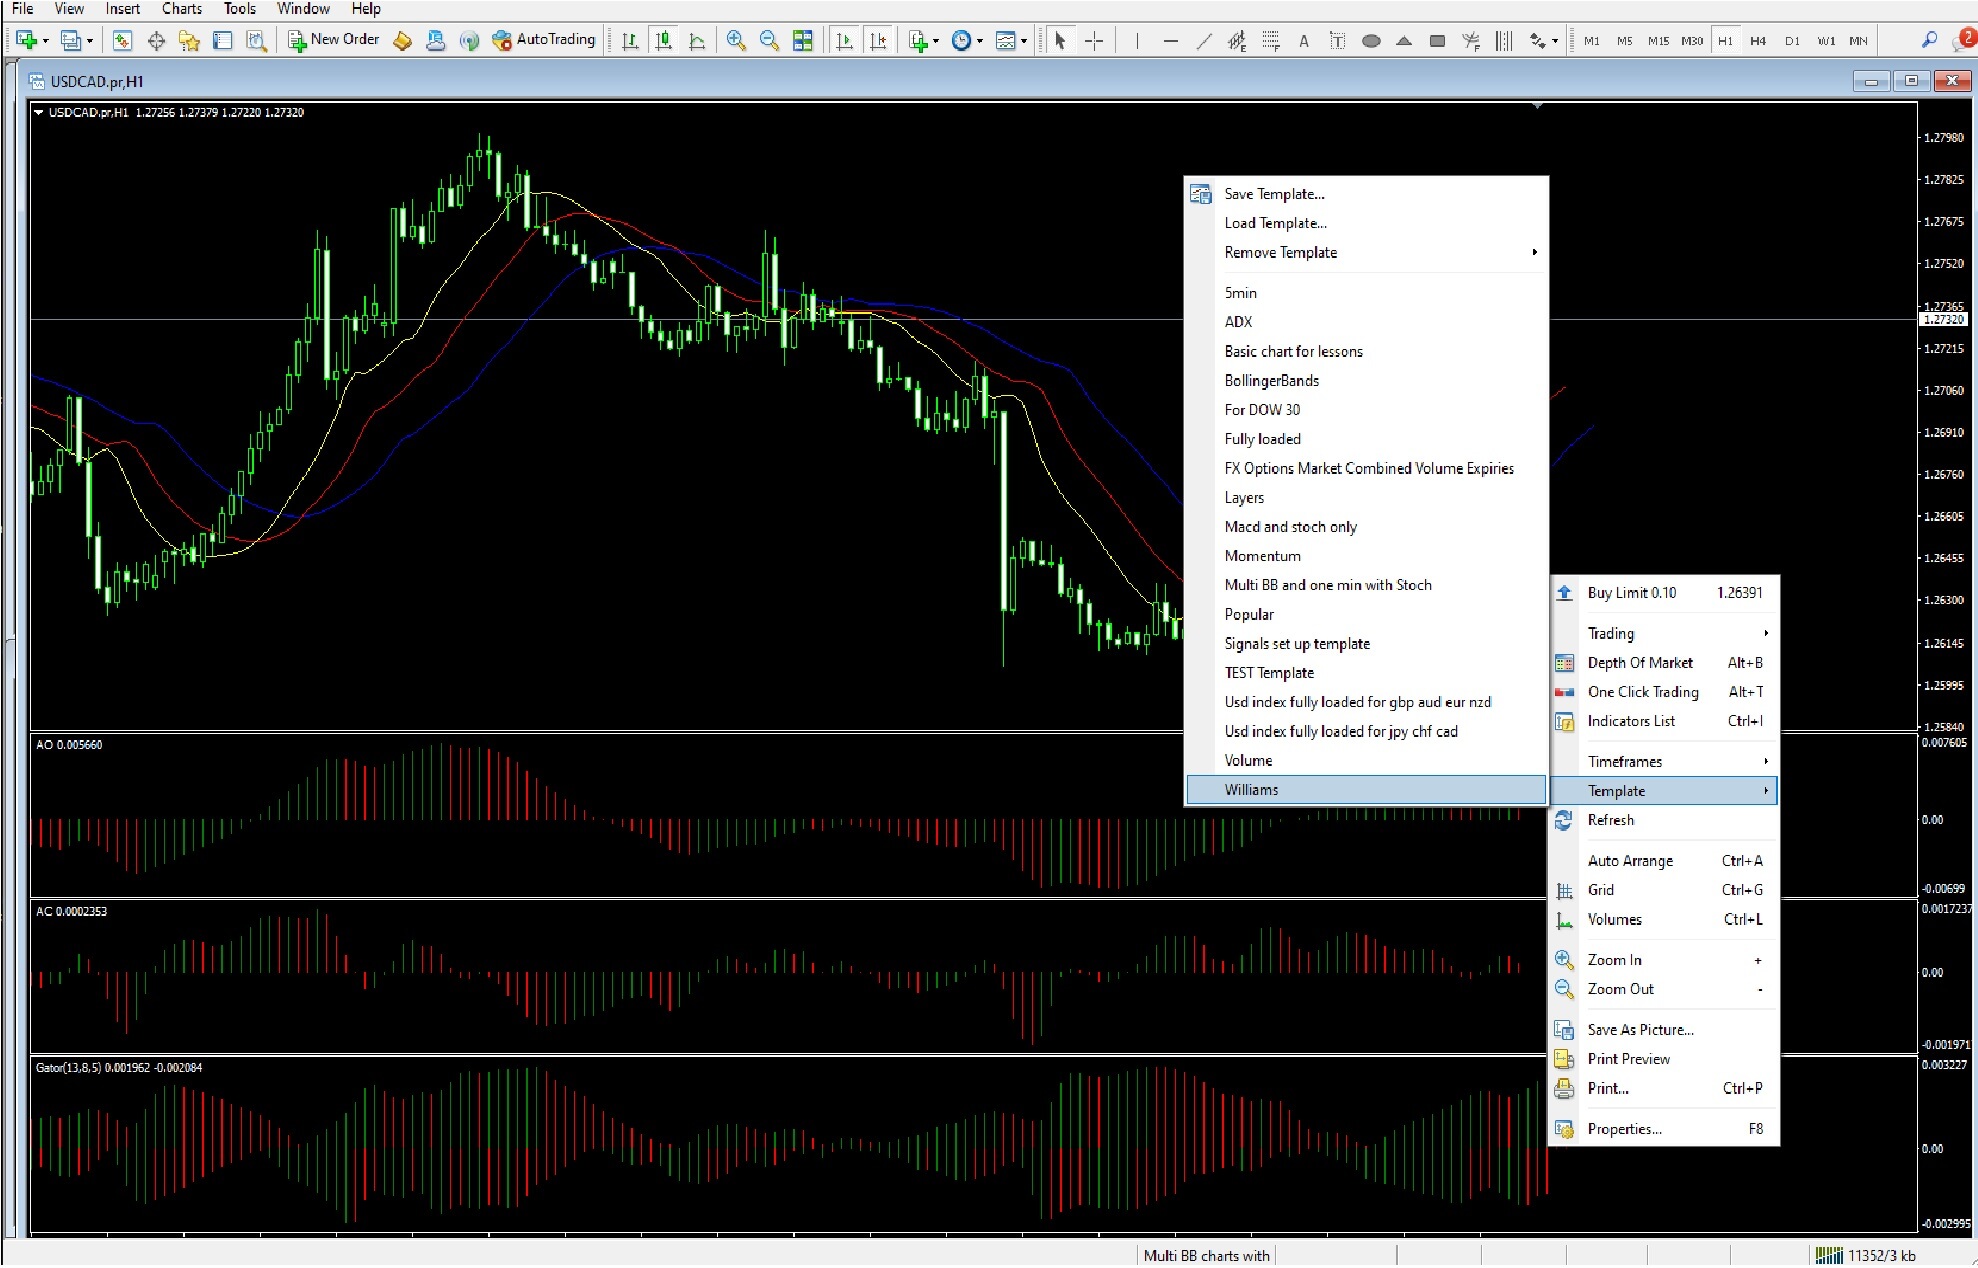
This is a 1-hour chart of the US dollar to the Canadian dollar, and the technical chart setup is

……called the Williams, and it is a custom setup, which is free with the platform download by most brokers.

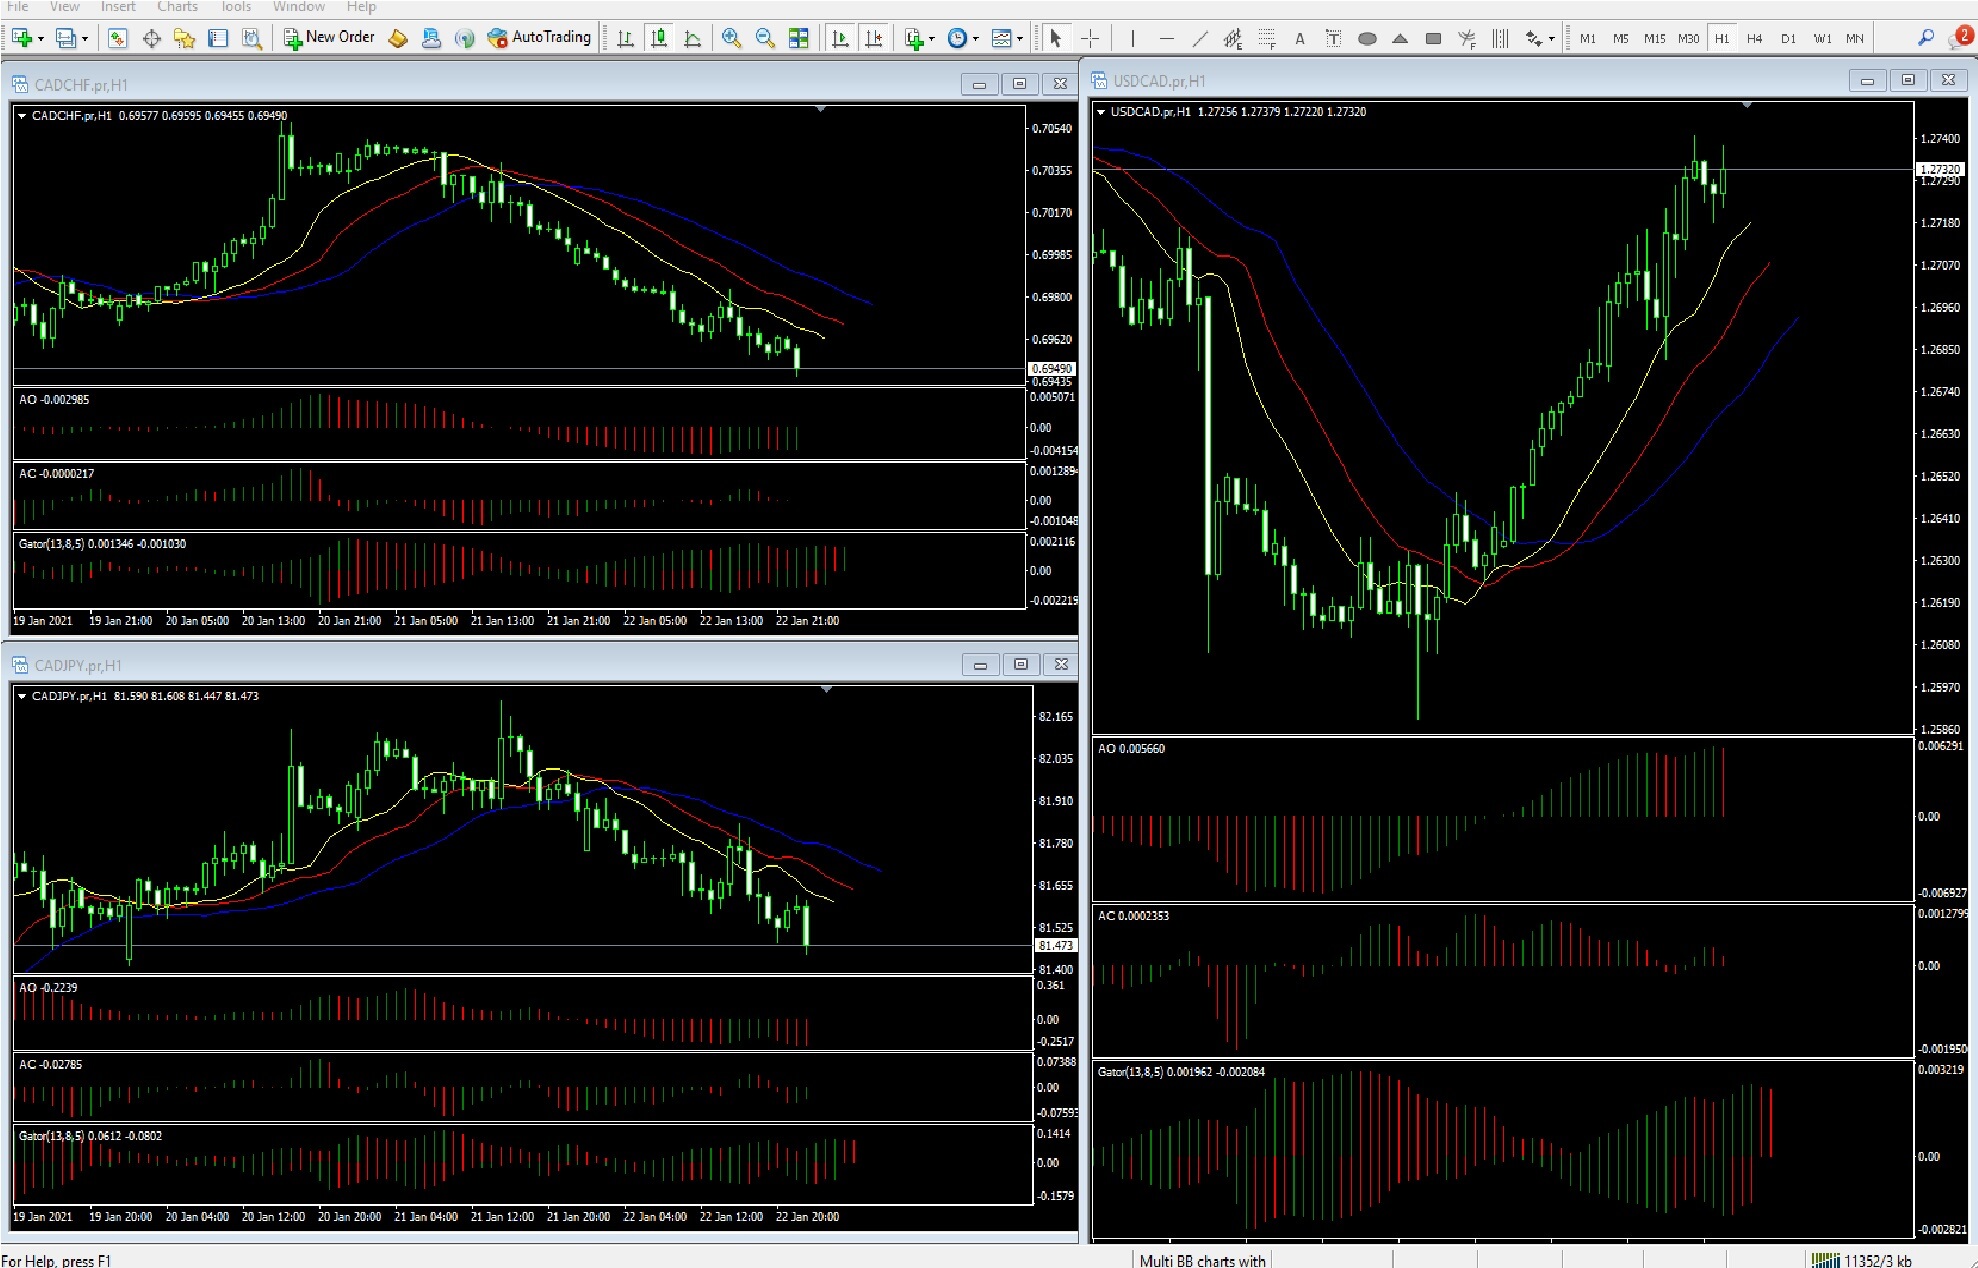
Let’s say we have an interest in the Canadian dollar, and we want to see what the general directional bias is for the currency, and where here we can see that the Canadian dollar is currently losing ground against the US dollar…..

And here where we have added a couple of other Canadian dollar cross currencies pairs, including the CAD / Swiss and CAD / JPY on 1-hour charts, and we can tell that the general bias is for a weaker Canadian dollar across all three currency pairs.

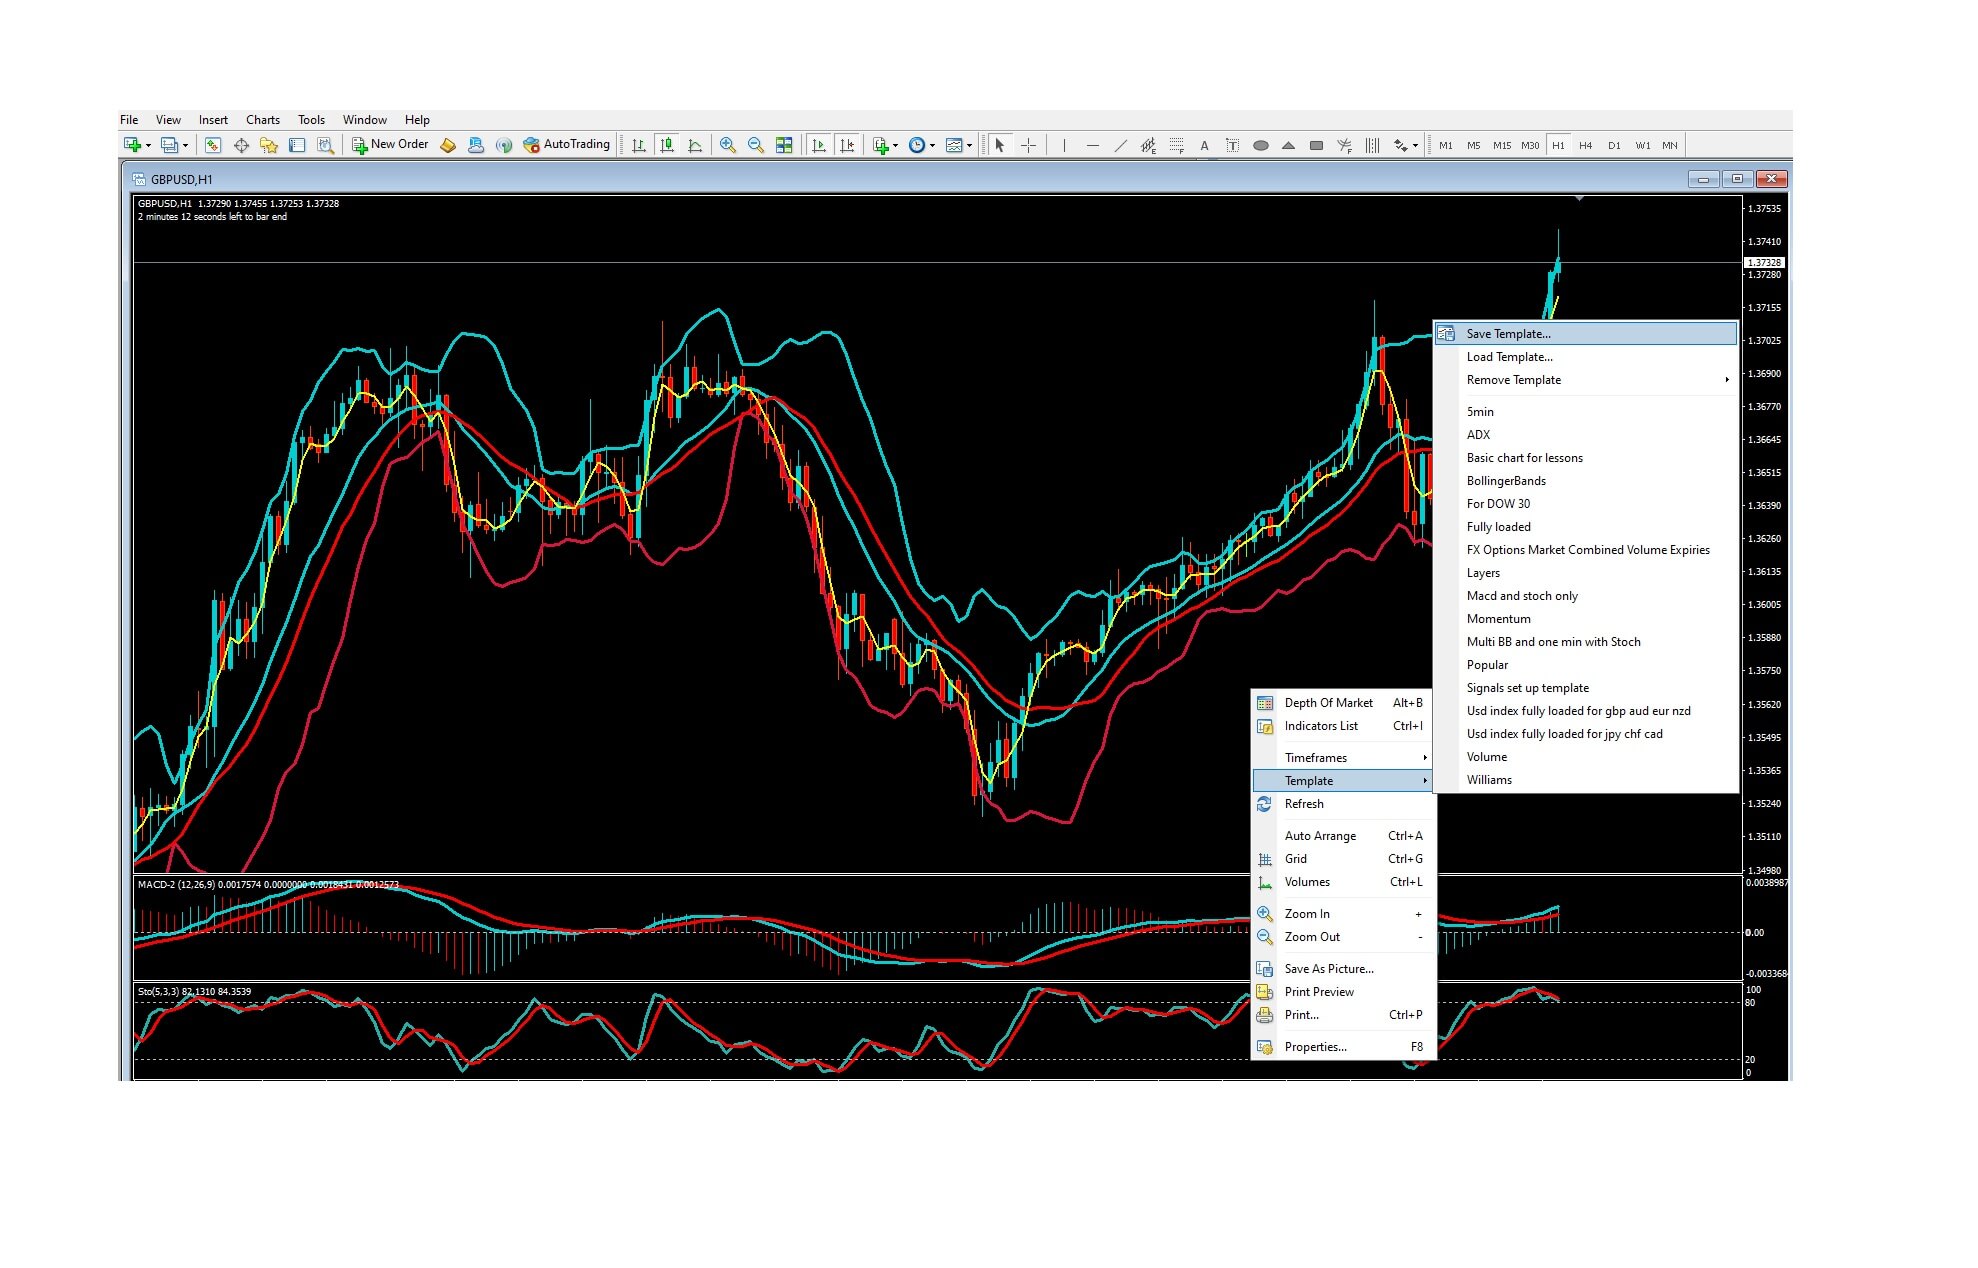
The cool thing about the MetaTrader platform is that we can save this as a profile and come back to it later if we want to trade another currency pair.

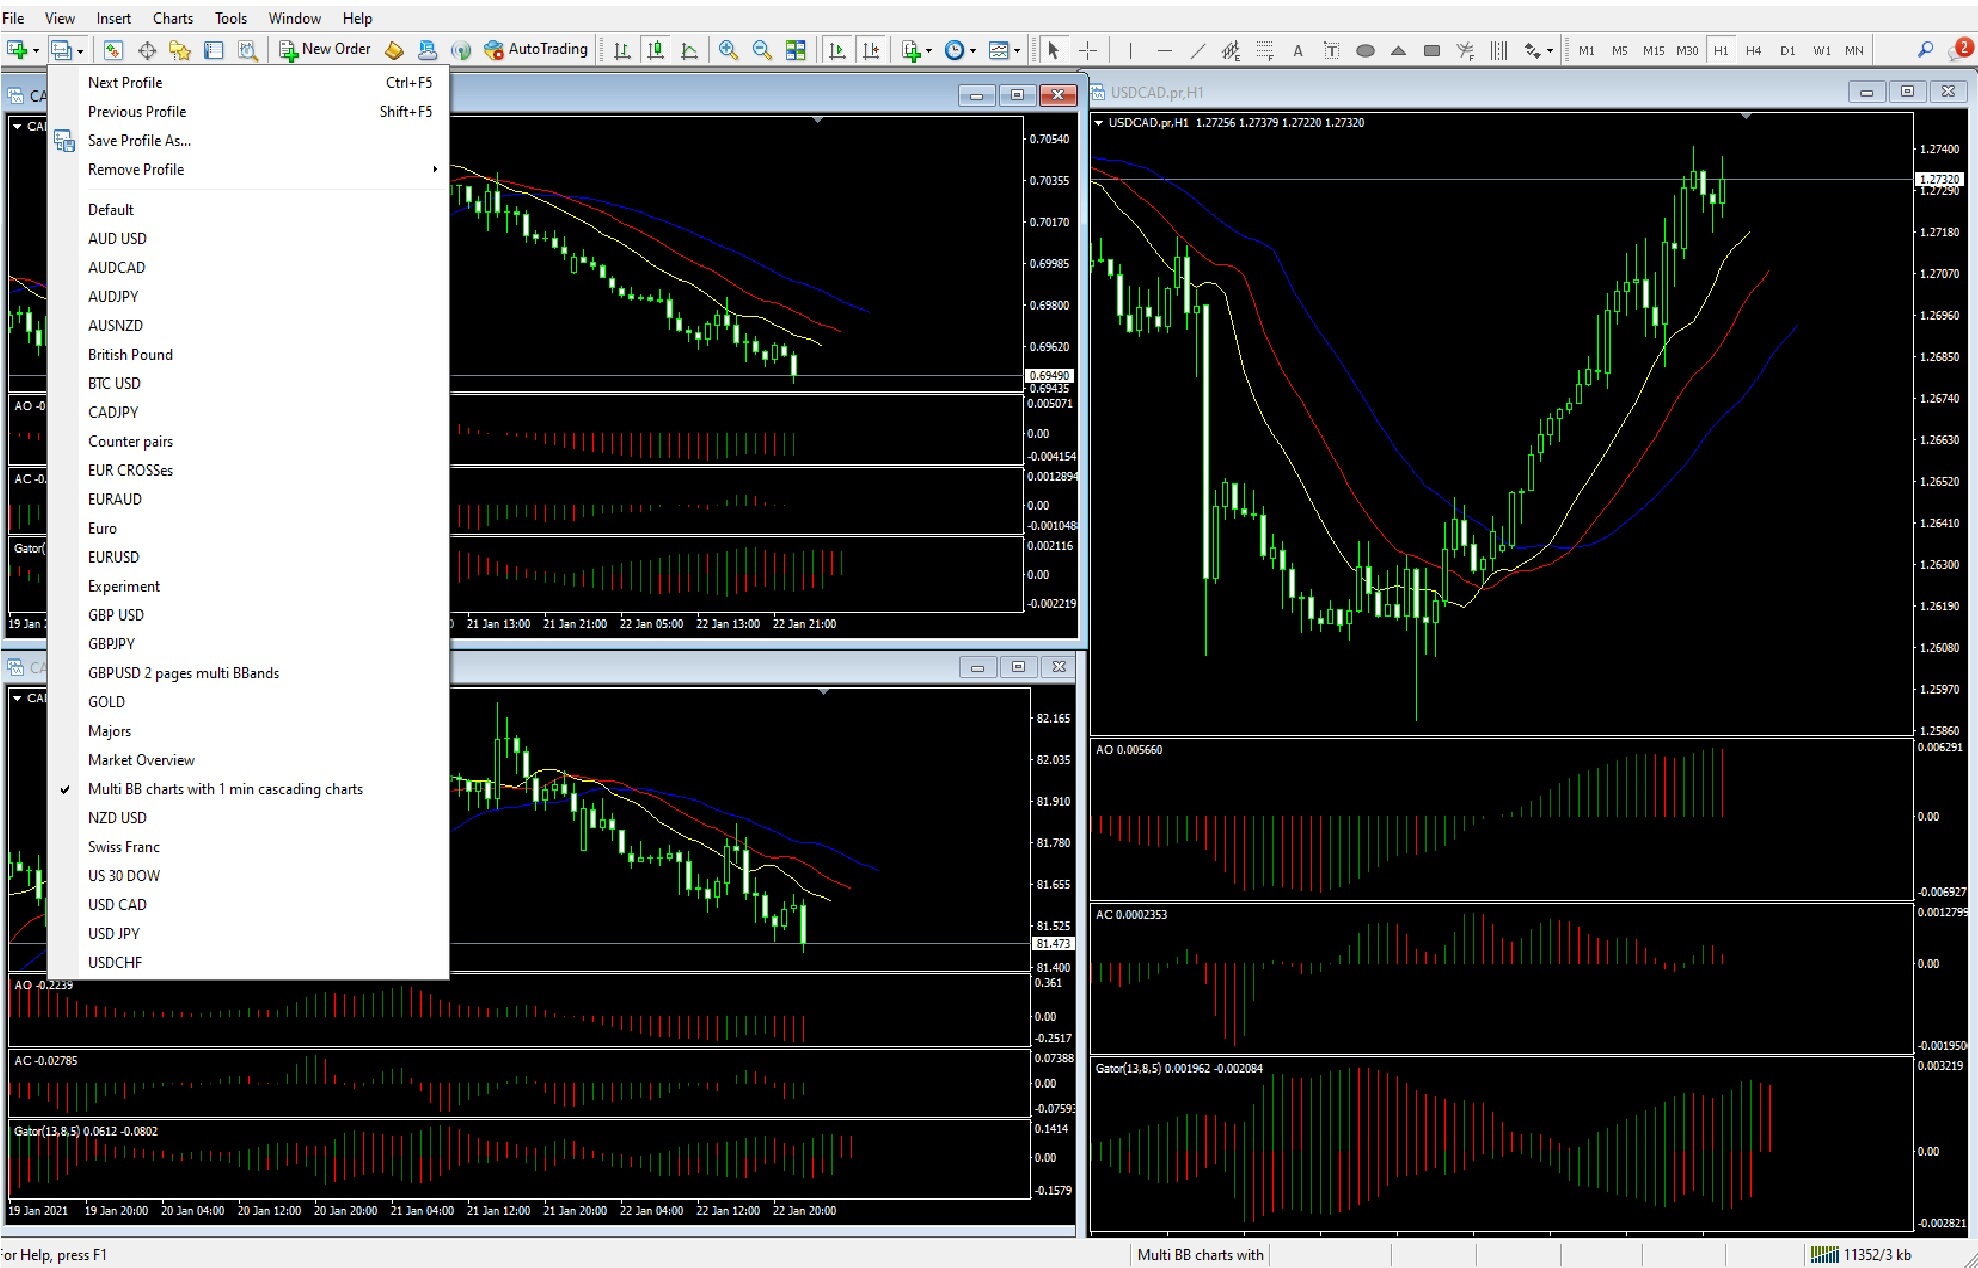
First, we click on the profiles tab at the top of the platform.

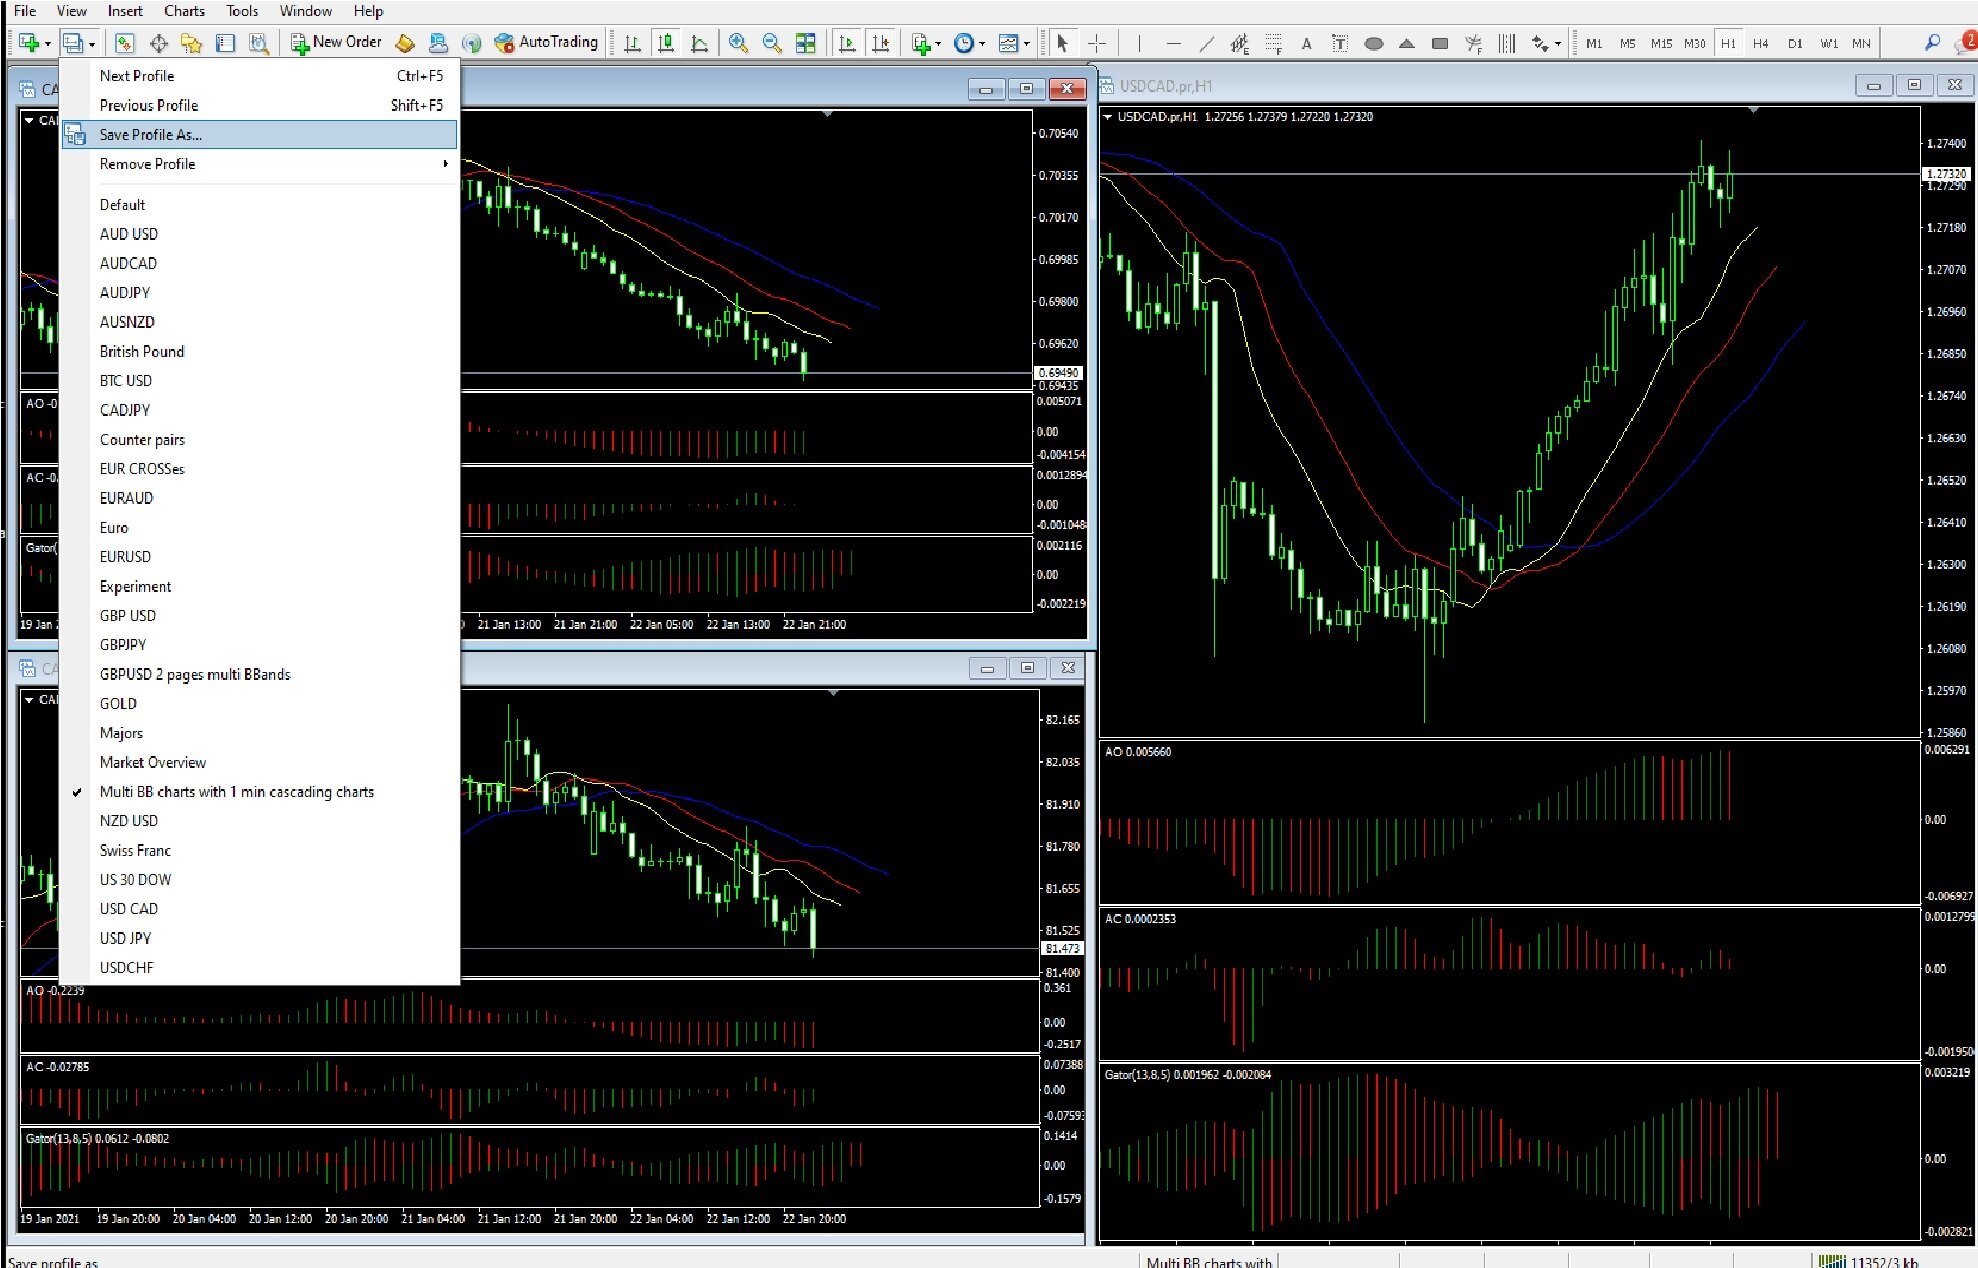
 Then highlight the save profile tab and click on it.

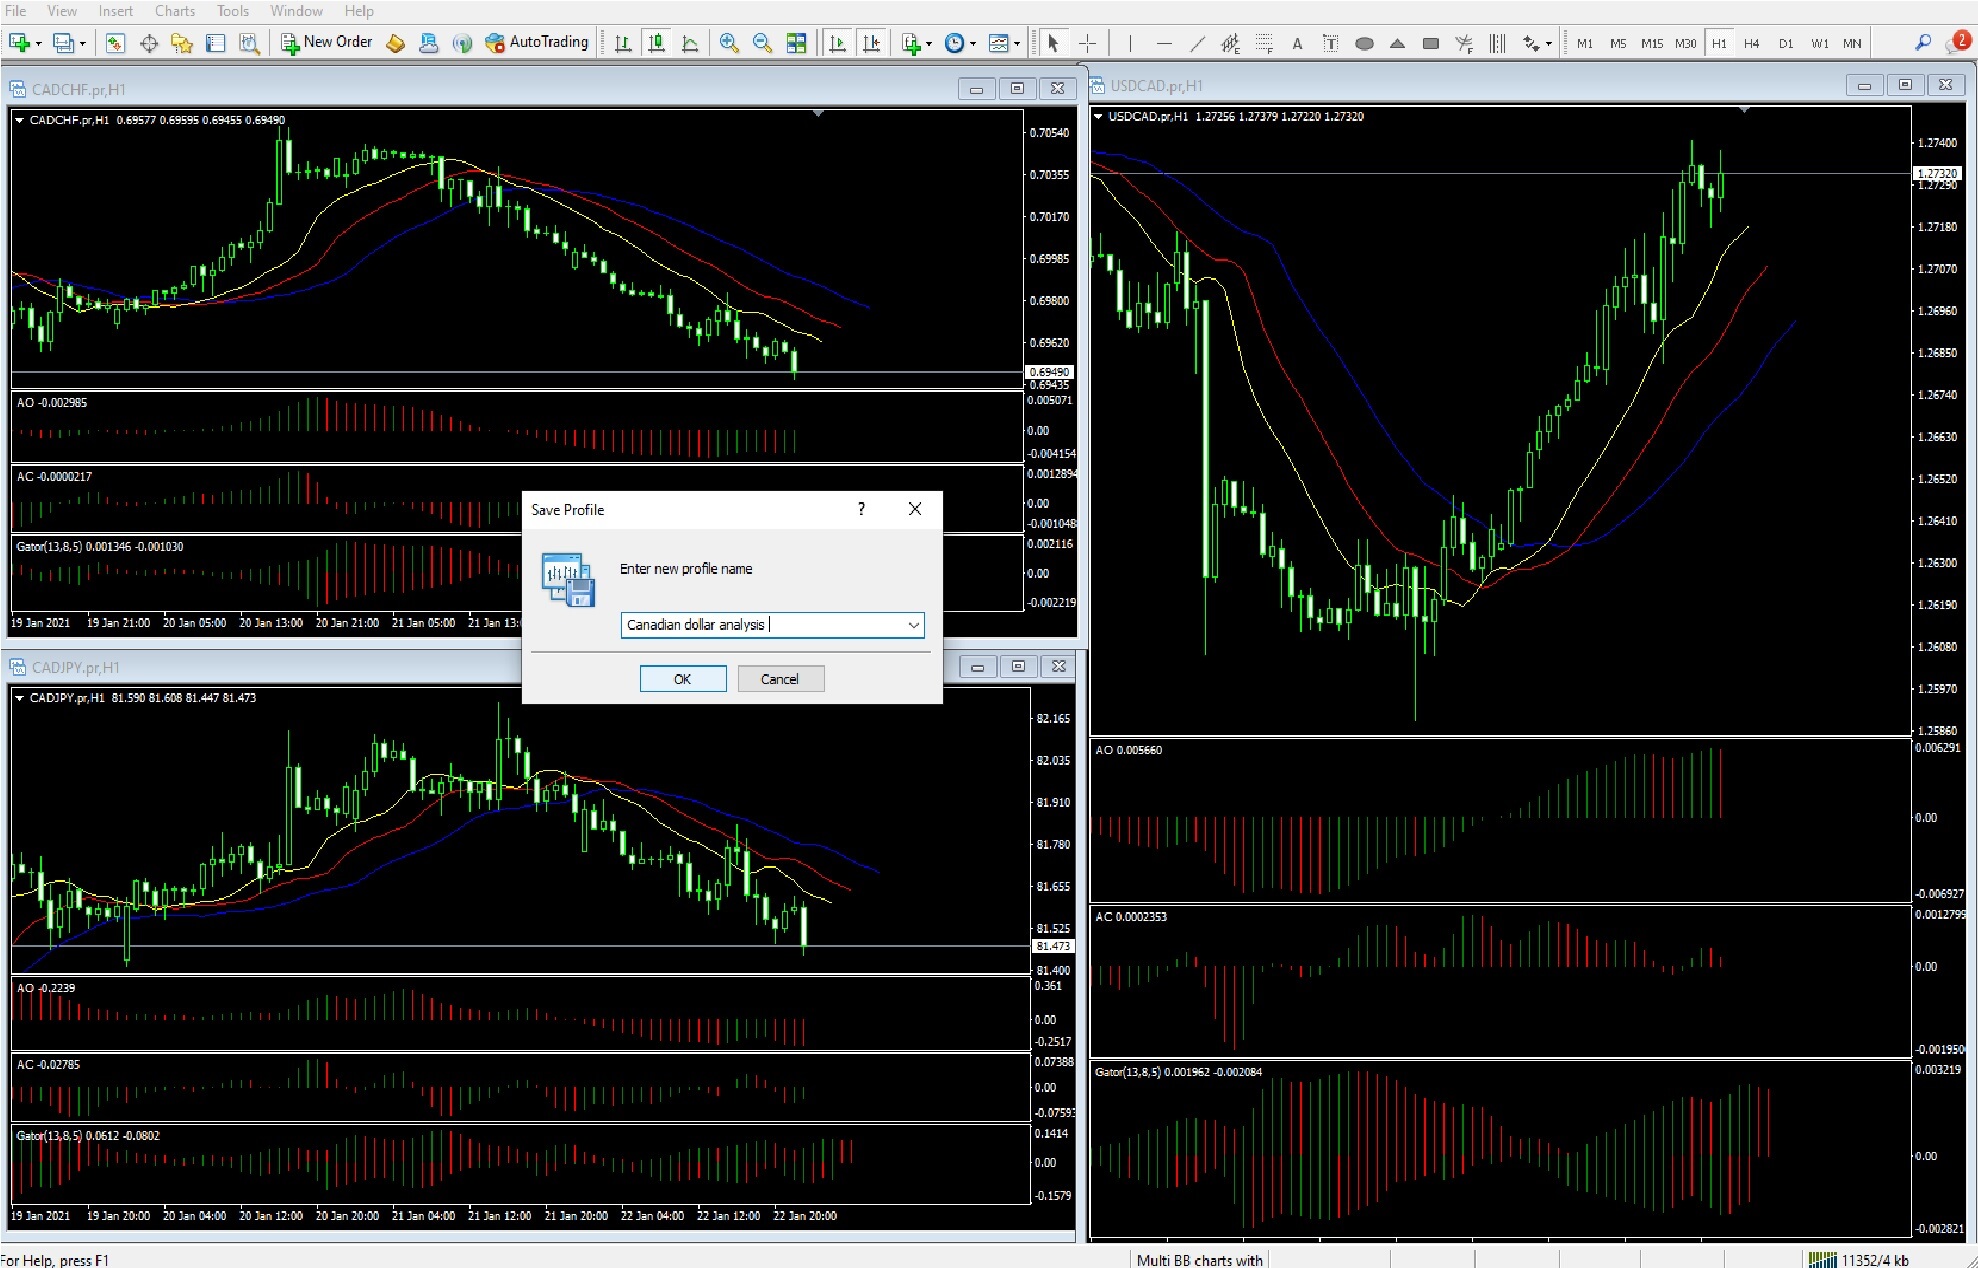
 And then enter a new profile name. Here we have called it the Canadian dollar analysis.

 And finally, click on the ok tab, and the profile will be saved.


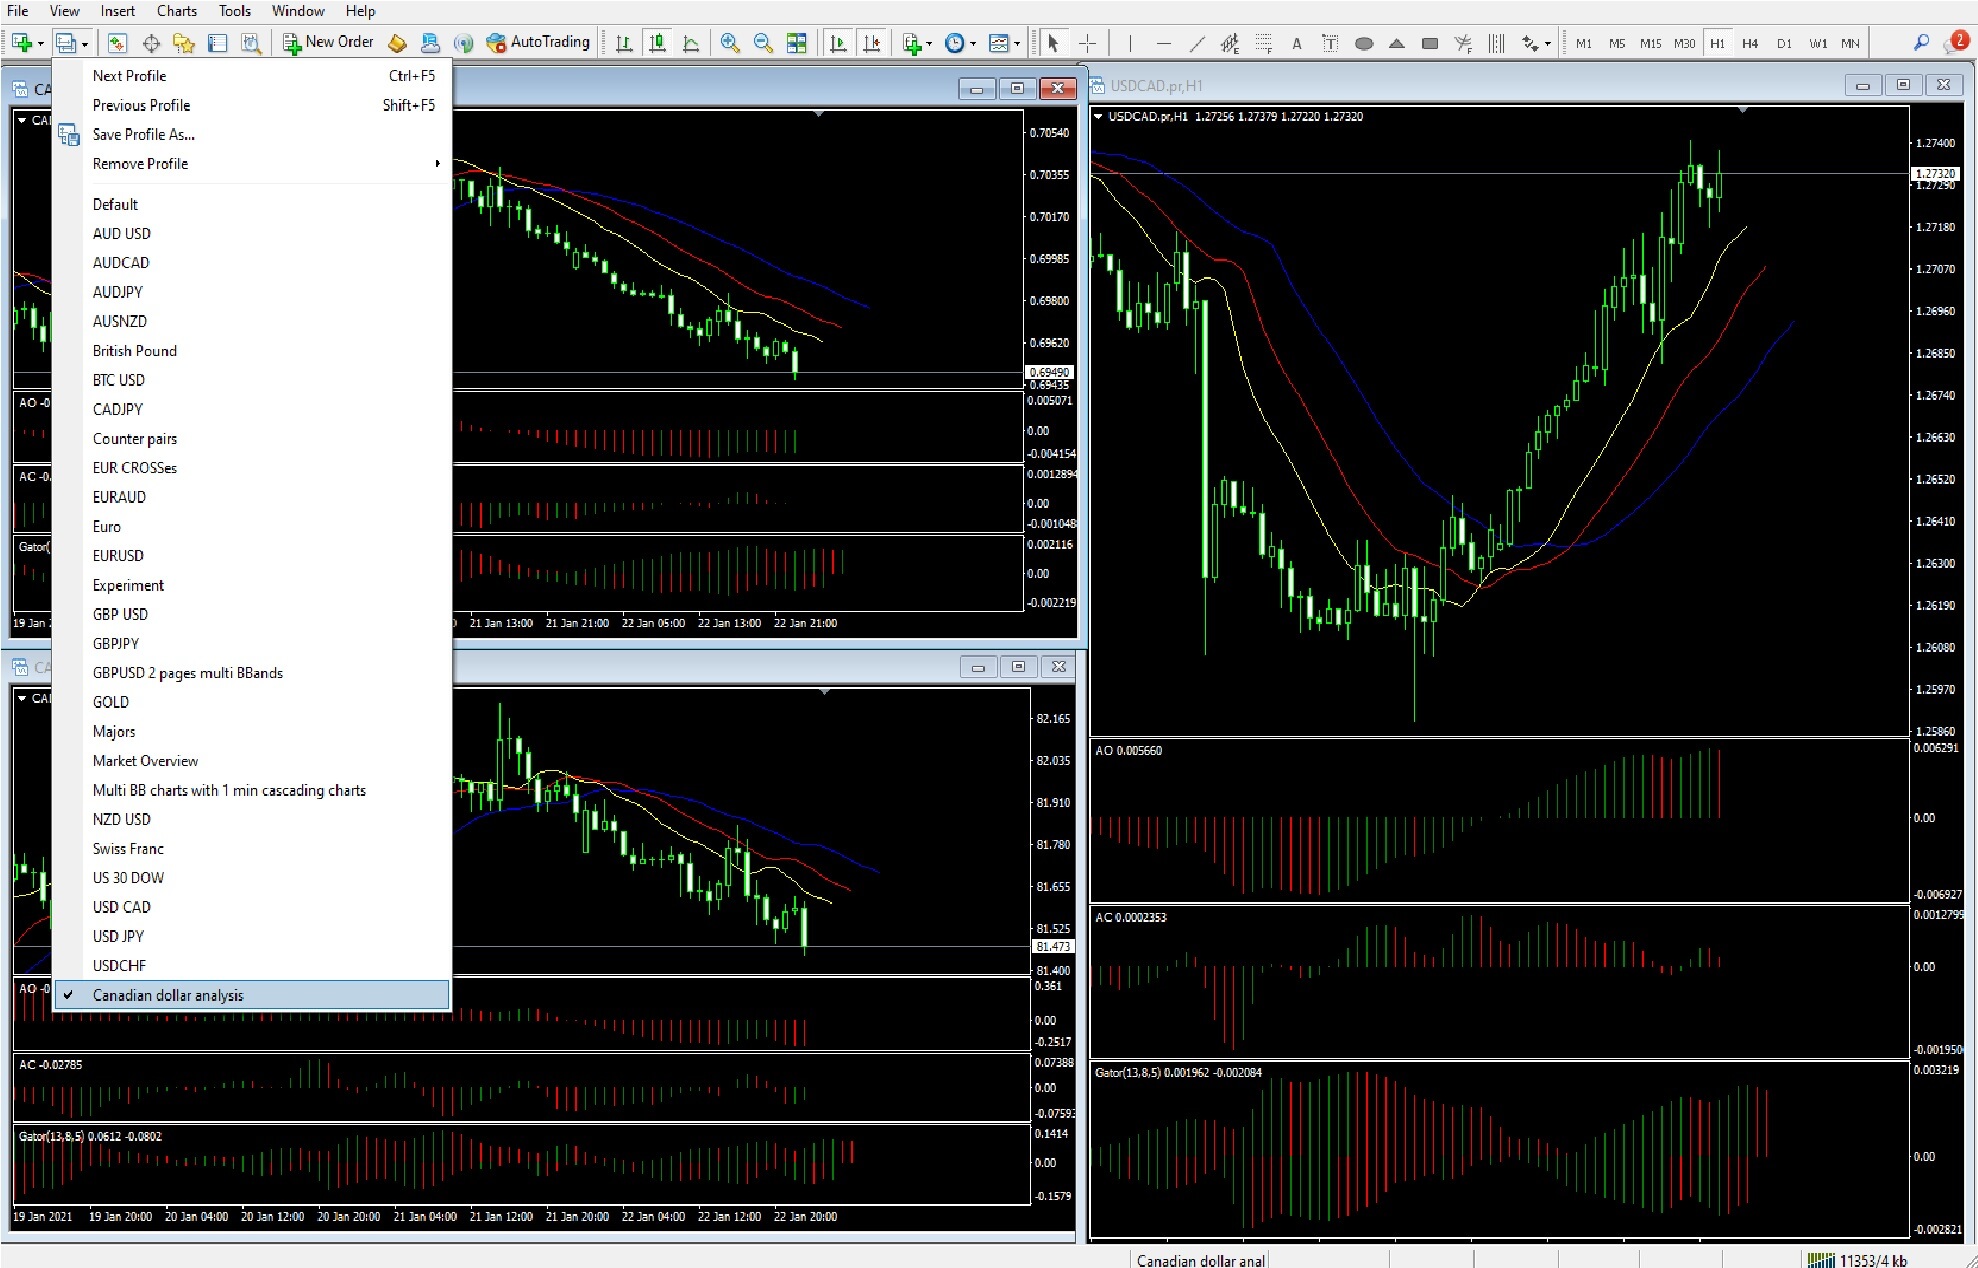
Finally, to find all of your profiles, simply highlight the profiles tab at the top of the MetaTrader platform, and then scroll down to find the one you want. Here at the bottom, as highlighted,  is the Canadian dollar analysis profile, which we have just saved. 

You can see a whole host of similar profiles that we have already saved, including all of the major currency pairs, and where it is very simple and quick to move in and out various saved profiles to maximize opportunities of finding trading opportunities quickly, rather than building profiles each time you have an interest in a particular currency pair.

Categories
Forex Signals

EUR/GBP Downward Channel to Provide Sell Opportunity! 

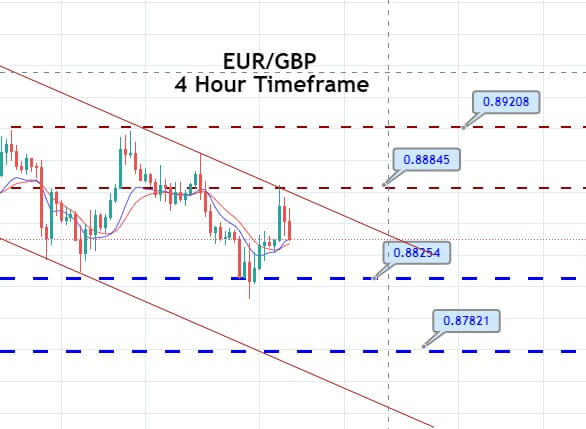
On the 4 hour timeframe, the EUR/GBP pair is trading with a selling bais at 0.8850 level, facing immediate support at 0.8825 level. On the lower side, the EUR/GBP pair may find support at 0.8825 area, whereas violation of this can extend selling bias until the 0.8782 mark. The MACD and RSI support a selling bias, along with a downward channel that we can see on the four hourly timeframes. Here’s a trading plan for today…


Entry Price – Sell 0.88668

Stop Loss – 0.89068

Take Profit – 0.88268

Risk to Reward – 1:1

Profit & Loss Per Standard Lot = -$400/ +$400

Profit & Loss Per Micro Lot = -$40/ +$40

Fellas, now you can check out forex trading signals via Forex Academy mobile app. Follow the links below.

iPhone Users: https://apps.apple.com/es/app/fasignals/id1521281368

Andriod Users: https://play.google.com/store/apps/details?id=academy.forex.thesignal&hl=en_US

Categories
Forex Signals

USD/CAD Enters Overbought Zone – Quick Trade Idea! 

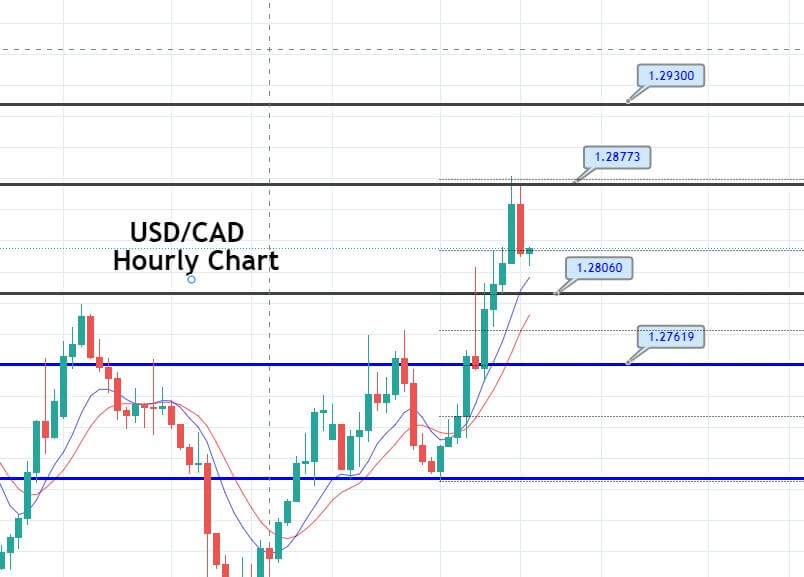
The USD/CAD pair was closed at 1.28019 after placing a high of 1.28224 and a low of 1.26851. Since January 11 on Wednesday, amid the US dollar’s broad-based strength and declining crude oil prices, the currency pair rose to its highest. The US Dollar Index measures the greenback’s value against the basket of six major currencies settled above 90.50 level and supported the US dollar. The US dollar gained traction in the market ahead of the US Federal Reserve monetary policy decision and its safe-haven status.

The risk-averse market mood driven by the rising fears about the negative impact of the lockdown restrictions provided support to the safe-haven US dollar. The US dollar strength remained intact even after the Federal Reserve policy announcement on Wednesday and pushed the currency pair USD/CAD higher on board.

The US Federal Reserve kept its interest rates near zero and asset purchase program at the same pace of $120 billion per month. The Bank stated that the US economic recovery remains moderate throughout the month. The economic path was dependent on the progress made in the pandemic and the vaccination program. These comments from the US Central bank and its Chairman gave strength to the local currency greenback that ultimately added gains in the currency pair USD/CAD on Wednesday.

On the data front, at 18:30 GMT, the Core Durable Goods Orders for December increased to 0.7% against the projected 0.5% and supported the US dollar that added further gains in the USD/CAD pair. In December, the Durable Goods Orders weakened to 0.2% against the projected 1.0%, weighed on the US dollar, and capped further upside momentum in the USD/CAD pair.

On the other hand, there was no macroeconomic data from the Canadian side, and on the West Texas Intermediate (WTI) crude oil front, the oil remained under pressure due to rising prices of the US dollar. The crude oil fell to $51.84 on Wednesday and weighed on the commodity-linked currency Loonie, which ultimately pushed the already rising USD/CAD pair. 


Entry Price – Sell 1.2879

Stop Loss – 1.2930

Take Profit – 1.2810

Risk to Reward – 1:1

Profit & Loss Per Standard Lot = -$400/ +$400

Profit & Loss Per Micro Lot = -$40/ +$40

Fellas, now you can check out forex trading signals via Forex Academy mobile app. Follow the links below.

iPhone Users: https://apps.apple.com/es/app/fasignals/id1521281368

Andriod Users: https://play.google.com/store/apps/details?id=academy.forex.thesignal&hl=en_US

Categories
Forex Daily Topic Forex System Design

Trading System design -Creating Your Strategy with Tradingview’s Pine Script – Part 2

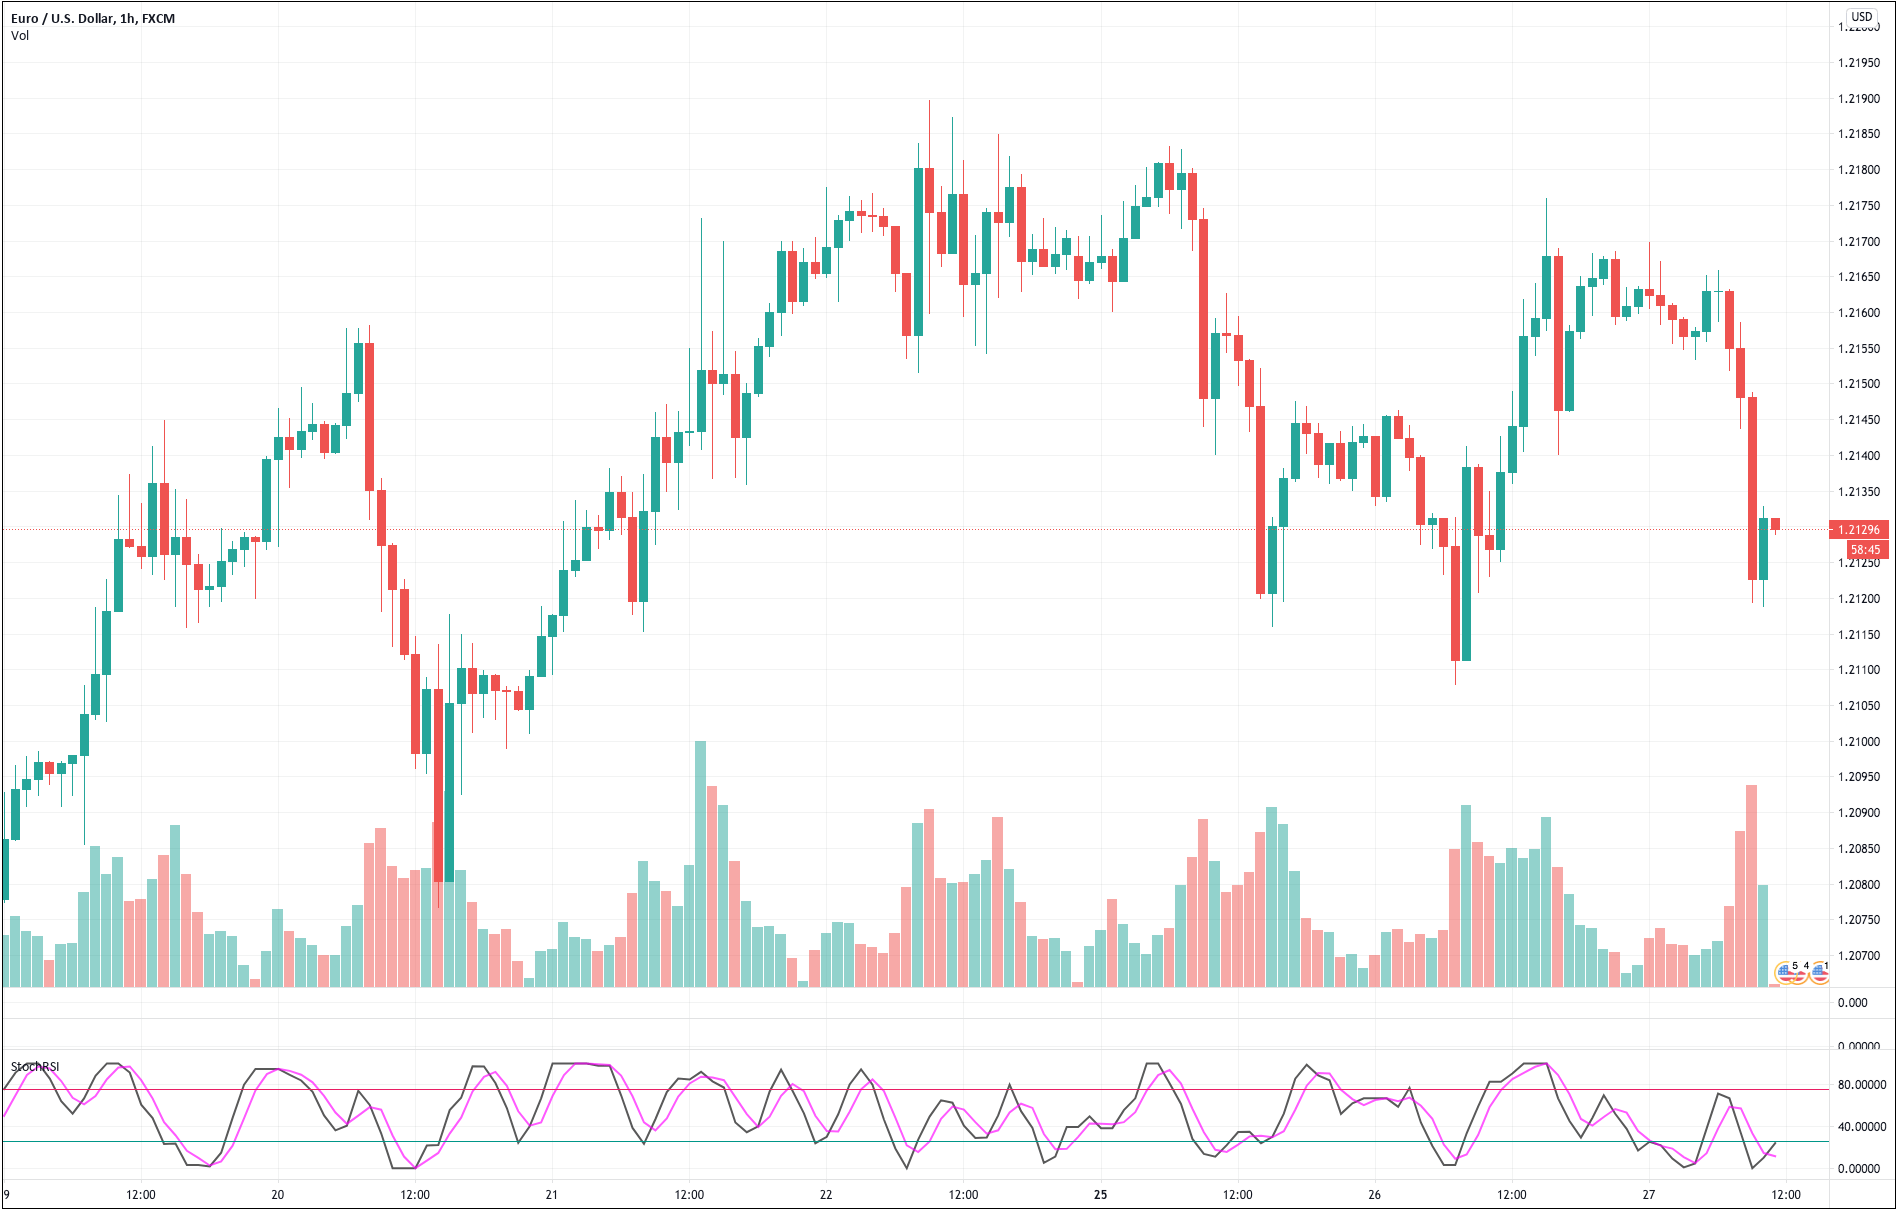
In part 1 of this article series, we have created the Stochastic RSI indicator as part of our idea for a scalping strategy. Now that we have it functional, we will make the bull/bear phases and visually inspect whether it captures the turning market’s turning points.

Possible ways to create bull/bear slices

Our Stochastic RSI consists of two lines, k and d, and two trigger lines, ob and os. Therefore we can use multiple variants that may allow the creation of bull/bear price legs. Let’s consider the following 3

Variant 1 – The transition occurs at the SRSI entrance of the oversold or overbought regions.

Bull: The d-line crosses under the ob-line, which indicates it is into the overbought area
Bear: The d-line crosses over the os-line, indicating d‘s entry into the oversold area.

Code:
if crossunder (d, os)
    SRSI_Long := true
    SRSI_Short := false
else if crossover (d, ob)
    SRSI_Long := false
    SRSI_Short := true 
else
    SRSI_Long := SRSI_Long[1]
    SRSI_Short := SRSI_Short[1]

This code creates a condition SRSI_Long at the cross of d under os, which holds until d crosses over ob and reverses it, creating an SRSI_Short state. This condition is only modified by d crossing under os.
The else statement ensures the condition does not change from the previous bar.

Once we have defined the bull and bear segments, we can color-shade them to visualize them in the chart. To do it, we will use the bgcolor() function.

bgcolor(SRSI_Long ? color.green: na)
bgcolor(SRSI_Short ? color.red: na)

The first statement asks the condition of SRI-Long ( the ? sign). If true, the background color changes to green. Otherwise, no change (an). The second statement behaves similarly for SRSI_Short.

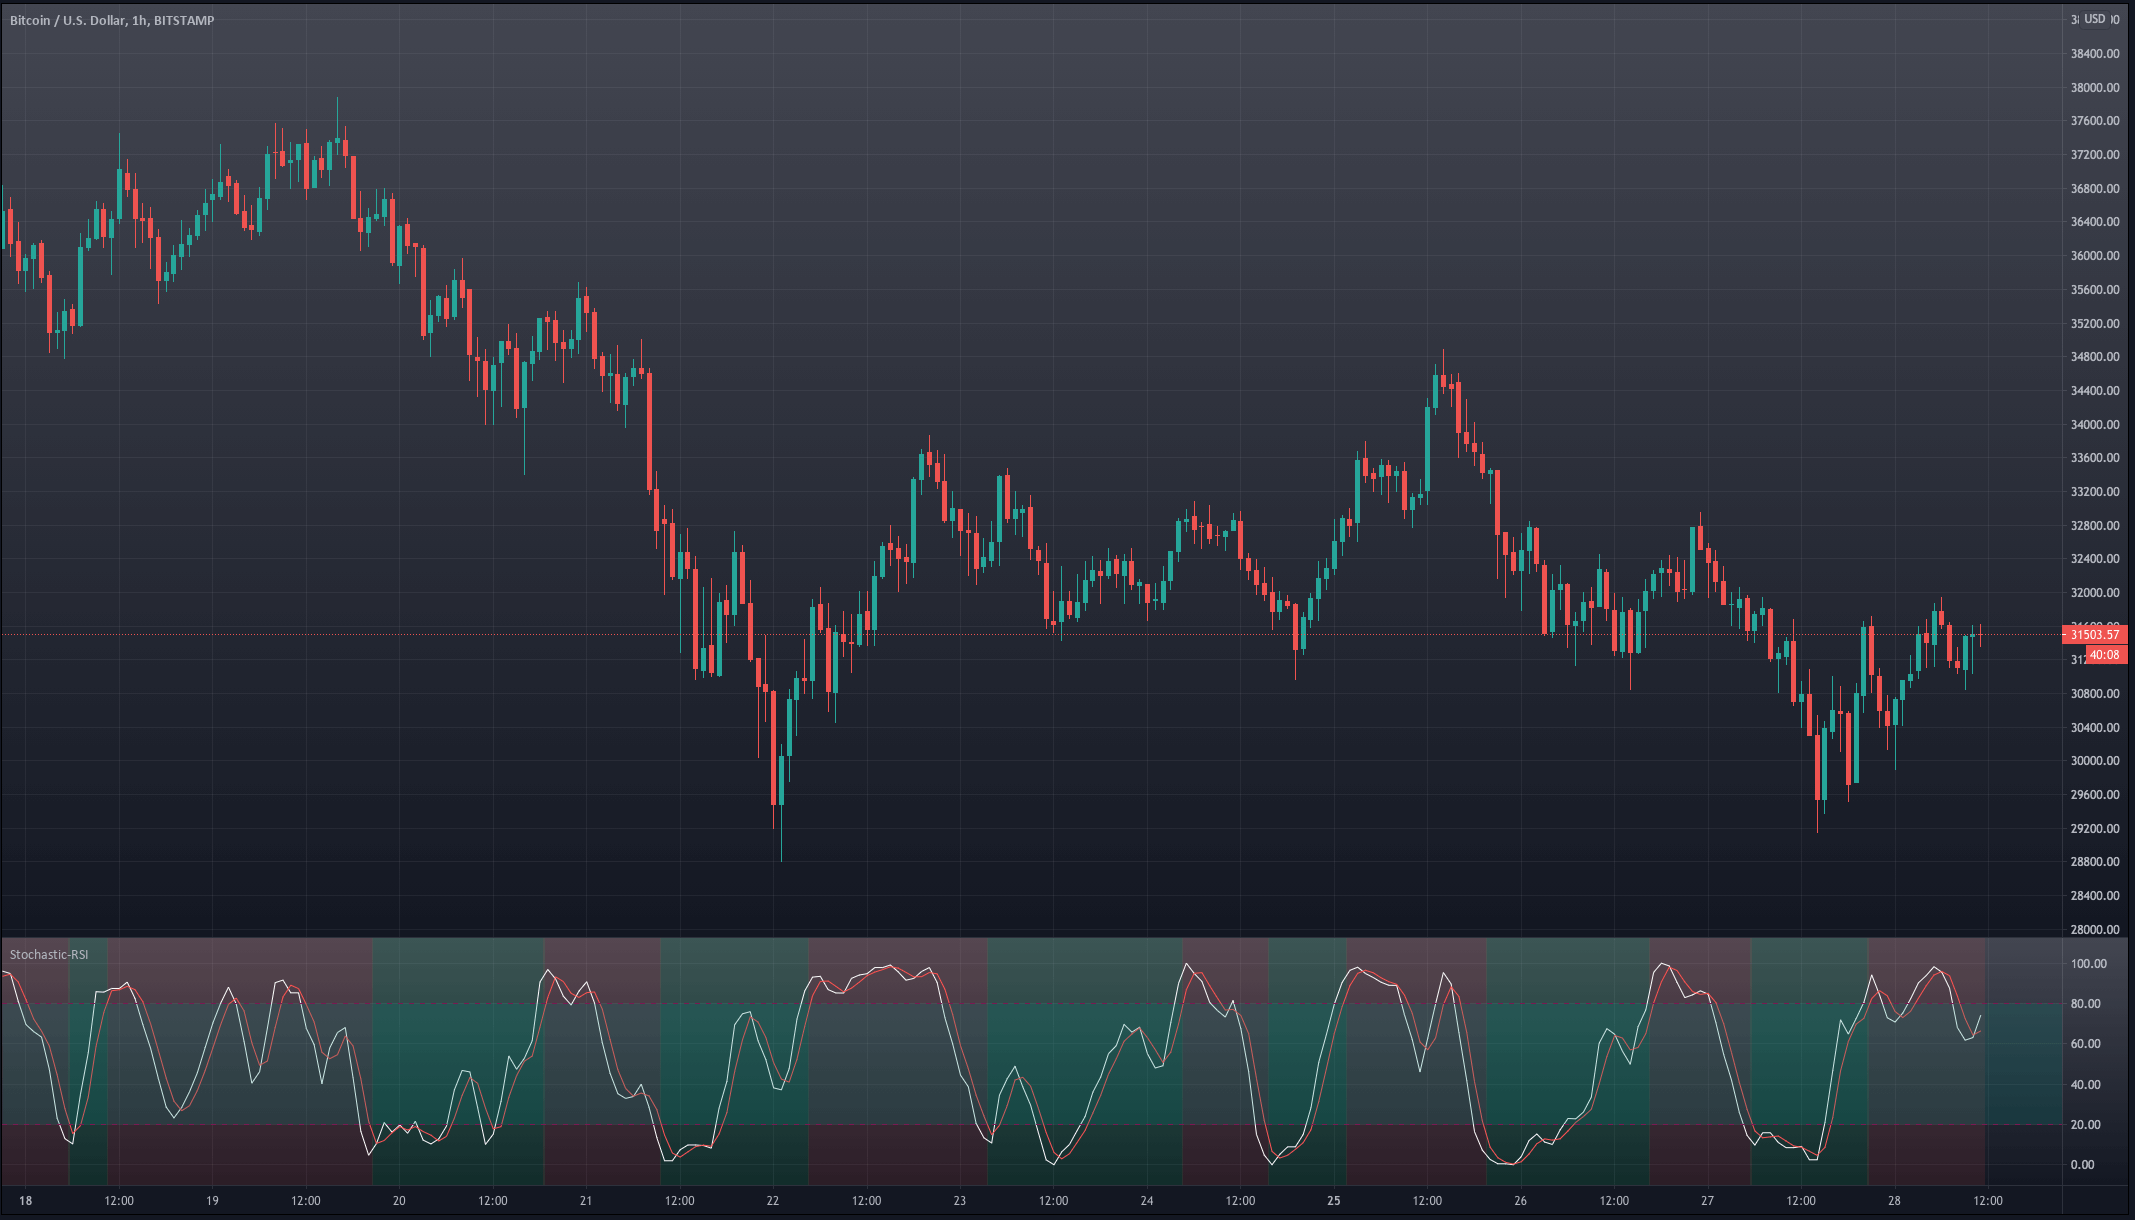
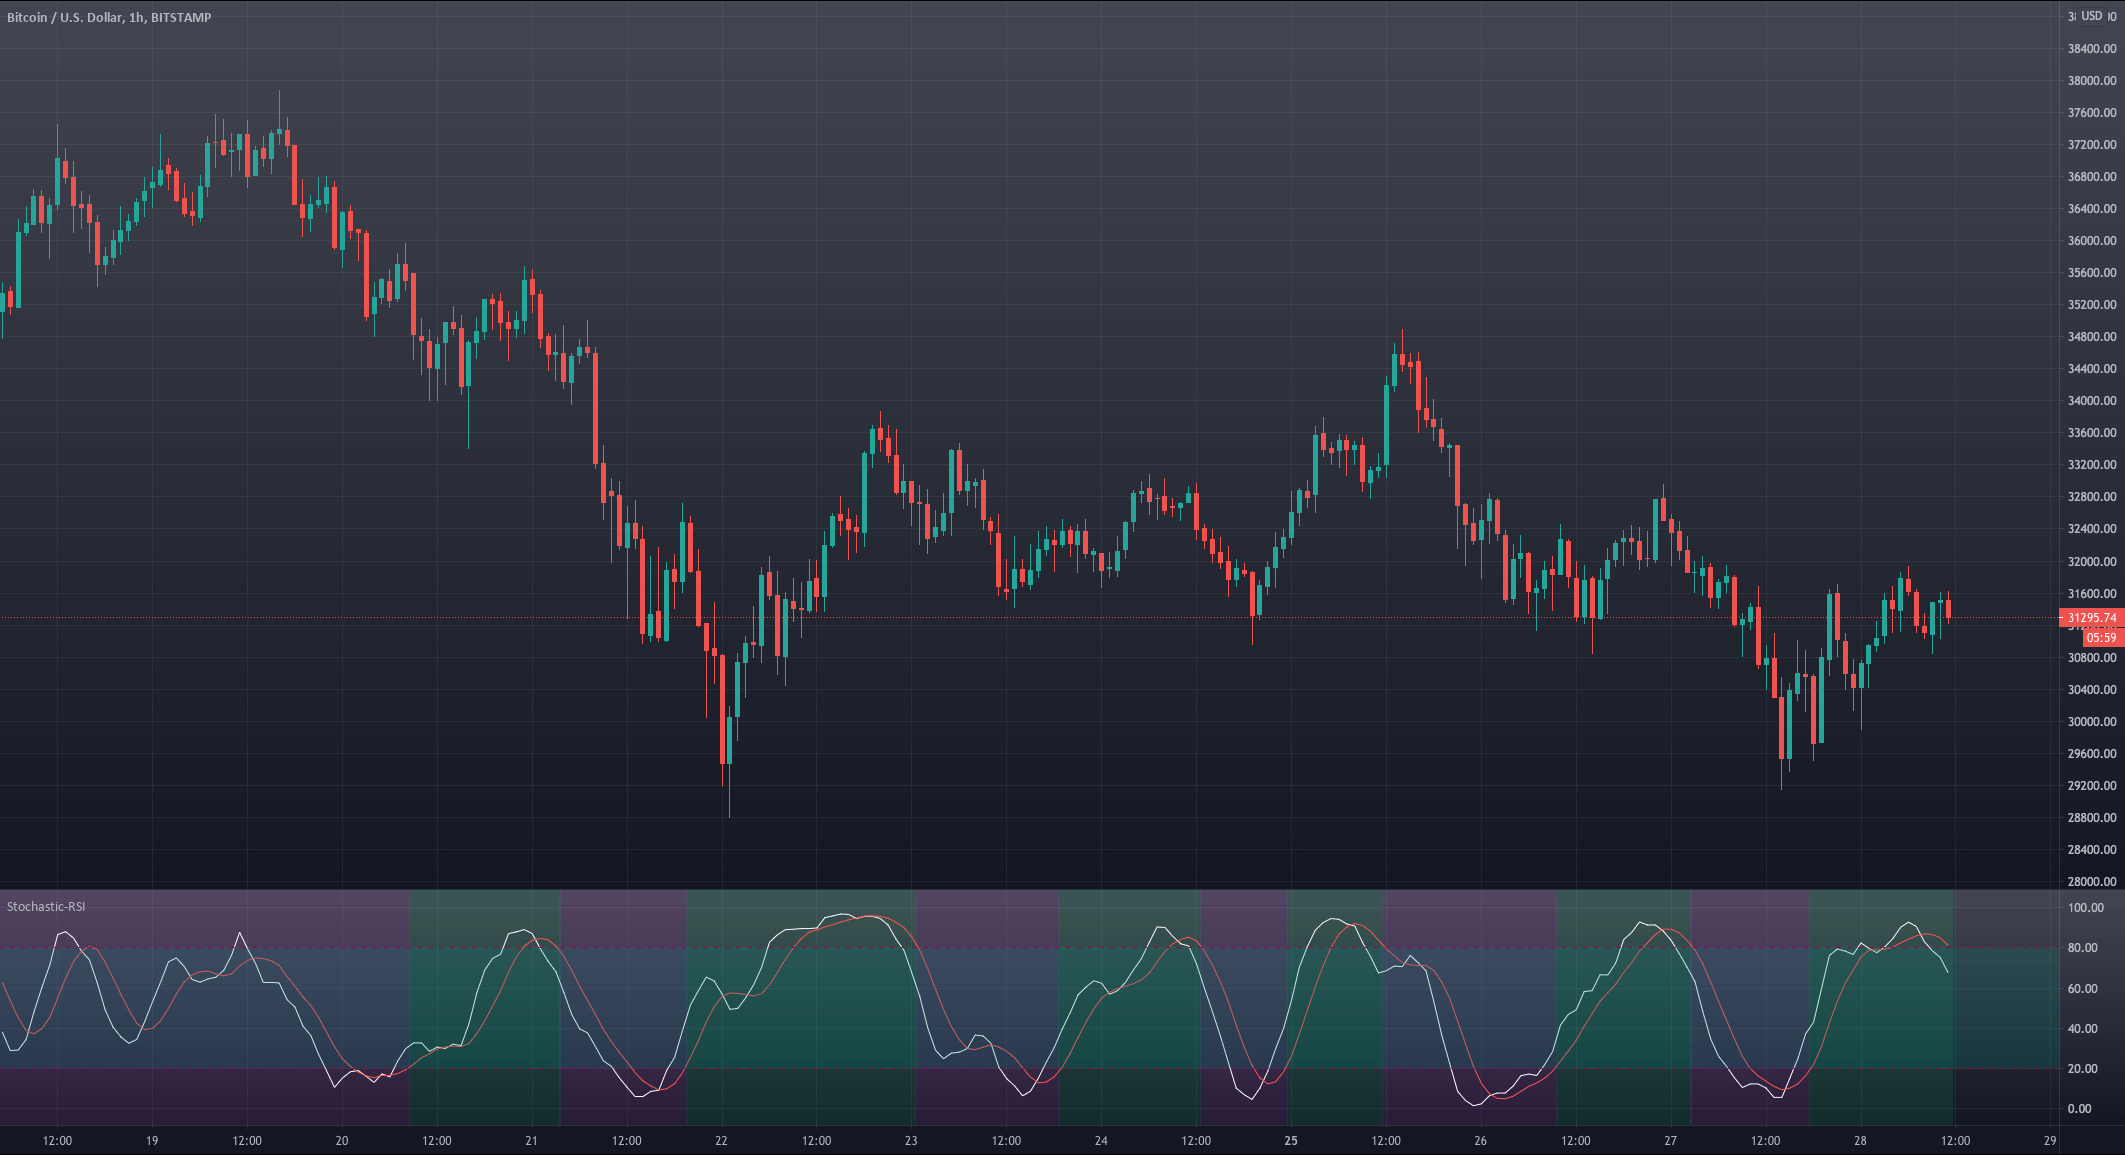
Let’s see how this piece of code behaves in the BTCUSD chart.

Variant 1 triggers the transitions too early. We see that on many occasions when the stochastic RSI enters the overbought or oversold region, it is more a signal of trend strength than a turning point.


Variant 2 – The transition occurs at D and K’s crossovers if in the overbought/oversold regions.

Bull: the k-line crosses over the d-line, if below os ( inside the oversold region. We ignore crosses in the mid-area)
Bear: the k-line crosses under the d-line, if above ob ( in the overbought area. We ignore crosses in the mid-area)

Code:

// creating the long and short conditions for case 2

if crossover(k,d) and d < os
     SRSI_Long := true
     SRSI_Short := false

else if crossunder(k,d) and d > ob
     SRSI_Long := false
     SRSI_Short := true
else
     SRSI_Long := SRSI_Long[1]
     SRSI_Short := SRSI_Short[1]
// bacground color change
bgcolor(SRSI_Long ? color.green: na) 
bgcolor(SRSI_Short ? color.red: na)

The last section for the background change is similar to Variant 1.

Let’s see how it behaves in the chart.

Variant 2 is an improvement. We see that the bull and bear phases match the actual movements of the market, although entries are still a bit early, and in some cases, it missed the right direction. It can be useful as a trigger signal, provided we can filter out the faulty signals.


Variant 3 – the transition occurs when d moved to the overbought or oversold region and, later, crosses to the mid-area.

Bull: the d-line crosses over the os-line
Bear: the d-line crosses under the ob-line.

if crossover (d, os)
    SRSI_Long := true
    SRSI_Short := false
else if crossunder (d, ob)
    SRSI_Long := false
    SRSI_Short := true 
else
    SRSI_Long := SRSI_Long[1]
    SRSI_Short := SRSI_Short[1]
// bacground color change
bgcolor(SRSI_Long ? color.green: na) 
bgcolor(SRSI_Short ? color.red: na)


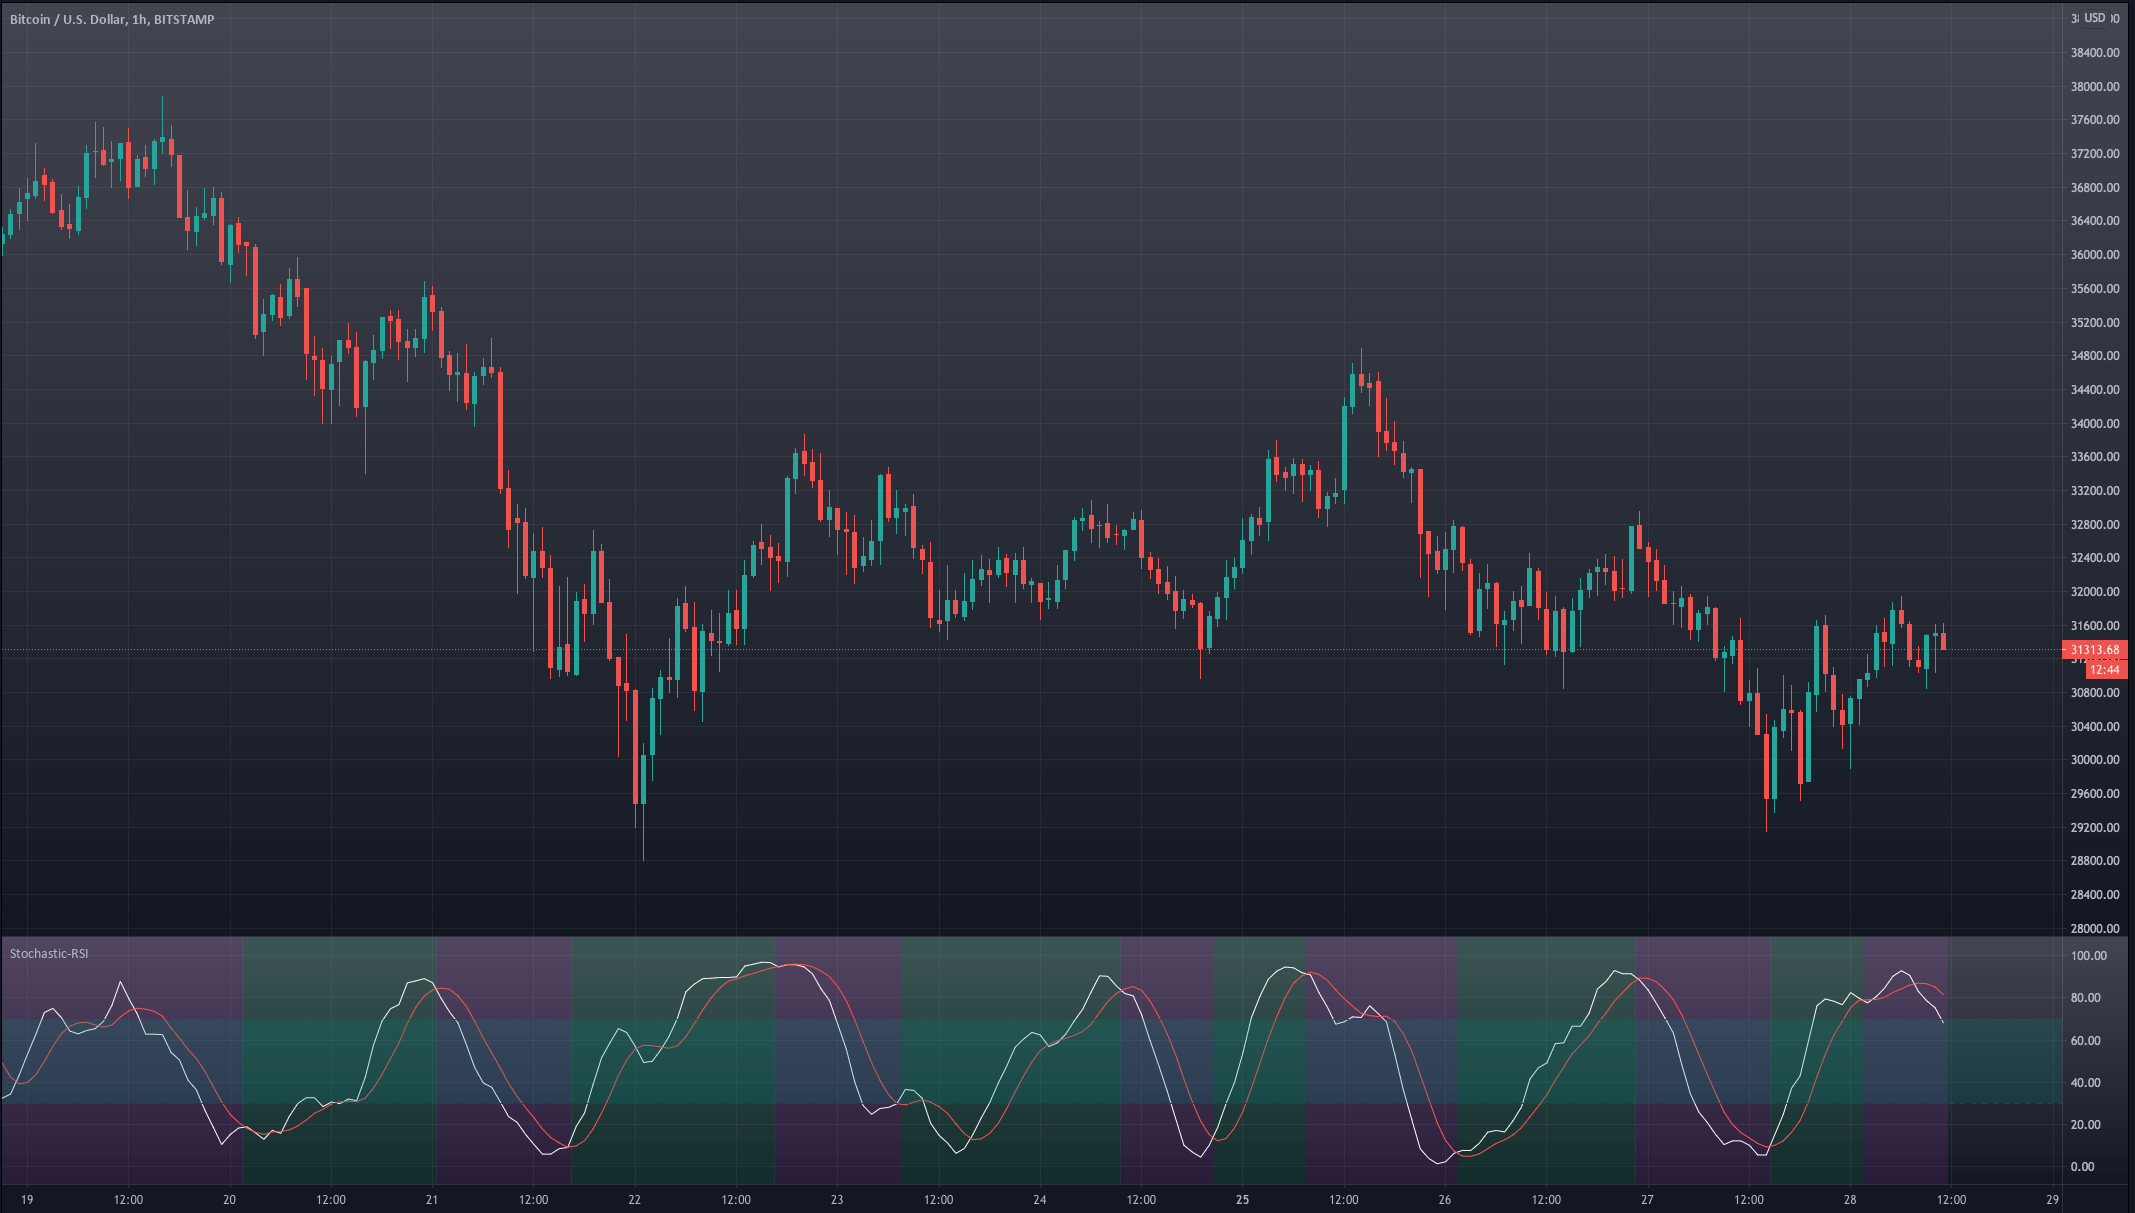
And this is how it behaves in the chart.


Variant 3 lags the turning points slightly, but this quality makes it more robust, as, on most occasions, it’s right about the market direction. This signal, combined with the right take-profit, may create a high-probability trade strategy.

Let’s try this one. But this will be resolved in our next and last article of this series.

Stay tuned!

Categories
Forex Elliott Wave Forex Market Analysis

USDJPY: Be Ready for this Flag Pattern Breakout

The USDJPY pair presents the breakout of a flag pattern corresponding to the third wave of Subminuette degree identified in green, triggered after the flag pattern breakout observed in Wednesday 26th session. Examine with us what’s next for the coming trading sessions.

Our Previous Analysis

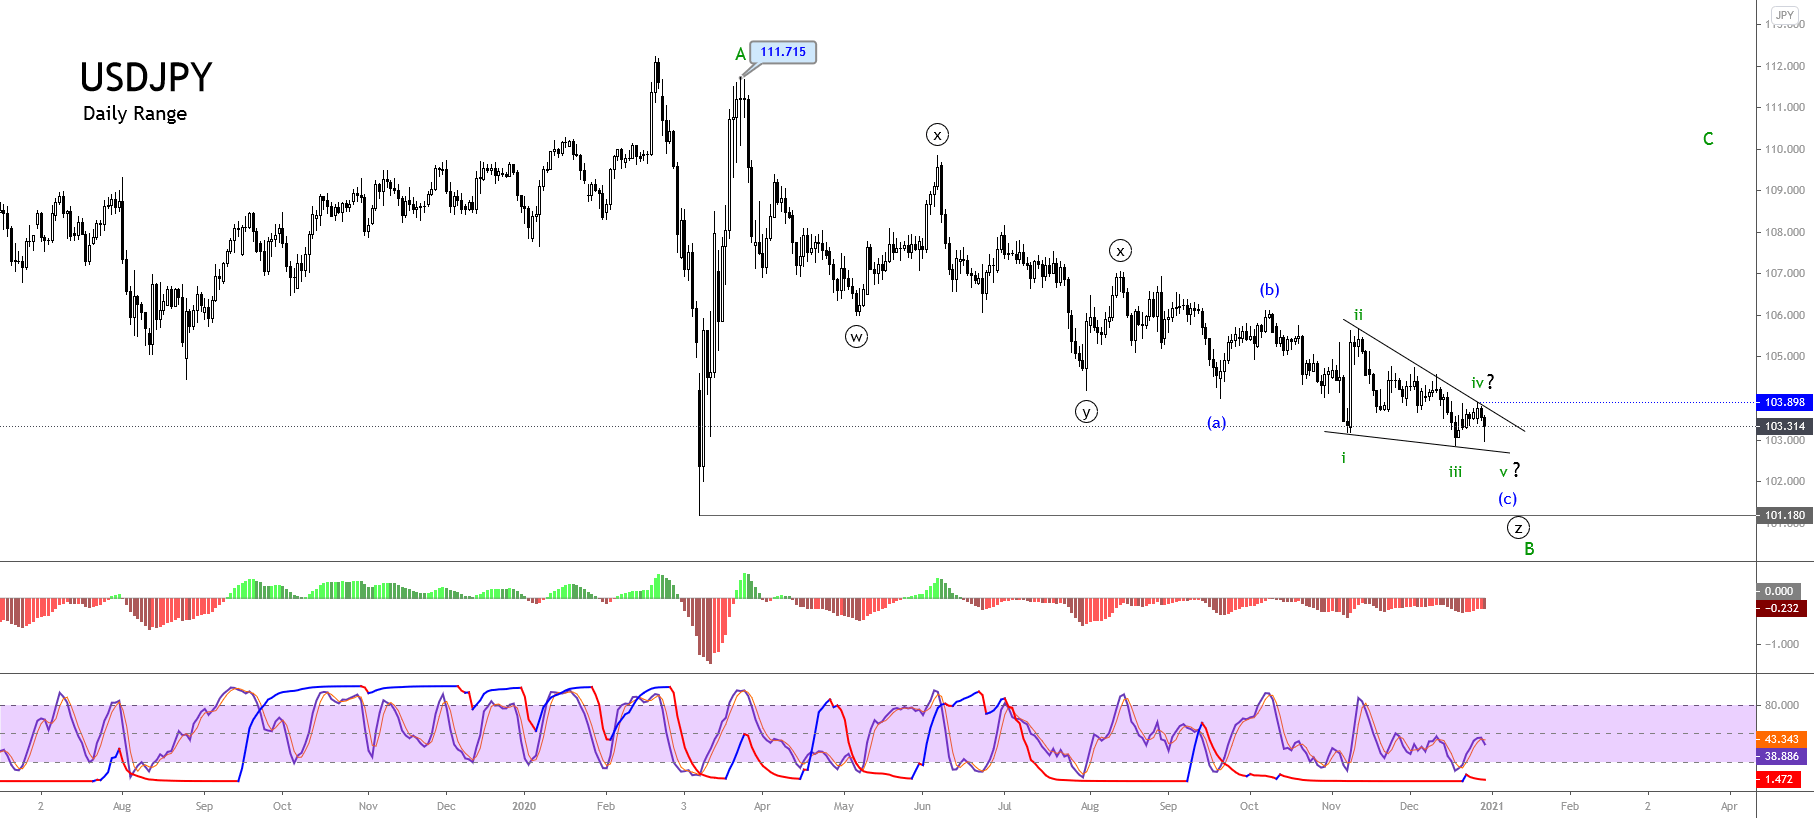
Our previous Elliott wave analysis of the USDJPY pair commented on the complex corrective formation developed by USDJPY since the price topped at 111.715 in March 2020. Also, we recognized the internal structure as an incomplete triple-three pattern. 

As illustrated in the previous daily chart released in late December 2020, the USDJPY pair moved in an incomplete wave (c) of Minuette degree labeled in blue. Likewise, the lower degree sequence revealed the progress in an ending diagonal pattern, suggesting the corrective formation’s exhaustion, which belongs to wave B of Minor degree in green.

Likewise, the breakout of the trendline that connects the end of waves ii and iv of Subminuette degree labeled in green would confirm the end of wave B of Minor degree. In this context, once the USDJPY surpassed the upper-line of the ending diagonal pattern, the pair confirmed the end of wave B and the beginning of wave C of the same degree.

What’s Next?

The USDJPY surpassing the upper guideline of the ending diagonal pattern on January 07th confirmed the completion of wave B of Minor degree and the beginning of wave C of the same degree.

In this context, the first breakout the USDJPY formed in early January corresponds to wave i in green. Likewise, the consolidation sequence recognized as a flag pattern corresponds to wave ii. Both waves belong to wave C of Minor degree labeled in green.

The last breakout developed by the USDJPY activates wave iii that belongs to wave C in green. Its potential advance could strike the psychological barrier of level 106.

Summarizing, the mid-term Elliott wave view for the USDJPY pair suggests that the price action may advance in its wave iii of Subminuette degree, which belongs to the first segment of the internal structure of wave C of Minor degree identified in green. The upward wave iii in progress could exceed the psychological barrier of 106. It even could strike the supply zone between 106.561 and 107.050. Finally, the bullish scenario’s invalidation level is at the beginning of wave i in green, at 102.591.

Categories
Forex Signals

AUD/USD Get Ready for Bullish Correction – Buy Signal Update! 

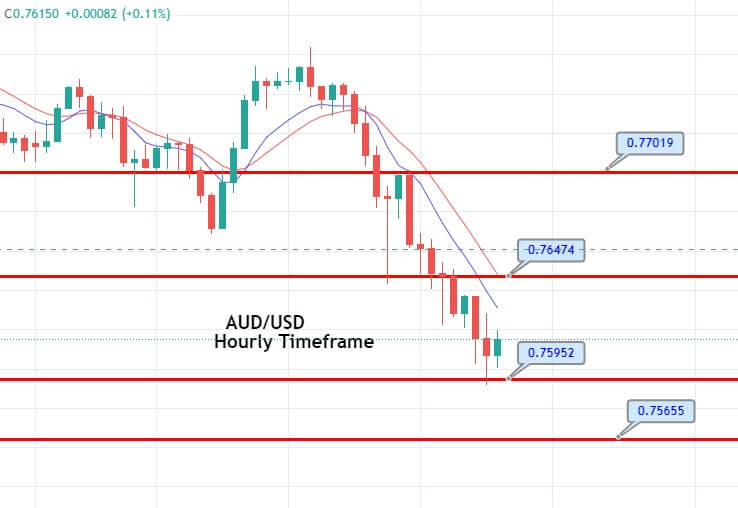
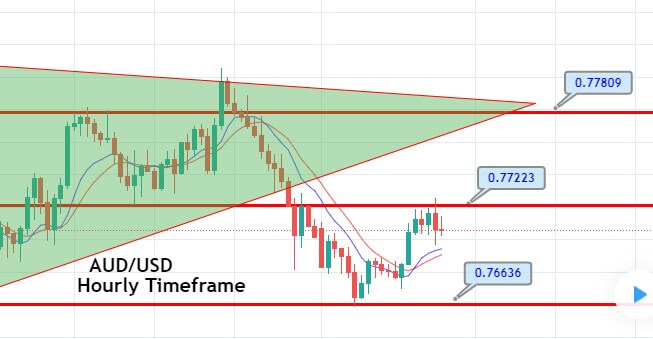
The AUD/USD pair was closed at 0.76630 after placing a high of 0.77636 and a low of 0.76432. The AUD/USD pair reversed its direction on Wednesday and started posting losses for the day due to rising US dollar demand and risk-averse market sentiment. The risk-sensitive Australian dollar suffered on Wednesday as the risk-off market environment started to emerge over the rising concerns of the negative impact of current lockdown restrictions in many nations. The total number of coronavirus cases worldwide reached 100 million and was rising day by day that raised global economic concerns despite the vaccine rollout. These concerns added to the risk-off market sentiment and weighed on the risk perceived Aussie that ultimately dragged the AUD.USD pair on the downside on Wednesday.

The risk-averse market sentiment was also supported by the latest announcement from AstraZeneca and Pfizer, who reported a production difficulty and said that there would be a delay in vaccine delivery that ultimately raised the economic recovery concerns that were connected with the vaccination process. Meanwhile, the US and China’s rising disruptions were also supporting the risk-off market sentiment and weighing on the AUD/USD pair on Wednesday. The US President Joe Biden’s nominee for ambassador to the United Nations, Linda Thomas Greenfield, stressed the importance of US re-engagement with the 193-member world body to challenge China’s efforts to drive an authoritarian agenda.

Beijing has been challenging the traditional US leadership and pushing for greater global influence. The tension between the two superpowers reached its highest in the United Nations last year over the coronavirus pandemic. Greenfield stated that the US broadly has to re-engage with its allies and opponents as she criticized the Trump administration, particularly on its failed efforts to get North Korea to surrender its nuclear weapons program and for trying to “go it alone”.

She also added that Washington needed to pay its dues to the world body (UN). The United States that used to be the largest UN contributor, is currently in arrears about $2 billion for the peacekeeping budget and about $600 million for the regular budget. The fight for greater global influence between China and the US has weighed heavily on the global economy during Trump’s tenure and if the same continued during Biden’s presidency, then the global economy could suffer more. These concerns kept supporting the risk-averse market sentiment and pushed the US dollar that ultimately weighed on AUD/USD pair on Wednesday.

On the data front, at 18:30 GMT, the Core Durable Goods Orders for December improved to 0.7% against the predicted 0.5% and supported the US dollar, and added further losses in AUD/USD pair. In December, the Durable Goods Orders dropped to 0.2% against the predicted 1.0% and weighed on the US dollar.

From the Australian side, at 04:30 GMT, the MI Leading Index for January dropped to 0.1% against December’s 0.7%. At 05:30 GMT, the quarter’s CPI raised to 0.9% against the forecasted 0.7% and supported the Australian dollar that capped further losses in AUD/USD pair. The Trimmed Mean CPI for the quarter remained flat with the expectations of 0.4%. The NAB Business Confidence in December came in as 4 against the previous 13. 

Meanwhile, the US dollar’s strength due to the Federal Reserve monetary policy decision on Wednesday also kept the pair AUD/USD under pressure. The Fed kept its interest rates at the same level near zero and also maintained its asset purchase program at $120 billion per month. 

However, the US central bank said that the economic path was totally dependent on the pandemic progress and the vaccination program. This also supported the US dollar and weighed on AUD/USD pair.


Daily Technical Levels

Support Resistance

0.7688 0.7776

0.7635 0.7809

0.7601 0.7863

Pivot point: 0.7722

Entry Price – Buy 0.76188

Stop Loss – 0.75788

Take Profit – 0.76588

Risk to Reward – 1:1

Profit & Loss Per Standard Lot = -$400/ +$400

Profit & Loss Per Micro Lot = -$40/ +$40

Fellas, now you can check out forex trading signals via Forex Academy mobile app. Follow the links below.

iPhone Users: https://apps.apple.com/es/app/fasignals/id1521281368

Andriod Users: https://play.google.com/store/apps/details?id=academy.forex.thesignal&hl=en_US

Categories
Forex Market Analysis

Daily F.X. Analysis, January 28 – Top Trade Setups In Forex – Advance GDP in Focus!

Later today, the focus will remain on the German Prelim CPI and Advance GDP figures from the U.S. both of the events are expected to perform worse than before as the data represents the economic activity of the lockdown period. So most of it is already priced in. However, the U.S. Jobless claims will remain in the highlights, and these are expected to rise again, perhaps due to the second wave of COVID19 in the U.S.

Economic Events to Watch Today  


EUR/USD – Daily Analysis

The EUR/USD pair was closed at 1.21117 after placing a high of 1.21696 and a low of 1.20581. The EUR/USD pair posted losses on Wednesday as the Federal Reserve kept its benchmark short-term interest rates unchanged near zero and maintained an asset purchasing program at $120 billion a month. 

The Federal Reserve Open Market Committee released its statement from the January meeting that stated that the pace of recovery in economic activity and employment has moderate in recent months with weakness concentrated in the sectors most adversely affected by the pandemic. 

According to the statement, the coronavirus pandemic was causing tremendous human and economic hardship across the United States and worldwide. The committee also stated that the economy’s path would depend significantly on the course of the virus, including the progress on vaccination.

The market’s reaction to the Federal Reserve policy decision kept the EUR/USD pair under pressure, and hence, the currency pair started to extend its losses on Wednesday. Whereas the single currency Euro faced mixed movements throughout the day, the currency remained under pressure with fresh speculations that the ECB could soon cut Eurozone interest rates. The Central Bank was reportedly concerned that markets were pricing out the chances of more interest rate cuts from the ECB. 

Furthermore, the fears for vaccine shortage in Eurozone also weighed on the single currency on Wednesday after the European Union called out vaccine makers AstraZeneca and Pfizer over delivery delays that could slow its recovery from the pandemic. Officials were even threatening to restrict exports and take legal actions as anger mounts. 

According to E.U. officials, AstraZeneca will not deliver as many doses as it promised and has put the government rollout plans and economic recovery at risk. The news came in after Pfizer said that it had delivered fewer doses of its vaccine than expected last week. European Commission President Ursula von der Leyen turned up the pharmaceutical companies’ heat and said that Europe had invested billions in helping develop the world’s first coronavirus vaccine to create a truly global common good, and now companies must deliver and honor their obligations. 

The European Union has devoted part of 2.7 billion euros emergency fund to assist with vaccine development. E.U. countries we recounted on the vaccines to rein in the health crisis and jumpstart their economies, but now they were forced to modify their plans. Furthermore, the E.U. urged the pharmaceutical firm AstraZeneca to supply it with more coronavirus vaccine doses from U.K. plants to row over shortages. However, the company denied and said that the production delay in European plants could only deliver a fraction of the doses it promised for the first quarter of the year. However, the E.U. insisted that doses made elsewhere should make up the shortfall and d criticize the slow rollout of vaccination.

This vaccine drama in the European Union raised concerns over the delayed economic recovery and added weight on the single currency Euro that ultimately added EUR/USD pair losses on Wednesday.

On a data front, at 18:30 GMT, the Core Durable Goods Orders for December rose to 0.7% against the expected 0.5% and supported the U.S. dollar that added more losses in EUR/USD pair. 

In December, the Durable Goods Orders dropped to 0.2% against the expected 1.0% and weighed on the U.S. dollar. From the European side, at 12:00 GMT, the German GfK Consumer Climate dropped in January to -15.6 against the forecasted -7.8. It weighed on Euro that ultimately dragged the currency pair EUR/USD further on the downside on Wednesday. 


Daily Technical Levels

Support Resistance

1.2119 1.2189

1.2079 1.2217

1.2050 1.2258

Pivot point: 1.2148

EUR/USD– Trading Tip

The EUR/USD pair is trading with a bearish bias at 1.2090, facing immediate resistance at 1.2120 level. The EUR/USD is closing three black crows on the hourly timeframe, suggesting selling bias in the pair. On the lower side, the pair is expected to go after 1.2095 and 1.2060 level. The 50 periods EMA are suggesting selling bias in Euro today.

GBP/USD – Daily Analysis

The GBP/USD pair was closed at 1.36887 after placing a high of 1.37586 and a low of 1.36590. On Wednesday, the currency pair GBP/USD dropped and posted losses for the day amid the broad-based U.S. dollar strength after the FOMC statement and Fed’s monetary policy decision.

The Federal Reserve Open Market Committee released its statement from January’s meeting on Wednesday that mentioned that the Fed will keep its interest rates near zero and maintain the asset purchasing program of $120 billion per month.

Federal Reserve said that the economic path would solely be decided by pandemic and vaccine rollout developments. Other than this, everything stated in the statement issued by FOMC was just as expected and supported the U.S. dollar that ultimately kept the GBP/USD pair under pressure for the day. On the data front, at 18:30 GMT, the Core Durable Goods Orders for December surged to 0.7% against the anticipated 0.5% and supported the U.S. dollar that ultimately added weight on GBP/USD pair. In December, the Durable Goods Orders fell to 0.2% against the anticipated 1.0% and weighed on the U.S. dollar that capped further GBP/USD pair losses. 

From Britain’s side, at 05:01 GMT, the BRC Shop Price Index for the year came in as -2.2% against the previous -1.8%.

The GBP/USD pair rose to its highest since May 2018 on Wednesday however failed to remain there and reversed its direction. The rise in the GBP/USD pair during the session’s early trading hours could be attributed to U.K. Prime Minister Boris Johnson’s latest comments.

The PM has said that he hopes that a gradual and phased relaxation of coronavirus restrictions could begin in early March. Johnson said that he intended to set out a plan to ease the lockdown in England. The factors will include death and hospitalization numbers, the progress of vaccinations, and changes in viruses.

He also ruled out schools in England re-opening after the February half term instead set a target of 8-March. He also announced a 10-day self-funded quarantine restriction for all travelers entering the U.K. from high-risk countries under tighter border restrictions to combat new variants of coronavirus. The PM was under pressure from Tory MPs to spell out plans for how the current lockdown will end. Then PM replied that relaxing restriction would depend on emerging data about how effectively the vaccine stops virus transmission. These comments from UK PM raised the local currency, British Pound, to economic recovery and pushed the pair GBP/USD in early trading hours. However, the strength of the U.S. dollar due to the Federal Reserve’s decision in the January monetary policy meeting added pressure on the currency pair. It dragged GBP/USD to the downside.


Daily Technical Levels

Support Resistance

1.3647 1.3783

1.3560 1.3832

1.3511 1.3918

Pivot point: 1.3696

GBP/USD– Trading Tip

A day before, the GBP/USD pair traded bullish after violating the narrow trading range of 1.3680 – 1.3670. It placed a high of around 1.3753 level, and it later reversed back to trade between the same trading range of 1.3696 – 1.3646. The GBP/USD may find support around the 1.3647 level, and violation of this level can extend selling bias until 1.3610. Approaching the 2-hour timeframe, the GBP/USD is holding below 10 and 20 periods EMA, and it may extend the selling trend today. Let’s consider taking a sell trade until 1.3645 and 1.361 level.  

USD/JPY – Daily Analysis

The USD/JPY pair was closed at 104.108 after placing a high of 104.197 and a low of 103.579. The USD/JPY pair rose and reached its nine-day highest level on the back of the U.S. dollar’s broad-based strength. 

The currency pair USD/JPY touched its highest since January 19 and surpassed 104 level on Wednesday as the greenback became strong on board. The currency pair preserved its bullish momentum as the U.S. Dollar Index that measures the greenback’s value against the basket of six major currencies rose to a weekly top at 90.62 on Wednesday and boosted the safe-haven U.S. dollar. The strength in the U.S. dollar then ultimately pushed the currency pair USD/JPY on the upside.

The risk-averse market sentiment was confirmed by the declining S&P 500 futures that lost more than 1% on the day. Wall Street’s main indexes also started the day in negative territory and supported the U.S. dollar and USD/JPY pair. On the data front, at 18:30 GMT, the Core Durable Goods Orders for December advanced to 0.7% against the estimated 0.5% and supported the U.S. dollar, and added further gains in the USD/JPY pair. In December, the Durable Goods Orders plunged to 0.2% against the estimated 1.0% and weighed on the U.S. dollar. Nevertheless, investors largely ignored the data as the focus was solely on the FOMC’s policy announcement.

The first policy meeting under Joe Biden’s presidency had all the investors’ focus, and that kept driving the whole market on Wednesday. The Federal Reserve Chairman Jerome Powell made clear that the U.S. Central bank was nowhere near exiting massive support for the economy during the ongoing coronavirus pandemic. The Federal Reserve officials kept the benchmark interest rates unchanged near zero and flagged a moderating U.S. recovery in a statement released by FOMC for the January meeting. The bank repeated that it would maintain its bond-buying program at the current pace of $120 billion of purchases per month until substantial further progress towards its employment and inflation goals. 

After this announcement, the Yields on U.S. 10-year Treasury notes hovered just above 1%, and the U.S. dollar held its gains while the S&P 500 closed 2.6%, down from its steepest drop since October amid growing concerns that stocks have become overvalued. FOMC said in a statement that the pace of the recovery in economic activity and employment has moderated in months, with weaknesses concentrated in the sectors most adversely affected by the pandemic. Central Bank also said that the path for the economy would depend significantly not just on the coronavirus but also on vaccination progress. There was no macroeconomic data from Japan to be released on Wednesday, so the pair USD/JPY continued following the developments made in the U.S. front and continued rising on the day.


Daily Technical Levels

Support Resistance

103.49 103.77

103.38 103.94

103.20 104.05

Pivot point: 103.66

USD/JPY – Trading Tips

The USD/JPY pair is trading with a bullish bias at 104.350, and violation of this level is likely to lead the USD/JPY pair until the 104.745 level. On the lower side, the USD/JPY may find support at the 104.198 level. We can expect USDJPY to bounce off upon the 104.198 level today. On the 4 hour timeframe, the USDJPY pair is likely to close a doji candle below 104.368 level. If this happens, we may see a bearish correction in the USD/JPY pair. Good luck! 

Categories
Forex Daily Topic Forex System Design

Trading System design -Creating Your Strategy with Tradingview’s Pine Script – Part 1

As promised, in this article, we will go through the steps to create a custom strategy, from the initial idea to the implementation of signals, stops, and targets.

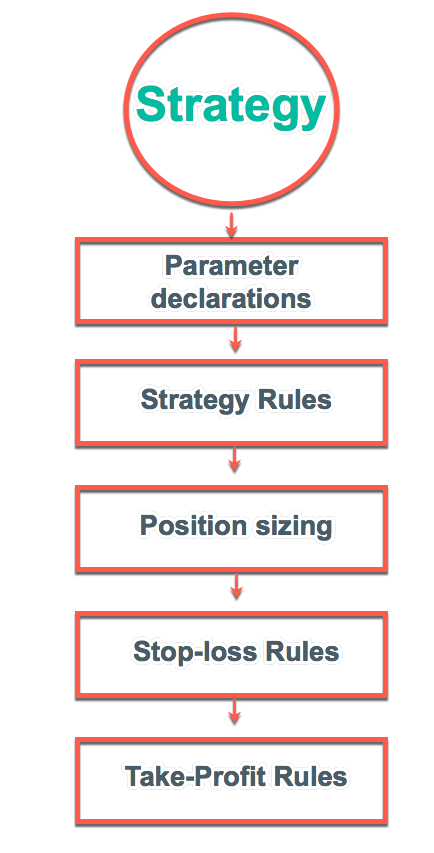
The skeleton of a trading Strategy

To create a strategy programmatically is relatively simple. We need to define the Parameters and the trade rules first, followed by the position sizing algorithm, the entry commands, and the stop-loss and take-profit settings.

Visualizing the idea

Human beings are visual. We may think our trading idea is fantastic, but translating it into code may not be straightforward. It is much easier to detect the errors if we see our rules depicted on a chart.

With the parameter declarations and trade rules, we can create an indicator first, so we can see how it appears. After we are happy with the visual 

The idea

For our example, we will use a simple yet quite exciting indicator called Stochastic RSI, which applies the Stochastic study to the RSI values. This operation smoothes the RSI, and it reveals much better the turning points on mean-reverting markets, such as in Forex. Let’s see how it behaves as a naked strategy.

Diving into the process

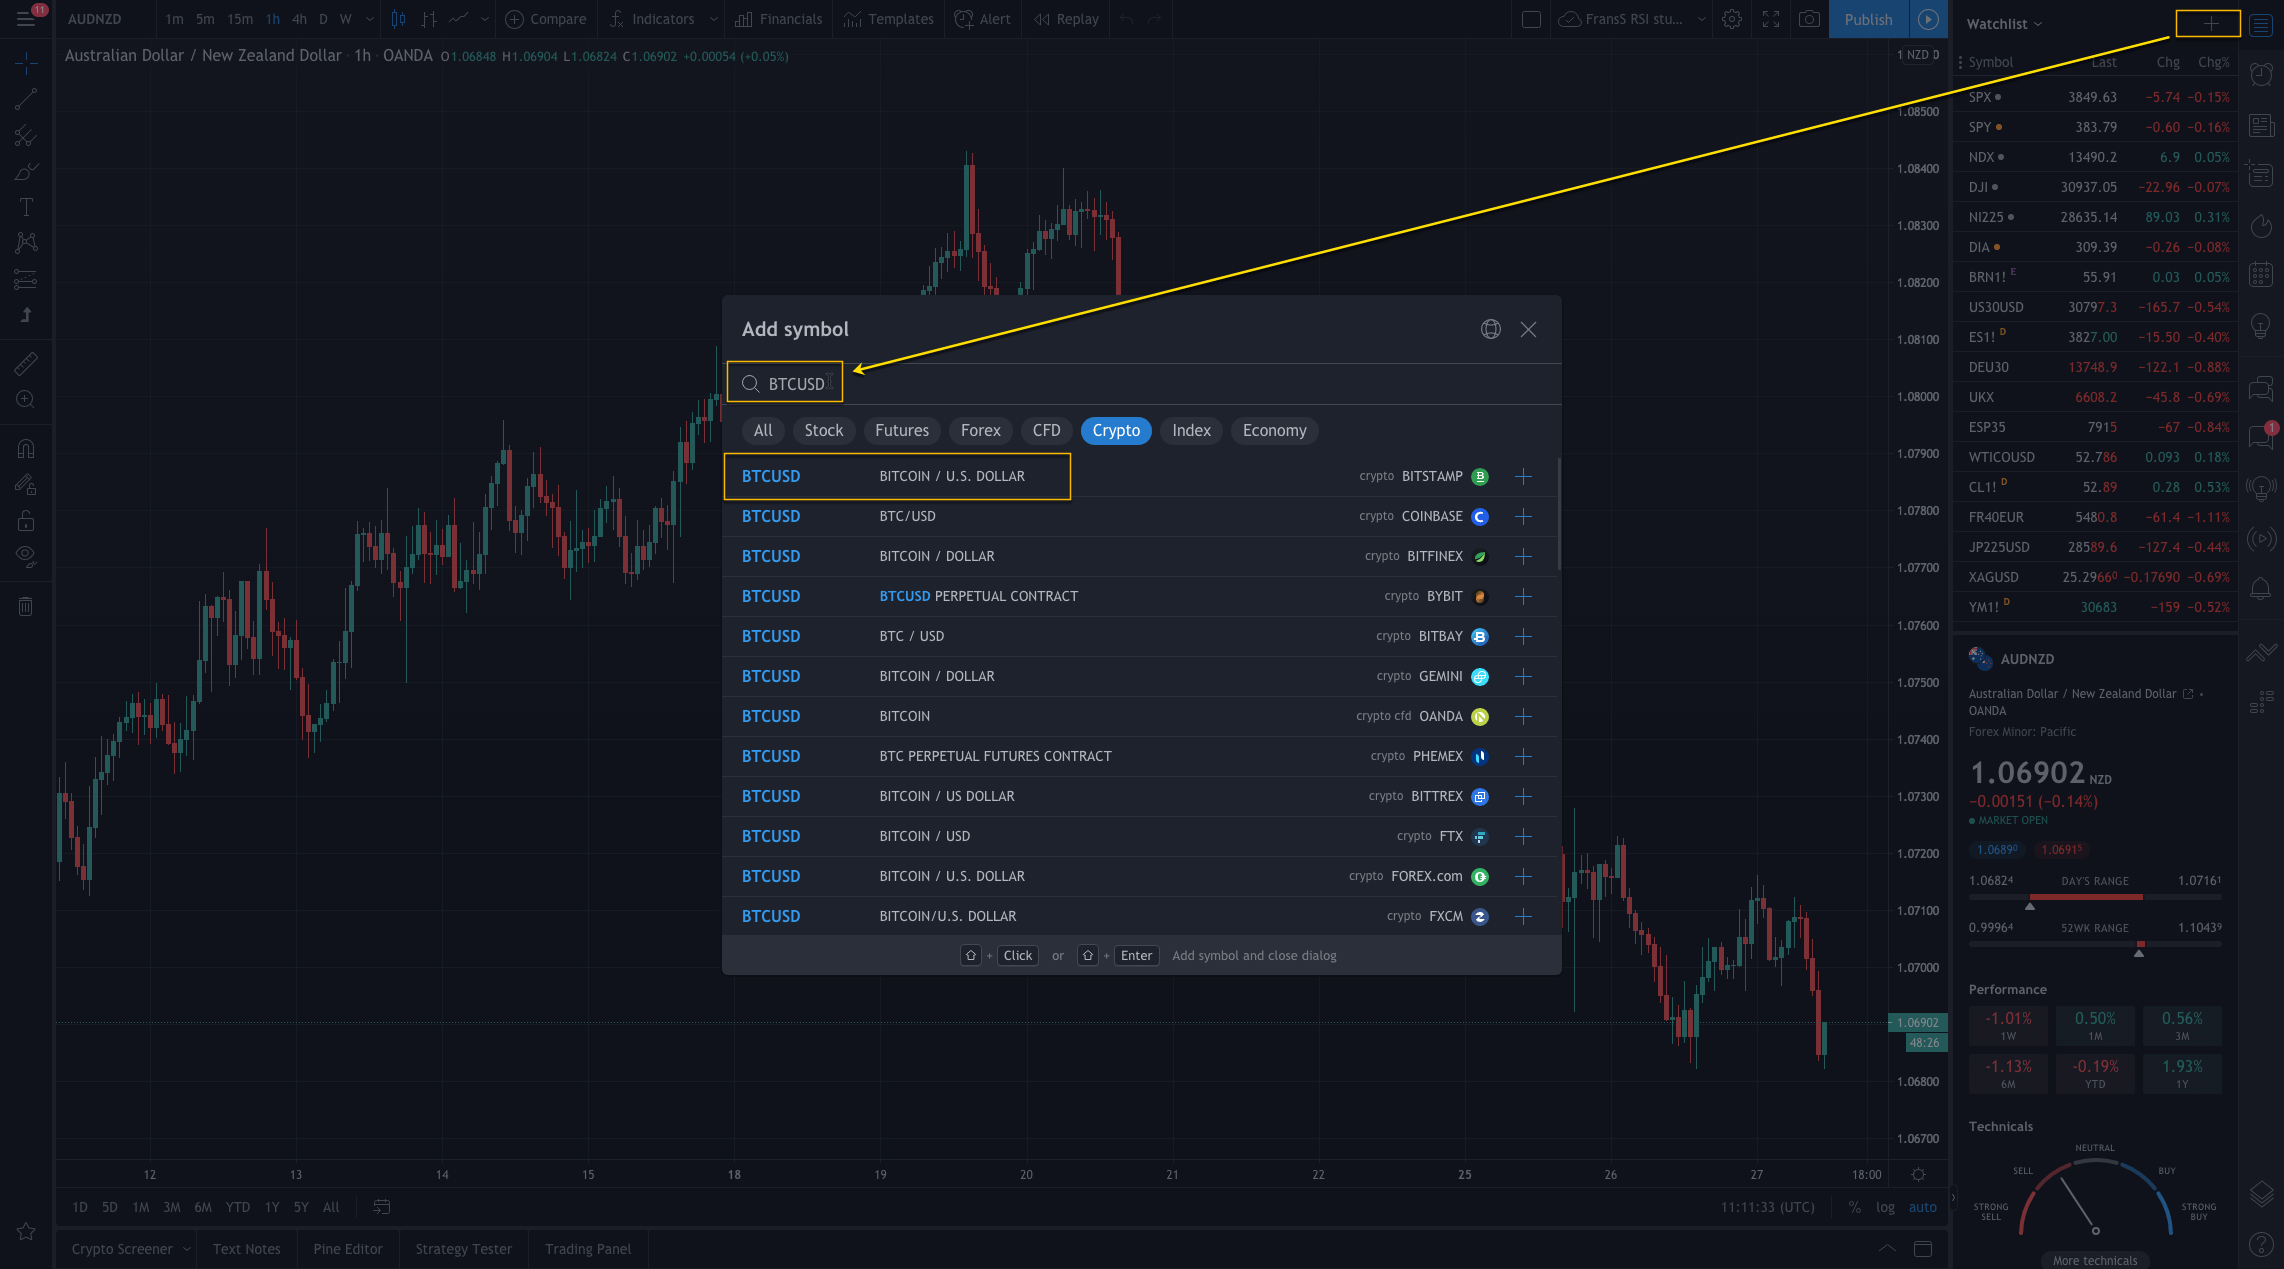
First, you need to open an account with Tradingview. Once we are in, we create a new layout.

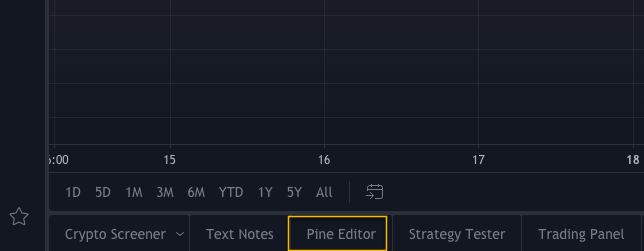
Then we open the Pine Editor.

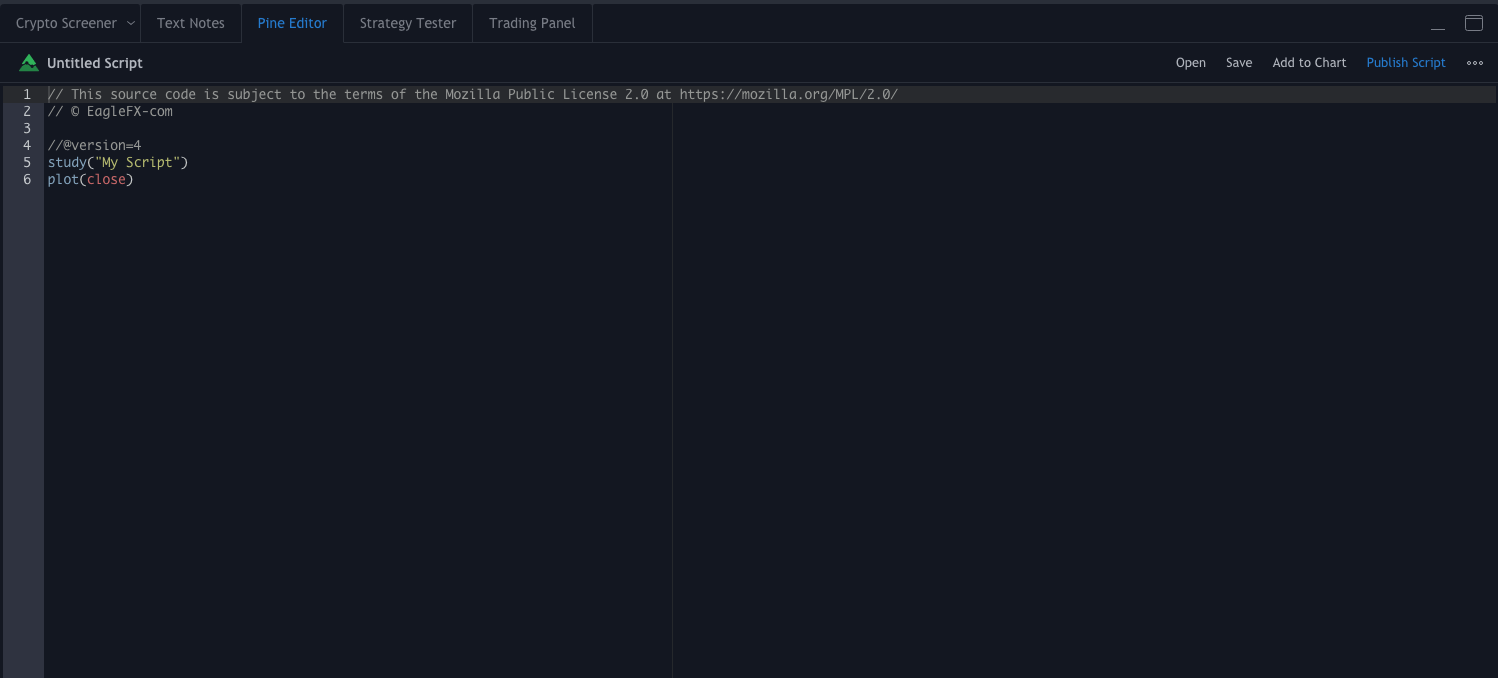
It appears in the bottom left of your layout. Click on it… and it shows with a basic skeleton code.

The Stochastic RSI code.

As said, to create the Stochastic RSI indicator, we will make the RSI and then apply the stochastic algorithm to it.

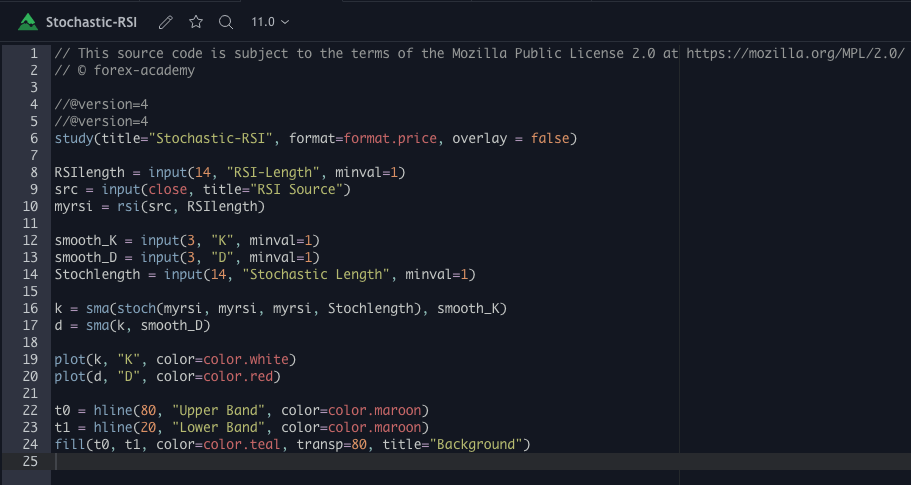
1 study(title="Stochastic-RSI", format=format.price, overlay = false)

This first line declares the code to be a study, called Stochastic-RSI.  

format = format.price is used for selecting the formatting of output as prices in the study function.

Overlay = false means we desire the RSI lines to appear in a separate section. If it were a moving average to be plotted with the prices, overlay should be set to true.

RSIlength = input(14, "RSI-Length", minval=1)

We define the RSI length as an input parameter called RSI-Length.

src = input(close, title="RSI Source")

The variable src will collect the input values on every bar. The default is the bar close, but it may be modified by other values such as (o+c)/2.

myrsi = rsi(src, RSIlength)

This line creates the variable myrsi that stores the time series of the rsi.

This completes the calculation of the RSI. 

smooth_K = input(3, "K", minval=1)
smooth_D = input(3, "D", minval=1)

These two lines create the smoothing values of the stochastic %K and %D. Since it comes from input, they can be changed at will.

Stochlength = input(14, "Stochastic Length", minval=1)

This code defined the variable lengthStoch, computed from the input parameter.

k = sma(stoch(rsi1, rsi1, rsi1, Stochlength), smooth_K)
d = sma(k, smooth_D)

These two lines completes the calculation of the stochastic rsi.

plot(k, "K", color=color.white) - Plot a white k line 
plot(d, "D", color=color.red) - Plot a red d line.

To end this study, we will plot the overbought and oversold limits of 80 and 20, filling the mid-band with a distinctive color.

t0 = hline(80, "Upper Band", color=color.maroon)
t1 = hline(20, "Lower Band", color=color.maroon)
fill(t0, t1, color=color.purple, transp=80, title="Background")

The complete code ends as:


// This source code is subject to the terms of 
// the Mozilla Public License 2.0 at https://mozilla.org/MPL/2.0/
// © forex-academy
//@version=4
study(title="Stochastic-RSI", format=format.price, overlay = false)

RSIlength = input(14, "RSI-Length", minval=1)
src = input(close, title="RSI Source")
myrsi = rsi(src, RSIlength)

smooth_K = input(3, "K", minval=1)
smooth_D = input(3, "D", minval=1)
Stochlength = input(14, "Stochastic Length", minval=1)

k = sma(stoch(myrsi, myrsi, myrsi, Stochlength), smooth_K)
d = sma(k, smooth_D)

plot(k, "K", color=color.white)
plot(d, "D", color=color.red)

t0 = hline(80, "Upper Band", color=color.maroon)
t1 = hline(20, "Lower Band", color=color.maroon)
fill(t0, t1, color=color.teal, transp=80, title="Background")

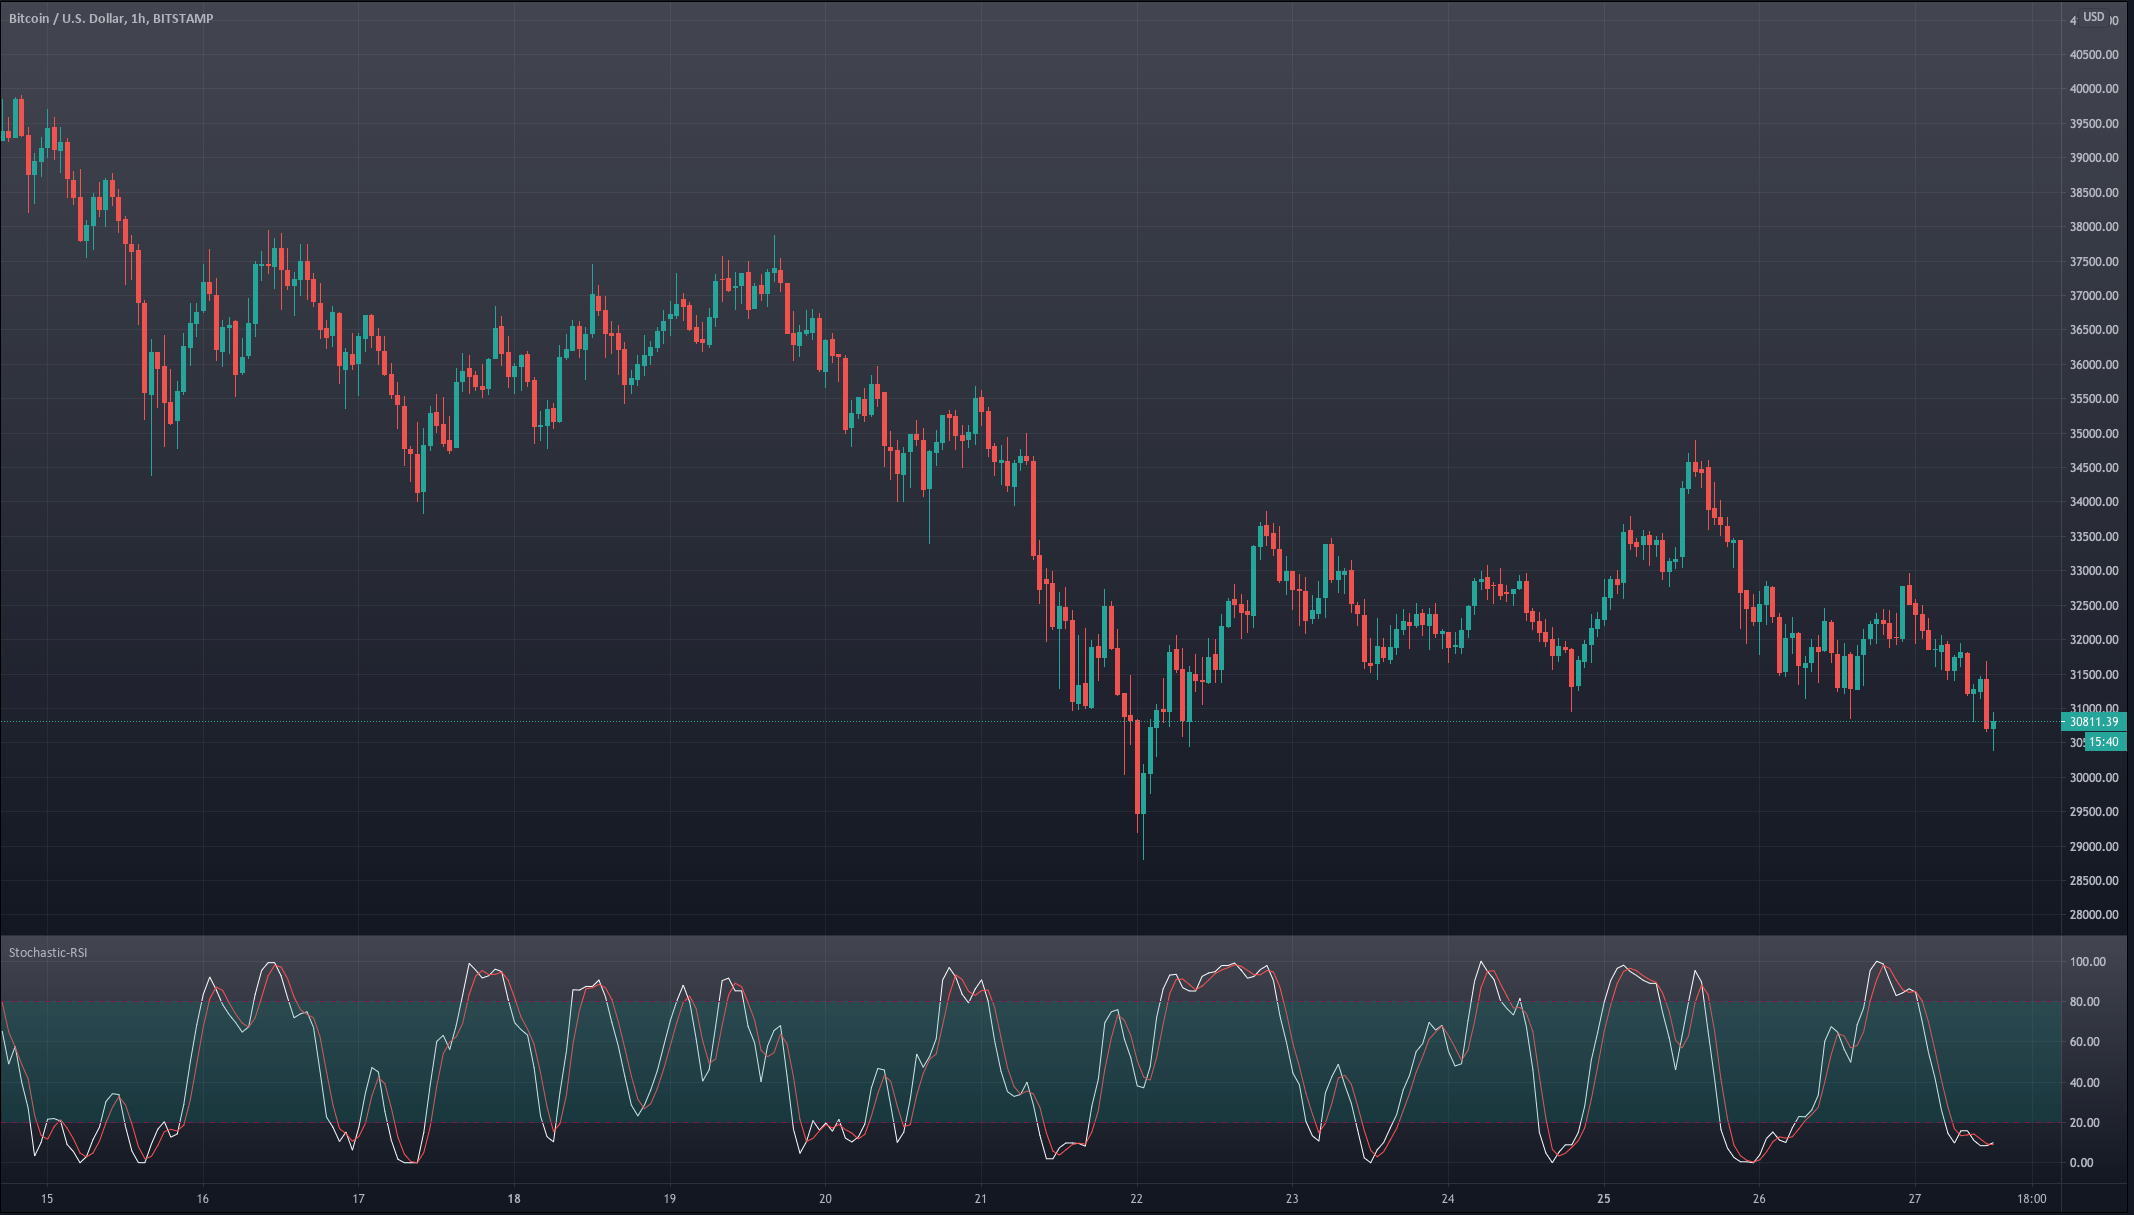
This code is shown in our layout as

Stay tuned for the second part of this article, where we will evolve the Stochastic RSI into a viable strategy.


Categories
Forex Signals

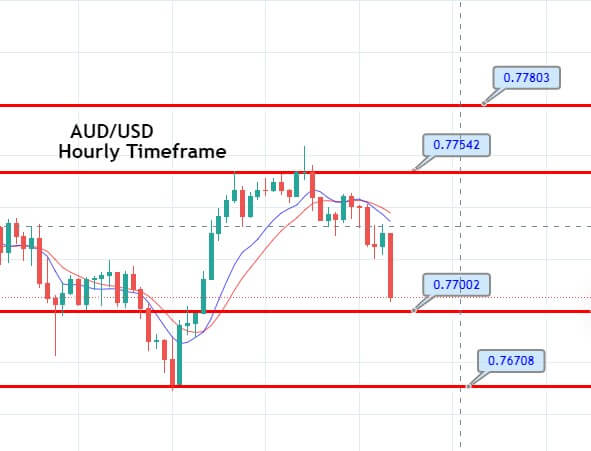
AUD/USD Bearish Bias Continues – Sell Signal In Play!

The AUD/USD pair was closed at 0.77473 after placing a high of 0.77540 and a low of 0.76686. After placing losses for 2 consecutive sessions, AUD/USD pair rose on Tuesday amid the turnaround of risk appetite in the market sentiment. The risk-sensitive Australian dollar gained traction on Tuesday after the positive vaccine news took hold of the market. The European equities, US stocks, and Bond yields rose during European trading hours amid the risk appetite in the market driven by attesting vaccine developers’ announcement.

Moderna and Pfizer announced that they were investigating work on the booster vaccine shots that will provide immunity even against the new variants like the one that emerged in UK, Brazil, and South Africa and promised to deliver them by 6-12 months. Whereas Johnson & Johnson also announced to release its vaccine data later this week and was very hopeful that their data will be robust and game-changer. As J7J has claimed that its vaccine will provide full immunity in a single shot, unlike other current vaccines that provide 90-95% immunity.
The rising risk sentiment because of the positive vaccine news gave strength to the risk perceived Aussie and supported the upward momentum in AUD/USD pair on Tuesday.

On the data front, at 19:00 GMT, the Housing Price Index from the US for November improved to 1.0% against the predicted 0.9% and supported the US dollar that capped further gains in AUD/USD pair. The S&P/CS Composite -20 HPI for the year also improved to 9.1% against the predicted 8.8% and supported the US dollar. At 19:59 GMT, the Richmond Manufacturing Index for January weakened to 14 against the predicted 18 and weighed on the US dollar and added gains in AUD/USD pair. At 20:00 GMT, the CB Consumer Confidence in January improved to 89.3 against the predicted 88.9 and supported the US dollar.

Despite strong macroeconomic data from the US, the US dollar failed to gain traction on Tuesday as the US Dollar Index fell by 0.2% on the day against the basket of major currencies. The decline in the US dollar could be attributed to the rebound in risk sentiment in the market. The weakness of the US dollar also helped AUD/USD pair to post gains for the day.

However, the AUD/USD pair’s gains were somehow capped as the tensions between the US & China escalated at the South China Sea. After the warning from Chinese President Xi Jinping, who said that if global leaders will try to intimidate or threaten others, then a new Cold War could begin and urged them to be united in the face of coronavirus pandemic. These developments weighed on China-proxy Aussie and capped further upside in AUD/USD pair on Tuesday.


Daily Technical Levels
Support Resistance
0.7677 0.7744
0.7646 0.7780
0.7610 0.7810
Pivot Point: 0.7713

Entry Price – Buy 0.7719
Stop Loss – 0.7759
Take Profit – 0.7679
Risk to Reward – 1:1
Profit & Loss Per Standard Lot = -$400/ +$400
Profit & Loss Per Micro Lot = -$40/ +$40
Fellas, now you can check out forex trading signals via Forex Academy mobile app. Follow the links below.
iPhone Users: https://apps.apple.com/es/app/fasignals/id1521281368
Andriod Users: https://play.google.com/store/apps/details?id=academy.forex.thesignal&hl=en_US

Categories
Forex Signals

NZD/USD Sell Signal Update – Quick Outlook! 

The NZDUD pair is trading at 0.7229 level, gaining immediate support around the 0.7224 mark. A bearish breakout of 0.7224 level can extend selling until 0.7214 and 0.7201. Conversely, a breakout of 0.7240 can lead the NZDUSD pair towards 0.7280.


Entry Price – Sell 0.72255

Stop Loss – 0.72655

Take Profit – 0.71855

Risk to Reward – 1:1

Profit & Loss Per Standard Lot = -$400/ +$400

Profit & Loss Per Micro Lot = -$40/ +$40

Fellas, now you can check out forex trading signals via Forex Academy mobile app. Follow the links below.

iPhone Users: https://apps.apple.com/es/app/fasignals/id1521281368

Andriod Users: https://play.google.com/store/apps/details?id=academy.forex.thesignal&hl=en_US

Categories
Forex Market Analysis

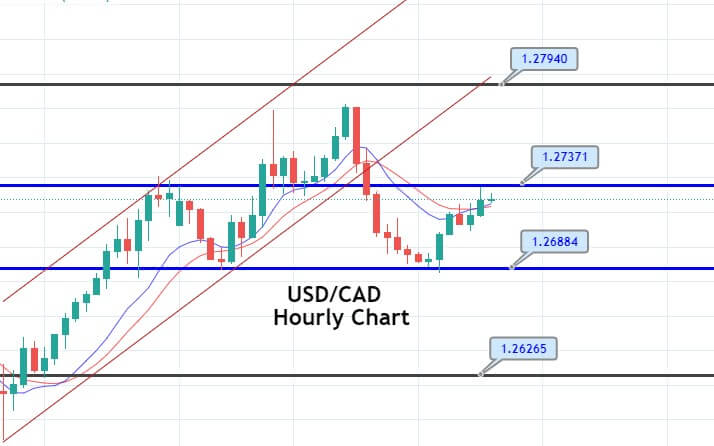
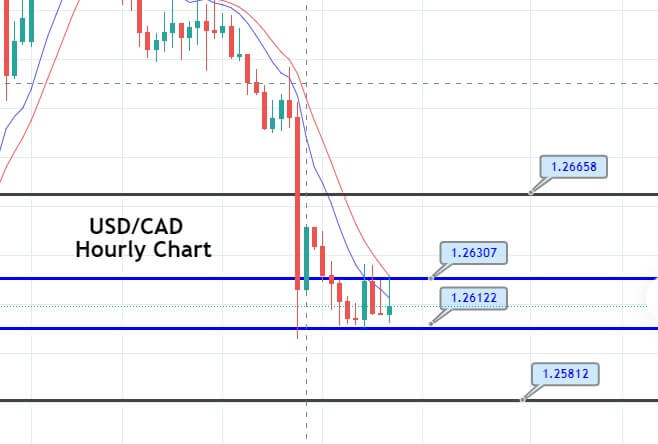
USD/CAD Choppy Session Continues – Brace for a Breakout Trade! 

The USD/CAD pair was closed at 1.26954 after placing a high of 1.27823 and a low of 1.26897. After placing gains for three consecutive sessions, the USD/CAD pair dropped on Tuesday despite the broad-based US dollar strength and the declining crude oil prices. The USD/CAD pair rose in the first half of the day and posted gains; however, these gains could not live longer and started to close in the second half of the session on Tuesday. The market’s mixed sentiment caused this downward momentum in the USD/CAD pair on the day.

During early trading hours on Tuesday, the risk-off market sentiment kept weighing on the USD/CAD pair as the US dollar was strong due to its safe-haven status. The greenback gained traction after the tensions between the US & China erupted once again at the South China Sea. Furthermore, the Chinese President’s latest warning against the New Cold War also played an important role in giving strength safe-haven greenback.

The Chinese President Xi Jinping warned global leaders on late Monday that starting a new Cold War should be avoided and urged unity in the face of coronavirus pandemic. He added that threatening others and building small cliques will only push the world into division.  

Furthermore, the report from John Hopkins University suggests that the global count of confirmed coronavirus cases reached 100 million in a year and raised concerns for global economic recovery as many nations were still under lockdown and weighed on market sentiment that ultimately weighed on the risk perceived USD/CAD pair.

Meanwhile, the market’s risk sentiment started to turn around as the positive news from Moderna and Pfizer came in to deliver booster shots of the vaccine in about 6-12 months that will provide full immunity. Whereas Johnson & Johnson also announced that it would release data on its vaccine for coronavirus. It was highly awaited as J&J has advertised its vaccine as a game-changer because it would provide full immunity in a single shot, unlike other vaccines so far.

However, the USD/CAD traders seemed to ignore the rebound in market risk sentiment and continued moving with the risk-averse market sentiment, and hence, the USD/CAD pair remained depressive for the day.

On the data front, at 19:00 GMT, the Housing Price Index from the US for November increased to 1.0% against the estimated 0.9% and supported the US dollar. The S&P/CS Composite -20 HPI for the year also increased to 9.1% against the estimated 8.8% and supported the US dollar that capped further downside in the USD/CAD pair. At 19:59 GMT, the Richmond Manufacturing Index for January plunged to 14 against the estimated 18 and weighed on the US dollar, and added further losses in the USD/CAD pair. At 20:00 GMT, the CB Consumer Confidence in January increased to 89.3 against the estimated 88.9 and supported US dollar.

On the crude oil front, the traders also ignored the movements of West Texas Intermediate crude oil prices on Tuesday that declined to $52.27 for the day and weighed on commodity-linked currency Loonie that ultimately caped further downside in the movement of USD/CAD pair.

On Wednesday, the traders will keep a close eye on the US Federal Reserve’s decision to find fresh impetus about the USD/CAD pair movement.


Daily Technical Levels

Support Resistance

1.2688 1.2783

1.2639 1.2829

1.2593 1.2878

Pivot Point: 1.2734

The USD/CAD pair continues to trade sideways in between a narrow trading range of 1.2737 – 1.2688 level. Breakout of this level can drive further moves in the market. On the higher side, the USD/CAD pair can lead it’s price towards 1.2794 and on the lower side, support holds around 1.2626. Let’s brace for a breakout! 

Categories
Forex Market Analysis

Daily F.X. Analysis, January 27 – Top Trade Setups In Forex – Big Day, Fed Rate Ahead! 

On the news front, the eyes will remain on the FOMC Statement and Federal Funds Rate, which is not expected to change the interest rate. Still, it will help us understand U.S. economic situation and policymakers’ stance on it. Besides, the Durable Goods Orders m/m from the U.S. will also remain in highlights.

Economic Events to Watch Today  


EUR/USD – Daily Analysis

The EUR/USD closed at 1.21595 after placing a high of 1.21756 and a low of 1.21076. The EUR/USD pair edged higher on Tuesday as the U.S. Dollar Index (DXY) dropped and the risk appetite in the market witnessed a major turnaround. After a mixed start on the session, the European equities embarked upon a recovery mode and brought back the market’s risk sentiment. The pan-European benchmark, the Euro Stoxx 50, rallied by 1% and lifted the overall market mood. Whereas, the safe-haven U.S. dollar came under pressure after a rise in European equities and come back of risk sentiment that ultimately added gains in the currency pair EUR/USD on Tuesday.

In the early Asian trading session, the main currency pair EUR/USD extended its previous day’s bearish sentiment and fell below 1.2108, on the back of the U.S. dollar’s strength gathered by the risk-off market mood driven by the deadlock over U.S. fiscal stimulus and the renewed US-China tensions over the South China Sea.

On Tuesday, China said that it would conduct military exercises in the South China Sea this week, just days after complaining that a U.S. aircraft carrier group has sailed through the disputed waters. These rising tensions between the world’s two largest economies raised the safe-haven appeal in early trading hours on Tuesday. They lifted the greenback that ultimately dragged the currency pair EUR/USD on the downside.

 However, during early European trading hours, the risk-sentiment started to come back as the positive shift in the tone of the news flow on the coronavirus front. Moderna and Pfizer announced that they were looking into coronavirus booster shots that would specifically target building immunity to variants of the virus, such as that discovered in South Africa a few weeks ago. 

Furthermore, Johnson & Johnson’s CFO has said earlier that they expect to release COVID-19 vaccine trial data next week. The company was very optimistic that they will be releasing a very robust data set. The J&J’s vaccine has been advertised as a game-changer in the vaccination race as it would only require one shot to acquire full immunity. This vaccine-related optimism helped risk sentiment in the market and supported riskier assets like EUR/USD pair on Tuesday.

On the data front, there was no macroeconomic data released from the European side. In contrast, from the U.S. side, at 19:00 GMT, the Housing Price Index from the U.S. for November rose to 1.0% against the forecasted 0.9% and supported the U.S. dollar that capped further upside in the EUR/USD pair. 

The S&P/CS Composite -20 HPI for the year also rose to 9.1% against the forecasted 8.8% and supported the U.S. dollar. At 19:59 GMT, the Richmond Manufacturing Index for January declined to 14 against the forecasted 18 and weighed on the U.S. dollar that added gains in the EUR/USD pair. At 20:00 GMT, the C.B. Consumer Confidence in January rose to 89.3 against the forecasted 88.9 and supported the U.S. dollar and limited further gains in the EUR/USD pair on Tuesday.


Daily Technical Levels

Support   Resistance

1.2108     1.2177

1.2077     1.2215

1.2039    1.2245

Pivot Point: 1.2146

EUR/USD– Trading Tip

The EUR/USD pair is trading at 1.2156, facing immediate resistance at 1.2165 level. The EUR/USD has entered the overbought zone on the hourly timeframe, suggesting odds of bearish correction in the pair. On the lower side, the pair is likely to complete 38.2% Fibonacci retracement at 1.2150 and 61.8% Fibonacci retracement at 1.2134. Selling bias seems strong.


GBP/USD – Daily Analysis

The GBP/USD pair was closed at 1.37363 after placing a high of 1.37443 and a low of 1.36092. GBP/USD pair rebounded on Tuesday during early European trading hours after falling below 1.36100 level. The GBP/USD pair’s comeback was due to the recovered risk appetite in the market and Britain’s strong job report.

However, despite the strong macroeconomic data from Great Britain, the GBP/USD pair benefited from the broad U.S. dollar’s weakness on Tuesday as investors focused more on the U.S. Federal Reserve’s upcoming decision. The risk appetite took a significant turn during the early European trading hours after a downbeat Asa Pacific session. It weighed on the safe-haven U.S. dollar that ultimately lifted the GBP/USD pair on Tuesday. U.S. stocks were high, European equities erased most of Monday’s losses, the crude oil market was also high, and bond yields were rising on both sides of the Atlantic. 

The reason behind the turnaround of the risk sentiment was the positive vaccine news, as Moderna and Pfizer announced last night that they were starting investigating a booster vaccine shot that will come between 6-12 months after the second doses and will provide immunity against the new variants of coronavirus like the one emerged in South Africa in the past few days. Meanwhile, the Johnson & Johnson CFO also said on Tuesday that they expect to release the trail data for their coronavirus vaccine next week. They were very optimistic that the data will be robust and have claimed that their vaccine will be a game-changer in the vaccine race as it will provide full immunity in a single shot.

The rising risk sentiment in the market helped the risk perceived GBP/USD currency pair gain traction and rose to post gains for the day. On the data front, at 19:00 GMT, the Housing Price Index from the U.S. for November surged to 1.0% against the projected 0.9% and supported the U.S. dollar, and capped further upside in the GBP/USD pair. The S&P/CS Composite -20 HPI for the year also surged to 9.1% against the projected 8.8% and supported the U.S. dollar. At 19:59 GMT, the Richmond Manufacturing Index for January decreased to 14 against the projected 18 and weighed on the U.S. dollar, which ultimately added more GBP/USD pair gains. At 20:00 GMT, the C.B. Consumer Confidence in January surged to 89.3 against the projected 88.9 and supported the U.S. dollar that capped further bullish momentum in GBP/USD pair.

From the Britain side, at 12:00 GMT, the Average Earnings Index for the quarter raised to 3.6% against the estimated 2.9% and supported the British pound that pushed the pair GBP/USD even higher on board. For December, the Claimant Count Change declined to 7.0K against the forecasted 47.5K and supported Sterling, which ultimately added more GBP/USD pair gains. In December, the Unemployment Rate from Britain also dropped to 5.0%against the forecasted 5.1% and supported British Pound that lifted the bullish sentiment in GBP/USD pair. AT 16:00 GMT, the CBI Realized Sales in January dropped to -50 against the estimated -32 and weighed on British Pound and capped further upside in GBP/USD pair on Tuesday.

Another reason that could also be attributed to the rising prices of GBP/USD pair on Tuesday was UK PM Boris Johnson’s latest announcement about new travel instructions. The incoming passengers in the U.K. will need to self-fund a quarantine for ten days in a hotel. The new policy was a part of a government strategy to prevent foreign strains of the virus from entering the U.K. This also helped British Pound gain strength and support the GBP/USD pair’s upward momentum on Tuesday.


Daily Technical Levels

Support   Resistance

1.3641     1.3717

1.3607     1.3759

1.3565     1.3794

Pivot Point: 1.3683

GBP/USD– Trading Tip

On Wednesday, the GBP/USD pair continues trading with a bullish bias at 1.3733 level after violating the symmetric triangle pattern. The GBP/USD pair is trading with a bullish bias on the two-hourly timeframes, facing immediate resistance at 1.3749 area. A bullish breakout of this level is expected to trigger further buying trends until the 1.3807 mark. Today, we can expect to enter a buy position over 1.3749 and selling below the same. 


USD/JPY – Daily Analysis

The USD/JPY pair was closed at 103.617 after placing a high of 103.826 and a low of 103.553. After rising for two consecutive sessions, the USD/JPY pair dropped on Tuesday despite the market’s rising risk-on market sentiment. The U.S. Dollar Index (DXY), which measures the value of the greenback against the basket of six major currencies, was up on Tuesday by 0.2% at 90.547 level and supported the U.S. dollar. The safe-haven greenback gained in early trading hours of the day as the rising tensions between the U.S. and China over the South China Sea prompted the risk-off mood. 

On Tuesday, China said that it would conduct military exercises in the South China Sea later this week. This announcement came in just days after they had complained that a U.S. aircraft carrier group has sailed through the disputed waters. This helped the Japanese Yen gain traction due to its safe-haven nature and weighed on the USD/JPY pair. 

The US-China relation also came under headlines after Chinese President Xi Jinping warned against the new cold war. On Monday, Xi warned global leaders against starting a “new Cold War” and urged unity in the face of the coronavirus pandemic. He said that building small cliques or starting a new Cold War to reject, threaten or intimidate others will only push the world into division.

The words appeared to be aimed at U.S. President Joe Biden’s plans to revitalize global alliances to counter China’s growing influence. These comments added to the tensions between China and the U.S. and raised the need for safe-haven that ultimately supported the safe-haven Japanese Yen and dragged the pair USD/JPY on the downside. However, the market’s risk sentiment came back during early European trading hours after positive news from vaccine makers came into the market. Moderna and Pfizer announced that they have started working on the booster shots of vaccines that will provide full immunity even against the new variants of the coronavirus like the one that emerged in South Africa. Meanwhile, the Johnson & Johnson CFO also announced that they would release their vaccine data next week, and they were very optimistic that it will be robust data. J&J has claimed that their vaccine will provide full immunity in a single shot, and if the data suggested so, it would be a game-changer in the vaccine race so far.

The rising risk sentiment in the market could not lift the USD/JPY pair, and the pair continued moving in the bearish trend for the day.

On the data front, at 19:00 GMT, the Housing Price Index from the U.S. for November advanced to 1.0% against the anticipated 0.9% and supported the U.S. dollar that capped further losses in the USD/JPY pair. The S&P/CS Composite -20 HPI for the year also advanced to 9.1% against the anticipated 8.8% and supported the U.S. dollar. At 19:59 GMT, the Richmond Manufacturing Index for January fell to 14 against the anticipated 18 and weighed on the U.S. dollar, adding more losses in the USD/JPY pair. At 20:00 GMT, the C.B. Consumer Confidence in January advanced to 89.3 against the anticipated 88.9 and supported U.S. dollar.

From the Japanese side, at 04:50 GMT, the SPPI for the year in December came in as -0.4% against the predicted -0.6% and supported Japanese Yen that added further downside momentum in the USD/JPY pair. At 10:00 GMT, the BOJ Core CPI for the year dropped to -0.3% against the expected -0.1% and weighed on the Japanese Yen.

Furthermore, the losses in USD/JPY were also capped after the announcement from the U.S. President Joe Biden on Tuesday. He said that the U.S. would accelerate the delivery of coronavirus vaccines across the country as his administration plans to buy 200 million more doses of the Pfizer-BioNTech and Moderna vaccines. However, Biden also warned that even with more Americans set to be inoculated sooner than previously anticipated due to additional doses, the pandemic would continue to worsen before it gets better. 

According to the Johns Hopkins University data, the number of confirmed coronavirus cases worldwide has passed 100 million just over a year since the first cases of the mysterious new illness was reported in the Chinese city of Wuhan. This weighed on market sentiment and supported the safe-haven Japanese Yen that ultimately added the USD/JPY pair’s losses on Tuesday.


Daily Technical Levels

Support   Resistance

103.62     103.89

103.50     104.06

103.34     104.17

Pivot point: 103.78

USD/JPY – Trading Tips

On Wednesday, the USD/JPY continues to trade sideways inside a broad trading range of 103.900 – 103.560. The USD/JPY has formed a symmetrical triangle pattern on the 4-hour timeframe, and it has the chance of leading the pair towards the next resistance level of 104.800 upon the breakout of 104.810. The 50 periods EMA supports the bullish trend, and we may have odds of taking a buying trade over the 103.570 level today. Good luck! 

Categories
Forex Signals

USD/CAD Violates Upward Channel – Sell Signal Update!

The USD/CAD pair was closed at 1.27434 after placing a high of 1.27789 and a low of 1.26871. The USD/CAD pair continued its bullish movement for the 3rd consecutive session on Monday and reached above 1.27700 level amid the broad-based US dollar strength despite the risk-off market sentiment and the rising crude oil prices on the day.

The greenback gathered strength against its rivals after a sharp decline in EUR/USD pair triggered by the disappointing German Ifo Business Climate on Monday. The US Dollar Index climbed above 90.30 with the initial marker reaction and made the US dollar stronger on board, ultimately pushing the USD/CAD pair higher.

Another reason behind the rising US dollar prices was the speculations that the $1.9 trillion stimulus package proposed by Joe Biden is expected to face rejection by Democrats and Republicans in the Senate as they were not in favor of more spending just after a month in massive expenditures of $900 billion. The hopes that the US’s massive stimulus package will be delayed due to a difference of opinion gave strength to the US dollar that pushed the rising USD/CAD prices on Monday.

Meanwhile, the USD/CAD pair traders ignored the rising West Texas Intermediate crude oil prices on Monday. The crude oil prices rose by 1.5% on the day and supported the commodity-linked currency Loonie that ultimately capped further upside in the USD/CAD pair’s rising prices.

However, On Monday, Canada marked the anniversary of the first case of coronavirus that was identified in the country. After a year of living with the pandemic, Canada dealt with the increasing spread of new and more contagious variants. Canada reported six new cases of the UK variant of coronavirus and 3 cases of the South Africa variant of coronavirus on Monday, up from 4 and 1.

The rising number of new variant cases of coronavirus infections in Canada raised fears for the nationwide lockdown to curb the spread of this variant and raised threats for an economic recovery that ultimately weighed on the Canadian Dollar and added in the gains of USD/CAD pair on Monday. On the US front, the coronavirus deaths and cases per day in the US dropped markedly over the past couple of weeks but were still running at alarmingly high levels. The government’s top infectious disease expert Dr. Anthony Fauci said that improvement in numbers around the country appears to be the result of natural peaking and then plateauing after a holiday surge rather than an effect of the rollout of vaccines that began in mid-December. This diminishing rate of cases and deaths in the US added to the US dollar’s strength and supported the upward momentum in the USD/CAD pair on Monday.


Daily Technical Levels

Support Resistance

1.2715 1.2738

1.2703 1.2749

1.2693 1.2761

Pivot Point: 1.2726

Entry Price – Sell 1.27067

Stop Loss – 1.27467

Take Profit – 1.26667

Risk to Reward – 1:1

Profit & Loss Per Standard Lot = -$400/ +$400

Profit & Loss Per Micro Lot = -$40/ +$40

Fellas, now you can check out forex trading signals via Forex Academy mobile app. Follow the links below.

iPhone Users: https://apps.apple.com/es/app/fasignals/id1521281368

Andriod Users: https://play.google.com/store/apps/details?id=academy.forex.thesignal&hl=en_US


Categories
Forex Signals

AUD/USD Three White Soldiers – Downward Channel Set to Break! 

The AUD/USD closed at 0.77128 after placing a high of 0.77471 and a low of 0.76824. AUD/USD pair remained flat throughout the day as it ended its day at the same level it started its day with on Monday. The AUD/USD pair advanced higher during the European trading hours but reversed its gains in the second half of the day on the back of US dollar strength and the risk-off market sentiment. The risk perceived Aussie suffered when the rising global number of deaths and coronavirus cases raised fears for global economic recovery and surged the appeal for a safe-haven.

As the banks were closed due to Australia Day Holiday on Monday, the currency pair AUD/USD left with the US dollar market valuation. The US Dollar Index (DXY) climbed to 90.51 on Monday however struggled to remain there and preserve its bullish momentum. The rising greenback prices added weight to the AUD/USD pair, and the pair started to lose its early daily gains. The US dollar was also strong on board as the rival currencies, including Euro and British Pound, were weak on the day. As well, the prospects of the massive stimulus of $1.9 trillion in coronavirus relief fund were also fading in the market over the speculation of bill facing rejection at Senate. Senate has already passed a bill of 900 billion US dollars in the previous month, and there is very little possibility that they would agree to pass trillions of dollars in spending after a short passage of time.

These hopes also kept the US dollar stronger and continued weighing on the AUD/USD pair on Monday. Meanwhile, the risk-off market sentiment also kept the pair under pressure on the day. The rising number of coronavirus cases and death rate across the globe due to new variants of COVID-19 raised fears of nationwide lockdown in many countries that ultimately raised the question of global economic recovery and supported the risk-off market sentiment.

The risk-sensitive Aussie suffered in risk-off market sentiment and started to decline that ultimately dragged the pair AUD/USD further on the downside, and the pair closed its day on the same level it started its day with, giving flat movement for the day. On the data front, at 19:00 GMT, CB Leading Index from China raised in December to 1.2% against the previous 1.1% and supported the China-proxy Australian dollar, and capped further downside in AUD/USD pair.


Daily Technical Levels

Support Resistance

0.7706 0.7723

0.7698 0.7732

0.7688 0.7741

Pivot Point: 0.7715

The AUD/USD is trading at 0.7733 level, having formed three white soldiers on the two-hourly timeframe. On the higher side, the pair may find an immediate resistance at the 0.7745 level. Continuation of an upward trend can extend buying trend until 0.7745 level. A bullish breakout of 0.7745 level is also expected to trigger further buying until the next target level of 0.7776 level. The MACD is exhibiting a bullish crossover on the two-hourly timeframes, and the downward channel seems to get violated. I will be looking to take a sell trade if the Aussie manages to stay below the 0.7745 level. Good luck! 

Categories
Forex Market Analysis

Daily F.X. Analysis, January 26 – Top Trade Setups In Forex – C.B. Consumer Confidence Ahead! 

Investor’s eyes will stay on the Claimant Count Change and Unemployment Rate data from the U.K. as it’s likely to drive market movements during the European session. Later on, the C.B. Consumer Confidence from the U.S. will focus on the New York session today.

Economic Events to Watch Today  


EUR/USD – Daily Analysis

The EUR/USD closed at 1.21415 after placing a high of 1.21831 and a low of 1.21158. After rising for two consecutive sessions, the EUR/USD pair dropped on Monday as the common currency remained under pressure due to the slow pace of coronavirus vaccination roll out in Europe. The slow distribution of vaccines and the new manufacturing issues lagged the COVID-19 vaccination rollout in the old continent. After Pfizer told the E.U. that retooling in its Belgian plant would cause a delay, AstraZeneca made a similar announcement on Friday. The bloc has a substantial deal with the British pharmaceutical, and the European regulator was set to approve it on Friday.

Apart from the vaccine delays, the fears of new coronavirus variants were also of concern and could trigger another nationwide lockdown in France, the Eurozone’s second-largest economy. Berlin has also announced to extend its restrictions through mid-February. On the other hand, the safe-haven U.S. dollar was on the back foot across the board due to U.S. President Joe Biden pushing his $1.9 trillion relief program. Simultaneously, moderate Senators were pushing back against approving new expenditure only a month after they approved $900 billion of funds. However, Democrats were set to ram through the package via a reconciliation that would relieve them of the need to receive Republicans’ support.

Another option is to quickly approve the coronavirus-related funds and delaying the other aspects of the suggested package, such as a hike to the minimum wage. These options also kept the prospects of package delivery in the act and kept weighing on the U.S. dollar that ultimately capped further downside in the EUR/USD pair. On the data front, at 14:00 GMT, the German IFO Business Climate dropped to 90.1 against the forecasted 91.5 and weighed on Euro. At 19:00 GMT, the Belgian NBB Business Climate dropped to -7.5 against the expected -8.0 and supported Euro.

It seems like the German Business Climate went down because of the issues mentioned above, as the lockdown restrictions have badly disturbed the business community and weighed on the common currency that dragged the EUR/USD prices on the downside. Meanwhile, equity markets have posted healthy gains over the last few weeks on bets coronavirus vaccines will start to reduce infection rates worldwide and on a stronger U.S. economic recovery under President Joe Biden. 

However, the vaccine rollout has been uneven, with relatively rapid progress in the U.K. but a much slower rollout in France. AstraZeneca warned of further delays to deliveries of its vaccines in Europe on Friday due to production blockage at one of its manufacturing partners. Over the weekend, Italy threatened legal action against both Astra and Pfizer over delivery delays. On Sunday, France has announced to impose a third lockdown that was already under a national 12-hour curfew. All these developments turned the European futures red and weighed on risk sentiment that ultimately dragged the EUR/USD pair on the downside.

On Monday, ECB President Christine Lagarde said that Climate Change could create short-term volatility in output and inflation through extreme weather events and, if left unaddressed, can have long-lasting effects on growth and inflation. ECB announced on Monday that it was creating a team of around 10 ECB employees, reporting directly to Lagarde to set the central bank’s agenda on climate-related topics.

On Monday, the ECB Chief Economist Philip Lane said that the European Central bank primarily focused on bank credit conditions ad bond yields when assessing if financing conditions were favorable. He added that naturally, the focus on credit conditions in the banking system on one side and the bond market on the other side was consistent with the main methods used by central banks in steering financial conditions. On Tuesday, the Federal Reserve will meet for its first monetary policy meeting, and the decision of the meeting will be handed down on the next day. EUR/USD pair traders will keep an eye on Fed’s decision for future impetus.


Daily Technical Levels

Support   Resistance

1.2163       1.2173

1.2158       1.2178

1.2153       1.2183

Pivot Point: 1.2168

EUR/USD– Trading Tip

The EUR/USD pair’s technical side has turned bearish as it trades below the support level of 1.2133 level. Formation of the bearish engulfing candle on the hourly timeframe can extend selling bias until the support level of 1.2115 area. Whereas, further selling trend can lead the EUR/USD pair towards the support level of 1.2090 mark. Selling bias seems to dominate the EUR/USD pair today.


GBP/USD – Daily Analysis

The GBP/USD closed at 1.36757 after placing a high of 1.37232 and a low of 1.36485. The GBP/USD pair struggled to advance on Monday amid the concerns over the coronavirus pandemic that worsened and raised the safe-haven appeal. The US Centers for Disease Control and Prevention reviewed data that suggested the U.K. coronavirus variant actually may be deadlier than other variants. A British report found that the variant was associated with a higher death rate than other variants. But the United Kingdom’s chief scientist Patrick Vallance has stressed to reporters that the evidence was not yet strong. 

Previous research has shown that the variant was more contagious than the previous form of coronavirus. But scientists did not believe it was more deadly as it began spreading in the U.K. last fall. Several separate analysis from British researchers found that the patients infected with the variant have a higher risk of severe disease and death. However, U.K. scientists insisted that these researches have several limitations and that more research was needed to confirm these findings.

These reports raised concerns for economic recovery as the threats of new variants could mean new and stricter restrictions throughout the globe. That raised the risk-off market sentiment that ultimately weighed on the risk perceived GBP/USD pair on Monday.

The British Pound advanced last week against its major rival currencies due to a combination of higher market sentiment and hopes for Britain ramping up its coronavirus vaccination scheme. However, the coronavirus pandemic continued to weigh heavily on the British Pound outlook due to the new variant and its association with the mortality rate. As a result, the U.K. government indicated that the current lockdown could last for quite some time as infection rates remain high in the country. These coronavirus fears continued weighing on the British Pound on Monday and dragged the GBP/USD pair on the downside in the absence of any macroeconomic data from both sides.

On the U.S. side, the safe-haven U.S. dollar was strong on Monday as investors were hesitant to sell it as global coronavirus pandemic fears boosted the appetite for safer assets. The greenback’s strength also weighed on GBP/USD pair and extended its losses on the day. However, the GBP/USD pair’s losses started to reverse in the late session on Monday, and the currency pair ended its day with zero loss or gained as it was closed at the same level it began its day with. The reversal in GBP/USD pair in late trading hours came in due to some good news from the U.K. side. 

The U.K. saw a sustained weakness in the infections and the death toll on Monday as the country reported the lowest cases since mid-December on that day. The British Health Secretary Matt Hancock praised the latest measures to flash early positive signs while conveying heavy vaccination and lockdown success. However, the overall sentiment remained depressing as the delayed U.S. coronavirus aid package and AstraZeneca and Pfizer vaccine delivery raised fears for global economic recovery.


Daily Technical Levels

Support   Resistance

1.3677       1.3694

1.3668       1.3700

1.3661       1.3710

Pivot Point: 1.3684

GBP/USD– Trading Tip

The GBP/USD pair continues trading with a bullish bias after violating the narrow trading range of 1.3680 – 1.3670. On the upper side, the GBP/USD may face resistance at 1.3736 level now, as the pair may form a triple top pattern here. At the same time, the support continues to hold around 1.3697 level. On the 2 hour timeframe, the GBP/USD has formed a symmetric triangle pattern, which is likely to provide resistance at 1.3701 along with support at 1.3613 level. Today, we can expect a choppy session in the Cable pair.   


USD/JPY – Daily Analysis

The USD/JPY closed at 103.756 after placing a high of 103.934 and a low of 103.670. USD/JPY pair extended its gains on Monday however remained depressive due to the risk-off market sentiment.

The demand for the greenback of risk-aversion pushed the USD/JPY pair to a daily high near 104 level. However, the U.S. treasury yields came under pressure with the yield on benchmark 10-year note down to 1.03% weighed by the news that U.S. President Biden’s stimulus plan faces opposition from Republican and Democrat lawmakers.

The $1.9 trillion stimulus package proposed by Biden is expected to get pass by the House of Representatives that is led by Democrats backing Biden. Still, the bill could face rejection at Senate as many senators were reluctant to pass another massive amount for spending just after a month of releasing $900 billion. However, Democrats were set to push through the package via a settlement that would relieve them of the need to receive Republicans’ support. Another option is to rapidly support the coronavirus-related funds and postpone the other suggested package features, such as a hike to the minimum wage.

Furthermore, the Federal Reserve monthly rate decision followed by Fed Chair Jerome Powell’s news conference is set to deliver later this week. Rates are projected to remain flat at a near-zero level that has stood there for almost a year now due to the coronavirus pandemic crisis. However, Powell’s words will be inspected for even the smallest signal of when recovery is likely expected, and as well as a narrowing of stimulus measures.

Over the past fortnight, Powell has claimed that tapering of stimulus measures will not happen anytime soon. Still, bond traders have completely ignored him and continued pushing yields higher in the hope of proving the Fed chief wrong that ultimately supported the U.S. dollar and raised the USD/JPY pair on Monday. 


Daily Technical Levels

Support   Resistance

103.77       103.82

103.74       103.86

103.71       103.88

Pivot Point: 103.80

USD/JPY – Trading Tips

The safe-haven pair USD/JPY continues to trade sideways inside a broad trading range of 104.340 – 103.560. The USD/JPY has formed a sideways channel on the 4-hour timeframe, and it has the chance of leading the pair towards the next resistance level of 104.800 upon the breakout of 104.810. The 50 periods EMA supports the bullish trend, and we may have odds of taking a buying trade over the 103.570 level today. Good luck! 

Categories
Forex Daily Topic Forex System Design

Trading System design – A Summary of your Best Options to Code your Strategy

In our latest article, we have seen that manually backtesting our strategy is cumbersome if performed correctly. Also, It is usually subjected to errors and the interpretation of the trader. Therefore, a basic knowledge of trading algorithm development and computer coding is a desirable task for any trader. The good news is, nowadays, there are many easy ways to do it since high-level languages are very close to natural language.

High-level languages to quickly build your Forex strategies.

MetaQuotes Language (MQL4/5) 

In this respect, the primary language we could think of to build your strategy in Forex is MetaQuotes Language 4 (MQL4). This language is a specialized subset of C++ , holding an extensive built-in library of indicators and trading signals.

Spending your time and efforts to master MQL4/5 is worthwhile because Metatrader 4 includes a suitable trading strategy tester and optimizer.

If you are new to programming, you could start by analyzing and modifying existing free-available EA’s. Starting with simple strategies is excellent because they will be easier to understand and change. Also, in trading, simple usually is much better than complex.

Python

Python is the reference language for data science. Its popularity and its extensive library on data science are well-known. What is less known is, Python also has comprehensive packages dedicated to trading.

As an example, you can have a look at this list taken from Open Source Python frameworks:

With Python, you can go as easy as backtest your strategy with three simple lines of code using the fastquant package.

from fastquant import backtest, get_stock_data
jfc = get_stock_data("JFC", "2018-01-01", "2019-01-01")
backtest('smac', jfc, fast_period=15, slow_period=40) 

source: Backtest Your Trading Strategy with Only 3 Lines of Python

Of course, first, you have to create the code for your strategy.

Market Data 

For backtesting purposes, you will need to download your historical market data with the necessary timeframe. The file, in CSV or Excel format, can be easily read by your Python code.

If, later on, you are going to apply your EA live, you will need a real-time streaming data feed. If this is the case, you will need to create an interface to your broker through an MT5 TradeStation (MT4 is not equipped with it).

Easylanguage and Tradestation / Multicharts

Tradestation and Multicharts are dedicated high-level trade stations. Easylanguage, a specialized subset of Pascal, was developed by the Tradestation team to create indicators and trading signals. Both platforms are terrific places to develop trading algorithms, and backtesting is straightforward.

Easylanguage, as its name indicates, was designed to make it as close to natural language as possible. The ample set of its built-in library makes coding simple, so the developer’s primary focus is the trading algorithm.

As this example, please read the code of an adjustable weighting percent blended moving average.

inputs: period1(50),period(20),factor(0.5);

variables: slow(0),fast(0), blended(0), var1(0), var2(0);

slow= average(close,period1);
fast= average(close,period2);

var1 = factor;

if var1<0 then var1=0;
if var1>1 then var1=1;

var2= 1-factor;
blended= (slow*var1)+(fast*var2);

plot1(blended,"blended");


You will see it is relatively easy to understand and follow. Anyway, it would be best if you dedicated some time to really master the language, to avoid or at least minimize coding errors.

Pine Script and Tradingview

Pine script is another specialized language to easily program your own studies and trading strategies if you have an account on Tradingview (which you may open for free). As in the case of Easylanguage, Pinescript is designed to be easily understood. 

Pine studies are used to display indicator information and graphs on a chart. It is preceded by the study() declaration. If you wished to create a strategy for backtesting, you have to use the strategy() declaration.

As with other languages, the best way to begin is by reading other people’s code and modifying it for your own purposes.

Coding strategies in pine script is similar to Easylanguage or MQL5. You create a code taking in mind that it will cycle on each bar in the chosen timeframe. 

We took this example of a MACD indicator from the Pine script quick start guide:

//@version=4

study("MACD")

fast = 12, slow = 26
fastMA = ema(close, fast)
slowMA = ema(close, slow)

macd = fastMA - slowMA
signal = sma(macd, 9)

plot(macd, color=color.blue)
plot(signal, color=color.orange)

Backtesting in Pine script is easy. But, there is no way to perform automated optimization. You will have to do it manually. You should go to the performance summary and the list of trades to find the causes of the lack of performance, apply parameter changes, and see if you get any improvement of that adjustment.

In our next article, we will go through the steps to develop a strategy using the Pine script.

Categories
Forex Signals

Oversold USD/CHF Exhibiting a Bullish Correction 

The USD/CHF pair is trading bearish at 0.8862 level, and the continuation of an upward trend can extend buying trend until the next target level of 0.8874 level. So far, the pair has completed 38.2% Fibonacci retracement at 0.8874 level. Since the 10 & 20 periods, EMA supports bullish bias along with the MACD and RSI levels. On the higher side, a continuation of an upward trend can lead the USD/CHF pair towards the next target level of 0.8892. Check out a trading plan below: 


Entry Price – Buy 0.88715

Stop Loss – 0.88315

Take Profit – 0.89115

Risk to Reward – 1:1

Profit & Loss Per Standard Lot = -$400/ +$400

Profit & Loss Per Micro Lot = -$40/ +$40

Fellas, now you can check out forex trading signals via Forex Academy mobile app. Follow the links below.

iPhone Users: https://apps.apple.com/es/app/fasignals/id1521281368

Andriod Users: https://play.google.com/store/apps/details?id=academy.forex.thesignal&hl=en_US

Categories
Forex Signals

EUR/JPY Enters Overbought Zone – Brace to take Sell Trade! 


The EUR/JPY is trading with a bearish bias at 126.285 level, holding mostly below the triple top resistance level of 126.400 level. Continuation of a selling trade can extend bearish bias until the 126 and 125.750 mark. The EUR/JPY pair’s strong selling bias is extended by 10 & 20 periods EMA seen on the hourly timeframe. Below these levels, the EUR/JPY may continue trading bearish and offer us quick 30/40 pips during the U.S. session today. Check out a trading plan below: 


Entry Price – Sell 126.11

Stop Loss – 126.51

Take Profit – 125.71

Risk to Reward – 1:1

Profit & Loss Per Standard Lot = -$400/ +$400

Profit & Loss Per Micro Lot = -$40/ +$40

Fellas, now you can check out forex trading signals via Forex Academy mobile app. Follow the links below.

iPhone Users: https://apps.apple.com/es/app/fasignals/id1521281368

Andriod Users: https://play.google.com/store/apps/details?id=academy.forex.thesignal&hl=en_US

Categories
Forex Signals

AUD/USD Sideways Trading Continues – Downward Channel in Play!

The AUD/USD pair was closed at 0.77101 after placing a high of 0.77696 and a low of 0.77017. After rising for three consecutive days, AUD/USD pair dropped on Friday as the US dollar was seen stronger on the week’s ending day. As well, the rising demand for safe-haven and risk-off market sentiment also weighed on the AUD/USD pair.

The risk-sensitive Aussie came under fresh pressure after the new variants of coronavirus from Britain and South Africa prompted many countries to impose further restrictions to curb the virus’s spread and raise economic recovery concerns. The US imposed travel bans from Brazil, UK, South Africa, and 26 countries from European Union to protect Americans from new variants of coronavirus. The new variants were said to be more deadly as the death rate across the UK reached its highest level in the world on Wednesday. The US has also seen a rise in the mortality rate as the total infection cases reached 25 million.
This worsened coronavirus pandemic concerns for the global economic recovery and raised the need for safe-haven and risk-off market sentiment that ultimately weighed on the risk-perceived Aussie. The weakness of the Australian dollar added to the losses of the AUD/USD pair on Friday.

On the data front, at 19:45 GMT, the Flash Manufacturing PMI improved to 59.1 against the predicted 56.6 and supported the US dollar that added more pressure on AUD/USD pair. The Flash Services PMI also improved to 57.5 against the predicted 53.3 and supported the US dollar that weighed on AUD/USD pair. At 20:00 GMT, the Existing Home Sales also improved to 6.76M against the predicted 6.55M and supported the US dollar that ultimately added more losses in the AUD/USD pair. From the Australian side, at 03:00 GMT, the Flash Manufacturing PMI for January raised to 57.2 against the previous 55.7 and weighed on Aussie that added more pressure over AUD/USD pair. The Flash Services PMI dropped to 55.8 against the previous 57.0 and weighed on the Australian dollar. At 05:30 GMT, the Retail Sales for December dropped to -4.2% against the forecasted -1.5%, weighed on the Australian dollar, and dragged the AUD/USD pair even lower.

Another reason behind the decline of the AUD/USD pair on Friday was the US dollar’s strength driven by the rising prices of US Treasury yields. The US Dollar Index that measures the value of the greenback against the basket of six major currencies rose by 0.1%on Friday and reached 90.243 level that ultimately gave strength to the greenback and added further pressure on the AUD/USD pair.

The US Dollar was weak in the past days as the hopes for a massive stimulus package from Joe Biden was expected. After taking his office, Biden has proposed a $1.9 trillion relief aid package to help the economy through the pandemic crisis, and now traders have mostly ignored it as it has already been priced in, and that is why the US dollar kept on rising on Friday and weighing on AUD/USD pair.


Daily Technical Levels
Support Resistance
0.7740 0.7780
0.7720 0.7802
0.7699 0.7821
Pivot point: 0.7761

The AUD/USD pair has violated the support level of 0.7745 level, and it’s holding below the same resistance level right now. On the lower side, the AUD/USD may extend the selling trend until the 0.7706 and 0.7676 level. The recent bearish engulfing candles are supporting selling bias in the AUD/USD pair. We should consider taking a selling trade below the 0.7745 level today. Good luck!

Categories
Forex Signals

Gold Closed 28 Pips – Brace for a Breakout Trade!

During Monday’s Asian trading session, the yellow metal prices failed to maintain their overnight bullish streak. They edged lower around the $1,855 level mainly due to the risk-on market sentiment, which tends to weaken the safe-haven yellow-metal prices as investors continuing a retreat from the safe-haven asset after renewed progress in U.S. stimulus measures.

Despite the ever-increasing infections of the covid strain outside the epicenter of Britain and South Africa, the market trading sentiment managed to stop its overnight negative performance and started to flash green on the day amid renewed hopes for additional U.S. fiscal stimulus measures. These hopes were triggered instantly after the incoming chairman of the U.S. Senate Budget Committee said that Democrats would use a rare procedural tactic to pass major parts of a Covid-19 relief package if Republicans refuse to move on the measure. In addition to this, the optimism over the rollout of vaccines for the highly infectious coronavirus disease was also exerting a positive impact on the market trading sentiment. As a result, the S&P 500 Futures print 0.20% intraday gains by press time of Asian session on the day.

At the USD front, the broad-based U.S. dollar failed to stop its long bearish bias and dropped further on the day as demand for the safe-haven assets declined amid progress toward agreeing on U.S. fiscal stimulus. Conversely, the declines in the U.S. dollar could be short-lived or temporary as the fresh COVID-19 worries and weak European economic data helps the safe-haven assets to stop t its bearish rally.


Gold traded in line with our forecast to test the support area of 1,850 level, but soon it started forming candles upward, supporting bullish reversal in the precious metal. Thus, we decided to close the trade manually with +28 pips. Soon we will open another position in gold to secure the next trade; let’s stay tuned. Good luck!

Categories
Forex Elliott Wave Forex Market Analysis

USDCHF: Examine These Three Charts Before Taking any Trade


Last week, the USDCHF pair developed a sideways movement pattern that looks like an inverted head and shoulder pattern. However, the primary mid-term trend remains dominated by bearish sentiment. Examine with us these three charts to help you foresee the pair’s potential movements in the coming sessions.

Inverted Head and Shoulder Pattern?

The USDCHF pair illustrated in the following 12-hour chart seems to develop a sideways formation after the accelerated decline observed during the second half of November 2020. After easing from the psychological support of 0.89, the price began to consolidate in a range between 0.8917 and 0.8757.

In the previous chart, the USDCHF seems to be forming an inverse head and shoulder (iH&S) pattern, suggesting a likely bullish reversal movement. According to chartist analysis, the iH&S formation will be confirmed if the price breaks and closes above the neckline located at 0.89171. 

For this reversal scenario, the invalidation level is located below the head, which holds its lowest level at 0.87576, corresponding to the low touched last January 06th.

Elliott Wave View Suggests Exhaustion

The big picture of the USDCHF pair exposed in its daily chart reveals the incomplete bearish impulsive sequence of Minute degree labeled in black, suggesting a limited decline.

As illustrated in the last chart, the USDCHF began a downward impulsive sequence of Minute degree on March 23rd when the price found fresh sellers at 0.99017. The price action reveals the completion of its third extended wave bearish move, which found support at 0.89986 in late August 2020, starting to advance mostly sideways in its wave ((iv)) in black. 

Once the sideways corrective formation corresponding to the fourth wave in black finished, the pair began to continue its declines in the wave ((v)) of Minute degree, which currently seems developing its wave (iv) of Minuette degree identified in blue. 

On the other hand, the timing and momentum oscillator reveals that the bearish pressure still controls the price action. In this context, the price would see a further decline, confirming Elliott Wave’s outlook of a pending fifth wave of Minuette degree.

This bearish continuation scenario’s invalidation level stays at 0.8979, which corresponds to the end of wave (i).

Price Action Reveals Indecision

The USDCHF pair in its daily chart unfolded in the bellow chart shows an indecision candle corresponding to the last Friday’s session, leaving a narrow body and long-tailed candlestick pattern. This market context carries us to expect a pause in the downward movement developed in previous trading sessions.

The confirmation of the bearish scenario will occur if the price closes below the LOD at 0.88385. Conversely, a reversal signal could be established by a Monday 25th session’s close if it exceeds Friday’s high of 0.88662.

In summary, the USDCHF pair develops a sideways formation that looks like an incomplete inverse head and shoulders pattern suggesting the potential bullish reversal sequence if the price soars above the neckline located at 0.89171. However, the Elliott wave outlook suggests further declines, corresponding to a possible wave (v) of Minuette degree labeled in blue. In this context, the price action reveals the indecision of the next direction. If the price decides to continue its decline, the USDCHF could re-test January’s 06 low zone.

Categories
Forex Market Analysis

Daily F.X. Analysis, January 25 – Top Trade Setups In Forex – ECB President Lagarde in Limelight! 

On the news front, eyes will remain on the ECB President Lagarde Speaks and German Ifo Business Climate figures from the Eurozone. President Lagarde is due to participate in a virtual panel discussion titled “Restoring Economic Growth” at Davos 2021.

Economic Events to Watch Today  


EUR/USD – Daily Analysis

 EUR/USD pair was closed at 1.21707 after placing a high of 1.21893 and a low of 1.21513. The EUR/USD tried to break above the strong resistance level of 1.2200 on Friday but failed as the U.S. dollar strength and the worsened pandemic situation around the bloc added pressure on the single currency Euro.

The U.S. dollar was strong across the board as investors were worried about the chances that President Joe Biden’s $1.9 trillion stimulus proposal failed to gain traction. Hopes have raised that the package’s final deal could be smaller or just be dragged, and this supported the local currency U.S. dollar, which ultimately capped further upside in the EUR.USD pair on Friday.

Meanwhile, the U.S. dollar was also strong due to better than expected macroeconomic data release on Friday. At 19:45 GMT, the Flash Manufacturing PMI rose to 59.1 against the forecasted 56.6 and supported the U.S. dollar, and capped further gains in EUR/USD pair. The Flash Services PMI also rose to 57.5 against the forecasted 53.3 and supported the U.S. dollar. At 20:00 GMT, the Existing Home Sales also rose to 6.76M against the forecasted 6.55M and supported the U.S. dollar, and limited the upward momentum in EUR/USD pair. From the European side, at 13:15 GMT, the French Flash Services PMI dropped to 46.5 against the predicted 48.3 and weighed on Euro. The French Flash Manufacturing PMI raised to 51.5 against the expected 50.6 and supported Euro that added further gains in EUR/USD pair. At 13:30 GMT, the German Flash Manufacturing PMI remained flat at 57.0. The German Flash Services PMI raised to 46.8 against the forecasted 45.1 and supported Euro that ultimately provided additional gains to EUR/USD pair. At 14:00 GMT, the Flash Manufacturing PMI remained flat with the expectations of 54.7. The Flash Services PMI raised to 45.0 against the projected 44.4 and supported Euro and pushed the EUR/USD pair higher. 

Meanwhile, the EUR/USD pair hit its highest in the week on Friday, but the day’s gains were small as the European leaders showed frustration about the slow vaccination pace. The new mutants of coronavirus raised fresh concerns in the European Union as the governments considered imposing stricter border controls and banning non-essential travel.

The European Central Bank chief Christine Lagarde warned that the pandemic still poses severe risks to the Eurozone economy as concerns grow about new variants and sluggish vaccination campaigns. While many countries were struggling to reduce the number of infections, the emergence of more contagious virus variants first discovered in the U.K. and South Africa has added to nervousness. 

However, one factor that helped the common currency in this depressing environment to stay strong onboard was European Central Bank’s latest decision. ECB said that risks remain tilted to the downside, but they were less pronounced. The President of ECB also emphasized the need for more monetary support while the policy remained unchanged. 


Daily Technical Levels

Support   Resistance

1.2127       1.2190

1.2086       1.2214

1.2063       1.2254

Pivot point: 1.2150

EUR/USD– Trading Tip

The EUR/USD continues trading bullish at 1.2173 level and holding right above the 1.2158 support mark. Over this level, the EUR/USD has chances of bullish trend continuation until 1.2220 level. The pair has recently closed candles over 1.2158, and the continuation of the upward trend seems very likely as the 50 periods EMA supports the pair. On the higher side, the EUR/USD may find a target around 1.2220 level.


GBP/USD – Daily Analysis

The GBP/USD pair was closed at 1.36816 after a high of 1.37358 and a low of 1.36354. After rising for three consecutive days, the GBP/USD pair dropped on Friday as the coronavirus pandemic hit the country hard and raised concerns for economic recovery as the lockdown restrictions extended. 

The GBP/USD pair also fell on Friday amid the broad-based strength of the greenback triggered by the rising U.S. Treasury yields and the stronger than expected macroeconomic data. The U.S. dollar was also strong as the market’s investors shifted their focus from Joe Biden’s $1.9 trillion massive stimulus package and rather ignored its prospects.

The GBP/USD pair saw selling pressure on Friday as the death toll around the country rose to an alarming level amid the coronavirus’s new variant. According to a rolling analysis by Oxford University, until Thursday, the U.K. had the highest per capita daily death toll of any other country globally, around twice that of the United States.

Given this state, the British government extended the nationwide lockdown till July 17 and also decided to quarantine travelers from high-risk coronavirus countries for at least 10-days as it failed to curb the rising number of coronavirus variant infections. Meanwhile, Britain’s hospitals were also struggling under an ever-growing flow of patients. In the extended lockdown situation, the economic concerns raised rapidly and weighed on the Sterling that ultimately dragged the currency pair GBP/USD on the downside.

Furthermore, on Friday, a U.K. report was released that stated a realistic possibility that the new U.K. variant had a higher mortality rate than other variants. While the data was not decisive but UK PM Boris Johnson said that there was some evidence that the new variant may be connected with a higher degree of mortality. This news added concerns about economic recovery and weighed on the British Pound that added GBP/SD pair losses.

On the data front, at 19:45 GMT, the Flash Manufacturing PMI advanced to 59.1 against the projected 56.6 and supported the U.S. dollar that dragged the GBP/USD pair even on the downside. The Flash Services PMI also advanced to 57.5 against the projected 53.3 and supported the U.S. dollar. At 20:00 GMT, the Existing Home Sales also advanced to 6.76M against the projected 6.55M and supported the U.S. dollar and added GBP/USD pair losses.

From Britain’s side, at 05:01 GMT, the GfK Consumer Confidence for January dropped to -28 against the expected -30 and supported British Pound that capped further downward momentum in GBP/USD pair. At 14:30 GMT, the Flash Manufacturing PMI for January dropped to 52.9 against the forecasted 53.5 and weighed on the British Pound, ultimately pushing the pair GBP/USD lower. The Flash Manufacturing PMI also dropped to 38.8 against the expected 45.2 and weighed on British Pound and added GBP/USD pair losses.


Daily Technical Levels

Support   Resistance

1.3676      1.3763

1.3624      1.3798

1.3589      1.3850

Pivot Point: 1.3711

GBP/USD– Trading Tip

The GBP/USD pair continues trading with a bullish bias after violating the narrow trading range of 1.3680 – 1.3670. On the higher side, the GBP/USD may find resistance at 1.3736 level now, as the pair may form a triple top pattern here. At the same time, the support continues to hold around 1.3697 level. Bullish bias dominates. 


USD/JPY – Daily Analysis

The USD/JPY closed at 103.769 after placing a high of 103.884 and a low of 103.446. After falling for two consecutive sessions, the USD/JPY pair rose on Friday amid the broad-based U.S. dollar strength; however, the sentiment remained depressing as the pandemic raised concerns for the economic recovery. The U.S. Dollar Index that measures the value of the greenback against the basket of six currencies was up by 0.1% on Friday to 90.243 level and supported the U.S. dollar that ultimately added gains in the currency pair USD/JPY.

The U.S. dollar was also high onboard on Friday as the U.S. Treasury yields also rose on the day amid the idea of greater borrowing to fund the additional stimulus proposed by Joe Biden for %1.9 trillion as it could raise the inflation and change the Federal Reserve’s ultra-loose monetary stance. This supported the risk-on market sentiment that ultimately supported the USD/JPY pair as traders were prepared to buy riskier currencies on the idea of quicker than previously expected global economic recovery after the additional stimulus to the economy.

However, these hopes deteriorated after the new variants of coronavirus from the U.K. and South Africa raised global economic concerns in the market. According to a report released on Friday from the U.K., there was a convincing possibility that the new variant of coronavirus in Britain had a higher death rate than other variants. While the data was not conclusive, but UK PM Boris Johnson said that there was some evidence that the new variant may be related to a higher degree of mortality.

This prompted U.S. President Joe Biden to reinstate a ban on most non-US citizens entering the country from Brazil and the U.K., where more transmissible variants of the coronavirus have emerged recently months. According to public health officials, the U.S. also added South Africa to the restricted list as the concerning variant has already spread beyond South Africa. Arrivals from Ireland and 26 countries in Europe were also banned to protect the people of the U.S. as it has already faced the pandemic on an extreme level.

The Centers for Disease Control and Prevention said that these measures were taken to protect Americans and reduce the risks of these variants spreading and worsening the current pandemic that already affected about 25 million Americans. These developments raised the global economic recovery concerns and added in the risk-off market sentiment that ultimately capped further upside in the USD/JPY pair.

On the data front, at 19:45 GMT, the Flash Manufacturing PMI increased to 59.1 against the anticipated 56.6 and supported the U.S. dollar that added in the upward momentum of the USD/JPY pair. The Flash Services PMI also increased to 57.5 against the anticipated 53.3 and supported the U.S. dollar. At 20:00 GMT, the Existing Home Sales also increased to 6.76M against the anticipated 6.55M and supported the U.S. dollar that pushed the USD/JPY pair higher.

At 04:30 GMT, National Core CPI for the year from Japan came in as -1.0% against the projected -1.1% and supported Japanese Yen. At 05:30 GMT, the Flash Manufacturing PMI dropped to 49.7 against the forecasted 50.1 and weighed on the Japanese Yen, supporting the upward momentum in the USD/JPY pair on Friday.


Daily Technical Levels

Support   Resistance

103.33      103.67

103.16      103.84

102.99      104.01

Pivot point: 103.50

USD/JPY – Trading Tips

On Monday, the safe-haven pair USD/JPY continues to trade sideways inside a broad trading range of 104.340 – 103.560. The USD/JPY has formed a sideways channel on the 4-hour timeframe, and it has the chance of leading the pair towards the next resistance level of 104.800 upon the breakout of 104.810. The 50 periods EMA supports the bullish trend, and we may have odds of taking a buying trade over the 103.570 level today. Good luck! 

Categories
Forex Videos

FOREX MT4 (meta trader 4) saving Templates!


Beginners – How to save a screen template in Metatrader 4


Thank you for joining this Forex Academy educational video.


The Metatrader MT4 platform is one of the most widely used platforms in the world and is fully customisable. 

A great feature that is incredibly time-saving is the ability to save screen templates, which can quickly be added to different asset pairs. This extremely versatile platform comes with its own templates, but most people prefer to adjust them to their own preferences, and this quick tutorial will show you how to do that on a step-by-step basis. 

Here is a standard MT4 1 hour screen chart for the GBPUSD pair.

Firstly, you will need to open your Navigator section to find a wealth of indicators. This can be accessed by pressing Ctrl+ N on your keyboard. 

Then simply drag the indicators you prefer onto your chart, and adjust the parameters and click OK, 

Such as here for the Stochastic, which will then populate your chart. 

By right-clicking on the chart, 

The chart properties will open, and can be able to tweak the parameters to suit. 

Such as the colour of the background or the colours of the bars or candlesticks.

When you have finished building your chart, you can save the changes as a template, in which you will need to right-click on your chart, hover over the Template tab, select save the template, when the second box pops up,

Then give your template a name, and save it. 

The next time you want to use the template for another pair, just open a new chart, such as the EURUSD pair as shown here, and right-click, highlight Template, then click on load template from the pop-up box, 


Then simply highlight your saved template and press Open.

And the new chart will automatically be updated with your saved template, thus saving you time.

The templates file is located on your computer by clicking on the File tab on the top left of the platform, then Open data folder.

And you will find it in the templates file folder, as highlighted here.


Categories
Forex Videos

Forex Trading Algorithms Part 8 Elements Of Computer Languages For EA Design!


Trading Algorithms VIII – Two RSI algorithms


The Relative Strength Index (RSI) was created by Welles Wilder as a momentum oscillator that measures price movements’ speed. The RSI is bounded between zero and 100. According to its author, an overbought condition occurs when the RSI is above 70, whereas an oversold condition is the RSI below 30.  RSI is one of the most popular indicators because of its simplicity and is included in all charting packages.


How to compute  the N-period RSI

1.-  go back N bars and compare the Close of that bar with the prior bar’s Close. If positive, add this value to a UP summation variable. If negative, add it to a Dwn summation variable. Do this for every bar in the period.

2.- After all summations have been performed, divide the results by N, the period. This will create an average of up and down changes: avgUp and avgDwn.

3.- The RS is the ratio of avgUP to avgDwn.

RS = avgUP/avgDwn

4.- Finally, the RSI can be calculated by a normalization operation to bounded it between zero and 100:

RSI = 100 – 100/(1-RS)


Spotting market tops and bottoms

Welles Wilder designed the RSI with a standard 14-bar period, so it was meant for short-term asset analysis. This indicator works at its best on mean-reverting market states. According to Mr. Wilder’s research, the RSI usually tops/bottoms ahead of the actual market top/bottom.

The basic form of RSI trading is shown in the RSI flowchart below.

RSI Flowchart


The basic rules of the System are:

if   RSI(14-period) is below 30:
    Buy on Close
If RSI (14-period) is above 70:
    Sell-short on Close
If position = long:
    If Close > Entry_Price + 3xATR:
        Sell the open position on Close
    if Close < Entry_Price -1 ATR:
        Sell the position on Close
If Position= Short:
    If Close < entry-Price - 3xATR:
        Buy-to-cover the position on Close.
    if Close > Entry_Price - 1 ATR:
        Buy-to-cover the position on Close

And below the code in EasyLanguage,  for Tradestation and Multicharts platforms, with input parameters to allow for optimization of the length, overbought/oversold levels, as well as take-profit and stop-loss levels in the form of ATR multiples.

This algorithm works fine as long as it is applied to a non-trending, mean-reverting asset but fails when a trend has been established.   Please, bear in mind that the strategy as-is will not work.

An optimized version, tested in the EURUSD pair from 2014 till 2020, showed the following equity curve and values:

Equity Curve

The results are a bit disappointing, as we see. After the optimization, the strategy shows only 52.55% profitable trades with a meager 1.02 reward/risk ratio. The RSI is very close to a coin-toss in performance, meaning the results are mostly due to chance.  Furthermore, the average trade of $6.82 before commissions means a trader working using the classic RSI entries is really profiting his broker.

In our next video, we will cover a new way of using the RSI on trending securities.


APPENDIX: The RSI code for Easylanguage

inputs:  Price( Close ), Length( 14 ), OverSold( 30 ), 
         Overbought( 70 ), takeprofit( 3 ), Stoploss( 1 ) ;
variables:  var0( 0 ), over_sold (False ), over_bought (False) ;

var0 = RSI( Price, Length ) ;

{***** ATR buy and sell signals *****} 

over_sold = Currentbar > 1 and var0 crosses under OverSold ;
if over_sold then                                                                    
    Buy ( "RsiLE" ) next bar at market ;

over_bought = Currentbar > 1 and var0 crosses over OverBought ;
if over_bought then                                                                    
    Sell Short ( "RsiSE" ) next bar at market ;

{***** ATR Stop Loss and Take-profit *****} 

if marketposition > 0  then begin 
    sell Next Bar at L[1]- Stoploss * averagetruerange(10) Stop ; 
    sell Next Bar at L[1] + takeprofit * averagetruerange(10) Stop;
    end;     

if marketposition < 0 then begin
     buytocover  Next Bar at H[1] + Stoploss * averagetruerange(10)Stop ; 
     buytocover  Next Bar at H[1] - takeprofit *averagetruerange(10)Stop ; 
     end;


Categories
Forex Videos

Forex Fear of Missing Out! (FOMO) Don’t Make This Basic Mistake!


Fear of Missing Out (FOMO). What is it? 

Thank you for joining this forex academy educational video.

In this session, we will be looking at the fear of missing out or f o m o.  What is it, and how does it affect trading?

The fear of missing out is a psychological aspect of trading any financial asset.  In fact, it is so deeply rooted in our psyche that it affects the way humans think about many aspects of our lives, and sometimes it’s so powerful that it blinds us to all reasonable thinking and can end up causing us to make rash decisions, which are ill-thought out, and untimely.

The fear of missing out has been with us for centuries, but it was only in 1996 that a research paper written by a marketing strategist, Dr. Dan Herman, entitled the piece ‘the fear of missing out.’

Although people can deal with the fear of missing out on social events, such as parties, or perhaps a sale where they missed a good bargain, when it encroaches into one’s financial trading ability and adversely affects decision-making, it can then become extremely expensive if not recognised and handled correctly.

A good example of FOMO is the recent bull run on bitcoin, especially bitcoin to the USD, and other crypto assets, with one broker, EToro, reporting 380,000 new accounts opened since the beginning of January 2021, and where much of the exponential growth in bitcoin / US dollar trading can be attributed to retail traders jumping on the bandwagon during the timeframe of this incredible rise in bitcoin value and where this is down to the fear of missing out.

While bitcoin was trading at 42,000 dollars and whereby institutional and professional traders were focusing on technical analysis, where analysis suggested that price was peaking, the fear of missing out traders were still piling in and buying bitcoin on CFD’s and physical exchanges at levels shown here at position A, and where the subsequent tanking to $30K wiped out accounts and where billions were lost to retail FOMO investors who bought close to or at the top of the market. 

Traders should always ask themselves if they are making their trading decisions based on sound technical and fundamental analysis, including market sentiment, or are they looking blindly, trading under FOMO pressure, looking to ride a trend wave which may be peaking or bottoming out and about to reverse? 

Here is an example of a bull run from September 2020 to January 2021 for cable, which has risen 10,000 pips and where many traders will have been buying at the top of the market because they thought there would be a continuation perhaps to 1.400 or higher, now that the United Kingdom has left the European Union with a free trade deal in place


…and many traders who thought that the EU and UK would never reach an agreement would have sold at the bottom of the bear run, which topped out at 1.3475 and gone short at 1.2700 for fear of missing out on the bear run.

Trends do not have to be in their hundreds or thousands of pips or points before a trader is worried they are missing out and jump onto one. It could be just a dozen or so pips or points. The important thing is to remember that one’s decision-making must be based on strong technical analysis while factoring in market sentiment and fundamental analysis, which may be lagging behind the market move. They should factor in the possibility of price action stalling at any point or consolidating and use relevant stops in order not to blow their accounts on a single trade. And where traders must realise that f o m o has no place in their trading armoury, which must also consist of a trading style which has consistently been providing winning trades.

Categories
Forex Signals

EUR/JPY EMA Crossover Underpin Buying – Quick Update on Signal! 

The EUR/JPY is trading with a bullish bias at 126.285 level, holding mostly over the triple top resistance become support level of 126.169 level. Continuation of a selling trade can extend bullish bias until the 126.560 mark. The pair is also gaining support amid 10 & 20 periods EMA supporting bullish trend continuation in the market. The MACD and RSI are supporting an upward momentum in the EUR/JPY pair. On the hourly chart, we can see the pair has closed bullish engulfing, which may help support the EUR/JPY pair’s buying trend. Check out a trading plan below: 


Entry Price – Sell 126.274

Stop Loss – 125.874

Take Profit – 126.674

Risk to Reward – 1:1

Profit & Loss Per Standard Lot = -$400/ +$400

Profit & Loss Per Micro Lot = -$40/ +$40

Fellas, now you can check out forex trading signals via Forex Academy mobile app. Follow the links below.

iPhone Users: https://apps.apple.com/es/app/fasignals/id1521281368

Andriod Users: https://play.google.com/store/apps/details?id=academy.forex.thesignal&hl=en_US


Categories
Forex Signals

GBP/USD Sell Trade Continues – Three Sell Signals! 

The GBP/USD pair continues trading sideways between a narrow trading range of 1.3740 – 1.3703 level. On the lower side, a bearish breakout of 1.3703 level can extend the selling trend until the next support level of 1.3679 level. Conversely, the bullish crossover of 1.3740 can extend buying trend until the 1.3775 level. Let’s keep an eye on the 1.3700 level today.


Entry Price – Sell 1.36592

Stop Loss – 1.36992

Take Profit – 1.36192

Risk to Reward – 1:1

Profit & Loss Per Standard Lot = -$400/ +$400

Profit & Loss Per Micro Lot = -$40/ +$40

Fellas, now you can check out forex trading signals via Forex Academy mobile app. Follow the links below.

iPhone Users: https://apps.apple.com/es/app/fasignals/id1521281368

Andriod Users: https://play.google.com/store/apps/details?id=academy.forex.thesignal&hl=en_US


Categories
Forex Signals

AUD/USD Violates Upward Channel – Selling Setup Looms 

https://t.me/forexsignalsFA

The AUD/USD closed at 0.77647 after placing a high of 0.77819 and a low of 0.77387. AUD/USD pair rose for the third consecutive session on Thursday amid the rising risk-sentiment in the market and the broad-based US dollar weakness. The US dollar was weak on Thursday due to increased hopes for a large stimulus package worth $1.9 trillion from the US’s new Democratic government. Joe Biden, who took office on Wednesday, signed many executive orders to help the US economy cope with the coronavirus pandemic crisis.

The smooth transition supported the risk sentiment at the White House, and it supported the risk-sensitive currency Aussie that ultimately added in the upward momentum of the AUD/USD pair. On the other hand, the US dollar index that measures the value of the US dollar against the basket of six currencies fell by 0.2% to 90.04 level and weighed on the greenback that ultimately added in the gains of AUD/USD pair.

Meanwhile, at 05:00 GMT, the MI Inflation Expectations for December came in as 3.4% against November’s 3.5% on the data front. At 05:30 GMT, the Employment Change from Australia remained flat at 50.0K. The Unemployment Rate from Australia for December dropped to 6.6% against the forecasted 6.7% and supported the Australian Dollar that added further gains in AUD/USD pair. 

From the US side, at 18:30 GMT, the Philly Fed Manufacturing Index for January improved to 26.5 against the predicted 11.2 and supported the US dollar that capped further upside in AUD/USD pair. The Unemployment Claims from last week were reduced to 900K from the predicted 930K and supported the US dollar. For December, the Building Permits improved to 1.71M against the predicted 1.60M and supported the US dollar. The Housing Starts from December also improved to 1.67M against the predicted 1.56M and supported the US dollar that limited the AUD/USD pair’s gains. 

Despite the strong macroeconomic data and less than expected unemployment claims from the US, the AUD/USD pair continued posting gains on Thursday as investors’ focus remained over the rising hopes for further stimulus measures from the US government and the US dollar’s weakness.

The AUD/USD pair was also rising because of the expansion in China’s GDP in the fourth quarter of 2020 by 6.5%. It made the country one of the few in the world to register positive growth for the year and supported the China-proxy Aussie that ultimately added gains in AUD/USD pair.


Daily Technical Levels

Support Resistance

0.7716 0.7780

0.7677 0.7803

0.7653 0.7843

Pivot Point: 0.7740

The AUD/USD pair has violated the support level of 0.7724 level, and it’s holding below the same resistance level right now. On the lower side, the AUD/USD may extend the selling trend until the 0.7696 level. The recent bearish engulfing candles are supporting selling bias in the AUD/USD pair. We should consider taking a selling trade below 0.7724 level today. Good luck! 


Categories
Forex Signals

Gold Supported Over Double Bottom – Brace for a Breakout Setup! 

During Friday’s Asian trading session, the safe-haven-metal failed to extend its previous-day winning streak and drew some offers near the $1,860 level as the Biden administration’s plans of huge spending to stimulate the U.S. economy undermined the safe-haven yellow-metal prices aggressively. It is worth recalling that the yellow metal refreshed a 2-week high on the previous day amid the weaker U.S. dollar, but the upticks were short-lived and temporary as the stimulus hopes and upbeat U.S. jobs data started to probe the gold bulls afterward. Besides this, the optimism over a possible coronavirus vaccine also played its major role in weakening the safe-haven yellow-metal prices. 

On the different page, the downbeat comments from U.S. President Joe Biden over the coronavirus condition, as well as the recently appointed US Centers for Disease Control and Prevention (CDC) Director’s fresh doubts over the availability of vaccines, were seen as the key factors that could help the yellow-metal prices to limit its deeper losses. Meanwhile, the heightened trade/political war between the U.S. and China could also play its positive role in supporting the safe-haven yellow metal.

Across the pond, the broad-based U.S. dollar bearish bias, triggered by the prospects of massive fiscal spending in the U.S., was also seen as one of the key factors that cap losses for the yellow metal as the price of gold is inversely related to the price of the U.S. dollar. As of writing, the yellow metal prices are currently trading at 1,862.74 and consolidates in the range between the 1,860.15 – 1,870.87.

Looking forward, the market traders will keep their eyes on preliminary readings of January’s activity numbers from the U.K., the U.S., and Europe for fresh directions. In addition to this, the updates about the U.S. stimulus package will also be key to watch. 


Daily Support and Resistance

S1 1834.44

S2 1851.21

S3 1860.76

Pivot Point 1867.99

R1 1877.54

R2 1884.76

R3 1901.54

Entry Price – Sell 1857.76

Stop Loss – 1863.76

Take Profit – 1850.26

Risk to Reward – 1:1

Profit & Loss Per Standard Lot = -$400/ +$400

Profit & Loss Per Micro Lot = -$40/ +$40

Fellas, now you can check out forex trading signals via Forex Academy mobile app. Follow the links below.

iPhone Users: https://apps.apple.com/es/app/fasignals/id1521281368

Andriod Users: https://play.google.com/store/apps/details?id=academy.forex.thesignal&hl=en_US


Categories
Forex Daily Topic Forex System Design

Trading System design – Manual Backtesting your Trade Idea

We have a potential trading idea, and we would like to see if it is worthwhile. Is it really critical to code it? No. But very convenient? Yes.

Manual historical backtesting

There is no need to code the strategy to do an initial validation test. All we have to do is pick a chart, go back in time and start performing trades manually. But how to do it properly?

  1.  Use a trading log spreadsheet, as the one forex.academy provides.
  2. Thoroughly describe the methodology, including the rules for entry, stop-loss, and take-profit settings. 
  3. Use a standard 1 unit trade size ( 1 lot, for example) in all the trades.

Once the rules of the game have been set, we position the chart, start moving the action one bar at a time, and trade the chart’s right side. It is critical to take all the signals the strategy offers. Cherrypicking spoils the test.

Market Condition

The financial markets move in phases. We should think it has two main phases and three directions.


The two main phases are impulses and corrections.

The three movements are Upward (Bullish), downward (bearish), and sideways (consolidations).

Bear and bull directions are mostly similar in the Forex market because currencies are traded in pairs, so the quote currency’s bear market is the base currency’s bull market and vice-versa. 

With commodities, precious metals, and cryptocurrencies against fiat, this does not hold.

To properly test your strategy, you should apply it in all market directions and phases. Even better is performing a different evaluation for each market state. That way, your evaluation will tell you in which market conditions it works best and in which is not acceptable to apply it; thus, you could create a complementary rule to filter out the market phases in which the strategy fails.

Different markets

You must apply the strategy to all markets you intend to trade using it. As with the market conditions, you should test each market separately. After having all markets tested, you will find useful information regarding how markets the strategy works best and the correlations among markets when using it. That applies, of course, if you use the same timeframes and periods in all markets, which is advisable.

If you do it as said, you can also perform the summation of all markers date by date and assess the overall performance, its main parameters, and system quality.

Pros & Cons of manually backtesting 


  • No programming skills are required.
  • It helps you perceive how a real market evolves trade by trade.
  • You will find the potential logic errors, such as stop-loss wrongly set, take profits too close to the opening, thus 
  • You will be able to correct most of the gross mistakes of the strategy.


  • Cherrypicking. Discipline is key. If you start cherrypicking, you no longer are testing your original idea.
  • Most people doing manual backtesting do not properly trade all phases and markets. Not always thoroughly test all markets and their conditions, as it would require a lot of time. Thus the test is incomplete.
  • Time-consuming. A complete manual backtest takes much longer than a computer-generated backtest.
  • Awkward optimization. Optimization is also tricky and time-consuming. That is so because a parameter change would need another backtesting.

Final words

Manual backtesting allows us to have a first impression of how a new trade idea would fare in real trading, but a thoroughly manual backtest and optimization are time-consuming. Therefore, serious traders should start developing basic programming skills to automate both processes.

Categories
Forex Market Analysis

Daily F.X. Analysis, January 22 – Top Trade Setups In Forex – Manufacturing & Services PMI Ahead!  

On the news front, eyes will remain on the Manufacturing PMI and Services PMI figures from the Eurozone, U.K., and the United States. Almost all of the economic figures are expected to perform poorly than in previous months. Price action will depend upon any surprise changes in the PMI figures.

Economic Events to Watch Today  


EUR/USD – Daily Analysis

UR/USD pair was closed at 1.21671 after placing a high of 1.21728 and a low of 1.21022. Despite the rising fears of the Eurozone falling into recession due to the damage caused by pandemic across the bloc, as warned by the European Central Bank President Christin Lagarde, the Euro rose against the U.S. dollar to a one-week high.

On Thursday, the European Central Bank President Christine Lagarde said that the coronavirus pandemic was still posing serious risks to the eurozone economy as lockdowns were tightened across the region. She added that the start of vaccination campaigns across the euro area was an important milestone in resolving the ongoing health crisis. Nonetheless, the pandemic continued to pose serious risks to public health and the euro area and the global economies.

In many of the European nations, the New Year began with stricter social restrictions and national lockdowns. This week, Germany extended a national lockdown until February 14, and the Netherlands announced that there would be a curfew starting from next week. France also chose to intensify its curfew hours earlier this month, while Portugal decided to close schools from Friday.

According to the European Centre for Disease Prevention and Control, Europe has reported more than 16 million coronavirus infections, with more than 400,000 deaths so far. Lagarde said that it was ready to update its policies whenever necessary amid the economic uncertainty. She added that ECB’s main policy target was to achieve an inflation rate close to 2%. 

Meanwhile, at its policy meeting on Thursday, ECB kept its interest rates and its huge stimulus program unchanged. The main refinancing operations remained flat at 0.00%, the marginal lending facility at 0.25%, and the deposit facility at -0.50%. The Governing Council has also decided to continue the purchases under the pandemic emergency purchase program (PEPP) with a total of 1850 billion euros until at least the end of March 2022.

In December, the bank estimated a GDP rate of 3.9% for 2021 and 2.1% for 2022. However, according to ECB, there were doubts over how the euro area will cope this year after a 7.3% GDP drop last year. ECB also signaled it might not need the full extent of its emergency purchase program to support the recovery. However, chances for an increase in the program were also mentioned to ensure the euro area economy remains well-financed. These comments from Lagarde failed to reverse the upward momentum of the EUR/USD pair on Thursday.

On the data front, at 19:30 GMT, the Consumer Confidence from Europe for January dropped to -16 against the expected -15 and weighed on Euro that capped further upside in EUR/USD pair. From the U.S. side, at 18:30 GMT, the Philly Fed Manufacturing Index for January rose to 26.5 against the forecasted 11.2 and supported the U.S. dollar that limited the upward momentum in EUR/USD pair. The Unemployment Claims from last week were decreased to 900K from the forecasted 930K and supported U.S. dollar. 

For December, the Building Permits rose to 1.71M against the forecasted 1.60M and supported the U.S. dollar. From December, the Housing Starts also rose to 1.67M against the forecasted 1.56M and supported the U.S. dollar that also weighed on the rising EUR/USD prices.

Despite strong macroeconomic data from the U.S., the greenback remained on the back foot on Thursday. It declined almost 0.2% against its rival currencies amid the rising hopes for a further stimulus package under Joe Biden’s administration. This weakness of the U.S. dollar also supported the EUR/USD pair’s rising prices on Thursday.

Furthermore, the U.S. recorded the death toll from coronavirus above 400,000, and it was expecting about 500,000 deaths from the pandemic by mid-February. This alarming situation prompted Joe Biden to sign orders to intensify the vaccination program that ultimately added to the market’s risk sentiment and supported the risk perceived EUR/USD pair on Thursday.


Daily Technical Levels

Support   Resistance

1.2006      1.2091

1.2039      1.2106

1.2058      1.2139

Pivot Point: 1.2062

EUR/USD– Trading Tip

The EUR/USD is trading with a bullish bias at 1.2128 level. The EUR/USD is holding right below 50 periods EMA on the hourly timeframe, extending the EUR/USD pair’s resistance. On the lower side, the support level continues to hold around 1.2120 and 1.2062 level. The MACD and RSI are suggesting a mixed bias for the EUR/USD pair. Buying can be seen over 1.2115.


GBP/USD – Daily Analysis

The GBP/USD pair was closed at 1.37332 after placing a high of 1.37456 and a low of 1.36469. GBP/USD pair rose to its highest since May 2018 on Thursday amid broad-based U.S. dollar weakness and a rising appetite for risk. The GBP/USD pair rose for 3rd consecutive session on Thursday as the global appetite for risk was raised, with Joe Biden sworn in as 46th President of the United States. Another reason behind the rising GBP/USD prices was the weaker U.S. dollar driven by the rising hopes for a massive stimulus package under Biden’s administration.

The new President is expected to announce a $1.9 trillion stimulus package to help the American economy survive through the ongoing coronavirus pandemic that has cost more than 400,000 American lives. Markets were confident that the stimulus package would boost the global economic situation and, in turn, will also push the risk-sensitive Pound higher.

 Moreover, the British Pound was already strong onboard due to Bank of England’s governor Andrew Bailey who expected a pronounced recovery in Britain’s economy as vaccination against coronavirus is underway. On Thursday, the Bank of England released the credit conditions survey that indicated an increase in the mortgage payment default rates at the beginning of 2021 as the pandemic’s economic impact hit the households. This weighed a little over British Pound and capped further upside in GBP/USD pair on Thursday.


Daily Technical Levels

Support   Resistance

1.3622      1.3717

1.3576      1.3764

1.3528      1.3811

Pivot Point: 1.3670

GBP/USD– Trading Tip

The GBP/USD pair continues trading sideways between a narrow trading range of 1.3740 – 1.3703 level. On the lower side, a bearish breakout of 1.3703 level can extend the selling trend until the next support level of 1.3679 level. Conversely, a bullish crossover of 1.3740 can extend buying trend until the 1.3775 level. Let’s keep our eyes on the 1.3700 level today.


USD/JPY – Daily Analysis

The USD/JPY pair was closed at 103.489 after placing a high of 103.666 and a low of 103.325. The currency pair USD/JPY remained under consolidation and posted small losses as the U.S. dollar remained weak throughout the day. The main driver of currency pair USD/JPY on Thursday remained the rising hopes for massive stimulus from the new President of the U.S. and the latest growth outlook from the Bank of Japan.

The Bank of Japan kept its monetary policy steady on Thursday, upgraded its economic forecast for the next fiscal year, and warned of escalating risks to the outlook as new coronavirus emergency measures threatened to disrupt a fragile recovery.

Bank of Japan maintained its targets under yield curve control at -0.1% for short-term interest rates and around 0% for 10-year bond yields. The Governor of BOJ Haruhiko Kuroda said that the board had discussed the bank’s review of its policy tools due in March, though he also dropped a few hints on the outcome.

In the fresh quarterly projections, the Bank of Japan upgraded next fiscal year’s growth forecast to a 3.9% expansion from a 3.6% gain seen three months ago based on hopes the government’s huge spending package will soften the blow from the pandemic. This projection raised the Japanese Yen that ultimately weighed on the USD/JPY pair on Thursday.

However, BOJ offered a depressing view on consumption and warned that services spending would remain under strong downward pressure due to the fresh state of emergency measures taken this month. Kuroda said that the risk of Japan sliding back into deflation was not high and signaled the BOJ had offered sufficient stimulus, for now, to ease the blow from COVID-19.

On the data front, at 18:30 GMT, the Philly Fed Manufacturing Index for January advanced to 26.5 against the anticipated 11.2 and supported the U.S. dollar. The Unemployment Claims from last week fell to 900K from the anticipated 930K and supported the U.S. dollar that capped further downside in the USD/JPY pair. For December, the Building Permits advanced to 1.71M against the anticipated 1.60M and supported the U.S. dollar. The Housing Starts from December also advanced to 1.67M against the anticipated 1.56M and supported the U.S. dollar and limited USD/JPY pair losses.

From Japan, at 04:50 GMT, the Trade Balance from December dropped to 0.48T against the expected 0.70T and weighed on the Japanese Yen that limited the downfall in the USD/JPY pair on Thursday. Despite the stronger than expected macroeconomic data from the U.S., the greenback fell by 0.2% against the basket of six currencies and weighed on the USD/JPY pair as the hopes for a massive stimulus package from Democratic President Joe Biden increased.

Joe Biden is expected to announce a $1.9 trillion coronavirus relief package that will ultimately weigh on the local currency. Furthermore, the rising death cases from coronavirus in the U.S. also weighed on the U.S. dollar as the death toll surpassed 400,000 and raised fears. The weakness of the U.S. dollar dragged the USD/JPY prices on the downside on Thursday.


Daily Technical Levels

Support   Resistance

103.53      104.16

103.31      104.56

102.91      104.78

Pivot Point: 103.94

USD/JPY – Trading Tips

On Friday, the USD/JPY continues to trade sideways inside a wide trading range of 104.340 – 103.560. The USD/JPY has formed a sideways channel on the 4-hour timeframe, and it has the chance of leading the pair towards the next resistance level of 104.800 upon the breakout of 104.810. The 50 periods EMA supports the bullish trend, and we may have odds of taking a buying trade over the 103.570 level today. Good luck! 

Categories
Forex Signals

Bearish Bias Dominates USD/CAD – EMA Extends Resistance  

The USD/CAD pair is trading with a selling bias at 1.2619 level, facing an immediate resistance around 1.2630 level. The USD/CAD pair is stuck in between a narrow trading range of 1.2630 – 1.2612 level on the two-hourly timeframes. On the lower side, a bearish breakout of 1.2612 level can extend selling bias until the next support level of 1.2580 level. Conversely, an upward crossover of 1.2630 can send the USD/CAD pair further higher until the 1.2665 level. The MACD and RSI are in support of the selling trend today. 


Entry Price – Sell 1.26125

Stop Loss – 1.26525

Take Profit – 1.25725

Risk to Reward – 1:1

Profit & Loss Per Standard Lot = -$400/ +$400

Profit & Loss Per Micro Lot = -$40/ +$40

Fellas, now you can check out forex trading signals via Forex Academy mobile app. Follow the links below.

iPhone Users: https://apps.apple.com/es/app/fasignals/id1521281368

Andriod Users: https://play.google.com/store/apps/details?id=academy.forex.thesignal&hl=en_US

Categories
Forex Signals

USD/JPY Violates Triple Bottom – Sell Signal Update! 

The USD/JPY continues to trade sideways in between a wide trading range of 104.340 – 103.560. The USD/JPY has formed a sideways channel on the 4-hour timeframe, and it has the chance of leading the pair towards the next resistance level of 104.800 upon the breakout of 104.810. The 50 periods EMA supports the bullish trend, and we may have odds of taking a buying trade over the 103.570 level today. Good luck! 


Entry Price – Sell 103.385

Stop Loss – 103.785

Take Profit – 102.985

Risk to Reward – 1:1

Profit & Loss Per Standard Lot = -$400/ +$400

Profit & Loss Per Micro Lot = -$40/ +$40

Fellas, now you can check out forex trading signals via Forex Academy mobile app. Follow the links below.

iPhone Users: https://apps.apple.com/es/app/fasignals/id1521281368

Andriod Users: https://play.google.com/store/apps/details?id=academy.forex.thesignal&hl=en_US

Categories
Forex Signals

AUD/USD Upward Bias Continues – Upward Channel Supports! 

The AUD/USD currency pair maintained its previous session bullish bias and hit the intra-day high around above mid-0.7700 level mainly due to the all-time high gains in S&P 500 futures, which lent strong support to the perceived risk currency Australian dollar and contributed to the currency pair gains. The market trading sentiment was being supported by the hopes for additional U.S. fiscal stimulus measures and optimism over the rollout of COVID-19 vaccines. Moreover, the currency pair gains were further bolstered by the broad-based U.S. dollar bearish bias, which was triggered by multiple factors. 

Across the pond, the buying interest around the currency pair got an additional boost following the release of better-than-expected domestic employment details. On the negative page, the long-lasting coronavirus woes and Sino-US tensions remain on the card, which might cap the pair’s upside momentum. The AUD/USD currency pair is currently trading at 0.7771 and consolidating in the range between 0.7742 – 0.7778.

The global risk sentiment was being supported by hopes over the more aggressive fiscal spending under Joe Biden’s presidency, which will boost economic growth. Biden expressed a plan to inject $1.9 trillion into the struggling U.S. economy during his first hours as the new U.S. President. Besides this, the optimism over a potential vaccine/treatment for the highly infectious coronavirus also played its heavy role in supporting the market trading sentiment. The Oxford scientists showed a willingness to make a new formula-vaccine to combat emerging strains. Meanwhile, the World Health Organization (WHO) also supports the faster rollout of the covid vaccines. These positive developments put a bid under the U.S. stocks, lifting major indices higher, which was seen as one of the key factors that undermining the safe-haven greenback.

As in result, the broad-based U.S. failed to gain any bid and remained pessimistic on the day. Apart from this, the losses in the U.S. dollar were further sparked by the optimism over the rollout of vaccines for the highly contagious coronavirus disease. Hence, the losses in the U.S. dollar becomes the key factor that kept the currency pair higher. The U.S. Dollar Index that tracks the greenback against a bucket of other currencies dropped by 0.19% to 90.300 by 11:26 PM ET (4:26 AM GMT).

Across the pond, the buying interest around the currency pair got an additional boost following the release of better-than-expected domestic employment details. On the data front, the Aussie unemployment rate dropped to 6.6% in December. These figures were below consensus estimates, pointing to a downtick to 6.7%, and marked the lowest level since April. Meanwhile, the economy added 50,000 jobs during the reported month. Conversely, the slowdown in full-time employment may hold buyers from placing aggressive bets.

Across the Atlantic, the intensifying coronavirus woes keep challenging the upbeat market performance and become the key factor that kept the lid on any additional gains in the AUD/USD currency pair. Also, capping the gains could be the long-lasting tussle between the U.S. and China, which is picking up the pace day by day as China recently declared a list of 28 U.S. individuals, most of whom are Trump team members, to be sanctioned.

Looking forward, the market traders will keep their eyes on updates from the Biden administration. Meanwhile, the European Central Bank’s (ECB) monetary policy and U.S. Unemployment Claims will also be key to watch. In addition to this, the risk catalyst like geopolitics and the virus woes will not lose their importance. 


Daily Support and Resistance

S1 0.7662

S2 0.7703

S3 0.7724

Pivot Point 0.7743

R1 0.7765

R2 0.7783

R3 0.7823

Entry Price – Buy 0.77758

Stop Loss – 0.77358

Take Profit – 0.78158

Risk to Reward – 1:1

Profit & Loss Per Standard Lot = -$400/ +$400

Profit & Loss Per Micro Lot = -$40/ +$40

Fellas, now you can check out forex trading signals via Forex Academy mobile app. Follow the links below.

iPhone Users: https://apps.apple.com/es/app/fasignals/id1521281368

Andriod Users: https://play.google.com/store/apps/details?id=academy.forex.thesignal&hl=en_US

Categories
Forex Market Analysis

Daily F.X. Analysis, January 21 – Top Trade Setups In Forex – ECB Policy Ready to Play! 

The market’s news is likely to offer high impact events from the U.S., while the major focus will remain on the Philly Fed Manufacturing Index and Unemployment Claims. U.S. dollar may exhibit mixed bias until the release of these events as Philly fed manufacturing is expected to perform badly, and the Jobless claims are likely to perform well.

Economic Events to Watch Today  


EUR/USD – Daily Analysis

The EUR/USD continues to trade higher at the 1.2160 level, and a bullish breakout can extend buying trend until the 1.2229 level. The market trading sentiment still represents positive performance on the day as the positive environment around the Asia-Pacific stocks. All-time high upticks in the S&P 500 Futures highlight the risk-on mood, which was being supported by optimism over a potential vaccine/treatment for the highly infectious coronavirus. 

Meanwhile, the increasing hopes over more U.S. stimulus package under Joe Biden’s presidency also played its major role in supporting the market trading sentiment. The hopes of further U.S. stimulus package sparked after the Biden entered the White House, without any losses, which could be considered as one of the major reason behind the latest positive mood in the market,

In response, the broad-based U.S. declined to stop its long bearish bias and remained bearish on the day. The dip in the greenback was further sparked by the optimism over vaccines’ rollout for the highly contagious coronavirus disease, which eroded demand for safe-haven currencies. Therefore, the losses in the U.S. dollar becomes the key factor that kept the currency pair lower. The U.S. Dollar Index that measures the dollar versus a bucket of other currencies dropped by 0.19% to 90.300 by 11:26 PM ET (4:26 AM GMT).

As per the report, the Secretary of the Treasury nominee Janet Yellen urged Congress to “act big” on the Coronavirus relief program and shouldn’t worry about debt through her Senate confirmation hearing. These positive remarks helped the market trading bias to stay bid. 


Daily Technical Levels

Support   Resistance

1.2006     1.2091

1.2039     1.2106

1.2058     1.2139

Pivot Point: 1.2062

EUR/USD– Trading Tip

The EUR/USD is trading with a bullish bias at 1.2128 level. The EUR/USD is holding right below 50 periods EMA on the hourly timeframe, extending the EUR/USD pair’s resistance. On the lower side, the support level continues to hold around 1.2120 and 1.2062 level. The MACD and RSI are suggesting a mixed bias for the EUR/USD pair. Buying can be seen over 1.2115.


GBP/USD – Daily Analysis

The GBP/USD continues to hold its bullish tone through the first half of the day as the pair ran into the weekly highs around the 1.3710 mark. It’s mostly due to the weaker U.S. dollar. The trader hopes for further U.S. fiscal incentive immediately intensified after the U.S. Treasury Secretary candidate Janet Yellen urged lawmakers to act high on the COVID-19 relief package and not bother too much regarding debt. The remarks of Yellen were was seen as one of the critical factors that weakened the safe-haven U.S. dollar and added to the GBPUSD gains. 

Besides this, the dollar losses bolstered by the confidence over the rollout of COVID-19 vaccines, which confer some further support to the GBP/USD pair. The U.S. failed to stop its long bearish bias and remained bearish on the day. The losses in the U.S. dollar were further sparked by the optimism over vaccines’ rollout for the highly contagious coronavirus disease, which eroded demand for safe-haven currencies. Therefore, the losses in the U.S. dollar becomes the key factor that kept the currency pair lower. The U.S. Dollar Index that tracks the greenback against a bucket of other currencies dropped by 0.19% to 90.300 by 11:26 PM ET (4:26 AM GMT).

Conversely, the anxieties regarding increasing COVID-19 cases and economically-painful hard lockdowns in the U.K. keep questioning the pair’s upside impulse. The U.K. coronavirus strain has been discovered in at least 60 countries so far, as per the WHO report. The Kingdom announced 33,355 fresh virus cases and 1,610 deaths on the day. Globally, the number of cases has exceeded 96 million, prompting the pair’s upside momentum. Besides, the reports of likely shortage of vaccine in New York and postponement of Pfizer’s vaccine to Canada also seems to question the Sterling bullish bias.


Daily Technical Levels

Support   Resistance

1.3555     1.3722

1.3445     1.3781

1.3387     1.3890

Pivot Point: 1.3613

GBP/USD– Trading Tip

The GBP/USD is also heading north amid a weaker dollar, as it trades at a 1.3655 level. Continuation of an upward trend can lead the Cable towards the next target area of 1.3700 level. At the same time, the Cable may find support at 1.3628 level today. On the higher side, the bullish breakout of 1.3701 level can extend buying trend until 1.3736. The GBP/USD is supported by 10 and 20 periods EMA on the two-hourly timeframes, suggesting further buying in the pair. Let’s consider trading bullish over 1.3715 level today. 


USD/JPY – Daily Analysis

Today in the early European trading session, the USD/JPY currency pair failed to stop its previous-session selling bias and remained depressed around two-weeks low around below 103.5 level as the U.S. dollar faced some follow-through selling pressure, which, in turn, was seen as one of the key factors that exerting downside pressure on the USD/JPY currency pair. The bearish bias surrounding the U.S. dollar was mainly sponsored by the increasing optimism over the massive U.S. stimulus measures under the newly inaugurated Joe Biden administration, which undermined demand for safe-haven currencies. 

Simultaneously, the prevalent risk-on environment undermined the Japanese yen and helped the currency pair limit deeper losses. Meanwhile, the dovish comments by the BoJ Governor, Haruhiko Kuroda, added further burden on the JPY and extended some additional support to the USD/JPY currency pair to halt its bearish rally. Currently, the USD/JPY currency pair is currently trading at 103.47 and consolidating in the range between 103.33 – 103.67.

Conversely, the equity market’s positive performance weakened the Japanese yen and helped the currency pair limit its deeper losses. Also capping the currency pair’s losses could be the dovish comments by the BoJ Governor, Haruhiko Kuroda, which further weighed on the JPY and extended some support to the USD/JPY pair to stop its bearish rally. As per the latest report, Kuroda repeated that the BoJ observes the coronavirus’s impact very closely and will not hesitate to ease further if needed. The Japanese central bank updated its GDP target for the fiscal year 2020 to -5.6% from the previous projection of -5.5%.

On the different page, the concerns about rising COVID-19 deaths and re-imposing the economically-painful hard lockdowns keep challenging the upbeat market mood, which could change the currency pair’s direction.

Looking forward, the market traders will keep their eyes on updates from the Biden administration. Meanwhile, the European Central Bank’s (ECB) monetary policy and U.S. Unemployment Claims will also be key to watch. In addition to this, the risk catalyst like geopolitics and the virus woes will not lose their importance.


Daily Technical Levels

Support   Resistance

103.53     104.16

103.31     104.56

102.91     104.78

Pivot Point: 103.94

USD/JPY – Trading Tips

The USD/JPY continues to trade sideways in between a wide trading range of 104.340 – 103.560. The USD/JPY has formed a sideways channel on the 4-hour timeframe, and it has the chance of leading the pair towards the next resistance level of 104.800 upon the breakout of 104.810. The 50 periods EMA supports the bullish trend, and we may have odds of taking a buying trade over the 103.570 level today. Good luck! 
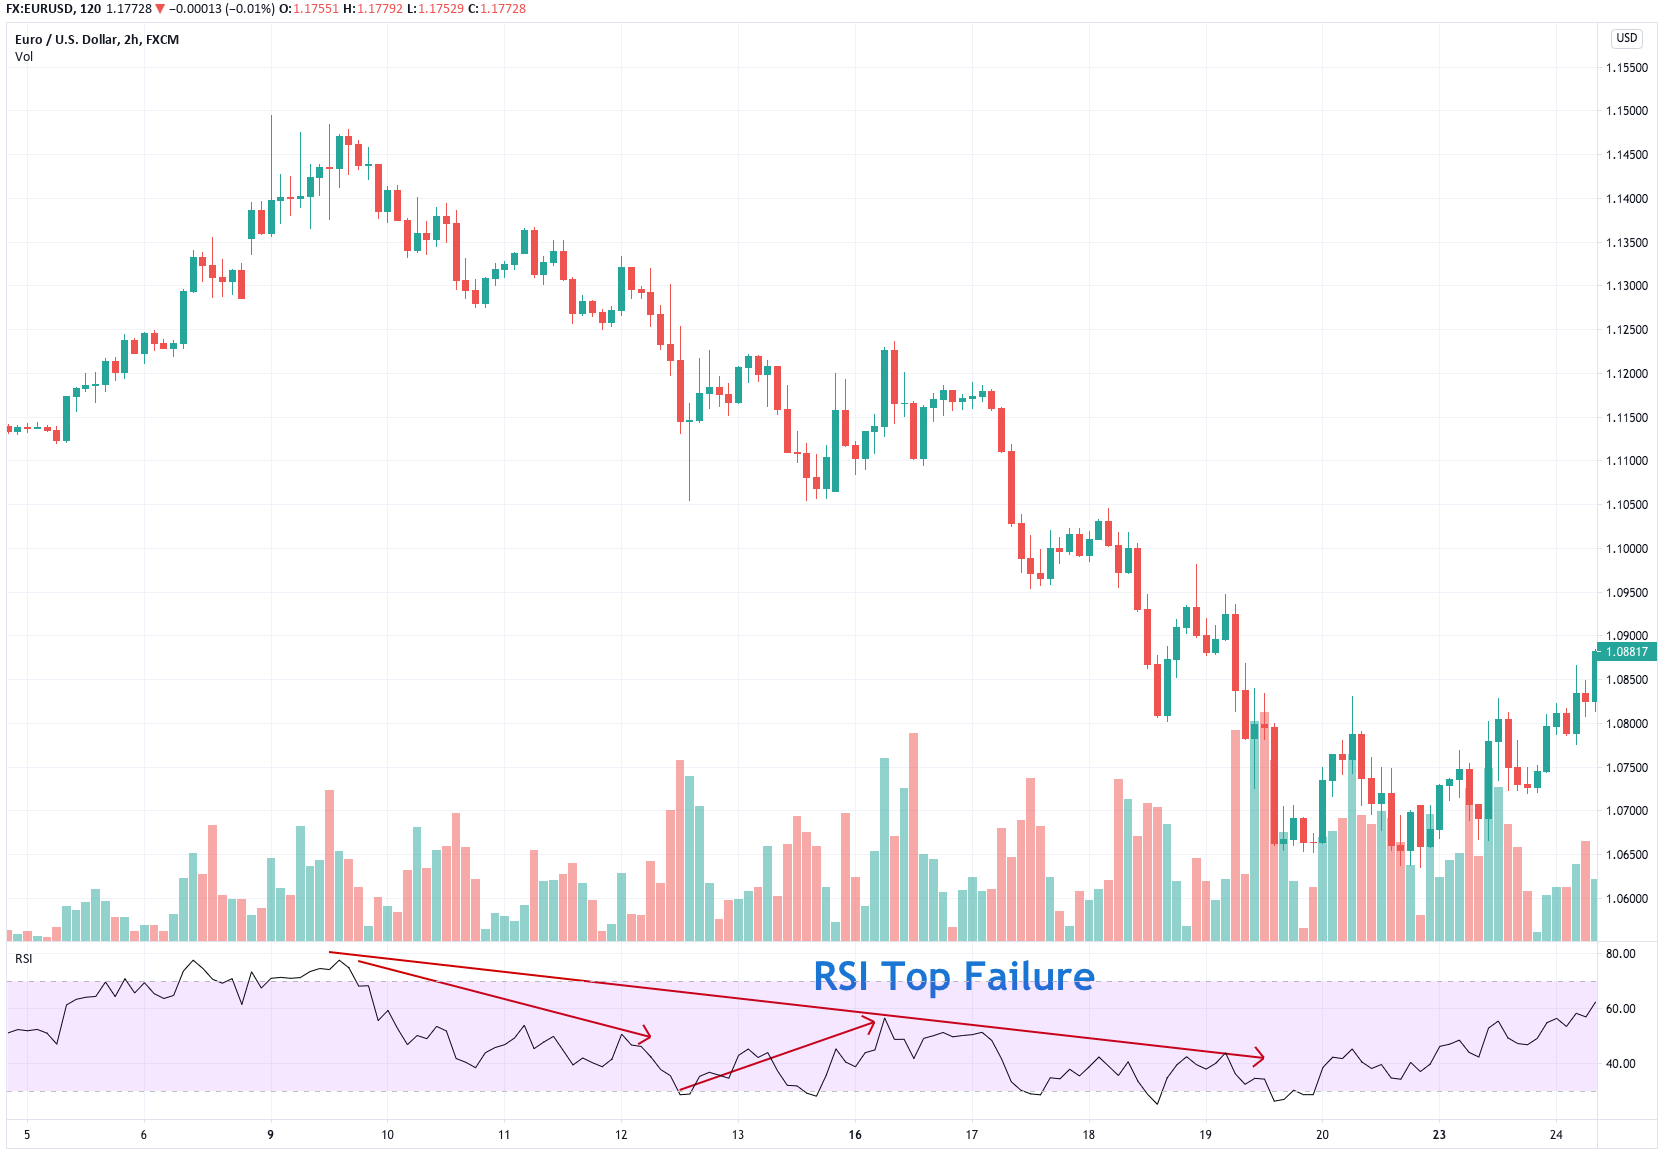
Categories
Forex Market Analysis

Daily F.X. Analysis, January 20 – Top Trade Setups In Forex – Economic Sentiment Under Spotlight!

On the news front, the eyes will remain on the U.K. Monetary Policy reports due during the late European hours. BOE isn’t expected to change the rates, and it may keep them at 0.10%; however, it will be important to see MPC Official Bank Rate Votes. Besides, the European Final CPI data will remain in focus today.

Economic Events to Watch Today  


EUR/USD – Daily Analysis

Today in the Asian trading session, the EUR/USD currency pair extended its previous-day bullish streak and refreshed daily tops around the 1.2150 regions. However, the prevalent bullish bias around the currency pair was mainly tied to the weaker U.S. dollar. The prevalent upbeat market mood was seen as one of the key factors undermining the safe-haven U.S. dollar. However, the global risk sentiment was being supported by the increasing prospects of massive fiscal spending in the U.S. Across the pond, the buying interest around the currency pair got an additional boost from the better-than-expected German ZEW Economic Sentiment Index. On the bearish side, the escalating concerns over the COVID-19 cases and economically-painful extended lockdown restrictions keep questioning the currency pair’s upside momentum. As of writing, the EUR/USD currency pair is currently trading at 1.2153 and consolidating in the range between 1.2124 – 1.2158.

The market trading sentiment managed to extend its previous-day positive performance and remained supportive during the Asian trading session on the day. However, the reason could be tied to the higher prospects of massive fiscal spending in the U.S. As per the latest report, the Secretary of the Treasury nominee Janet Yellen recently pushed Congress to “act big” on COVID- 19 relief and not worry too much about debt during her Senate confirmation hearing before the Senate Finance Committee. These positive comments helped the market trading sentiment to stay bid. The latest upticks in the equity market could also be attributed to the low number of negatives factors from the economic calendar. The prevalent upbeat market mood was seen as one of the key factors that undermining the safe-haven greenback.

Across the pond, the buying interest around the currency pair got an additional boost from the better-than-expected German ZEW Economic Sentiment Index. At the data front, the German ZEW Economic Sentiment Index climbed to 61.8 in January compared to 60.0 expected and 55.0 previous. Meanwhile, the gauge for the broader Eurozone surprisingly improved to 58.3 during the reported month against 45.5 forecasted.

On the bearish side, the concerns about rising COVID-19 cases and economically-painful hard lockdowns keep challenging the pair’s upside momentum. As per the latest report, the death toll from the coronavirus in the U.S. crossed to 401,000, and the number of cases in the country exceeded 24 million as of January 20. In addition to this, the World Health Organization (WHO) said that the U.K. coronavirus strain had been detected in at least 60 countries so far. The Kingdom reported 33,355 new virus cases and 1,610 deaths on the day. Globally, the number of cases has topped 96 million. Also questioning the pair’s upside momentum could be the reports of likely shortage of vaccine in New York and postponement of Pfizer’s vaccine to Canada.


Daily Technical Levels

Support   Resistance

1.2006     1.2091

1.2039     1.2106

1.2058     1.2139

Pivot Point: 1.2072

EUR/USD– Trading Tip

The EUR/USD is trading with a bullish bias at 1.2145 level. The pair has recently crossed over 50 periods of EMA on the hourly timeframe, suggesting chances of an upward movement in the market. Continuation of a bullish trend can lead the EUR/USD price towards the 1.2178 level. At the same time, support continues to hold around 1.2150 today. The bullish bias is likely to dominate the market.

GBP/USD – Daily Analysis

Today in the early European trading session, the GBP/USD currency pair maintained its bid tone through the first half of the Asian session and hit the weekly highs around above the mid-1.3600 level amid a softer tone surrounding the U.S. dollar. The market hopes for additional U.S. fiscal stimulus instantly escalated after the U.S. Treasury Secretary nominee Janet Yellen pushed lawmakers to act big on the COVID-19 relief package and not worry too much about debt, which in turn, was seen as one of the key factors that weakened the safe-haven U.S. dollar and contributed to the currency pair gains. Apart from this, the greenback losses were further bolstered by the optimism over the rollout of COVID-19 vaccines, which lend some additional support to the currency pair. Across the ocean, the buying interest around the cable currency pair picked up further pace following the release of hotter-than-expected U.K. consumer inflation figures. 

On the contrary, the concerns about the highly contagious coronavirus disease and the imposition of fresh travel restrictions in the U.K. could cap the GBP/USD currency pair’s upside momentum. At a particular time, the GBP/USD currency pair is currently trading at 1.3668 and consolidating in the range between 1.3627 – 1.3675.

The combination of positive factors has helped the GBP/USD currency pair catch sharp, fresh bids on the day. Be its optimism over the rollout of vaccines for the highly infectious coronavirus disease or the rising prospects of massive fiscal spending in the U.S., not the forget upbeat economics data, these all factors positively impact the market trading sentiment. 

Across the ocean, the buying interest around the cable currency pair picked up further pace following the release of hotter-than-expected U.K. consumer inflation figures. The headline CPI increased more-than-expected at the data front and arrived at a 0.6% YoY rate in December. Meanwhile, the core CPI (excluding food and energy items) also exceeded consensus estimations.

Alternatively, the concerns about rising COVID-19 cases and economically-painful hard lockdowns in the U.K. keep challenging the pair’s upside momentum. As per the latest report from World Health Organization (WHO), the U.K. coronavirus strain has been detected in at least 60 countries so far. The Kingdom reported 33,355 new virus cases and 1,610 deaths on the day. Globally, the number of cases has topped 96 million. Also questioning the pair’s upside momentum could be the reports of likely shortage of vaccine in New York and postponement of Pfizer’s vaccine to Canada.


Daily Technical Levels

Support   Resistance

1.3555      1.3722

1.3445      1.3781

1.3387      1.3890

Pivot Point: 1.3613

GBP/USD– Trading Tip

The GBP/USD is also heading north amid a weaker dollar, as it trades at a 1.3655 level. Continuation of an upward trend can lead the Cable towards the next target area of 1.3700 level. At the same time, the Cable may find support at 1.3628 level today.


USD/JPY – Daily Analysis

During Wednesday’s early European trading session, the USD/JPY currency pair failed to stop its previous-session bearish bias and came under some renewed selling pressure low around 103.13 level mainly due to the broad-based U.S. dollar weakness. The market hopes for additional U.S. fiscal stimulus increased after the U.S. Treasury Secretary nominee Janet Yellen advised lawmakers to act big on the COVID-19 relief package while stating that the benefits of increased spending are greater than the costs associated with a higher debt burden, which in turn, boosted the market trading sentiment and weakened the safe-haven U.S. dollar. 

Apart from this, the greenback losses were further bolstered by the cautious sentiment ahead of President-elect Joe Biden’s inaugural ceremony on the day. On the different page, the upbeat market sentiment weakened the safe-haven Japanese yen, which, in turn, was seen as one of the leading factors that helped the USD/JPY currency pair to limit its deeper losses. Currently, the USD/CHF currency pair is currently trading at 103.77 and consolidating in the range between 103.72 – 103.94.

The market trading sentiment was representing positive performance on the day as the bullish appearance of Asia-Pacific stocks and upticks of the S&P 500 Futures tend to highlight the risk-on mood supported by optimism over a potential vaccine/treatment for the highly infectious coronavirus. Besides this, the increasing prospects of massive fiscal spending in the U.S. also played its major role in underpinning the market trading sentiment. The market hopes for additional U.S. fiscal stimulus increased further after the U.S. Treasury Secretary nominee Janet Yellen’s confirmation hearing before the Senate Finance Committee on Tuesday. 

As in result, the broad-based U.S. failed to gain any bid and remained pessimistic on the day. Apart from this, the losses in the U.S. dollar were further sparked by the optimism over the rollout of vaccines for the highly contagious coronavirus disease. In addition to this, the cautious sentiment ahead of President-elect Joe Biden’s inaugural ceremony also exerted downside pressure on the greenback. Hence, the losses in the U.S. dollar becomes the key factor that kept the currency pair lower. Meanwhile, the U.S. Dollar Index that tracks the greenback against a bucket of other currencies dropped by 0.11% to 90.365 by 9:17 PM ET (2:17 AM GMT)—moving on, the intensifying hopes for more aggressive U.S. fiscal spending under Biden’s presidency continuously providing support to the U.S. Treasury bond yields, which could help the U.S. dollar to limit any meaningful downside.

Conversely, the positive performance around the equity market was slightly unaffected by the concerns about rising COVID-19 deaths and the re-imposing of the economically-painful hard lockdowns, which keep fueling the worries over the global economic recovery. As per the latest report, the death cases from the COVID in the U.S. crossed to 401,000, and the number of cases in the country exceeded 24 million as of January 20. In addition to this, the World Health Organization (WHO) said that the U.K. coronavirus strain had been detected in at least 60 countries so far. The Kingdom reported 33,355 new virus cases and 1,610 deaths on the day. Globally, the number of cases has topped 96 million. Also questioning the pair’s upside momentum could be the reports of likely shortage of vaccine in New York and postponement of Pfizer’s vaccine to Canada.


Daily Technical Levels

Support   Resistance

103.53     104.16

103.31     104.56

102.91     104.78

Pivot Point: 103.94

USD/JPY – Trading Tips

The USD/JPY continues to trade sideways in between a wide trading range of 104.340 – 103.560. The USD/JPY has formed a sideways channel on the 4-hour timeframe, and it has the chance of leading the pair towards the next resistance level of 104.800 upon the breakout of 104.810. The 50 periods EMA supports the bullish trend, and we may have odds of taking a buying trade over the 103.570 level today. Good luck! 
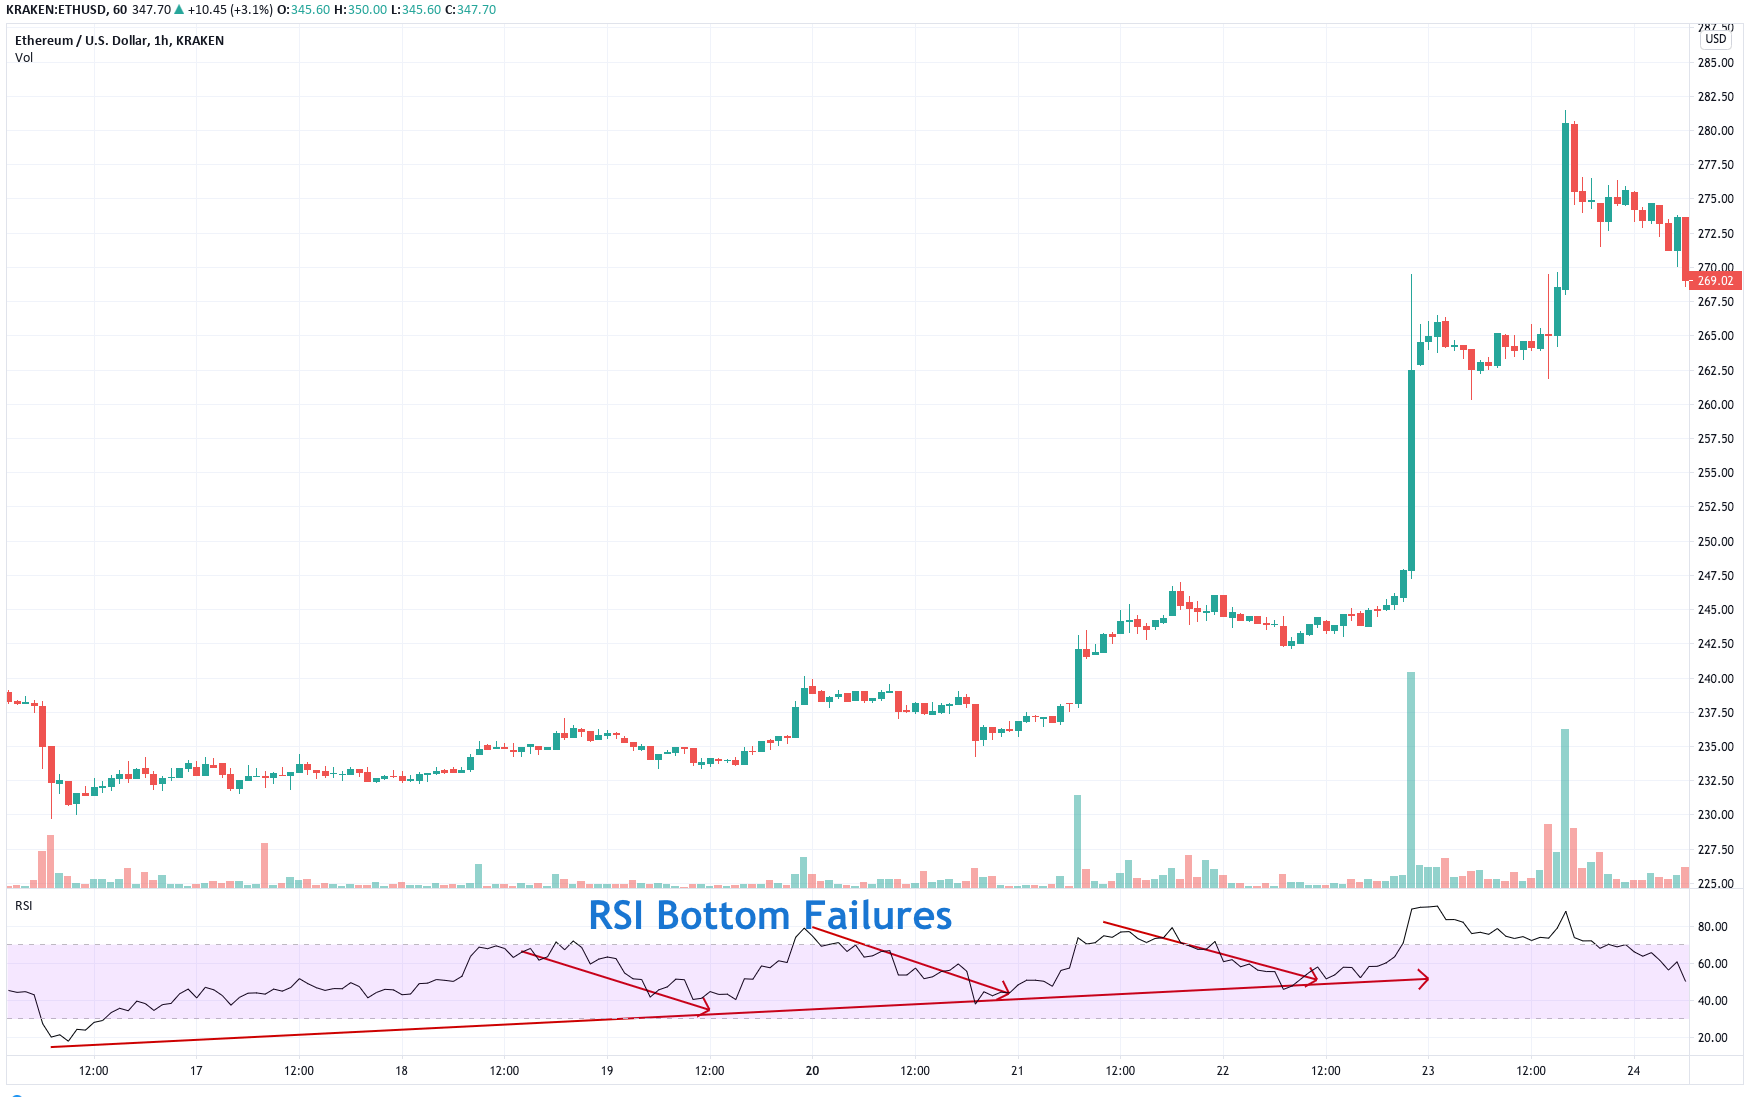
Categories
Forex Daily Topic Forex Fundamental Analysis

GBP/AUD Global Macro Analysis – Part 1 & 2

Introduction

This analysis will look into endogenous factors that influence economic growth both in the UK and Australia. We will also analyze the exogenous factors that impact the exchange rate of the GBP/AUD pair.

Ranking Scale

We will conduct correlation analysis, which we will use to rank the endogenous and exogenous factors on a scale of -10 to 10.

In ranking the endogenous factors, we will conduct a correlation analysis against the GDP growth rate. If the score is negative, the endogenous factor has resulted in depreciation of either the GBP of the AUD. Conversely, if the score is positive, then the factor has resulted in an appreciation of the local currency.

When the exogenous analysis is negative, the factor has resulted in a decline of the GBP/AUD exchange rate. If the score is positive, then the factor has led to an increase in the exchange rate.

Summary – GBP Endogenous Analysis

-15 score indicates that the Pound has depreciated since the starting of 2020.

Summary – AUD Endogenous Analysis

A score of -8 indicates that the Australian dollar has depreciated as well since the beginning of 2020.

Indicator Score Total State Comment
Australia Employment Rate -3 10 61.2% in October The employment rate hit 20-year lows during the pandemic. It’s expected to continue recovery as the economy recovers
Australia Core Consumer Prices 2 10 117.49 in Q3 2020 The inflation rate still lower than Q1, but the demand is increasing in the economy
Australia Manufacturing Production -3 10 Q3 projected to drop by 3.5% Q2 dropped by 6.2%. Production expected to improve in Q3 as business operation resume some normalcy
Australia Business Confidence 6 10 NAB business confidence was 12 in November It’s the highest level since April 2018. This shows that businesses are highly optimistic about their future operations
Australia Consumer Spending -3 10 Was 253.648 billion AUD in Q3 2020 Q3 levels still lower than Q1 domestic expenditure. Expected to increase further when the economy recovers to pre-pandemic levels
Australia Construction Output -3 10 Q3 output dropped by 2.6% Q3 drop caused by a reduction in residential and non-residential construction, engineering, and building works
Australia Government Budget Value -4 10 a budget deficit of 10.974 billion AUD in October The government budget deficit is improving. This shows that the revenue stream is improving as businesses resume operations
TOTAL SCORE -8
  1. Australia Employment Rate

This indicator shows the number of working-age Australians who are employed during a particular period. As an indicator of growth in the labor market, the employment rate shows if the economy is adding or shedding jobs. Thus, it is used to show periods of economic growth and contractions.

The Australian labor market has been recovering from the coronavirus pandemic shocks when the employment rate hit a 20-year low of 58.2%. In October 2020, Australia had an employment rate of 61.2%, up from 60.4% in September. However, it is still lower than January’s 62.6%. Australia’s employment rate has a score of -3.

  1. Australia Trimmed Mean Consumer Prices

This indicator is also called core consumer prices. It measures the price changes of goods and services that are frequently purchased by Australian households. The computation of the trimmed mean consumer prices excludes goods and services whose prices are volatile.

In Q3 2020, the core consumer prices in Australia rose to 117.49 from 117.04 in Q2. Q3 levels are also higher than the 117.17 points recorded in Q1. This shows that the economy is recovering since an increase in prices implies an increase in domestic demand for goods and services. We assign a score of 2.

  1. Australia Manufacturing Production

This indicator shows the YoY change in the value of output from the manufacturing sector. The Australian economy is heavily dependent on industrial production; hence, manufacturing production changes provides invaluable insights into the domestic economic growth. It also shows how the economy is recovering from the impact of COVID-19.

In Q2 2020, the YoY manufacturing production in Australia dropped by 6.2%, compared to 2.7% growth in Q1. Q3 YoY manufacturing production is expected to drop by 3.5%. Consequently, Australian manufacturing production has a score of -3.

  1. Australia Business Confidence

Business confidence in Australia is measured by conducting a monthly survey of about 600 businesses. They include small, medium, and large companies operating in non-agricultural sectors. The survey gauges the businesses’ expectations in terms of profitability, trading volume, and employees. The index is derived by considering the percentage of respondents who have good and very good expectations and those who have a bad and very bad outlook.

In November 2020, the NAB business confidence increased to 12 from 3 in October, which has been the highest since April 2018. Australia’s business confidence has a score of 6.

  1. Australia Consumer Spending

The indicator records the quarterly change in the value of goods and services consumed by domestic households. It includes expenditure by non-profit organizations that provide goods and services to Australian households and the value of backyard productions.

In Q3 of 2020, consumer spending in Australia rose to AUD 253.648 billion from AUD 235.131 billion in Q2. Although it’s lower than Q1 expenditure, domestic demand in the economy is rebounding from the slump of COVID-19. Consequently, Australian consumer spending has a score of -3.

  1. Australia Construction Output

This indicator shows the quarterly change in the value of construction work in Australia. The total value involves both private and public sector building and engineering work.

In the third quarter of 2020, Australia’s construction output dropped by 2.6% from a 0.5% growth in Q2. This drop was caused by output drop in residential and non-residential construction, engineering, and building works. Thus, we assign a score of -3.

  1. Australia Government Budget Value

The government budget value measures whether the Australian government has a budget surplus or deficit. A budget surplus implies that the government’s expenditure is less than its revenue. Similarly, a budget deficit means that the government spends more than it collects in terms of revenue.

In October 2020, Australia had a budget deficit of AUD 10.974 billion, up from a deficit of 33.613 billion in September. We assign a score of -4.

In the next article, you can find the Exogenous analysis of the GBP/AUD currency pair and also our forecast on its price movement in the near future. Cheers.

Categories
Forex Signals

Three White Soldiers Underpins EUR/JPY – Buying Signal Update! 

Join F.A. Telegram Channel: https://t.me/forexsignalsFA

The EUR/JPY pair is trading sharply bullish around 126.350 level, having formed three white soldiers on the two-hourly timeframes. The leading indicators are the suggesting buying trend in the pair, which may lead the EUR/JPY pair towards 126.245. On the lower side, the EUR/JPY is likely to find support at the 125.799 level. Let’s stay bullish above 126.00 level today. Checkout the EUR/JPY trade plan below and also follow FA Trading Signal Channel on Telegram. 


Entry Price – Buy 126.036

Stop Loss – 125.636

Take Profit – 126.436

Risk to Reward – 1:1

Profit & Loss Per Standard Lot = -$400/ +$400

Profit & Loss Per Micro Lot = -$40/ +$40

Fellas, now you can check out forex trading signals via Forex Academy mobile app. Follow the links below.

iPhone Users: https://apps.apple.com/es/app/fasignals/id1521281368

Andriod Users: https://play.google.com/store/apps/details?id=academy.forex.thesignal&hl=en_US


Categories
Forex Signals

AUD/USD Bearish Engulfing Candle – Is It Good Time to Sell?

Join F.A. Telegram Channel for Free Trading Signals: https://t.me/forexsignalsFA

During Tuesday’s early European trading session, the AUD/USD currency pair snapped its previous two-day losing streak and caught some fresh bids around above 0.7700 level mostly due to the recent upticks in S&P 500 index, which tend to underpin the perceived risk currency Australian dollar and contributes to the currency pair gains. Hence, the market trading sentiment was being supported by the optimism over the rollout of COVID-19 vaccines and hopes for additional U.S. fiscal stimulus measures. 

Across the pond, the broad-based U.S. dollar bearish bias, triggered by multiple factors, also played its major role in strengthening the currency pair. In contrast to this, the long-lasting coronavirus distress globally keeps questioning the market’s upbeat mood, which could cap gains for the currency pair. At this time, the AUD/USD currency pair is currently trading at 0.7710 and consolidating in the range between 0.7672 – 0.7725.

The market trading sentiment has been gaining positive traction since the day started and was being supported by the optimism over the rollout of COVID-19 vaccines and hopes for additional U.S. fiscal stimulus measures. As per the latest report, the U.S. President-elect Joe Biden is prepared to take office on January 20, pushing for the $1.9 trillion stimulus package already outlined last week. In the meantime, the Treasury Secretary nominee Janet Yellen is also expected to push the government to “act big” with its next coronavirus relief package when she testifies before the Senate later on Tuesday. Hence, the prevalent upbeat market mood underpinned the Australian dollar’s perceived risk currency and contributed to the currency pair gains.

At the USD front, the broad-based U.S. dollar failed to gain any positive traction during the early European trading hours amid risk-on market sentiment. Apart from this, the greenback losses could also be associated with the low-interest record rates’ expectations. Conversely, the expectations of a larger government borrowing recently triggered a fresh leg up in the U.S. Treasury bond yields, which might help the U.S. dollar limit any meaningful downside. However, the losses in the U.S. dollar pushed the currency pair higher. The U.S. Dollar Index that tracks the greenback against a bucket of other currencies dropped by 0.11% to 90.653 by 11:03 PM ET (4:03 AM GMT). 

On the bearish side, the long-lasting worries about the continuous surge in new COVID-19 cases challenging the upbeat market sentiment and turned out to be one of the key factors that kept the lid on any additional gains in the currency pair. Furthermore, the cautious sentiment ahead of President-elect Joe Biden’s inaugural ceremony also probes the bulls.

In the absence of high impact economic events from the U.S., the U.S. Treasury Secretary nominee Janet Yellen’s testimony will influence the USD price dynamics. Meanwhile, the broader market risk sentiment could produce some short-term trading opportunities around the currency pair.


Daily Support and Resistance

S1 0.7606

S2 0.7642

S3 0.7662

Pivot Point 0.7679

R1 0.7698

R2 0.7715

R3 0.7752

The AUD/USD is trading at 0.7709 level holding below an immediate resistance level of 0.7725. The recent closing bearish engulfing candles can trigger odds of selling bias in the AUD/USD pair. However, we are not taking a sell trade yet, as the 50 periods EMA and MACD is staying in a bullish zone. Let’s keep an eye on the 0.7722 level as selling can be expected below this level along with buying over the 0.7722 mark. Good luck! 


Categories
Forex Market Analysis

Daily F.X. Analysis, January 19 – Top Trade Setups In Forex – Economic Sentiment Under Spotlight!

The eyes will remain on the European German ZEW Economic Sentiment data and the Current Account figures from Europe on the news front. All of the figures are expected to have a mixed impact, which may put sideways in the single currency Euro. Besides this, the eyes will stay on the German Final CPI figures.

Economic Events to Watch Today  


EUR/USD – Daily Analysis

Today in the Asian trading session, the EUR/USD currency pair successfully extended its overnight bullish streak and remained supportive around just below 1.2100 level of upbeat market trading that weighed on the U.S. dollar. The U.S. dollar weakness was seen as one of the key factors that pushed the currency pair higher. However, the sentiment around the equity market was being supported by the expectations of additional fiscal stimulus. It should be noted that the U.S. President-elect Joe Biden is ready to take Office on January 20, pushing for the $1.9 trillion stimulus package already planned last week. Meanwhile, the cautious sentiment ahead of the Biden government’s inauguration and the coronavirus (COVID-19) worried added further weakness to the greenback and contributed to the currency pair gains. Across the Atlantic, the Eurozone finance ministers’ latest push for financial support for their economies to boost the post-pandemic recovery plans also played its major role in underpinning the EUR/USD currency pair. 

The escalating concerns over the COVID-19 cases and economically-painful hard lockdowns keep questioning the pair’s upside momentum on the bearish side. As of writing, the EUR/USD currency pair is currently trading at 1.2087 and consolidating in the range between 52.17 – 52.49. The market trading sentiment managed to erase its previous-day losses and turned positive during the Asian trading session on the day. However, the reason could be attributed to the high expectations of additional fiscal stimulus. It is worth recalling that the U.S. President-elect Joe Biden is ready to take Office on January 20, pushing for the $1.9 trillion stimulus package already outlined last week. In the meantime, the Treasury Secretary nominee Janet Yellen is expected to push the government to “act big” with its next coronavirus relief package when she testifies before the Senate later on Tuesday. This latest optimism put a bid under risk assets and weighed over the safe-haven U.S. dollar. 

On the bearish side, the concerns about rising COVID-19 cases and economically-painful hard lockdowns keep challenging the upbeat market performance, which was seen as the key factor that kept the lid on any additional gains the currency pair. As per the latest report, the COVID-19 cases in Europe, the U.S., and the U.K. decreased somewhat but still not satisfactory as the strains are spreading faster, which in turn cause fresh activity restrictions. Moving ahead, the market traders will keep their eyes on the German ZEW survey, which is due to release later in the day. Meanwhile, the covid updates and any additional stimulus hint will also be key to watch.


Daily Technical Levels

Support   Resistance

1.2006      1.2091

1.2039      1.2106

1.2058      1.2139

Pivot Point: 1.2072

EUR/USD– Trading Tip

The EUR/USD is trading over 1.2064 support level, and closing of bullish engulfing candles over the same level supports the chances of

bullish correction until the 1.2115 level. On the lower side, the bearish breakout of the 1.2065 level can drive the selling trend until the support level of 1.2005. The 50 EMA and MACD suggest the pair is oversold and should reverse back slightly before exhibiting selling bias.


GBP/USD – Daily Analysis

The GBP/USD currency pair failed to stop its previous session bearish bias and drew some offers around the 1.3535 level mainly due to the prevalent cautious mood, which underpinned the U.S. dollar and contributed to the currency pair losses. The optimism over the rollout of COVID-19 vaccines helps the currency pair to limit its deeper losses along with capping the losses could be the latest report by U.K. vaccine deployment minister Nadhim Zahawi that everyone will be granted a vaccine by September. Currently, the GBP/USD currency pair is currently trading at 1.3537 and consolidating in the range between the 1.3524 – 1.3602.

Despite the on-going optimism about a potential treatment/vaccine and U.S. coronavirus (COVID-19) stimulus bill, the market risk mood failed to stop its previous negative performance and stay bearish during the European session amid growing market concerns over the potential economic fallout from the continuous rise in new COVID-19. The worries were further fueled by Friday’s disappointing U.S. monthly Retail Sales figures for December. 

At the USD front, the broad-based U.S. dollar extended its early-day gaining streak and remained bullish during the European session on the day as investors still preferring to invest in the safe-haven assets in the wake of the risk-off market sentiment. However, the U.S. dollar gains were seen as one of the key factors that kept the currency pair lower. 

The currency pair was further pressured across the ocean by the imposition of fresh restrictions in the U.K. On the other hand, the optimism over the rollout of COVID-19 vaccines failed to give any meaningful support to the currency pair. The market traders will keep their eyes on the BOE Gov Bailey Speaks along with the Candian Housing Starts data. In the meantime, the coronavirus saga developments could play a key role in influencing the market risk sentiment and the USD price dynamics. 


Daily Technical Levels

Support   Resistance

1.3555      1.3722

1.3445      1.3781

1.3387      1.3890

Pivot Point: 1.3613

GBP/USD– Trading Tip

The GBP/USD pair trades have bounced off over the support level of 1.3534 level, and it’s likely to face resistance at the support become resistance level of 1.3617 level. Bullish crossover of this level can extend buying trend until 1.3697 area. On the lower side, the violation of the 1.3534 support level can extend the selling trend until the 1.3457 level. The MACD and RSI are in support of buying; thus, we should consider buying over 1.3617 and selling below the same.   


USD/JPY – Daily Analysis

The USD/JPY currency pair failed to stop its previous-day declining streak and remained depressed near 103.70 level mainly due to the worsening coronavirus (COVID-19) woes in the U.S., Europe, and some of the notable Asian nations like Japan, which fuel doubts over the global economic recovery and weighs on the market trading sentiment. In that way, the prevalent cautious sentiment benefitted the safe-haven Japanese yen and was seen as one of the key factors that exerting pressure on the USD/JPY currency pair. 

In contrast to this, the broad-based U.S. dollar strength, backed by the market risk-off tone, has become the key factor that helps the currency pair limit its deeper losses. Meanwhile, the coronavirus (COVID-19) vaccine’s positive developments help the market trading sentiment limit its deeper losses, which might change the currency pair’s direction. As of writing, the USD/JPY currency pair is currently trading at 103.77 and consolidating in the range between 103.69 – 103.93.

Despite the optimism about a potential treatment/vaccine, the market risk mood failed to stop its previous negative performance and stay bearish during the European session amid growing market concerns over the potential economic fallout from the continuous rise in new COVID-19. These worries were further fueled by Friday’s disappointing U.S. monthly Retail Sales figures for December. At the data front, the core retail sales declined 1.4% month-on-month in December, which was higher than the 0.1% contraction in forecasts and the 1.3% contraction recorded in November. Simultaneously, the Producer Price Index (PPI) increased 0.3% month on month in December, while retail sales declined 0.7% MoM in the same month. 

At the coronavirus front, the coronavirus (COVID-19) resurgence in Europe and the U.S. is still not showing any sign of slowing down, which keeps fueling the doubts over the economic recovery as the authorities in the U.S. and Europe keep imposing back to back restrictions over activities in efforts to control the spread of the virus. This, in turn, exerted downside pressure on the market risk tone and contributed to currency pair losses.

The traders will focus on the BOE Gov Bailey Speaks, and the Candian Housing Starts data. In the meantime, the coronavirus saga developments could play a key role in influencing the market risk sentiment and the USD price dynamics. 


Daily Technical Levels

Support   Resistance

103.53      104.16

103.31      104.56

102.91      104.78

Pivot Point: 103.94

USD/JPY – Trading Tips

The USD/JPY continues to trade sideways in between a wide trading range of 104.340 – 103.560. The USD/JPY has formed a sideways channel on the 4-hour timeframe, and it has the chance of leading the pair towards the next resistance level of 104.800 upon the breakout of 104.810. The 50 periods EMA supports the bullish trend, and we may have odds of taking a buying trade over the 103.570 level today. Good luck! 
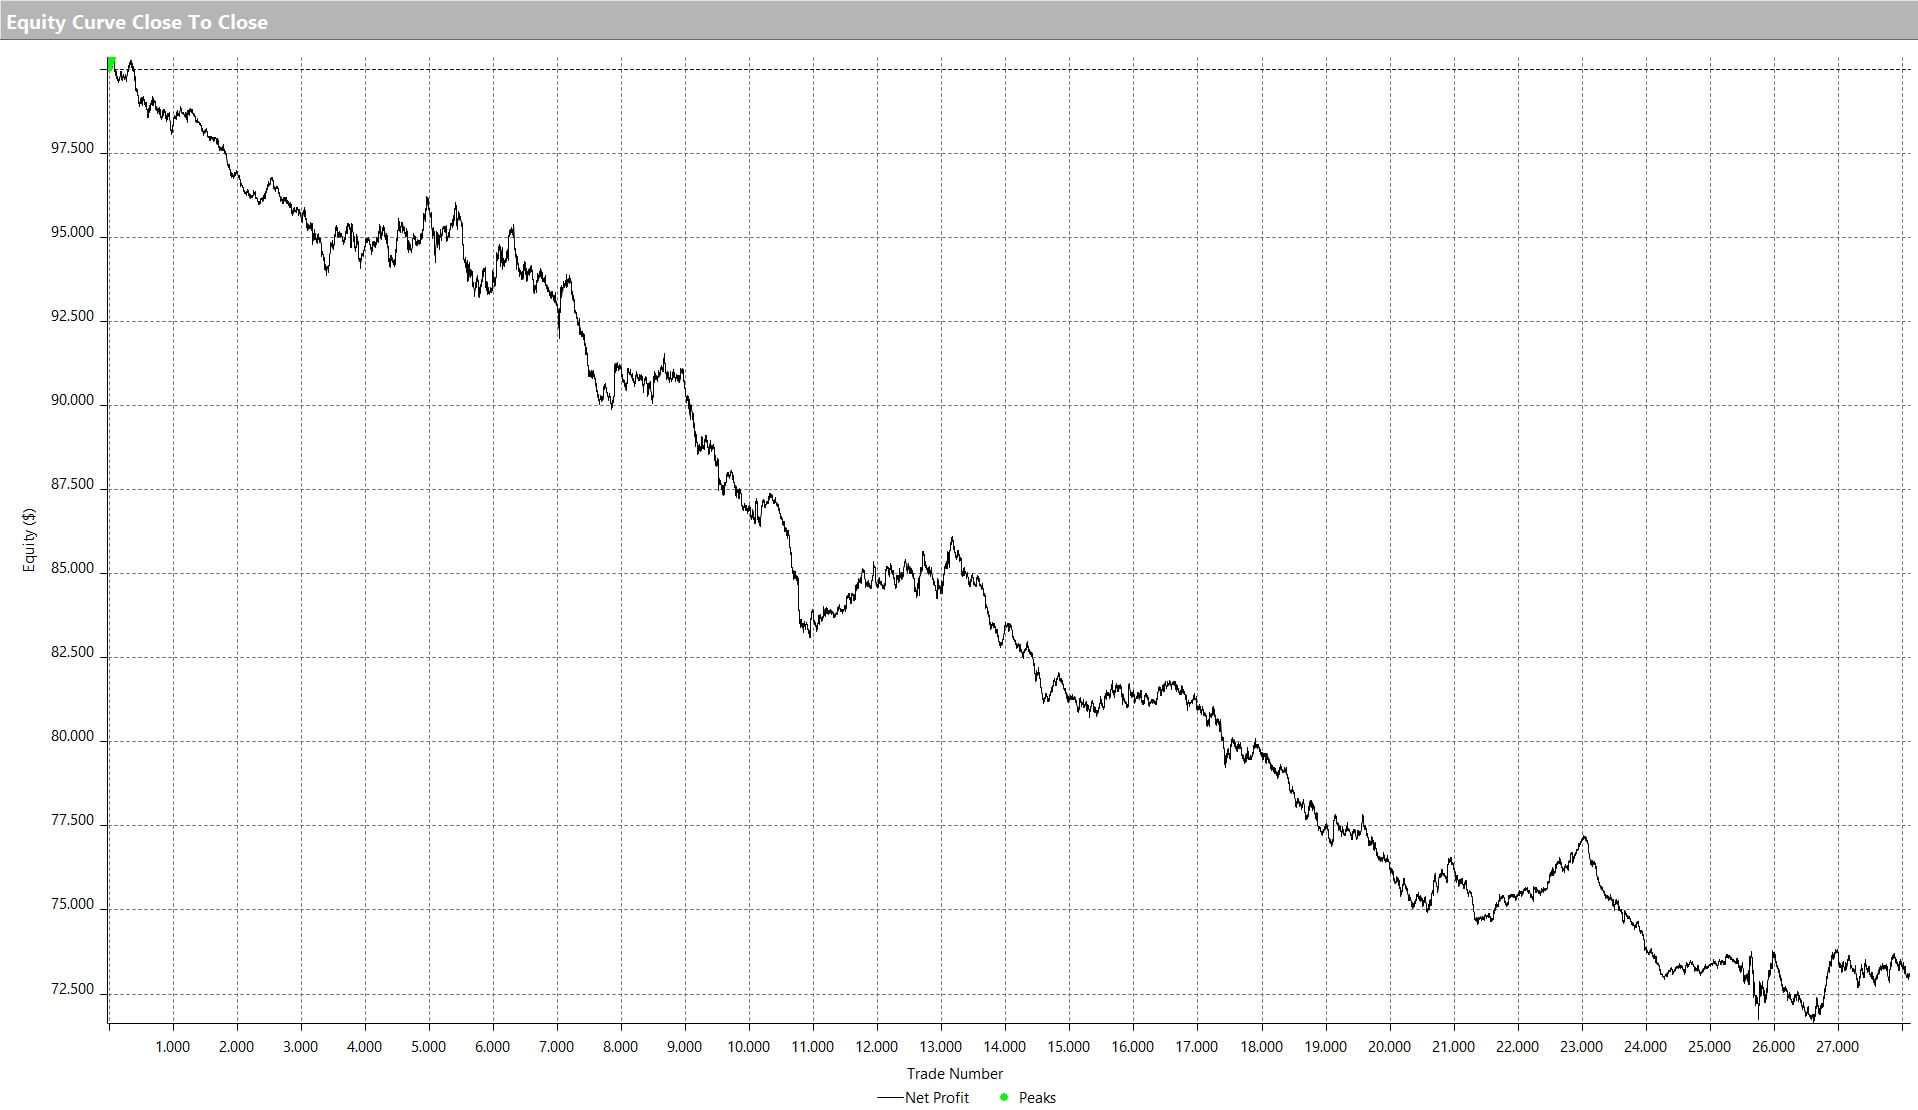
Categories
Forex Videos

The DOW Jones Is Getting Ready To Drop!
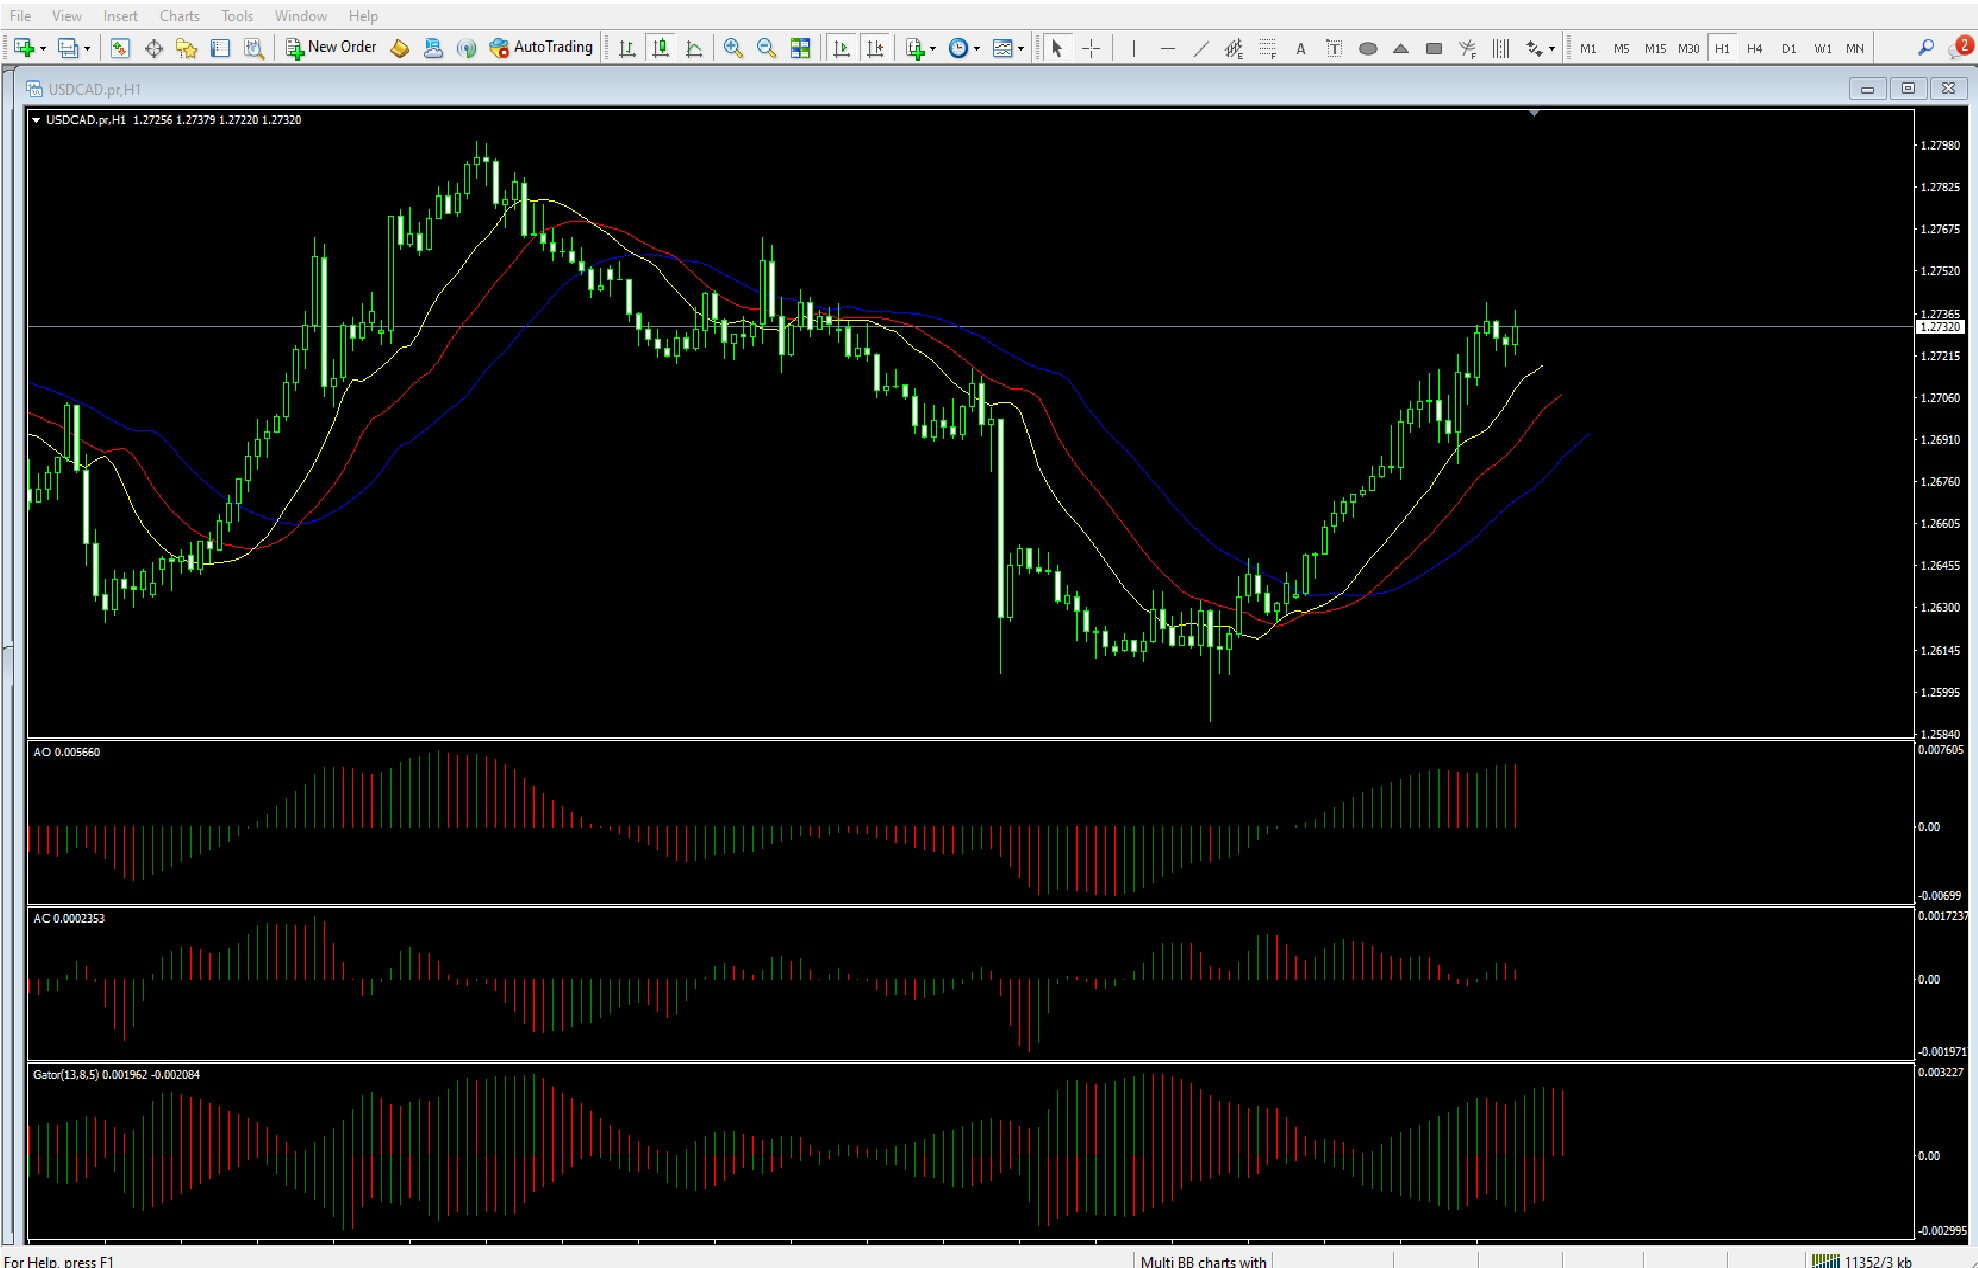

Dow Jones 30 Industrial index pulls from historic highs. Where next?

 Thank you for joining this forex academy educational video.

In this session, we will be looking at the potential directional bias for the United States Dow Jones 30 industrial index, which has recently hit a historic high.

On the 6th of January 2021, the United States capitol riot shocked the world. The United States Congress insurrection was carried out by a mob of Donald Trump’s supporters in an attempt to overturn his defeat of the 2020 presidential election.

While the world’s media focused on the attack of the most advanced political system in the world, which was viewed by billions of people across the globe in utter shock and disbelief, and where 5 souls, including a police officer, lost their lives in the riot, the Dow Jones 30 industrial index, in a somewhat unexpected move, aggressively turned bid, and subsequently went on to reach an all-time record high around the 31,200 level.

The bull run has largely been a continuation of the 18,000 low reversal in March when the pandemic began to bite the US economy and caused the shock collapse from its recent 29,500 record-breaking pre-pandemic high.

Much of the pre-pandemic record-breaking high on us stock indices, including the Dow Jones 30, can be attributed to the Trump administration’s policies of low taxation for corporations and less red tape for them. Indeed, had it not been for the pandemic, President Trump may well have gone down as one of the best presidents ever in terms of revitalising the United States economy, where it also so reached a record number of US citizens in employment.

However, with Trump and the republican party on the way out, and with Biden and democratic about to take office on the 20th of January, 2021, the incredible amounts of money which have been thrown at the US economy to prop it up during the pandemic from the coffers of the United States treasury department,  must be repaid,  and where president-elect, Joe Biden has made it quite clear, during his campaigning, that he intends to raise corporate taxation in order to find some of the money, and where he will also reverse policies of the previous government,  such as low red tape requirements for businesses.

In which case, there is an obvious conflict, whereby one government’s policies caused Dow Jones to be at a record high and where the incoming party is about to reverse the policies which caused the record run, which will likely cause pressure on those businesses, which will have less profit due to higher taxation, in which case the stock market should reverse its winning streak? So why the continued bull run on stocks?

This can largely be put down to positioning.  Where hedge funds, banks, investors, and other financial institutions are preparing themselves for a potential future shock by driving stock indices higher before any such new legislation will cause a likely negative impact on stocks.

Quite often, investors will position themselves for future shocks by driving an asset higher, in anticipation of a future correction lower, – or the other way – which on a fundamental economic basis, in this scenario, should be the way forward if such policies of higher taxation were introduced. More tax equals less profit, equals lower dividends for investors, and lower corporate valuation.

We still have a few days to go and until the inauguration, and then there is the Donald Trump impeachment, which may cause a delay in the democratic party’s policy implementation, and, as shown here on the daily chart for the Dow Jones 30 index, it is still in a confirmed bull trend, in which case traders will be looking for breaches of the support and resistance lines as shown here, while eagerly waiting for any new policy changes by the incoming Democratic administration.

One thing is certain, there will be continued volatility in the financial markets as the fallout from the pandemic continues to cause turbulence and where recent data confirms higher unemployment and less consumer spending in the USA, which are more possible reasons for the fall in the index from its recent high, and worries about the change in government and policies. 

Categories
Forex Videos

Biden Shows His Cards – This Is How The Market Is Preparing To React!


Biden shows his cards, markets are rattled! – where next for the US Dollar?

Thank you for joining this forex academy educational video.

On Thursday the 14th of January, president-elect Joe Biden addressed the US nation and said that ‘’the $600 already appropriated is simply not enough’’. 

He carried on by saying that the new democrat government would issue another round of $1,400, on top of.the $600 payments, thus showing his hand with regard to the 15 million adult dependants relying on these stimulus checks.  This segment of the Covid relief package runs to 1.9 trillion dollars. 

With yet many more millions of Americans, including migrants, who have slipped the net with regard to relief packages, the wranglers about entitlement will go on as long as the pandemic continues to run rife throughout the United States.  With some young adults purchasing new cars with the extra cash, and others boasting of savings of $13,000 from the relief payments, it is hardly surprising that there will be continued frictions between the two parties, let alone the public and pressure groups, which will only go to show that this is not a one-size-fits-all policy.
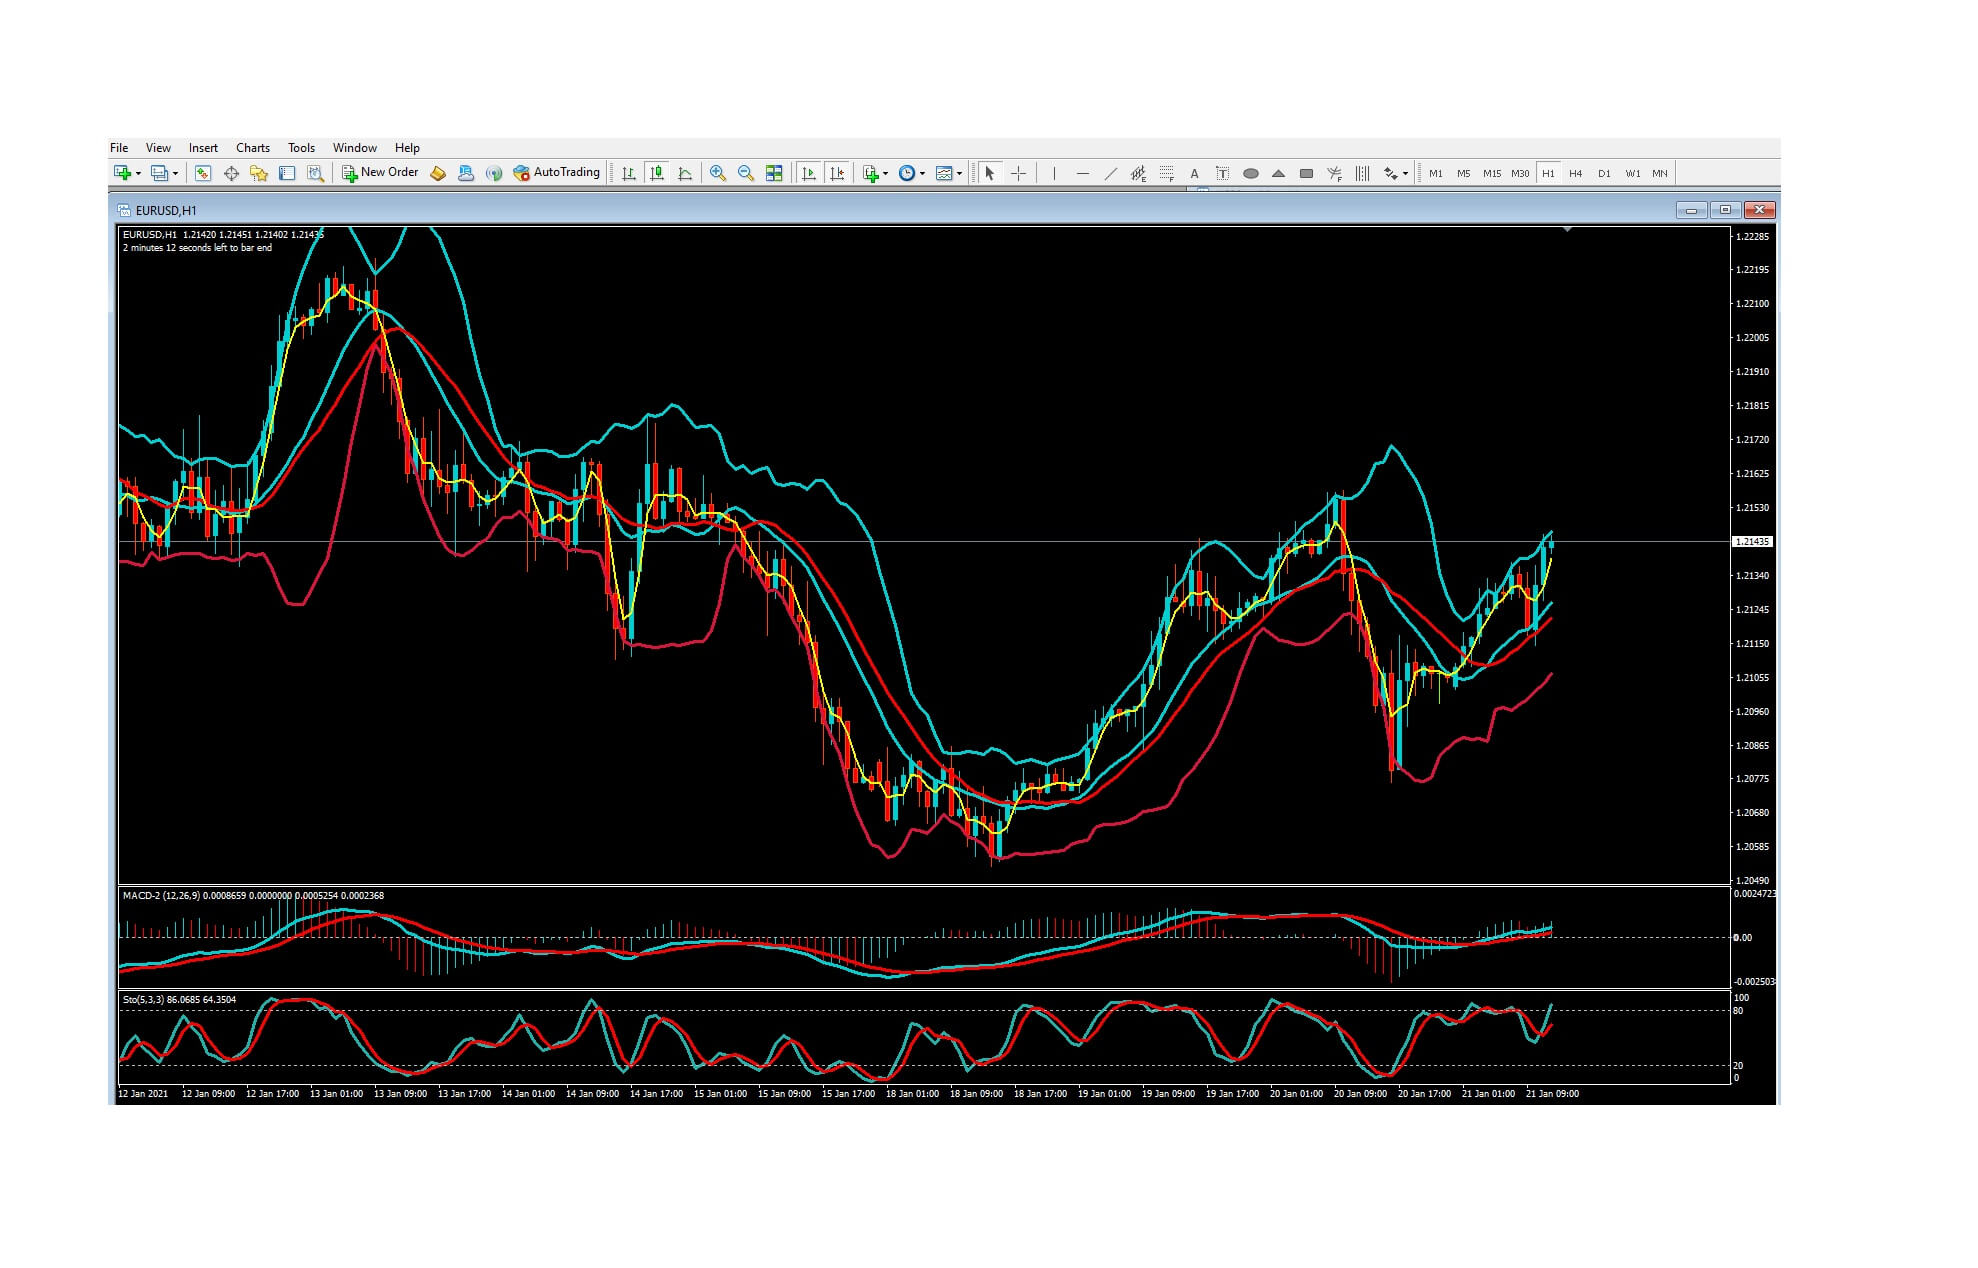
Markets saw volatility following the comments with the dollar index shown here on the daily time frame, recovering from its low of 89.15, in the dollar-weighted average against the pound, the Euro, the yen, Swiss franc Canadian dollar, and Australian and New Zealand dollars. 
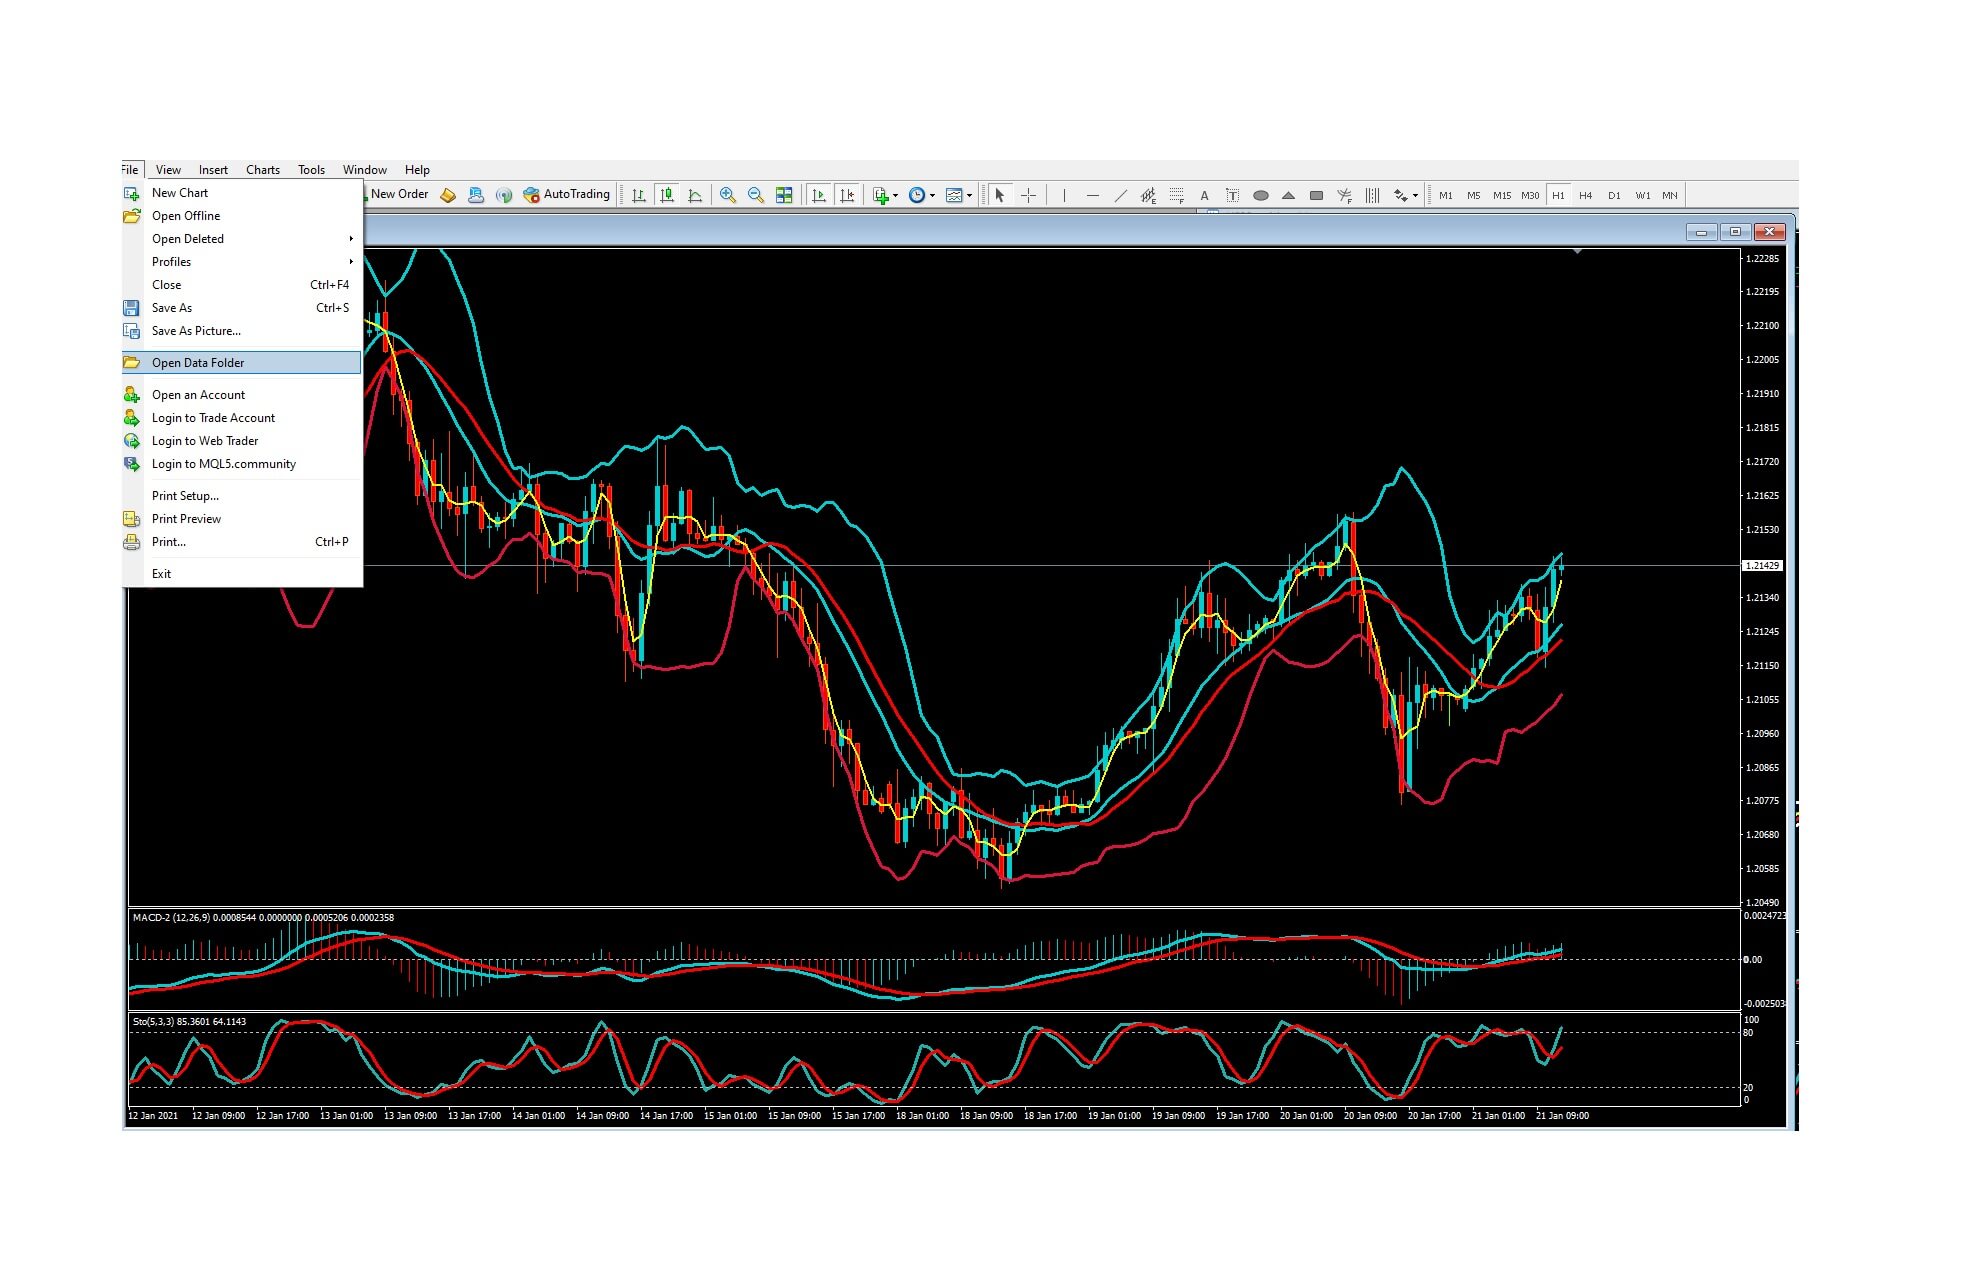
Although the rot stopped on the 6th of January, dollar strength has been conforming to this support line, on the 1-hour chart, which was bolstered by Joe Biden’s comments on the 14th , to the point where we have a high of 90.80 at the time of writing.

While the bull run on the US dollar may be partially down to Joe Biden’s covid relief policy,  there are other factors to consider, including the buy the rumour sell the fact trading phenomenon, where market participants were largely expecting the incoming President to instigate a larger relief package and especially now that the democrats are in control in Congress, thus making it more easily to be able to get through new policies.

Other things to consider, as shown here on the daily cable chart, where the pound to US Dollar pair remains in a bull run, although it has topped out at the 1.37 exchange rate, having achieved the high due to the success of the UK and EU signing a post Brexit free trade deal,  which has been giving the pair a lift, but where the United Kingdom is currently in a tier 4 lockdown due to the increasing covid transmission rate.


 Here we can see a daily chart of the euro US dollar pair,  which is by volume the largest traded component  on a weighted basis of the dollar index,  and where we can see CIA Here. 

This is a daily chart of the euro US dollar pair, which by weighted volume is the largest component of the US dollar index. Therefore, it is more likely to be a larger contributing factor to the directional bias of the dollar index.  

Here we have a classic bull run, followed by a period of consolidation, with a continuation bull run, to a high of 1.23, during the beginning of 2021, and where price action has breached the bull run’s resistance line as highlighted and is falling back to just below 1.21 at the time of writing. This is lending itself to the general strength of the US dollar when simultaneously combined with the actions of cable.

And so, although Joe Biden’s covid relief stimulus package would appear to be a pivotal point in the acceleration in the US dollar strength, there are other things to consider, such as multi-month highs, as shown with cable and the Eurodollar pair.  

We also have to factor in the fact that the dollar index failed to breach the 89.00 key level, where the previous high going back to the beginning of the pandemic was 103.00, a hefty grabbing for the dollar, and where traders will always be eying the tops and bottoms of huge moves while looking for turning points.

Traders always expect volatility when there is a change of president, and even more so when there is a change in party, such as in this case where are the outgoing republicans will be replaced by the Democratic party’s polities. The next stage will be waiting to see if the outgoing party’s policies are replaced and, if so, what this might mean for the financial markets.  

Categories
Forex Fundamental Analysis

GBP/NZD Global Macro Analysis – Part 3

GBP/NZD Exogenous Analysis

  1. The UK and New Zealand Current Account Differential

The current account differential between the UK and NZ is the value of the subtraction of the NZ current account balance and the UK’s current account. For the GBP/NZD pair, if the current account differential is positive, it means that the UK has a higher current account balance than NZ. Thus, the price of the GBP/NZD pair will increase. Conversely, if the differential is negative, NZ has a higher current account balance than the UK. Theoretically, this means that traders would be bullish on the NZD; hence, the GBP/NZD pair price would drop.

In Q3 2020, NZ had a current account deficit of $2.48 billion while the UK a deficit of $20.97 billion. This means that the current account differential is -$18.49 billion. Thus, we assign a score of -5.

  1. The interest rate differential between the UK and New Zealand

The interest rate differential for the GBP/NZD pair is the difference between the UK and NZ’s interest rate. Carry traders and investors would direct their money to the currency, which offers higher interest rates. Therefore, if the interest rate differential for the GBP/NZD pair is positive, it means that the UK offers a higher interest rate than NZ. Hence, traders will be bullish on the GBP/NZD pair. Conversely, if the interest rate differential is negative, it means that NZ has a higher interest rate than the UK. This means that traders would be bearish on the GBP/NZD pair.

In 2020, the Reserve Bank of New Zealand cut its official cash rate from 1% to 0.1%, while the BOE cut the interest rate from 0.75% to 0.1%. In this case, the interest rate differential is 0%. Thus, we assign a score of 0.

  1. The differential in GDP growth rate between the UK and New Zealand

This differential shows which economy is expanding faster between the NZ economy and the UK economy. Comparing domestic economies using their GDP growth rates is more effective than using absolute GDP figures since they vary in size.

If the GDP growth rate differential is negative, the NZ economy is growing faster than the UK economy. This would result in a bearish trend for the GBP/NZD pair. Conversely, the pair will have a bullish trend if the differential is positive since it would mean that the UK economy is expanding more than the NZ economy.

The first three quarters of 2020 saw the NZ economy expand by 0.4% and the UK contract by 5.8%. In this case, the GDP growth rate differential is -6.2%. Hence, the score of -4.

Conclusion

Indicator Score Total State Comment
The UK and New Zealand Current Account Differential -5 10 A differential of – $18.49 NZ has a lower current account deficit than the UK.
The interest rate differential between the UK and New Zealand 0 10 0.00% The 0% interest rate differential is expected to persist in the short-term. That’s because neither the RBNZ and the BOE have scheduled changes in the monetary policy
The differential in GDP growth rate between the UK and New Zealand -4 10 -6.20% New Zealand’s economy expanded by 0.4% in the first three quarters of 2020, while the UK contracted by 5.8%
TOTAL SCORE -9

GBP/NZD exogenous factors have a cumulative score of -9. It means we should expect a continued downtrend in the pair for the short term.

In the above image, we can see that this pair’s weekly chart trading below the 200-period MA for the first time since August 2019. Cheers.