Introduction
In this analysis, we will analyze endogenous factors that influence both the UK and New Zealand economies. The analysis will also include exogenous factors that impact the exchange rate between the GBP and the NZD.
Ranking Scale
We’ll rank the endogenous and exogenous factors on a scale from -10 to +10.
The score of the endogenous factors will be determined from correlation analysis between the GDP growth rate. If the score is negative, the endogenous factor had a devaluing effect on the domestic currency. Conversely, if the score is positive, the factor led to the appreciation of the domestic currency.
Similarly, we’ll do a correlation analysis between the exogenous factors and the GBP/NZD exchange rate. If the correlation is negative, the factor results in a drop in the exchange rate. If positive, then the exogenous factor increases the exchange rate.
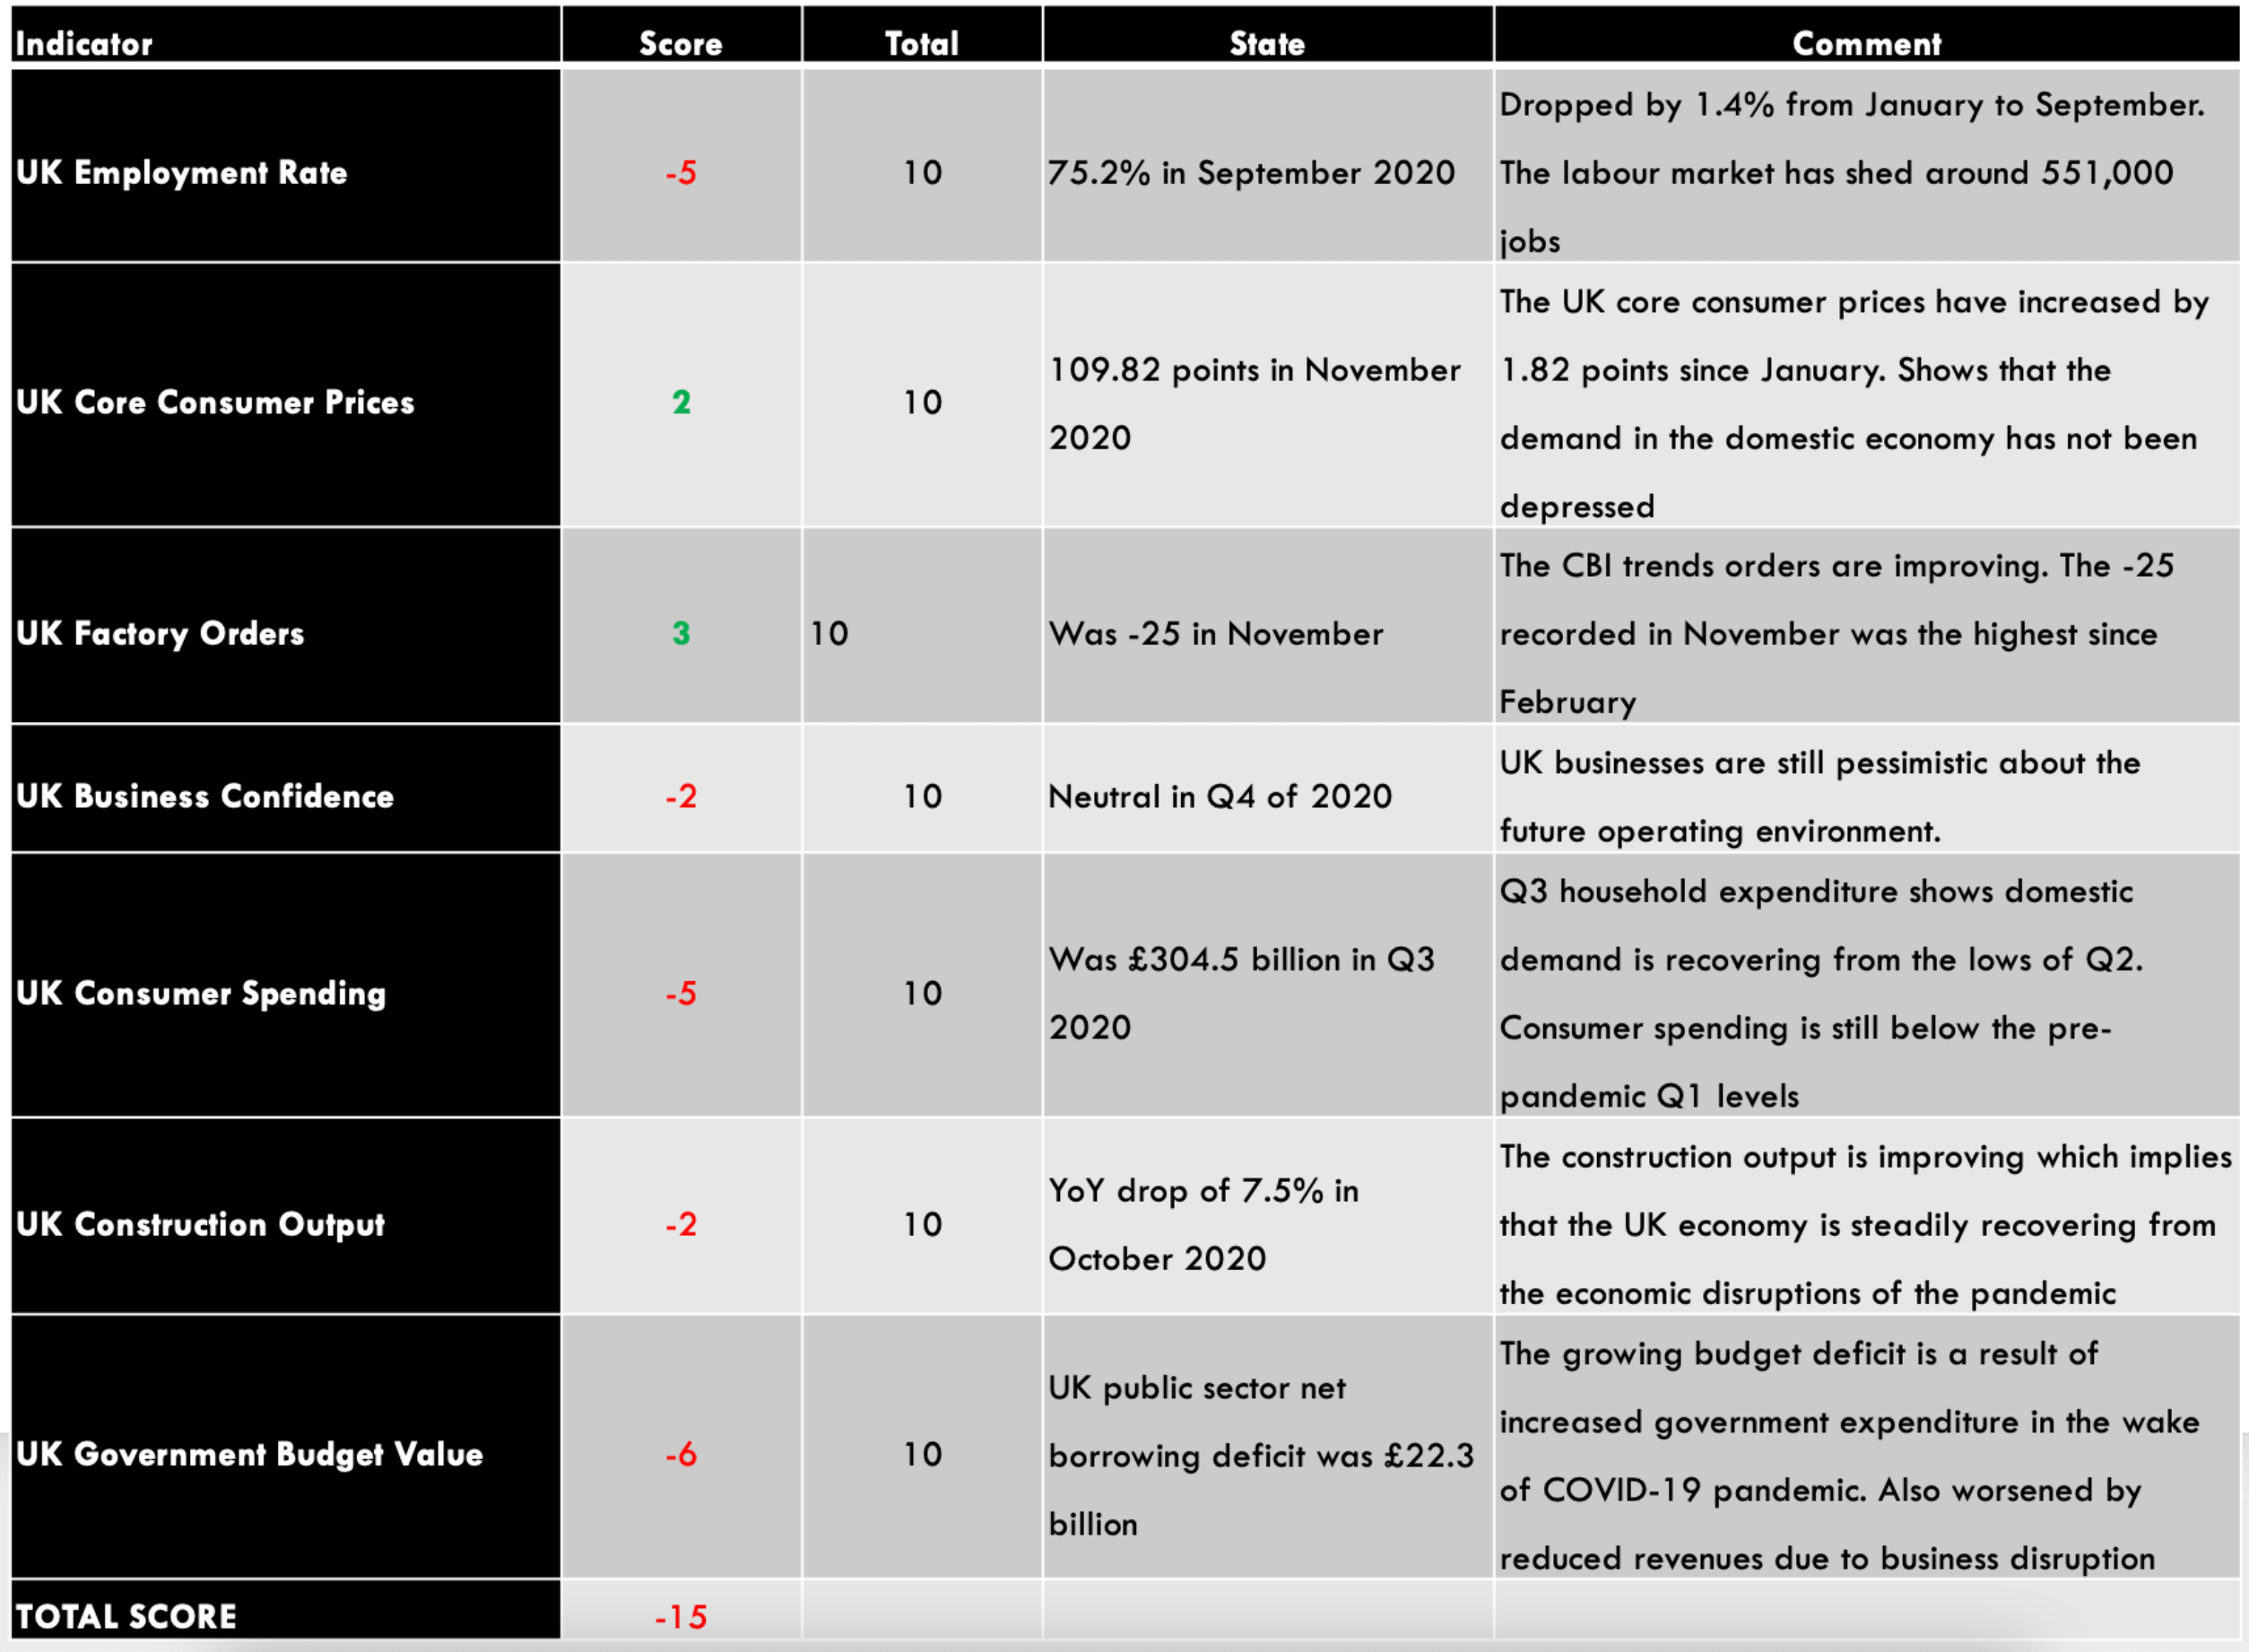
Summary – GBP Endogenous Analysis
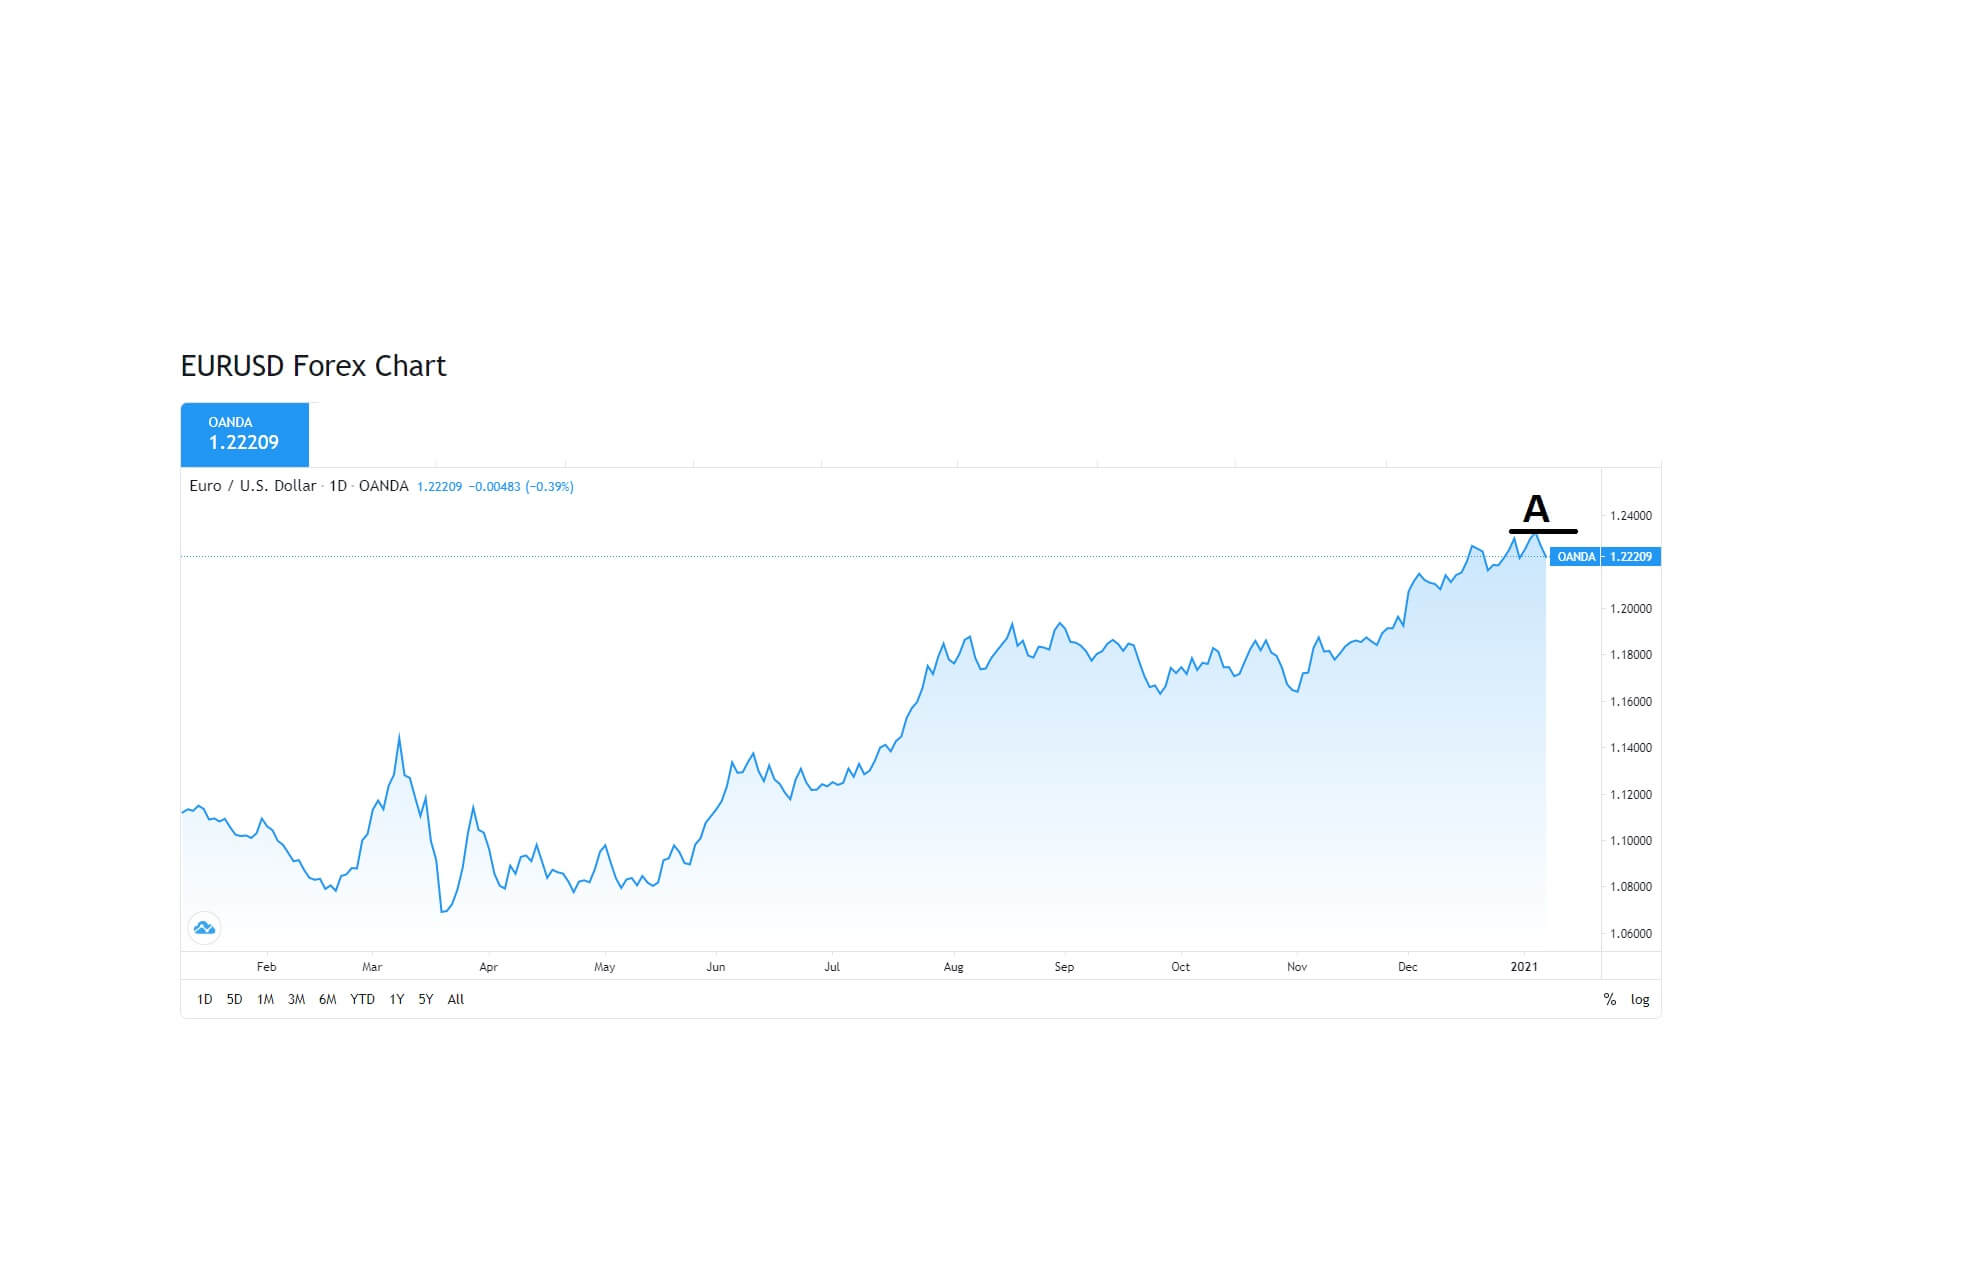
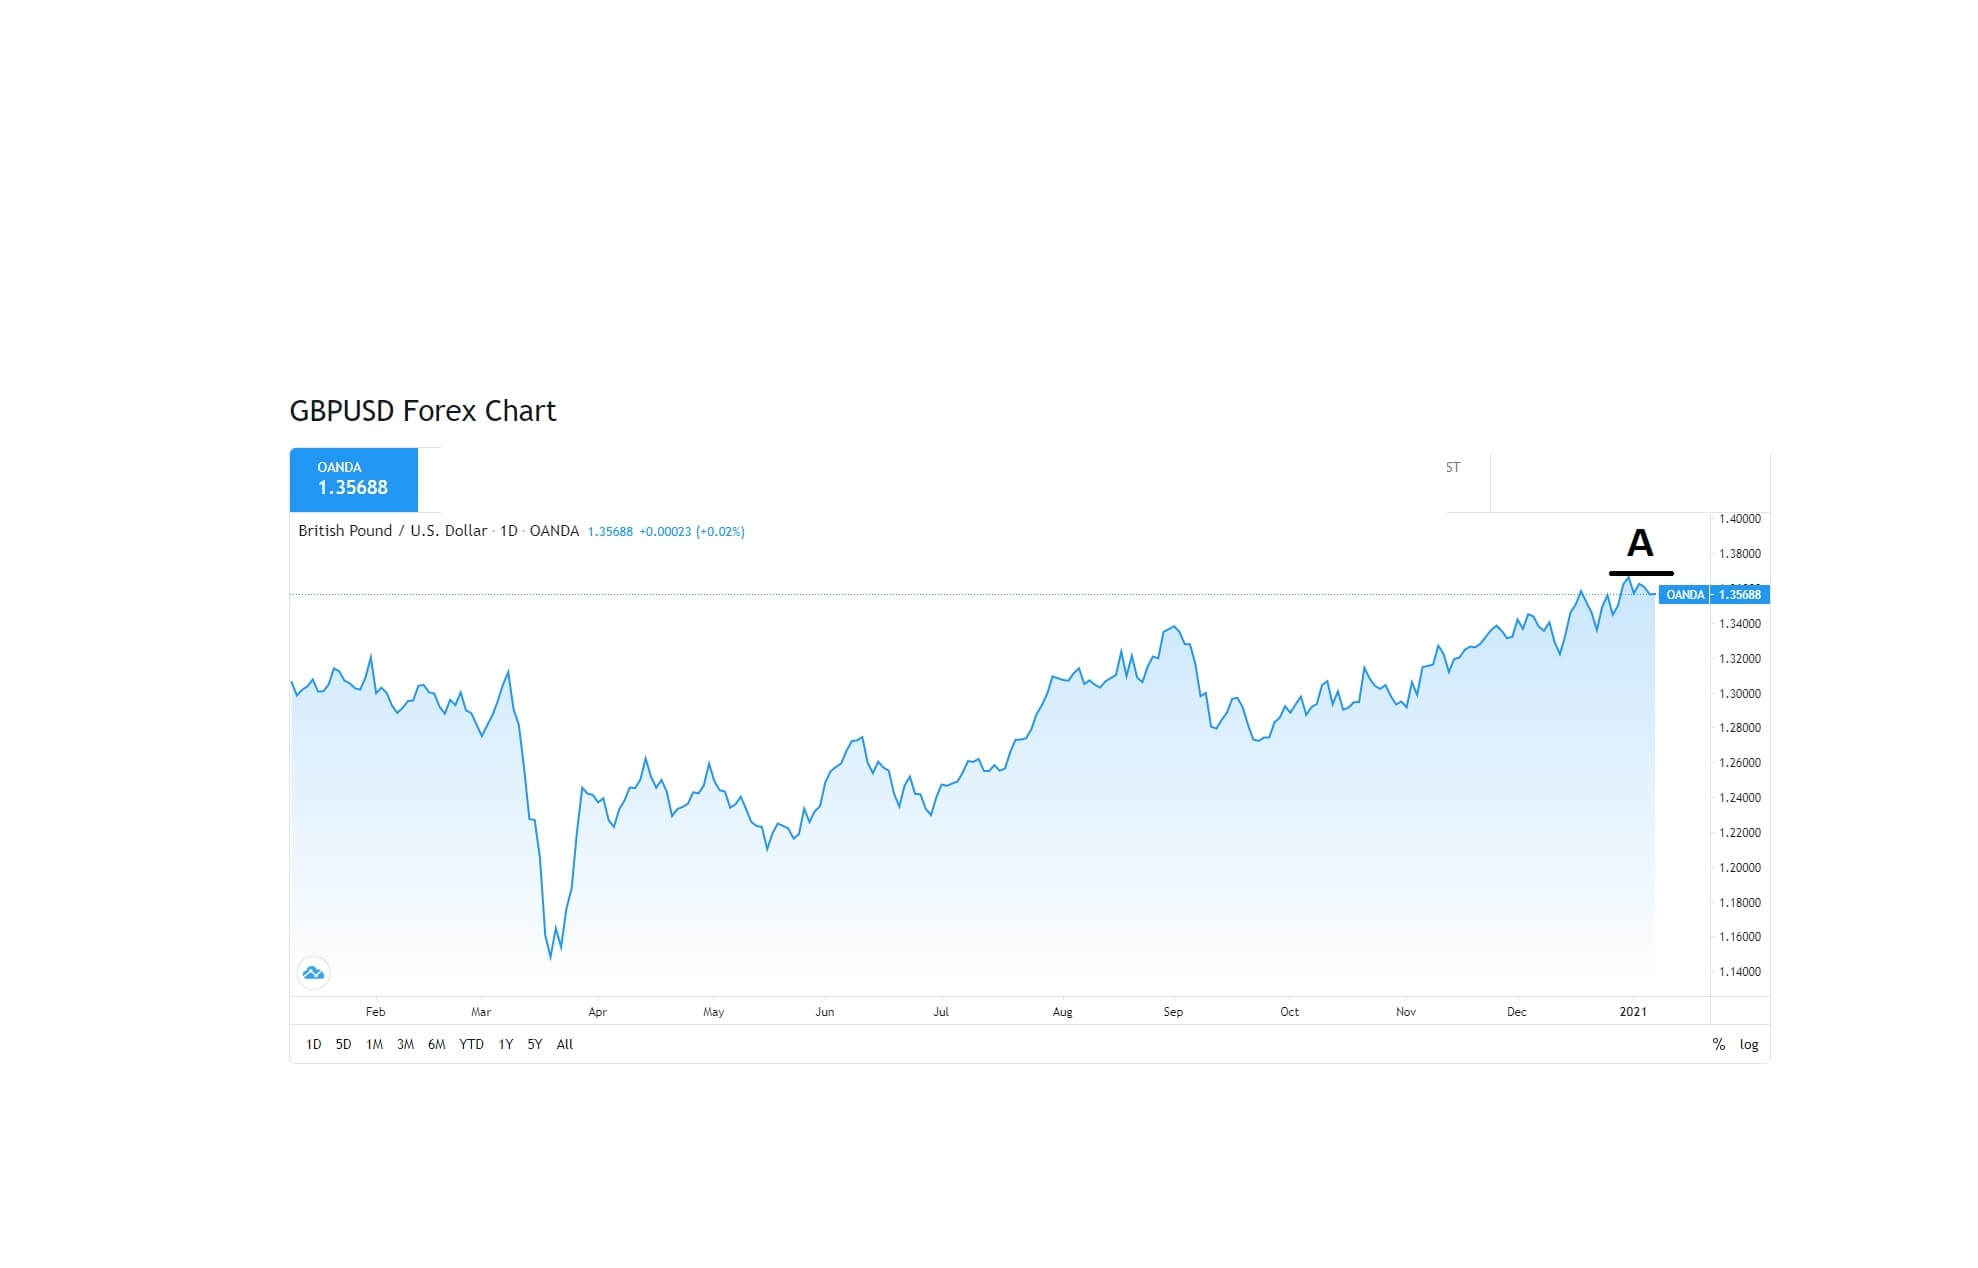
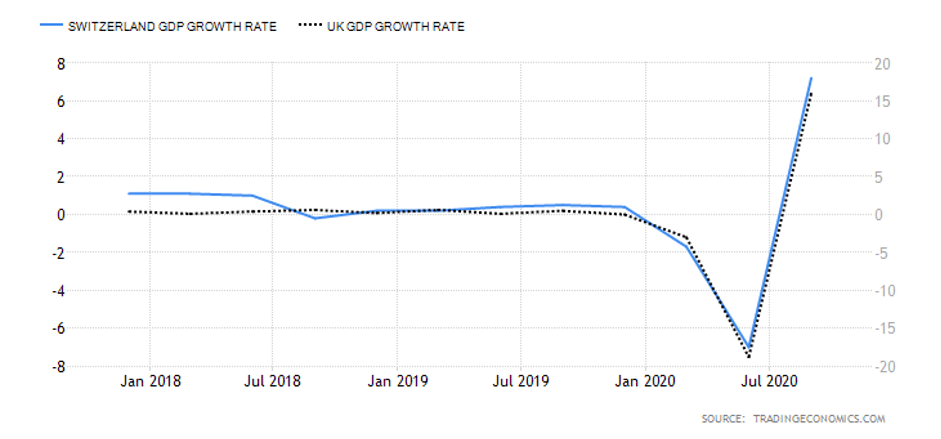
A -15 score on Pound’s Endogenous Analysis indicates that this currency has depreciated since the beginning of 2020.
Summary – NZD Endogenous Analysis
A positive 5 indicates that the New Zealand dollar has appreciated since the beginning of this year.
| Indicator | Score | Total | State | Comment |
| New Zealand Employment Rate | -7 | 10 | 66.4% in Q3 2020 | The NZ labor market is yet to recover from the economic disruptions of the pandemic |
| New Zealand Core Consumer Prices | 1 | 10 | 1054 points in Q3 2020 | From Q1 to Q3, inflation has increased by 1 point |
| New Zealand Industrial Production | 5 | 10 | A 3.1% increase in Q3 | The NZ industrial sector is rebounding from a 12.1% drop in Q2. |
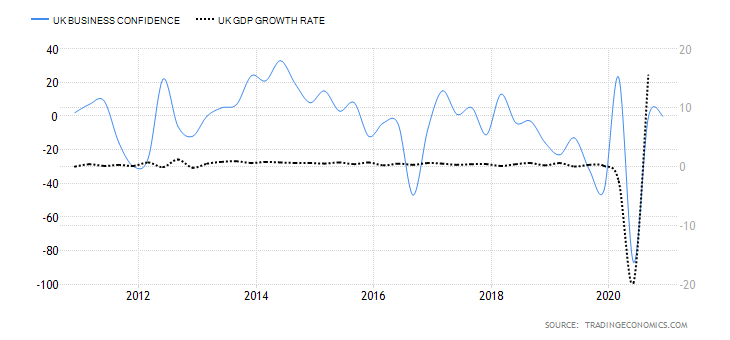
| New Zealand Business Confidence | 7 | 10 | Was 9.4 in November | November showed the first positive reading in ANZ business confidence since August 2018 |
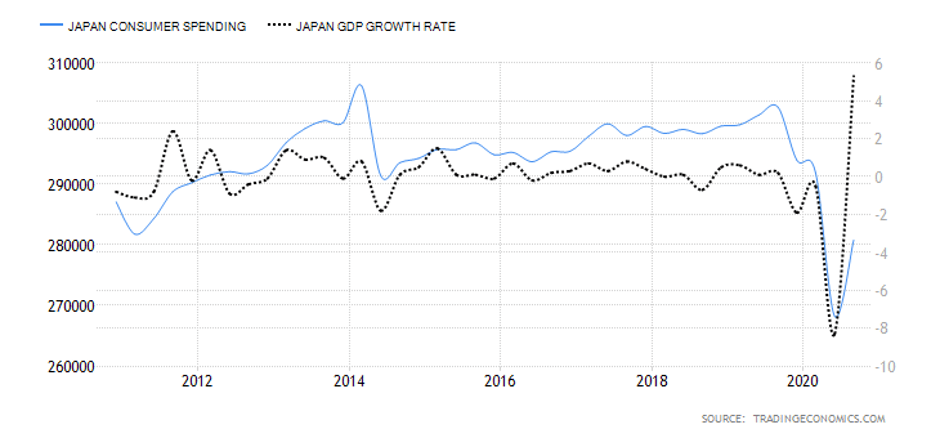
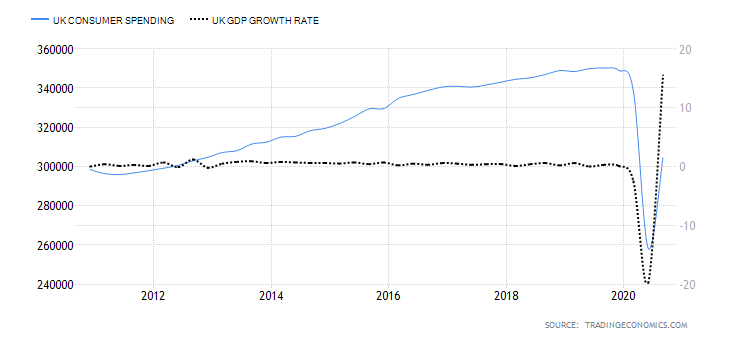
| New Zealand Consumer Spending | 5 | 10 | Q3 spending was 41.335 billion NZD. | Q3 consumer spending was the highest recorded in 2020. This shows that the domestic demand has recovered beyond the pre-pandemic period |
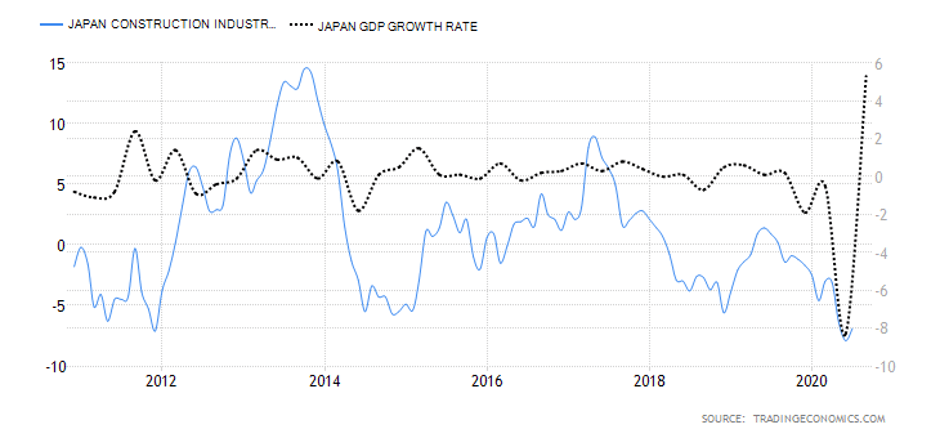
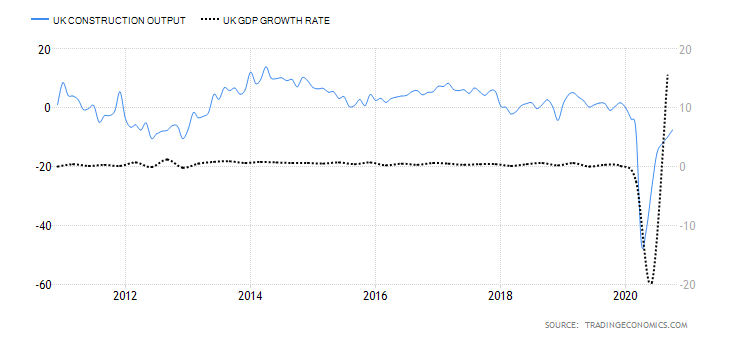
| New Zealand Construction Output | -4 | 10 | Q2 output dropped by 24.2% | The worst decline in construction output in about 18 years. It’s bound to increase as COVID-19 restrictions ease |
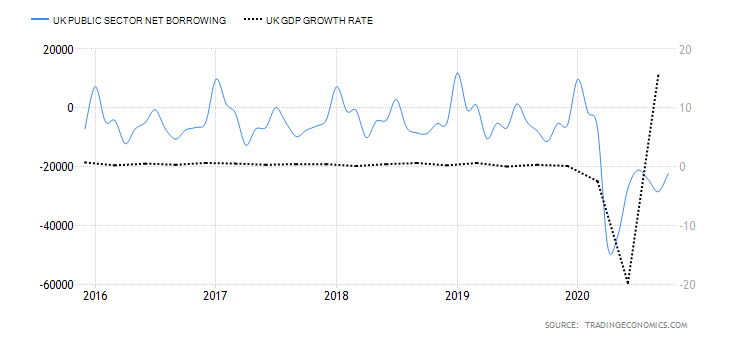
| New Zealand Government Budget Value | -2 | 10 | 2020 projected deficit of 4.5 billion NZD | This would be a drop from a surplus of 7.5 billion NZD in 2019. Attributed to the increase in government spending during the pandemic |
| TOTAL SCORE | 5 |
- New Zealand Employment Rate
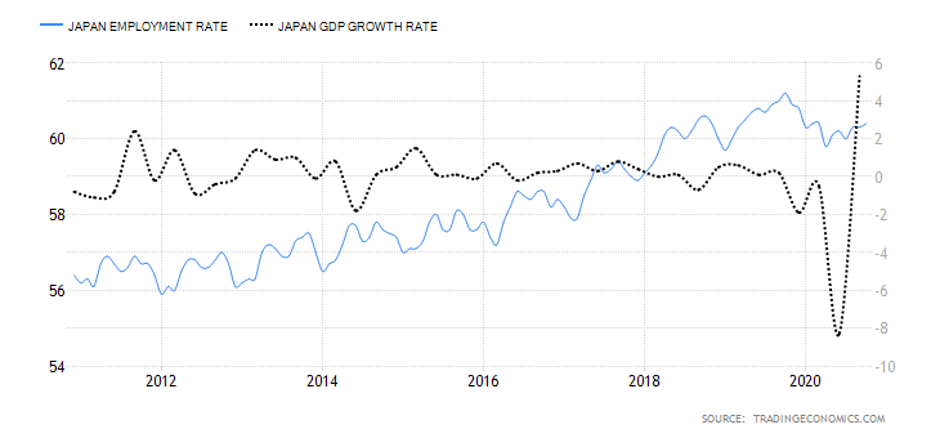
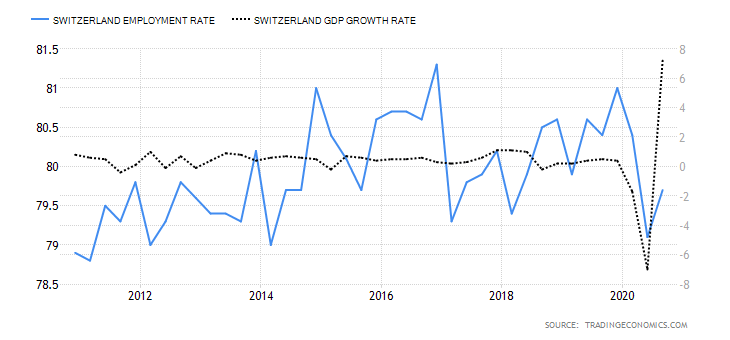
The employment rate shows the growth in New Zealand’s labor market. The change in the labor market shows how the economy is performing – especially in the coronavirus pandemic. The labor market shows if the economy is churning out new jobs or if jobs are lost. Thus, the growth of the labor market is a leading indicator of economic growth.
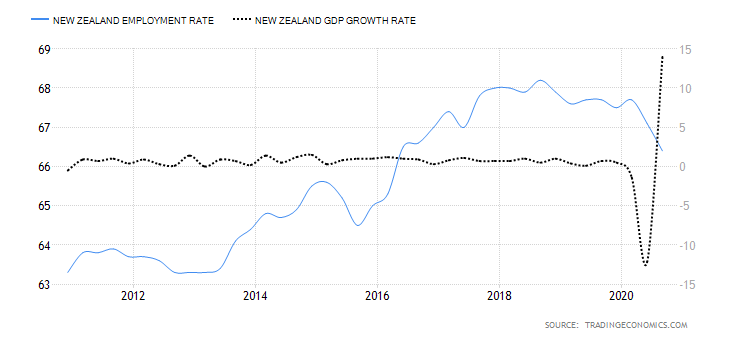
In Q3 2020, New Zealand’s employment rate dropped to 66.4% from 67.1% in Q2 and 67.7% in Q1. This shows that the labor market is yet to recover from the economic shocks of the pandemic. The New Zealand employment rate has a score of -7.
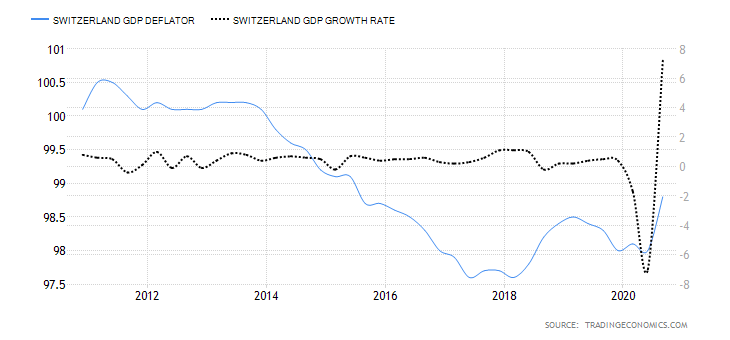
- New Zealand Core Consumer Prices
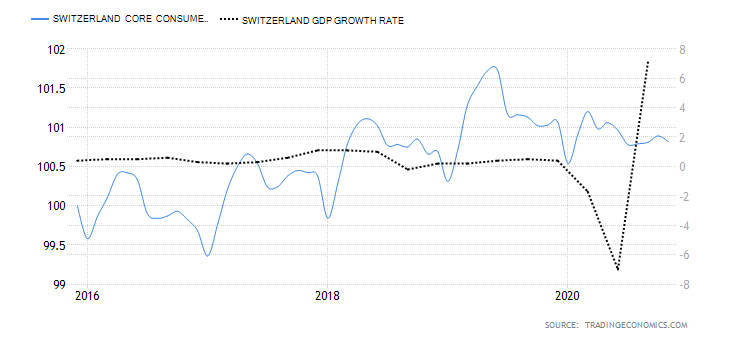
This indicator samples the price changes in a basket of the most commonly purchased goods and services by households. The price changes represent the rate of inflation in the overall economy. Note that the computation of the core consumer prices excludes goods and services whose prices tend to be volatile. It helps avoid seasonal distortions in the index.
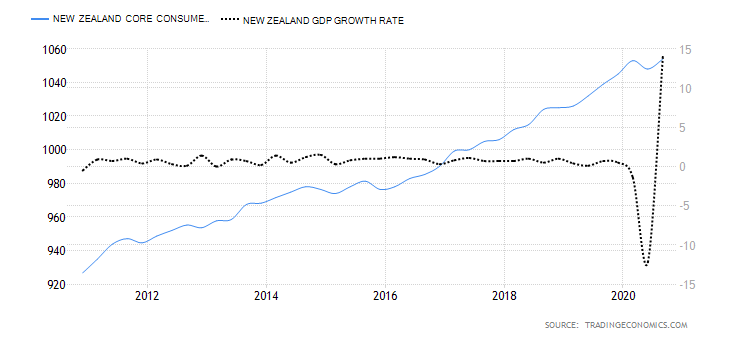
In Q3 of 2020, the core consumer prices in New Zealand rose to 1054 points from 1048 in Q2. The index had only increased by 1 point in 2020. Thus, we assign a score of 1.
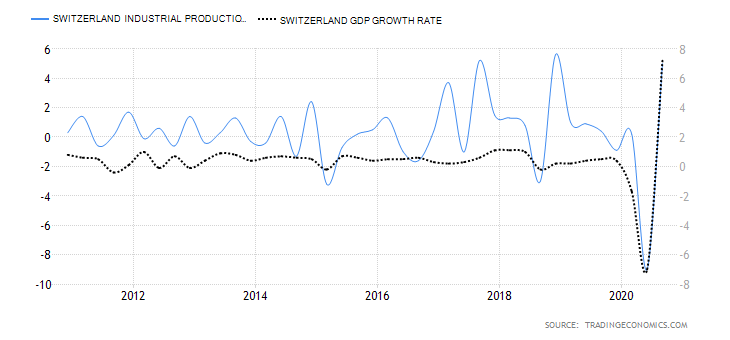
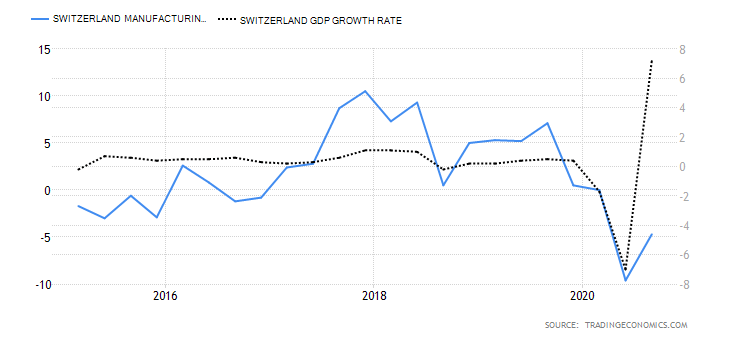
- New Zealand Industrial Production
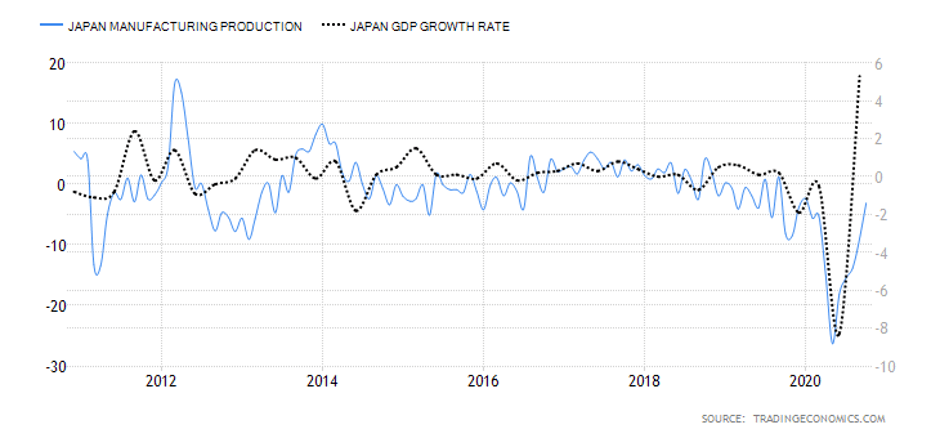
Industrial production in New Zealand refers to the YoY change in total manufacturing sales. It measures the YoY change in sales volume in the manufacturing sector. A survey of 13 industries across the manufacturing sector is surveyed to derive the YoY manufacturing sales data for the whole sector. Some of these industries include; petroleum and coal products, metal products, machinery, equipment and furniture, and food and beverage. Naturally, expansion in industrial production corresponds to the expansion of the economy.
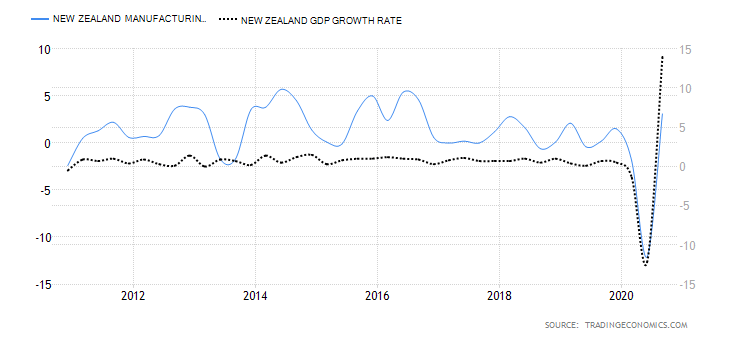
New Zealand manufacturing sales rose by 3.1% in Q3 2020 from a drop of 12.1%. This is the largest YoY increase in manufacturing sales in three years. It shows that the economy is rebounding. We assign a score of 5.
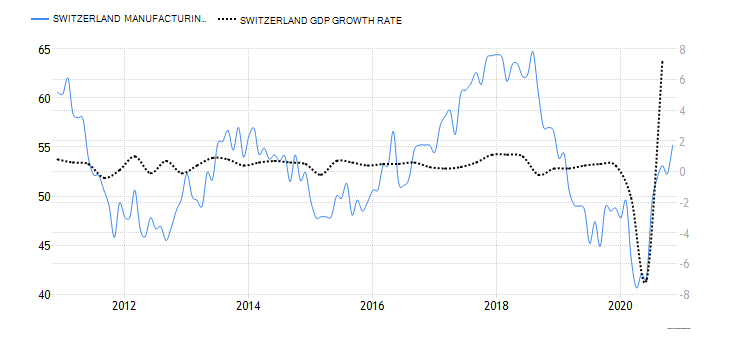
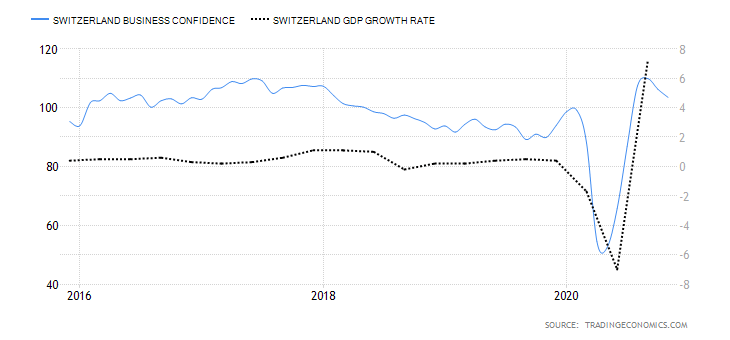
- New Zealand Business Confidence
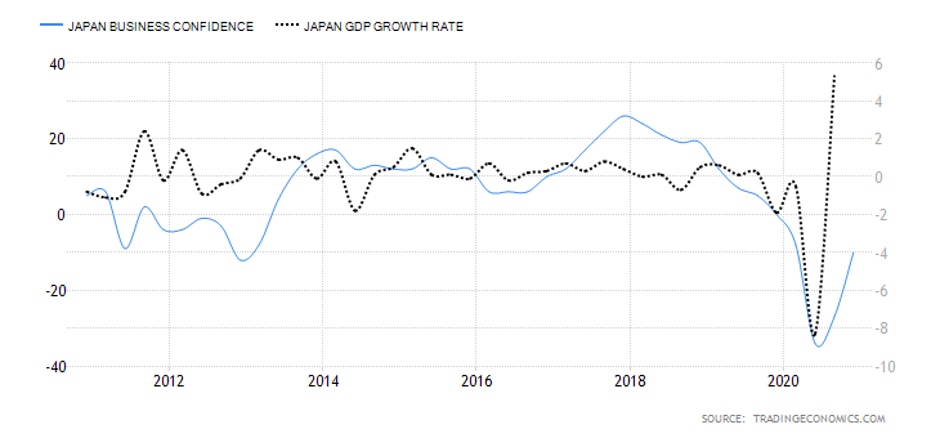
NZ business confidence is a survey of about 700 businesses. They are polled to establish their expectations about the future business operating environment and economic growth in general. Some aspects surveyed include; activity outlook, employment prospects, capacity utilization, and investment decisions.
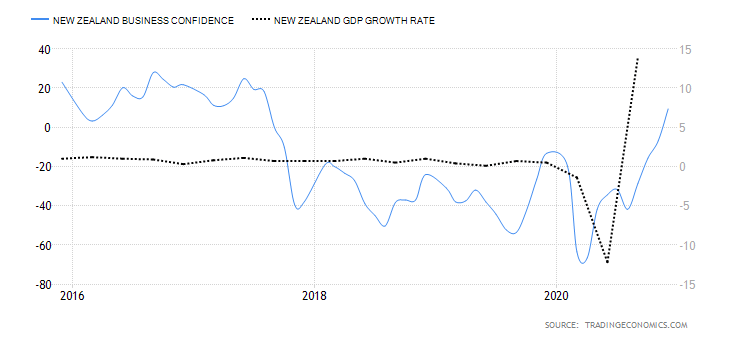
In December 2020, the NZ ANZ business confidence rose to 9.4 from -6.9 in November. This shows an increased optimism in NZ businesses since it is the first positive reading since August 2018. Thus, we assign a score of 7.
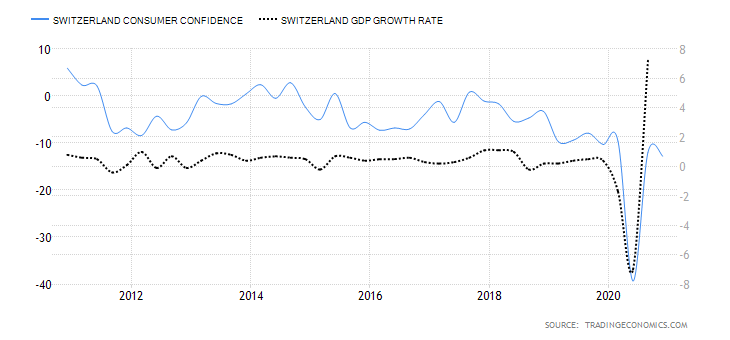
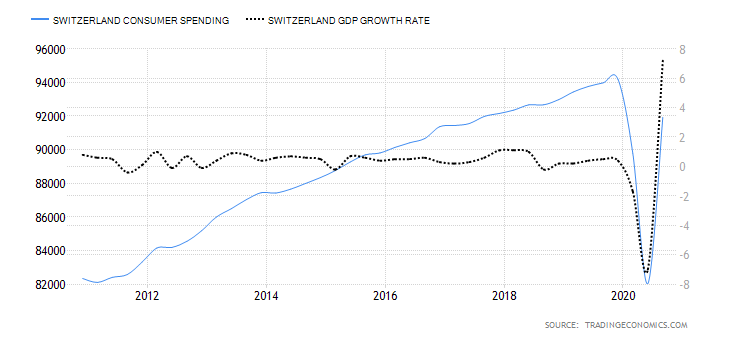
- New Zealand Consumer Spending
This measures the value of the quarterly consumer expenditure in NZ. Changes in consumer expenditure go hand in hand with domestic demand changes in the economy, which drive GDP growth.

In Q3 2020, the NZ consumer spending increased to NZD 41.335 billion from NZD 35.197 billion in Q2. More so, the Q3 consumer spending is more than the NZD 40.04 billion recorded in Q1. Consequently, the NZ consumer spending has a score of 5.
- New Zealand Construction Output
This indicator shows the overall change in the value of all construction work done by contractors in NZ. It compares the YoY quarterly change, which helps to show if the economy is expanding or contracting.
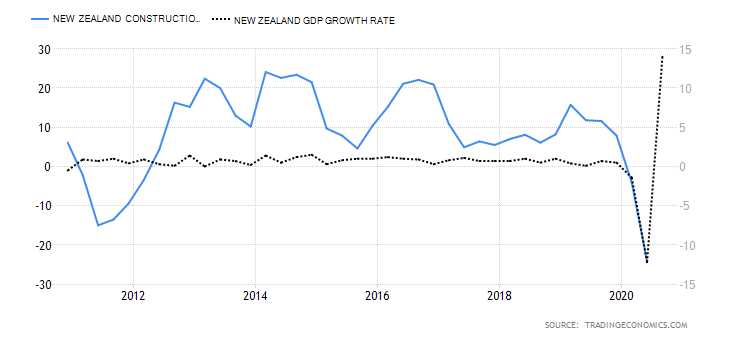
In Q2 2020, the NZ construction output dropped by 24.2% compared to the 4.1% drop in Q2. This is the worst drop in over 18 years. Thus, we assign a score of -4.
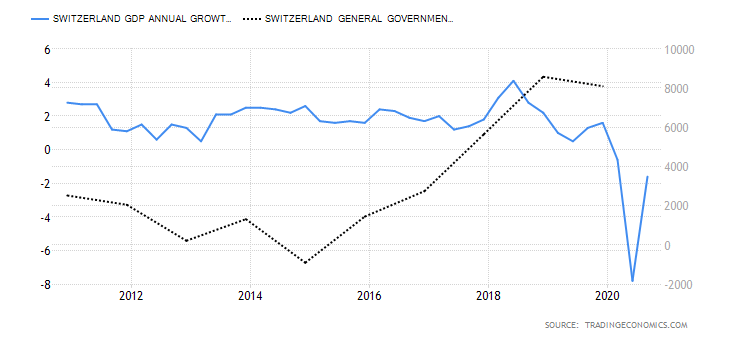
- New Zealand Government Budget Value
This is the difference between the revenues that the NZ government collects and the amount it spends. Deficits arise if the revenues are less than expenditures, while surplus occurs when the revenues exceed expenditure.

In 2019, the NZ government had a budget surplus of NZD 7.5 billion. In 2020, it was projected that the budget would hit a deficit of NZD 4.5 billion. This is due to increased government expenditure to alleviate the pandemic’s economic shocks while revenues have been depressed due to nationwide shutdowns. Thus, we assign a score of -2.
For the exogenous analysis of both of these currencies, you can check our very next article. In case of any queries, let us know in the comments below. Cheers.


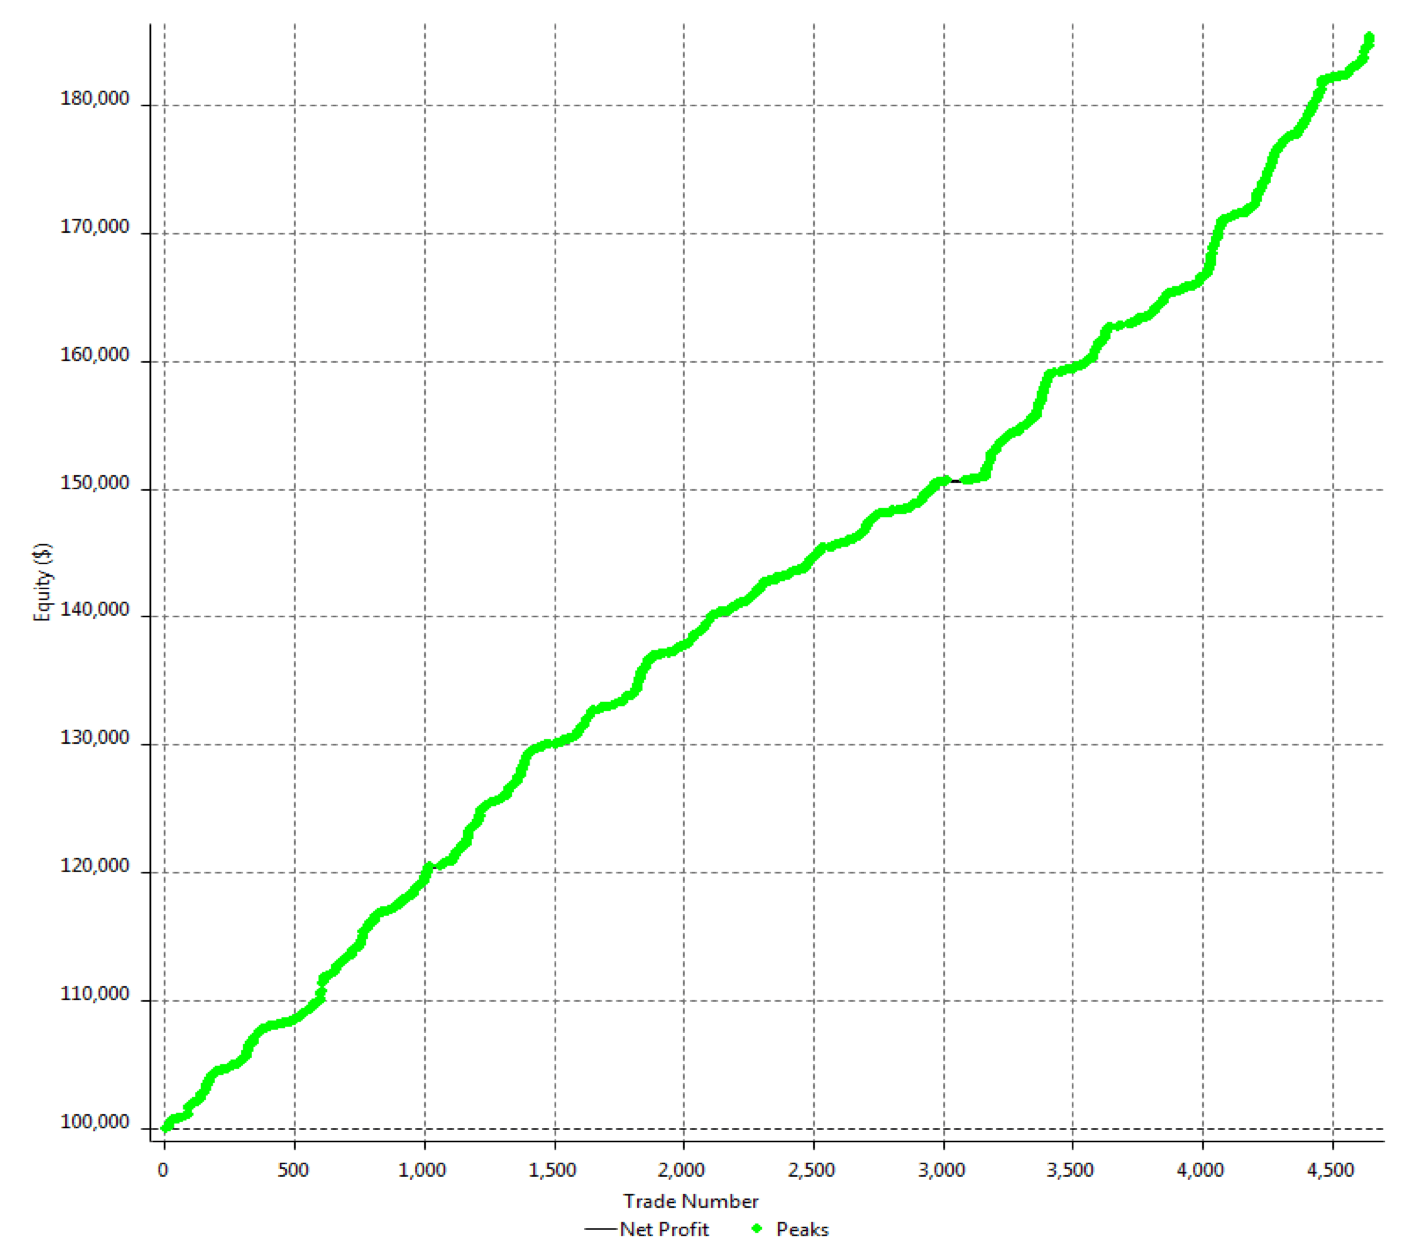

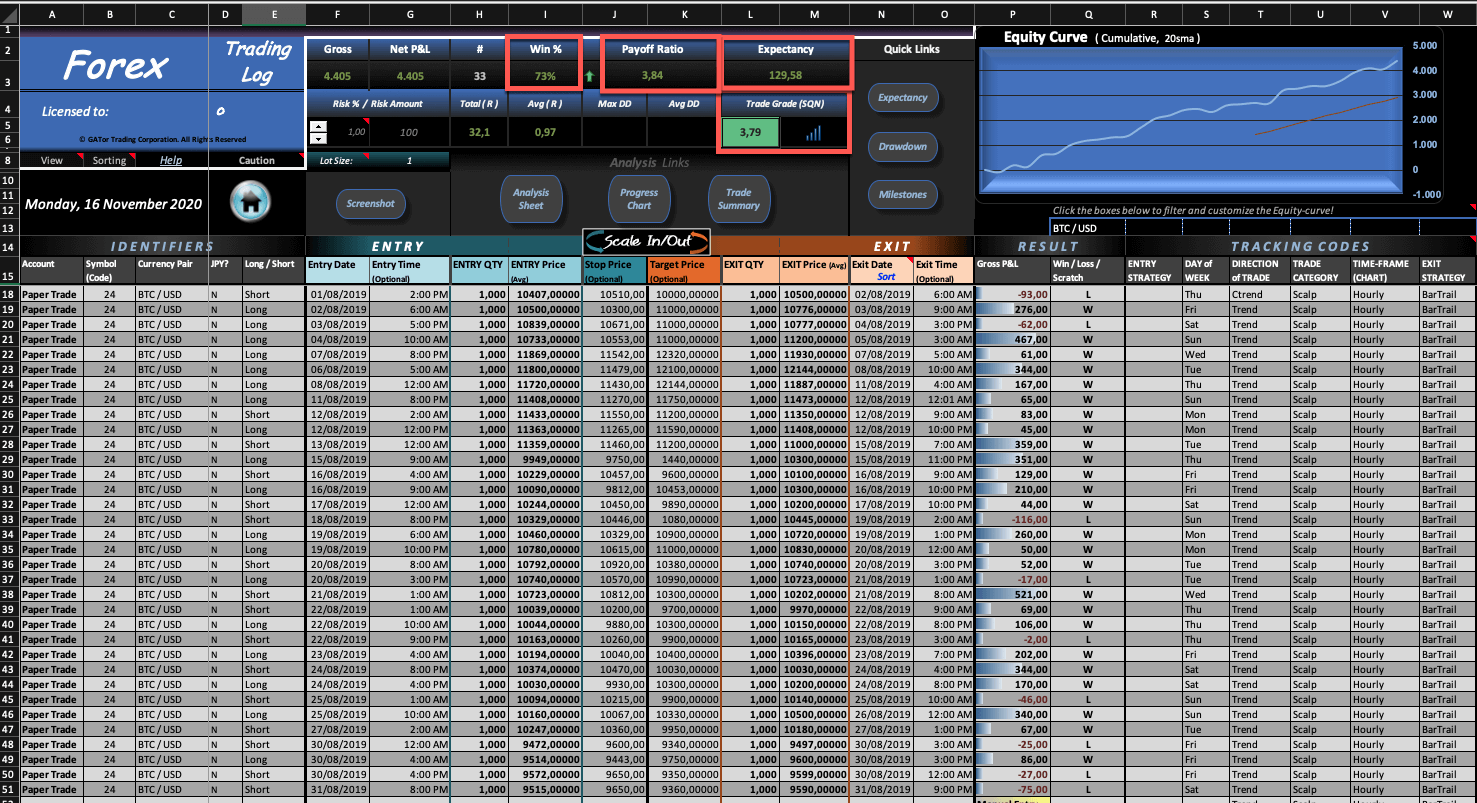
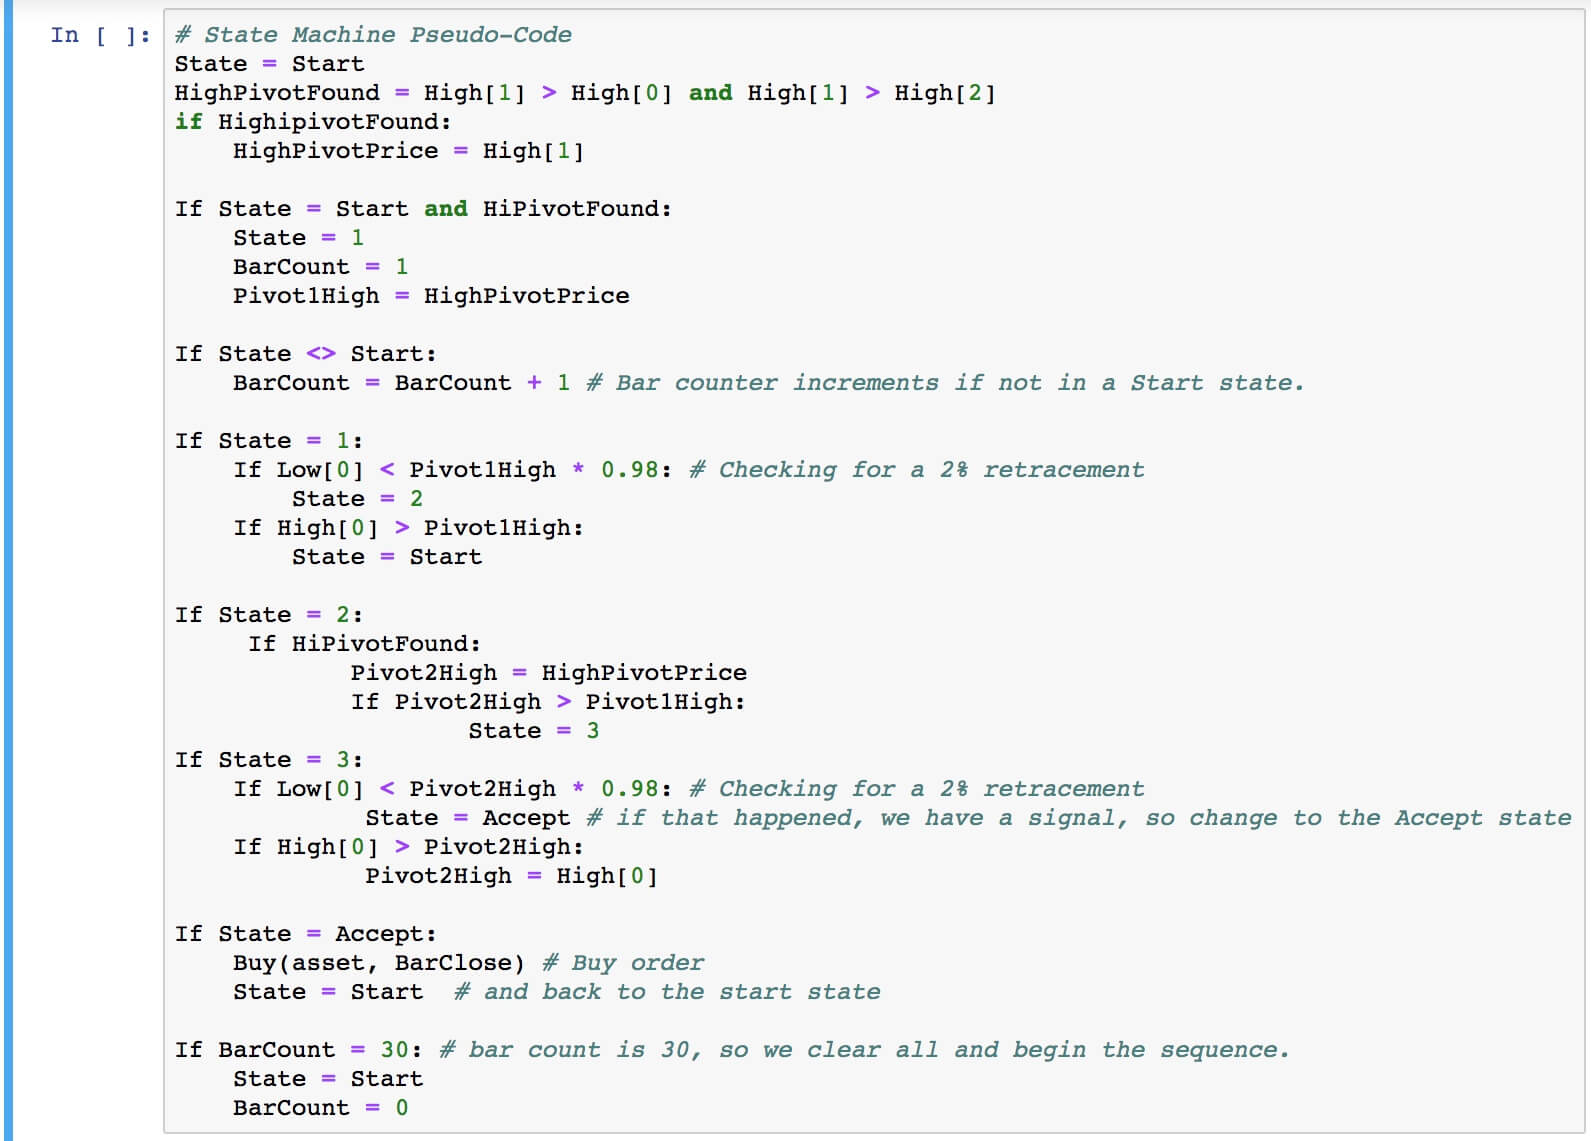
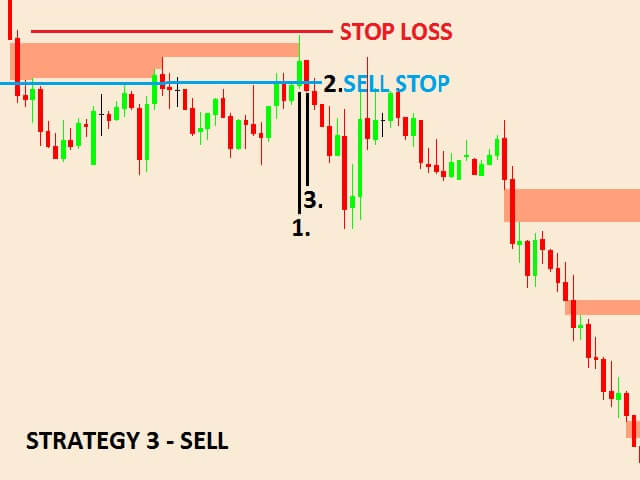
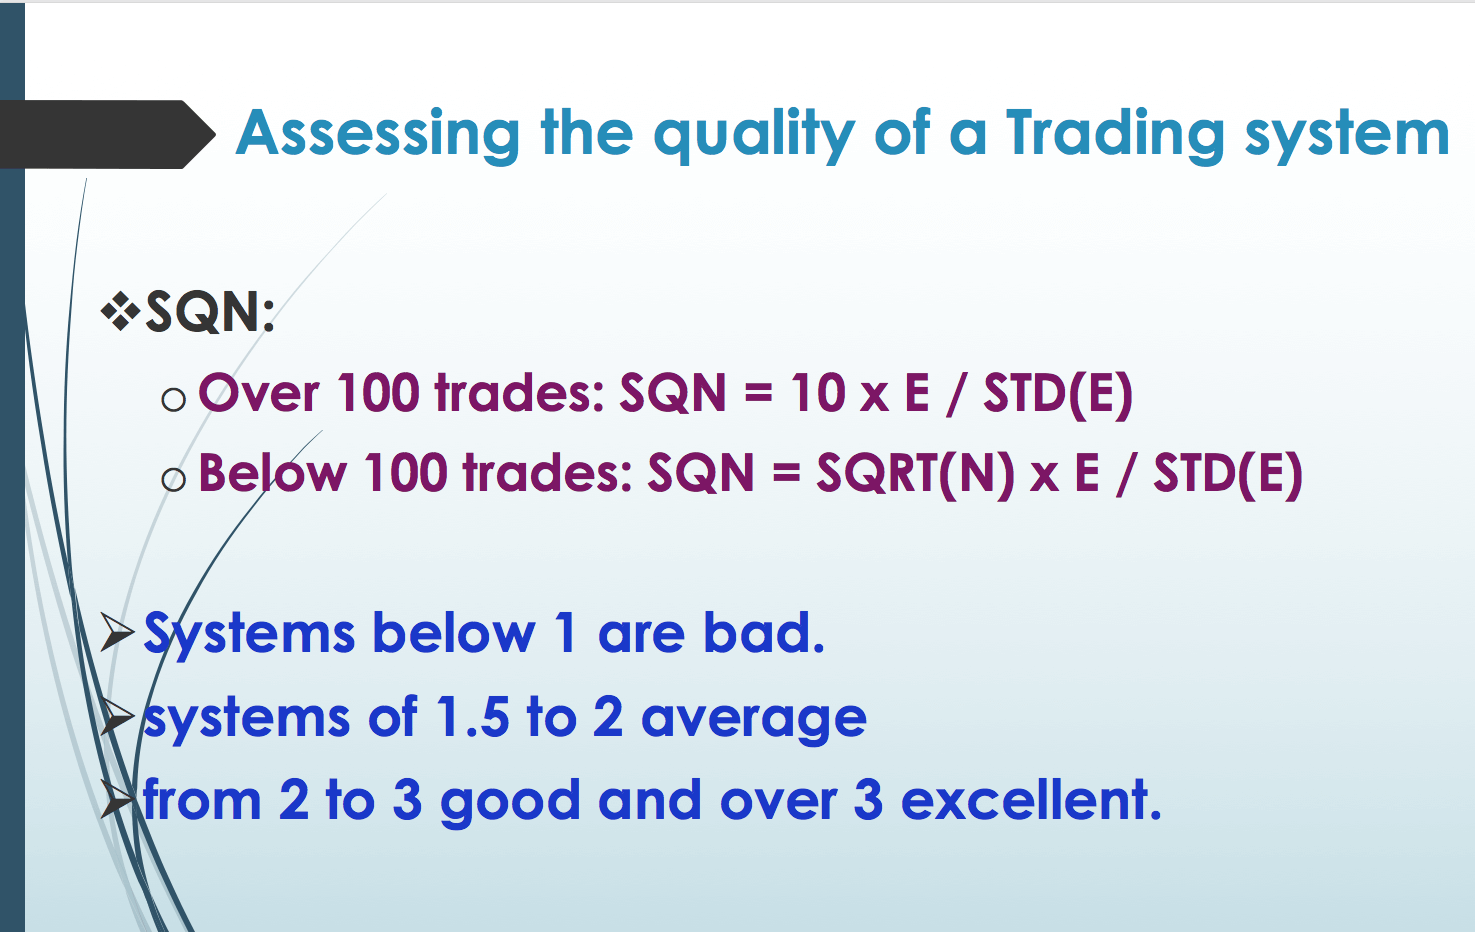
 The first step to see if the idea has merit is to test it in a historical sample under the market conditions it was supposed to operate. Of course, a trading idea is almost always referring to a market entry, as the concept is supposed to time the market. This entry is usually combined with a stop-loss and a
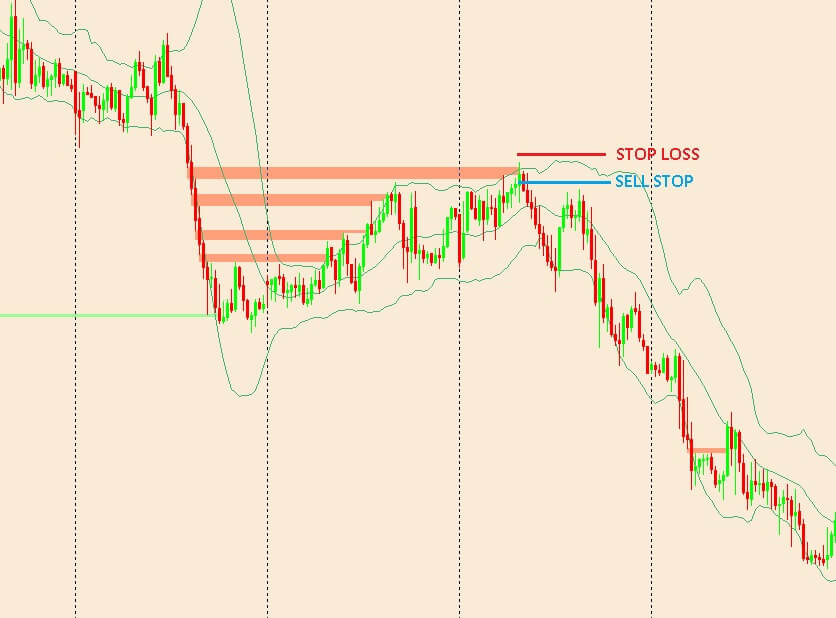
 After 100 backtested trades, the developer has enough information to detect the basic mistakes of the strategy. Maybe the entry has a large lag that hurts profits, or, worse, it is too early, thus triggering the stop-loss too often.


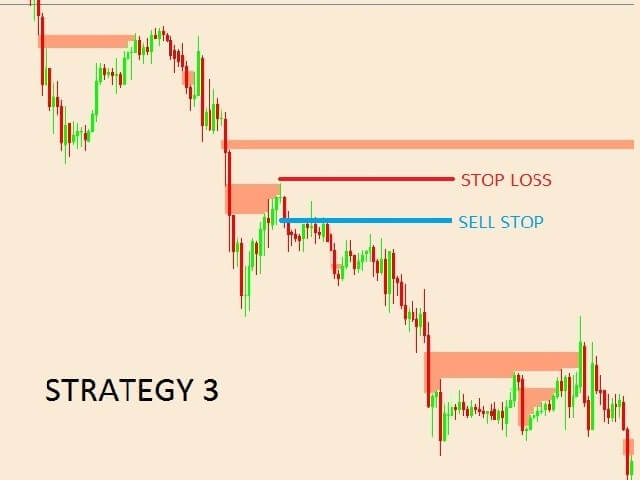
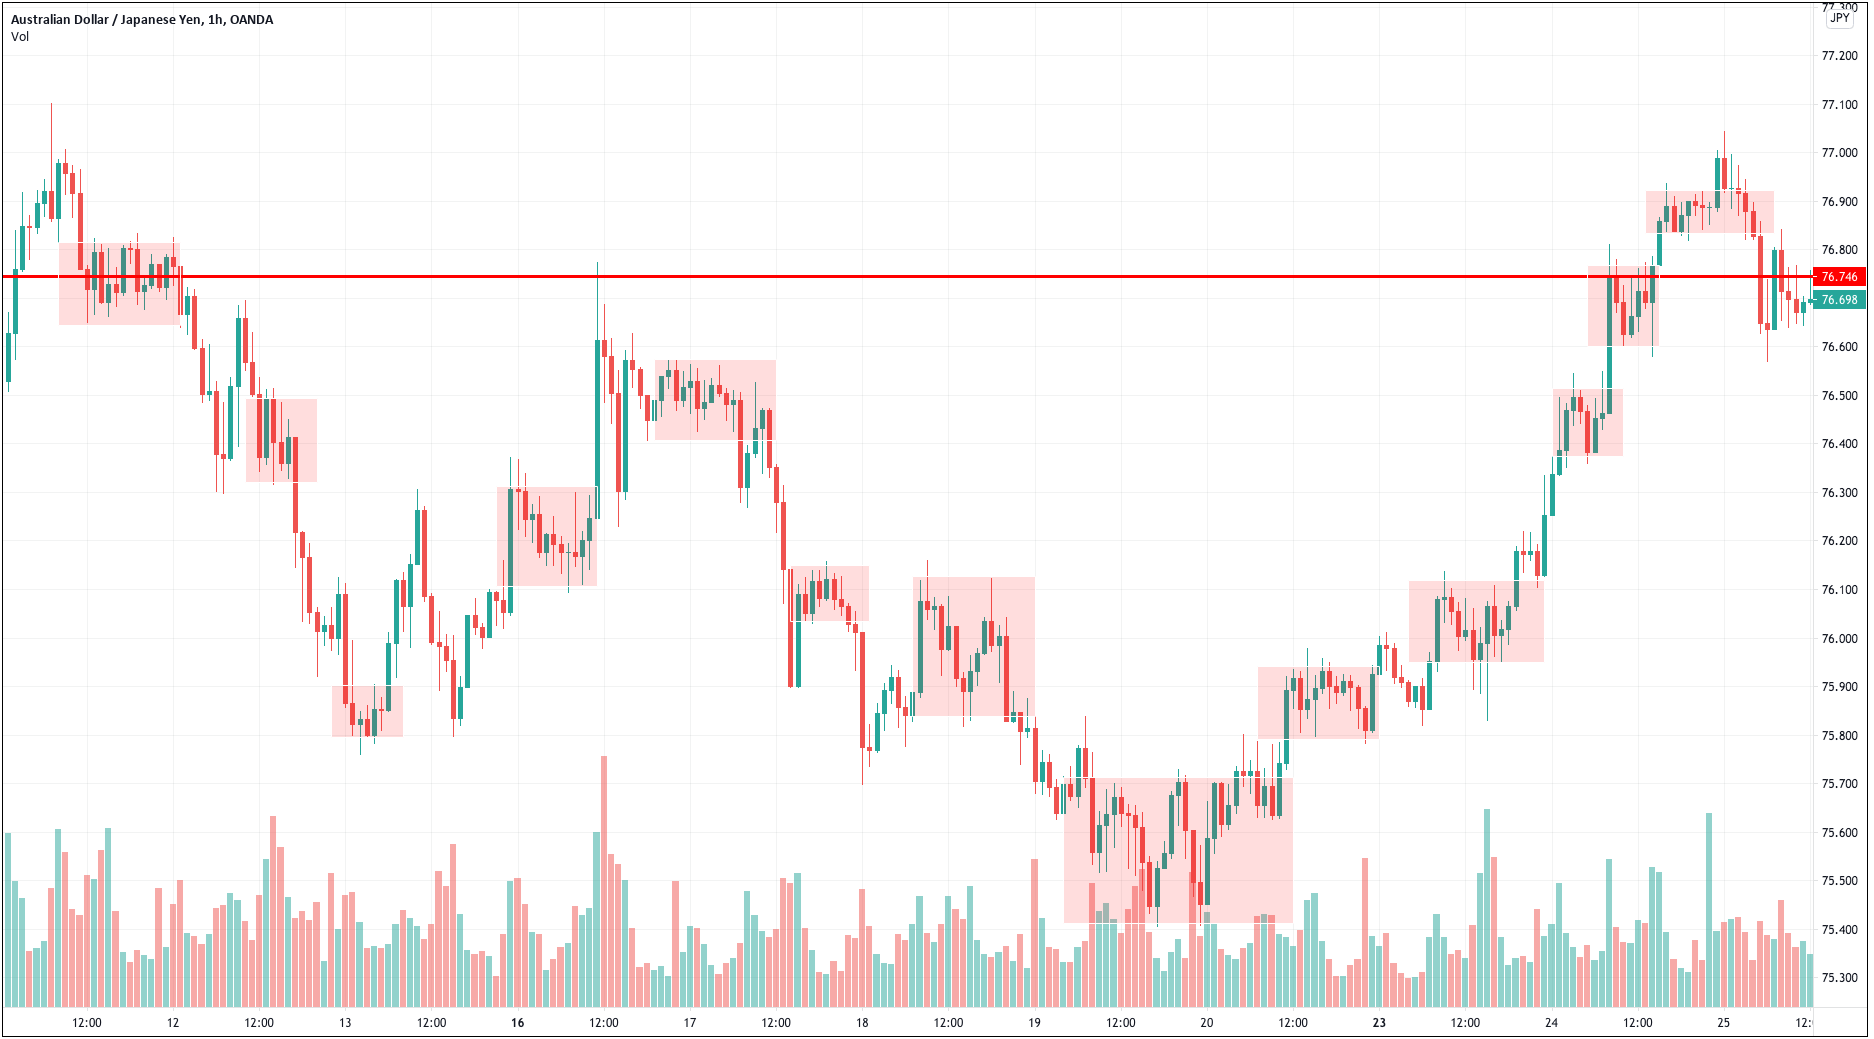
 Traders, especially novice traders, get emotional and lose money because their emotions interfere and stop making rational decisions in the battle’s heat. Thus, the first thing to avoid is
  The rubber band idea describes the price as if it was a rubber band or spring. When it moves far away from equilibrium, we expect the force to pull it to its center to increase and eventually drive it back to equilibrium.
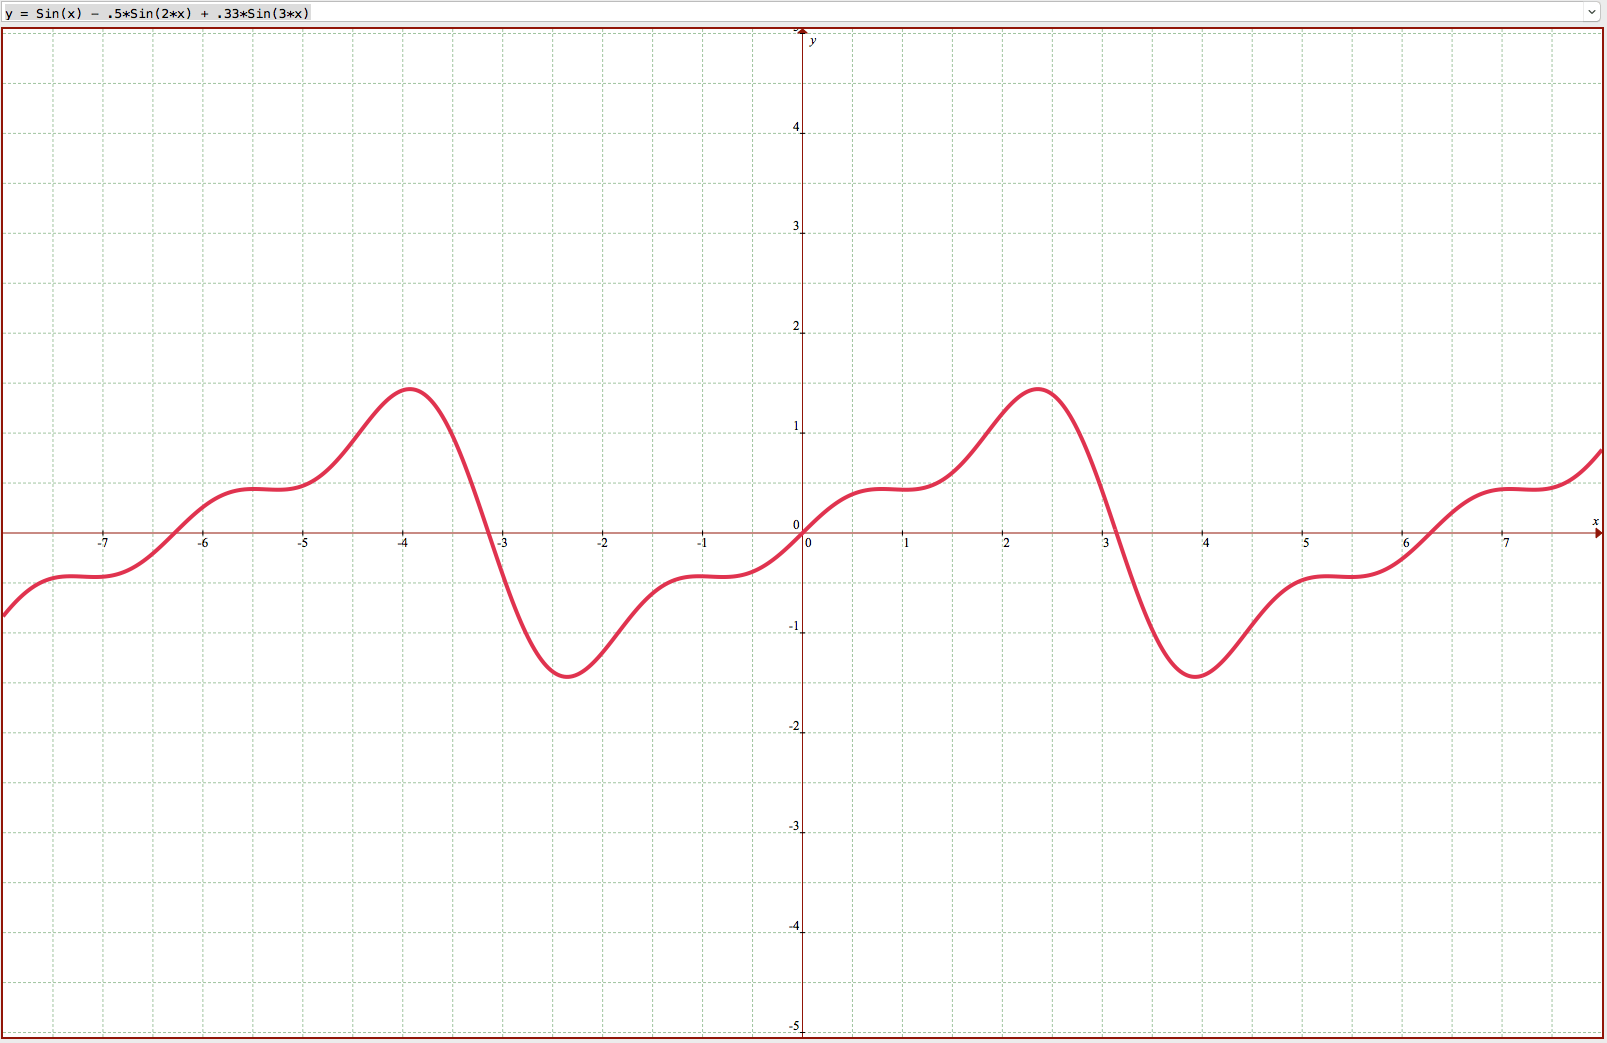 fferent waves are in sync, and chaotic moves occur when waves desync.


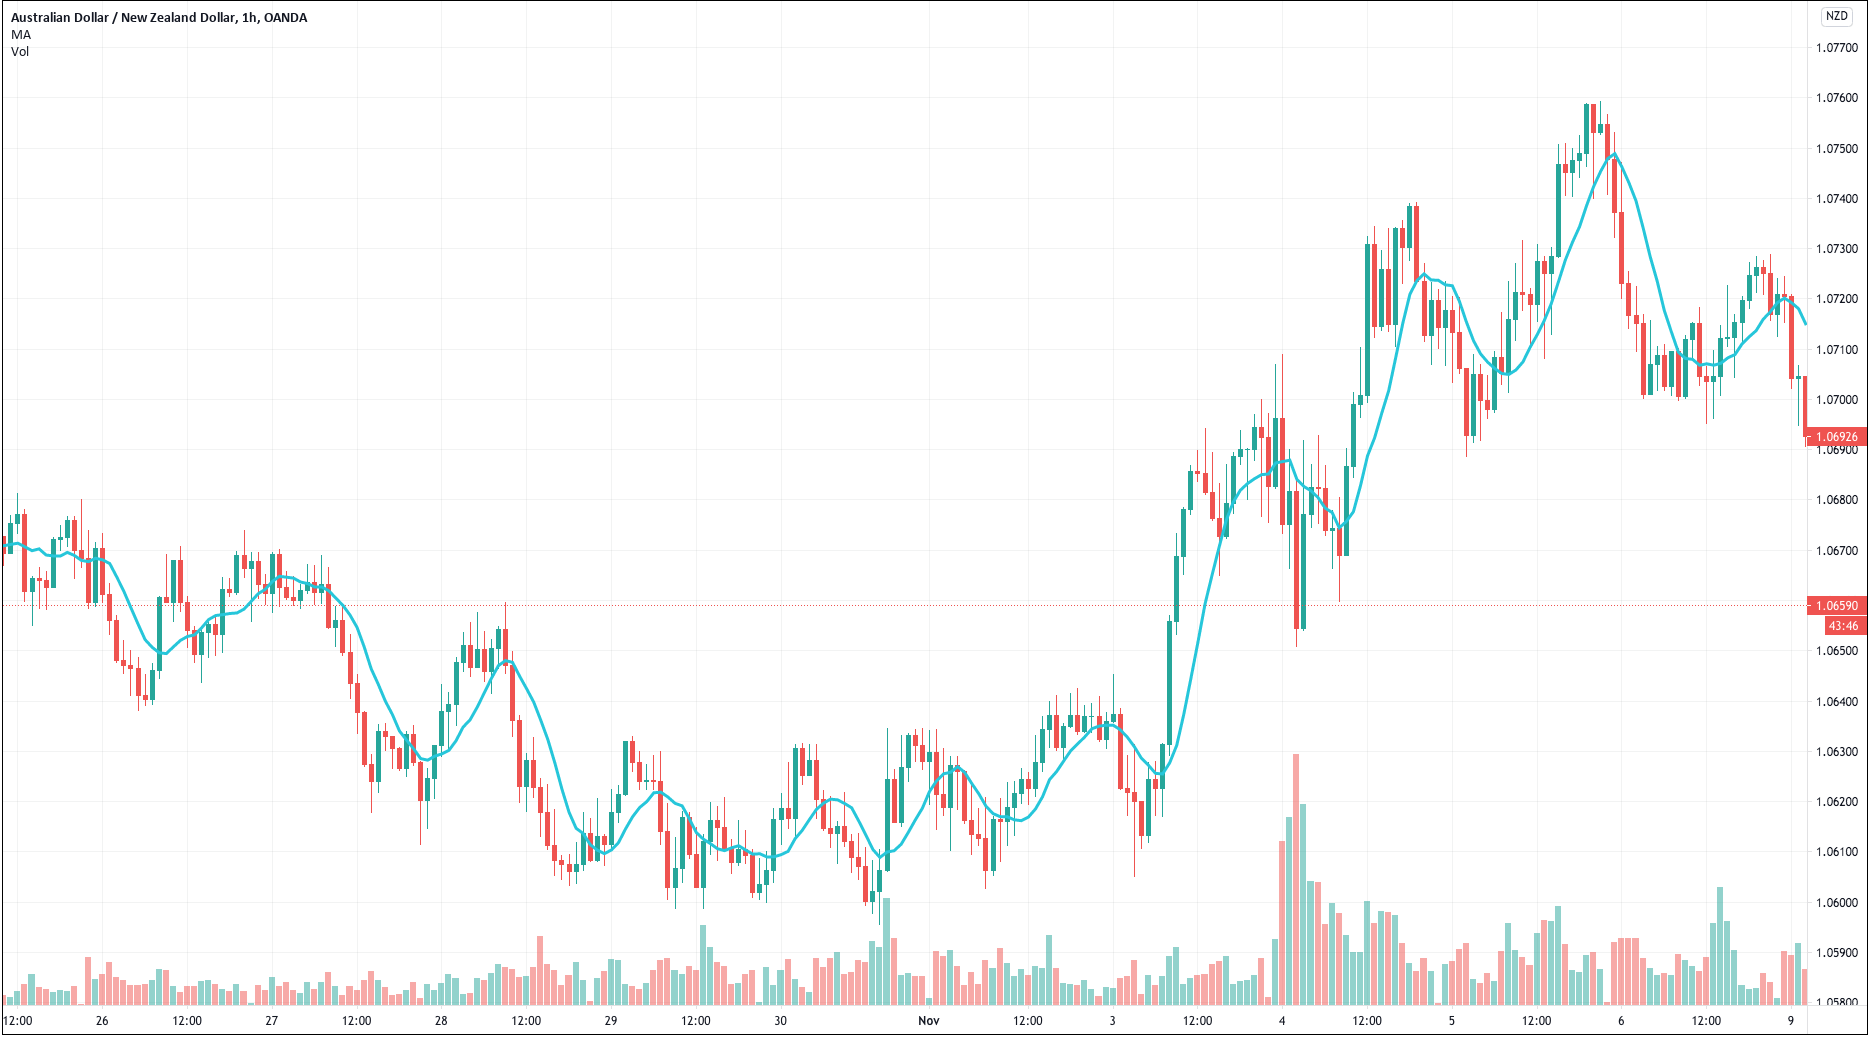
 As said in our previous video, financial markets are unbounded territories where each trader needs to set his own rules; otherwise, they will be influenced by his emotions and fail. A trading system is their set of rules that enable them a long-term success.
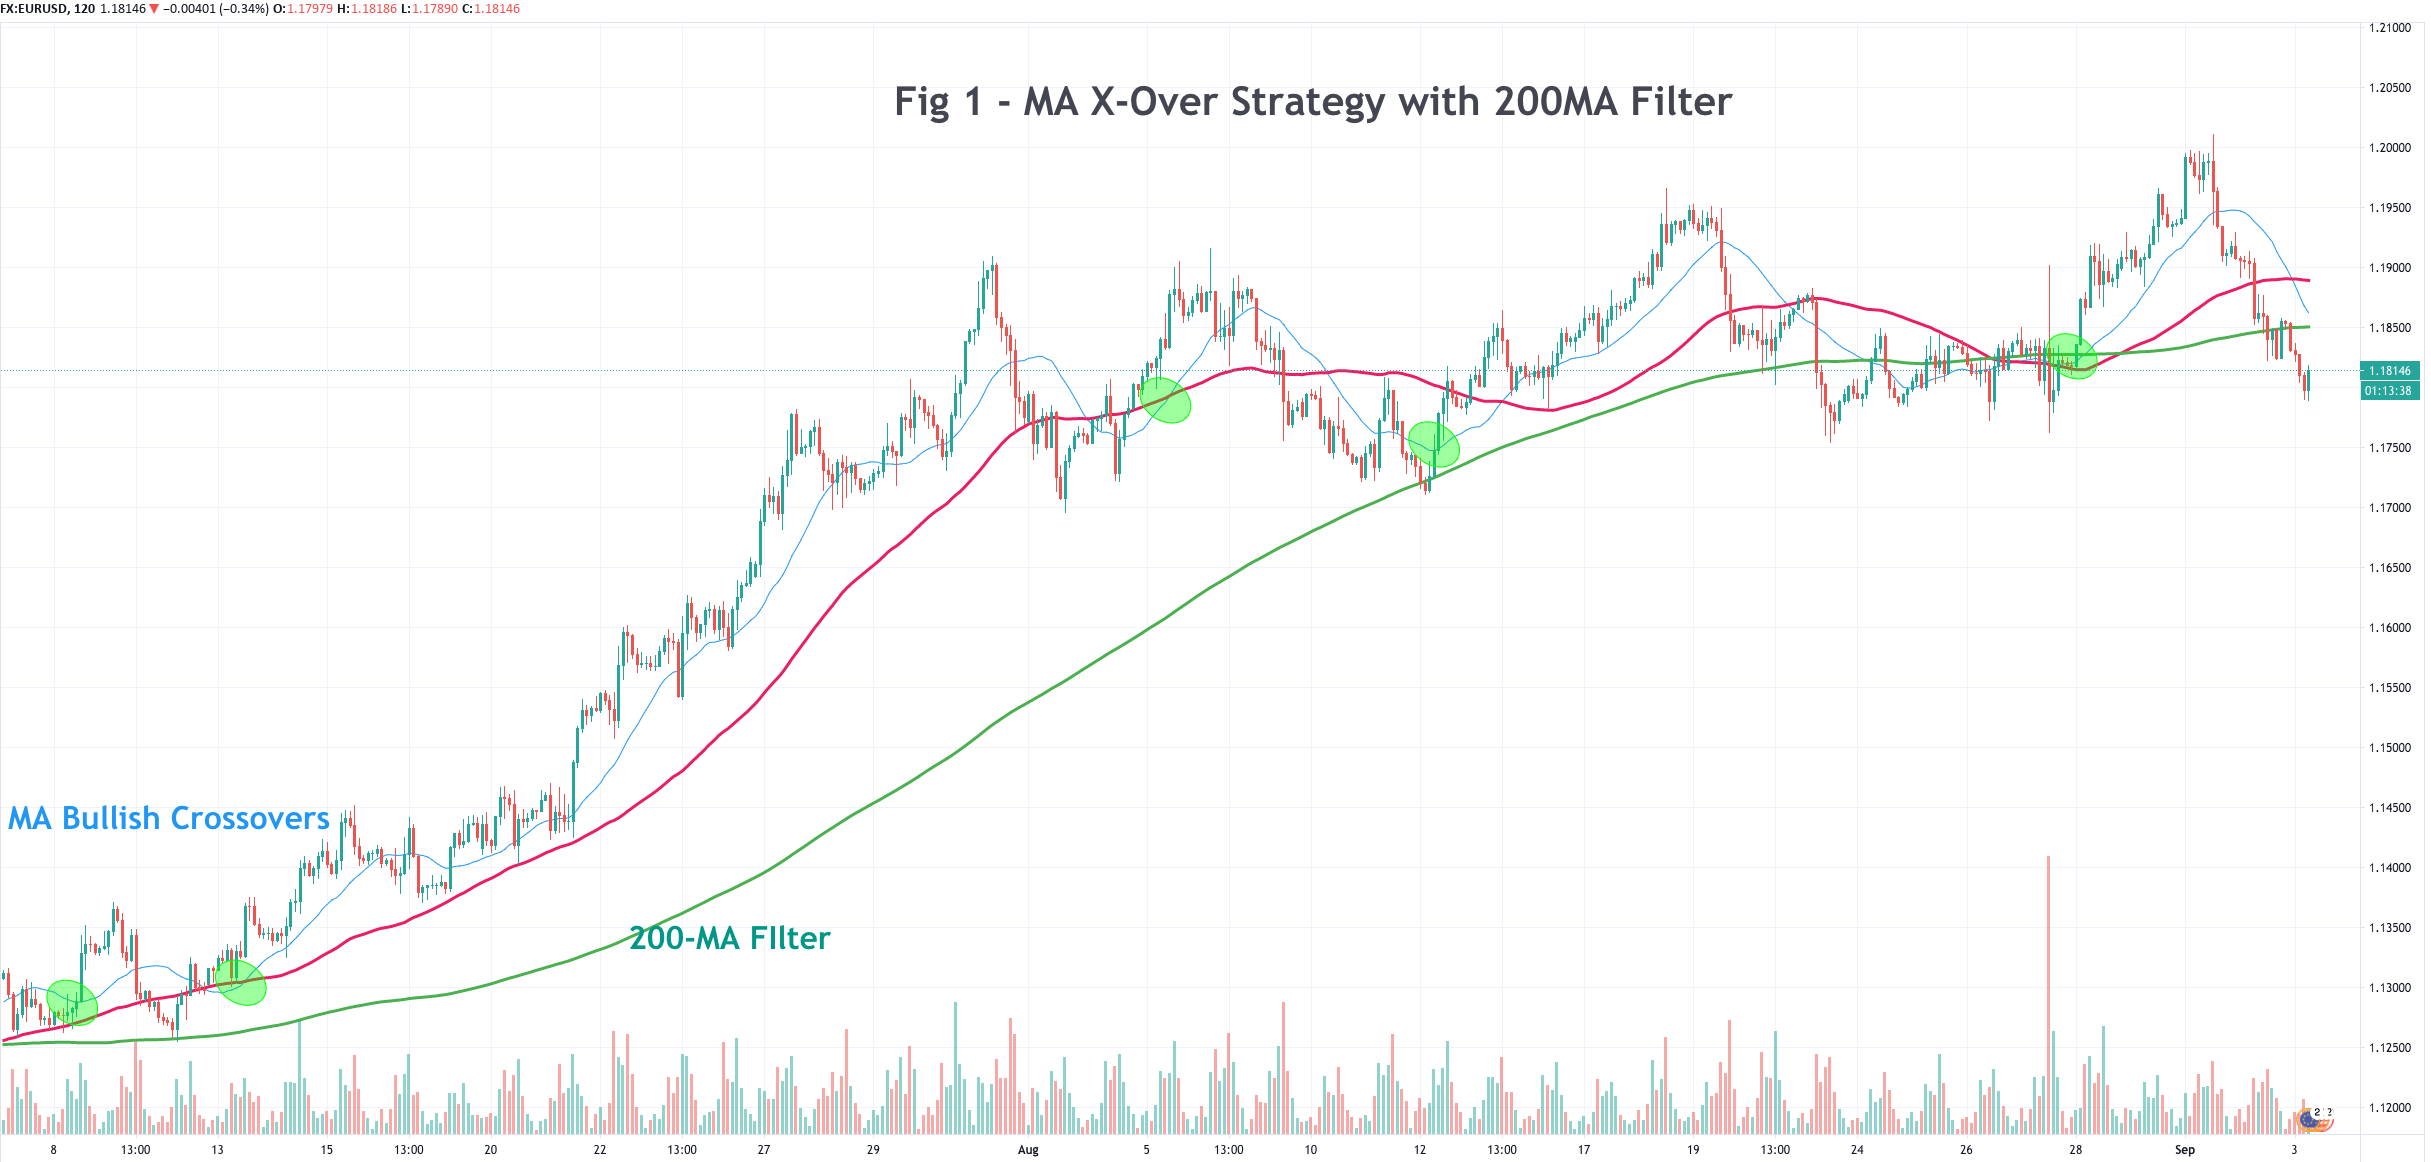
 The chosen timeframe should match the availability to trade. A trader with a day job would need to select a daily or a 12-hour timeframe, whereas a full-time trader could use shorter frames, such as 15-min, one, two, or four-hour timeframes.
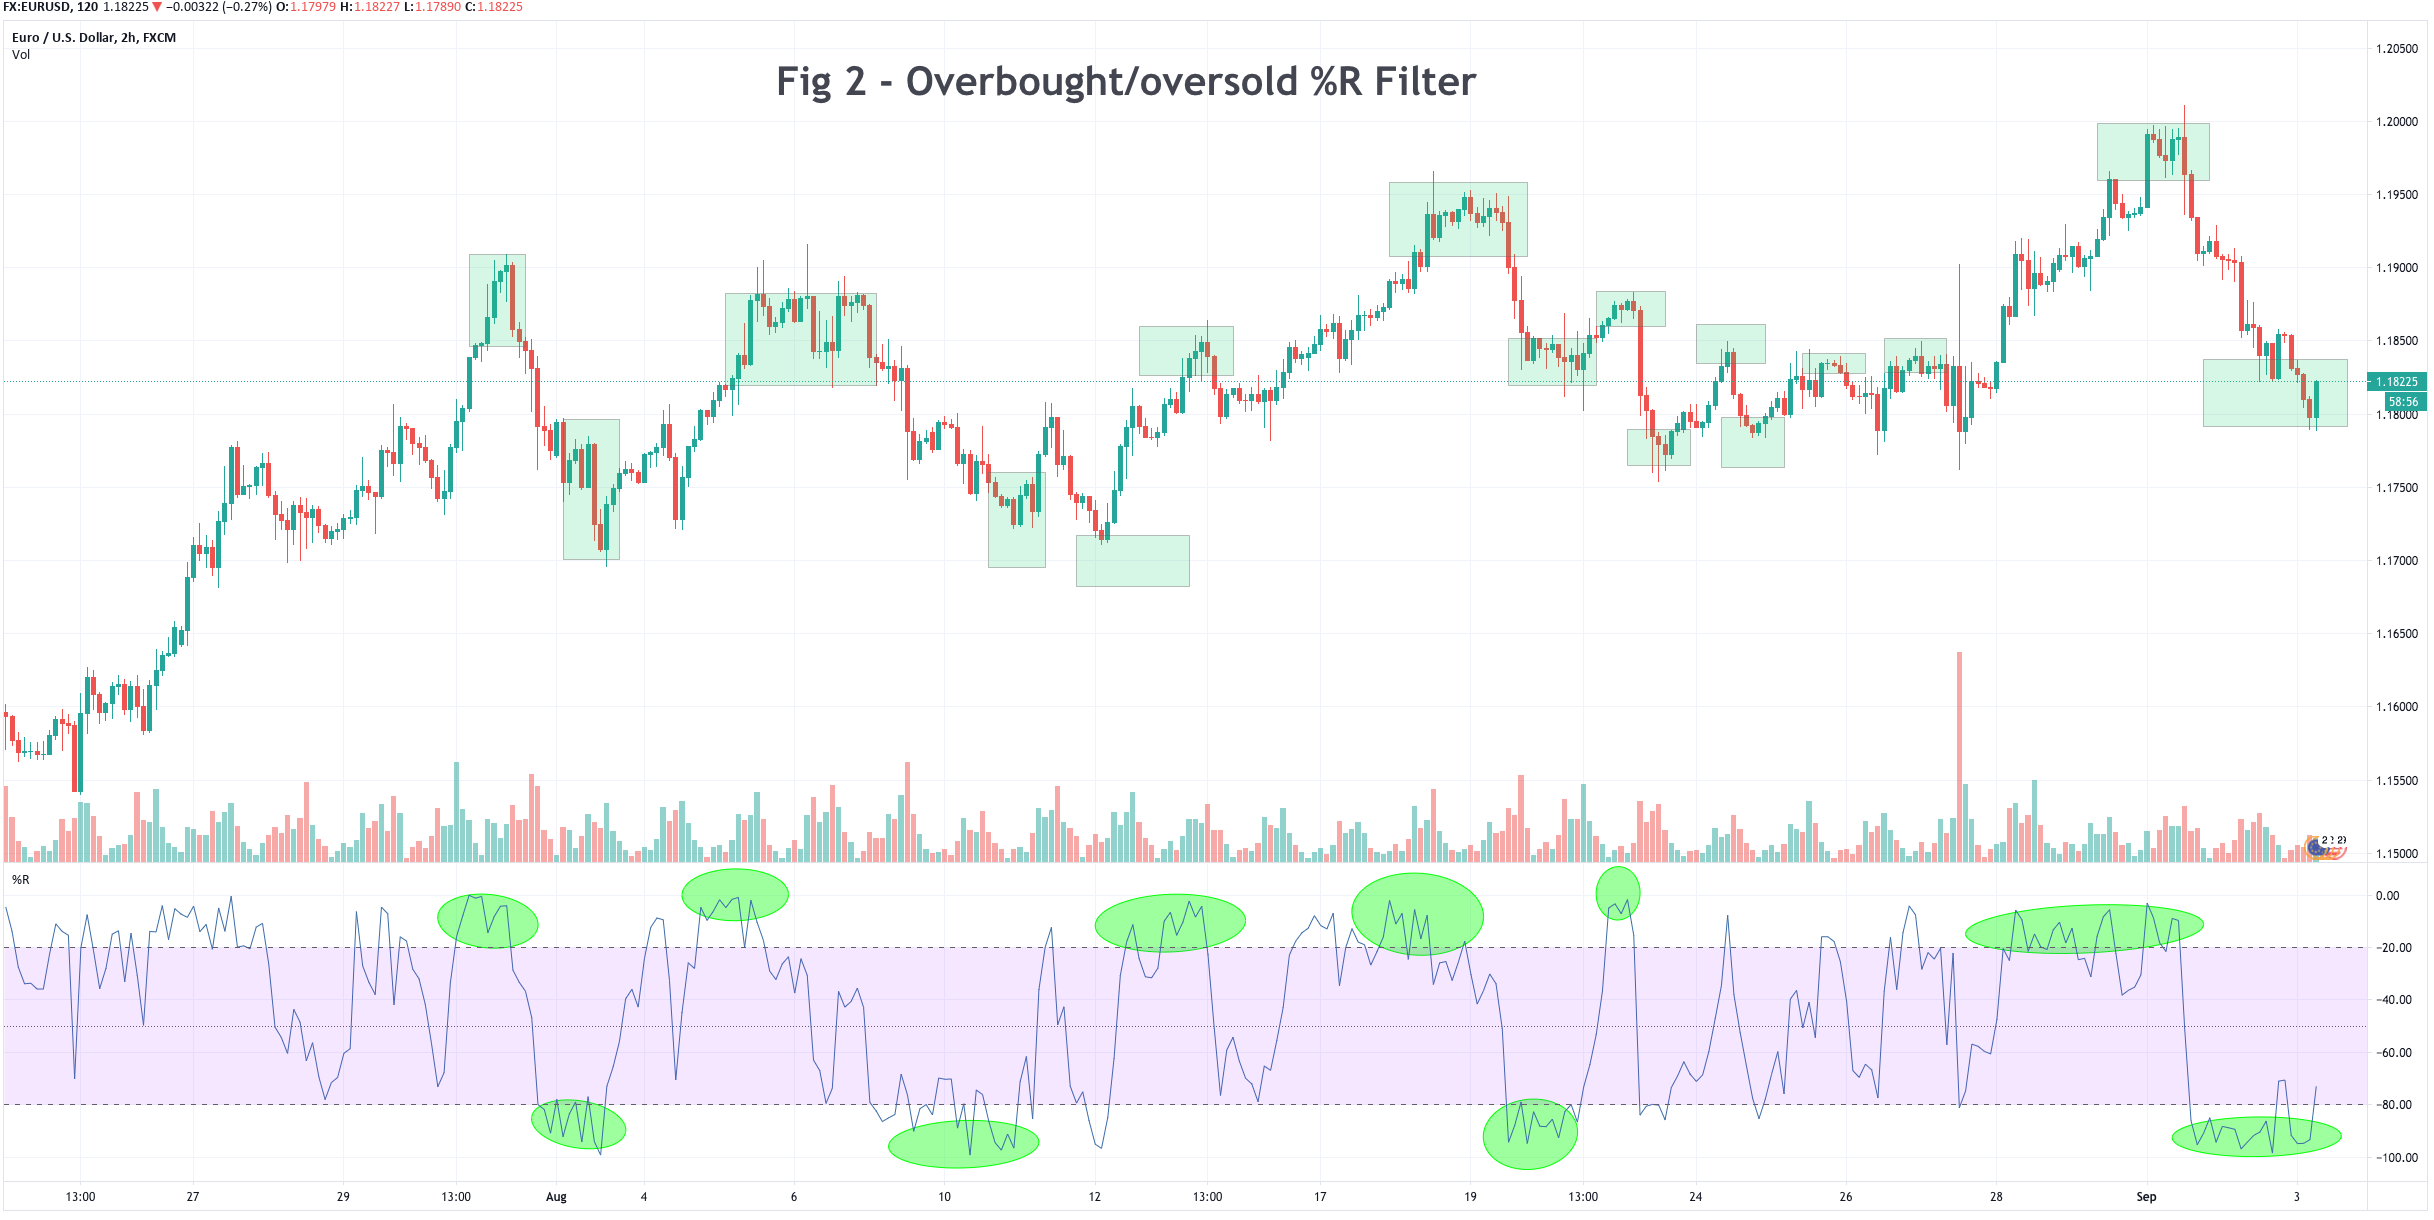
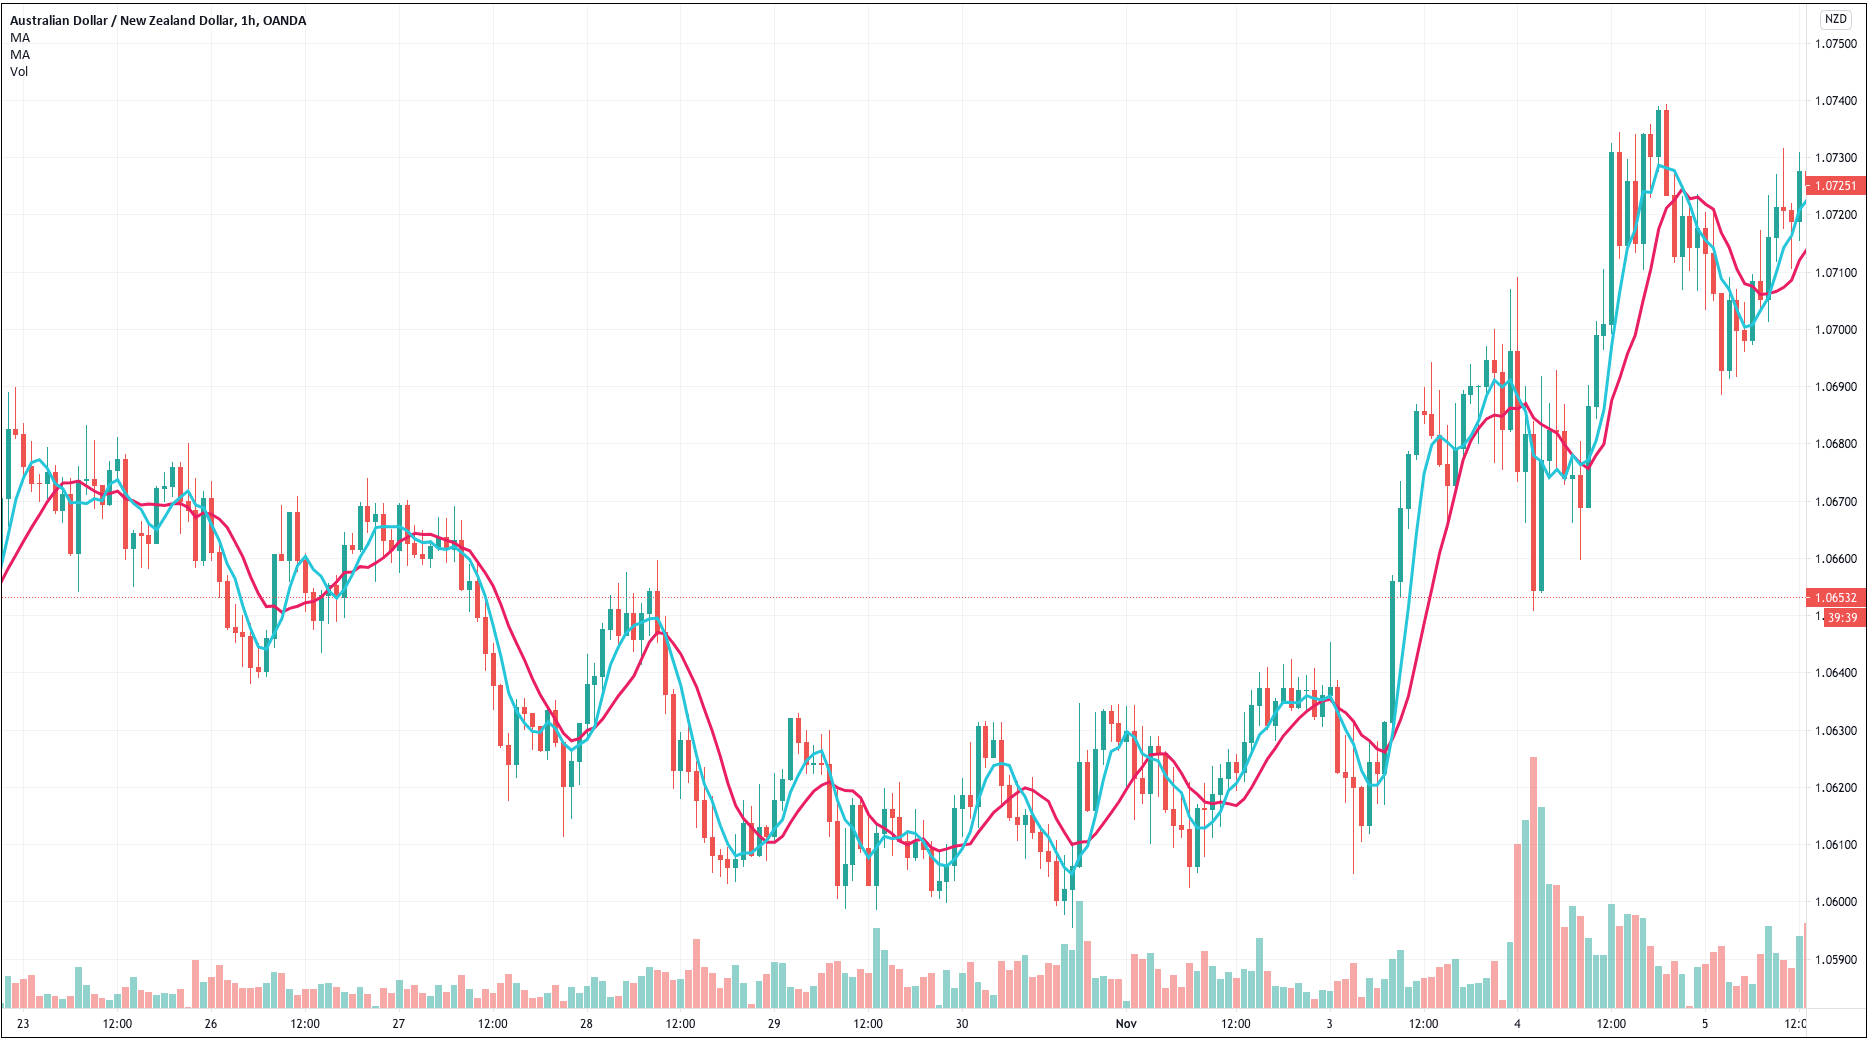
 A permisioning filter is a way to avoid trading under determined circumstances. It can be a filter that allows only trading in the direction of the primary trend or an overbought/oversold sign that should be on for a determined candlestick or pattern formation to be valid.

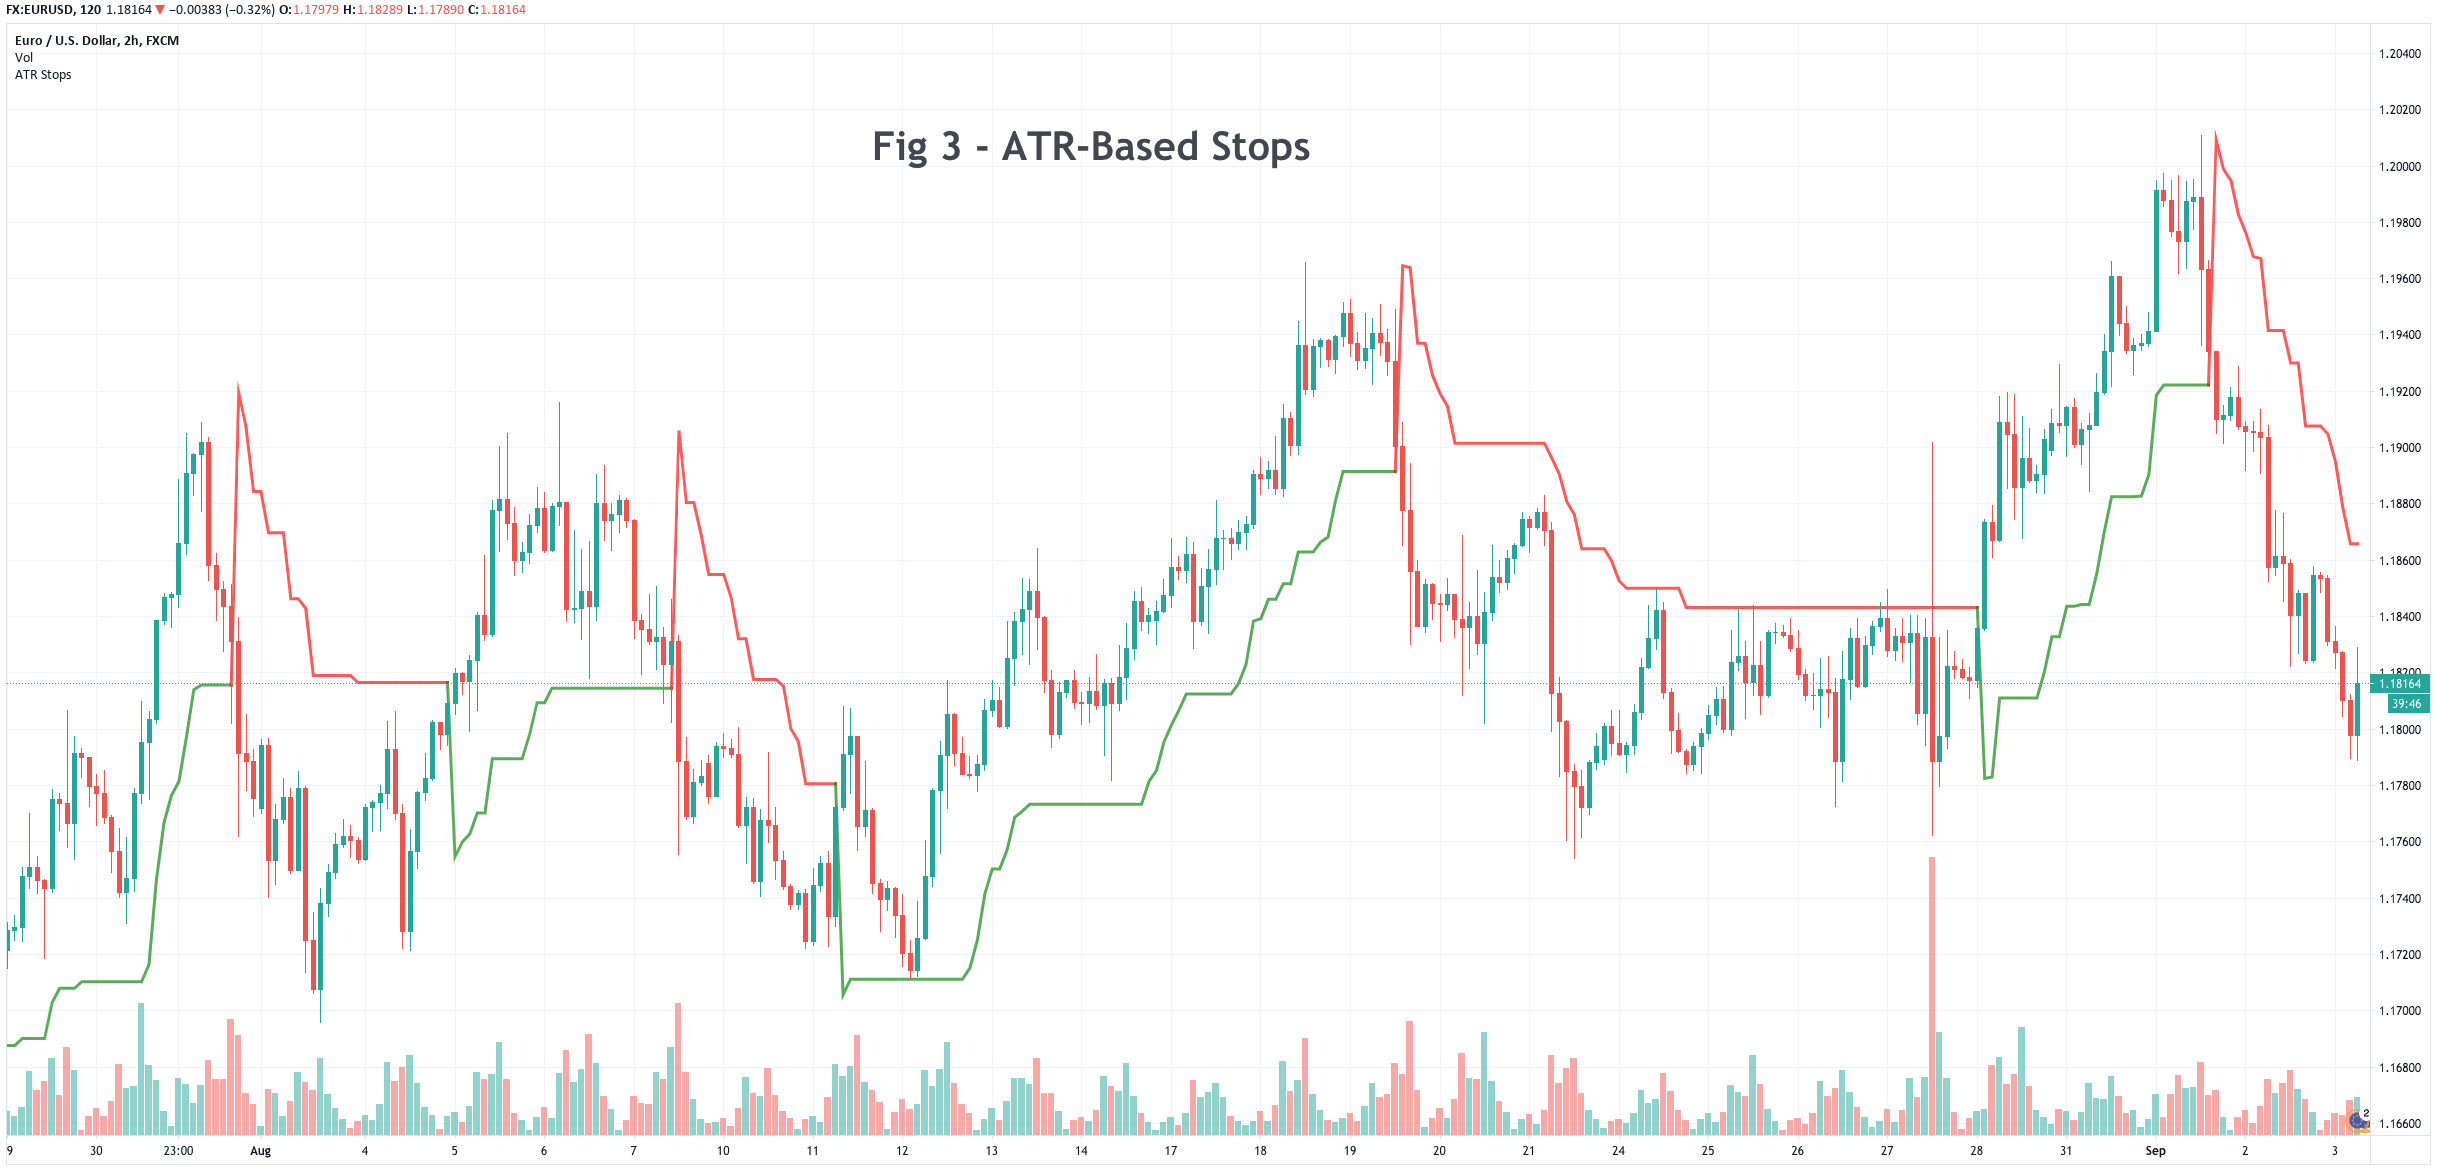
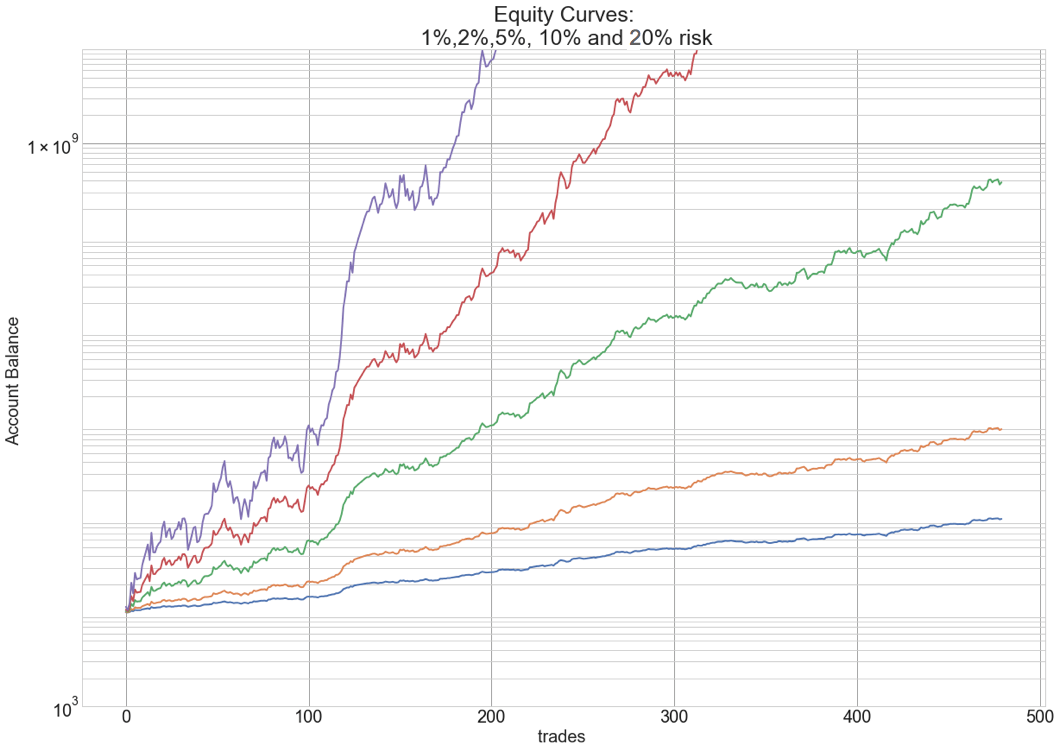
 Position sizing is the part of your plan that tells you how much risk you should take on a trade. We have had a