Categories
Forex Signals

AUD/USD Bearish Bias Continues – Sell Signal In Play!

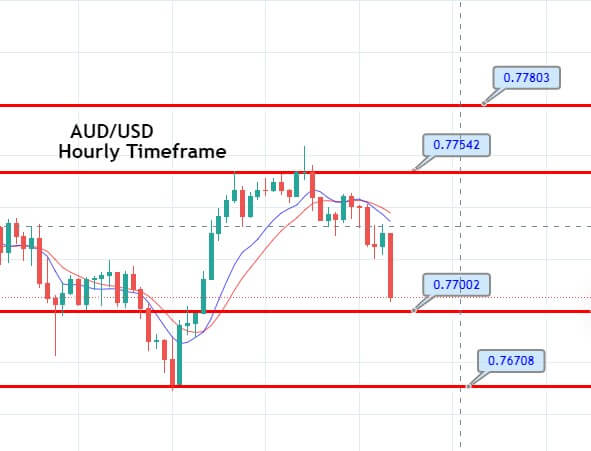
The AUD/USD pair was closed at 0.77473 after placing a high of 0.77540 and a low of 0.76686. After placing losses for 2 consecutive sessions, AUD/USD pair rose on Tuesday amid the turnaround of risk appetite in the market sentiment. The risk-sensitive Australian dollar gained traction on Tuesday after the positive vaccine news took hold of the market. The European equities, US stocks, and Bond yields rose during European trading hours amid the risk appetite in the market driven by attesting vaccine developers’ announcement.

Moderna and Pfizer announced that they were investigating work on the booster vaccine shots that will provide immunity even against the new variants like the one that emerged in UK, Brazil, and South Africa and promised to deliver them by 6-12 months. Whereas Johnson & Johnson also announced to release its vaccine data later this week and was very hopeful that their data will be robust and game-changer. As J7J has claimed that its vaccine will provide full immunity in a single shot, unlike other current vaccines that provide 90-95% immunity.
The rising risk sentiment because of the positive vaccine news gave strength to the risk perceived Aussie and supported the upward momentum in AUD/USD pair on Tuesday.

On the data front, at 19:00 GMT, the Housing Price Index from the US for November improved to 1.0% against the predicted 0.9% and supported the US dollar that capped further gains in AUD/USD pair. The S&P/CS Composite -20 HPI for the year also improved to 9.1% against the predicted 8.8% and supported the US dollar. At 19:59 GMT, the Richmond Manufacturing Index for January weakened to 14 against the predicted 18 and weighed on the US dollar and added gains in AUD/USD pair. At 20:00 GMT, the CB Consumer Confidence in January improved to 89.3 against the predicted 88.9 and supported the US dollar.

Despite strong macroeconomic data from the US, the US dollar failed to gain traction on Tuesday as the US Dollar Index fell by 0.2% on the day against the basket of major currencies. The decline in the US dollar could be attributed to the rebound in risk sentiment in the market. The weakness of the US dollar also helped AUD/USD pair to post gains for the day.

However, the AUD/USD pair’s gains were somehow capped as the tensions between the US & China escalated at the South China Sea. After the warning from Chinese President Xi Jinping, who said that if global leaders will try to intimidate or threaten others, then a new Cold War could begin and urged them to be united in the face of coronavirus pandemic. These developments weighed on China-proxy Aussie and capped further upside in AUD/USD pair on Tuesday.


Daily Technical Levels
Support Resistance
0.7677 0.7744
0.7646 0.7780
0.7610 0.7810
Pivot Point: 0.7713

Entry Price – Buy 0.7719
Stop Loss – 0.7759
Take Profit – 0.7679
Risk to Reward – 1:1
Profit & Loss Per Standard Lot = -$400/ +$400
Profit & Loss Per Micro Lot = -$40/ +$40
Fellas, now you can check out forex trading signals via Forex Academy mobile app. Follow the links below.
iPhone Users: https://apps.apple.com/es/app/fasignals/id1521281368
Andriod Users: https://play.google.com/store/apps/details?id=academy.forex.thesignal&hl=en_US

Categories
Forex Signals

NZD/USD Sell Signal Update – Quick Outlook! 

The NZDUD pair is trading at 0.7229 level, gaining immediate support around the 0.7224 mark. A bearish breakout of 0.7224 level can extend selling until 0.7214 and 0.7201. Conversely, a breakout of 0.7240 can lead the NZDUSD pair towards 0.7280.


Entry Price – Sell 0.72255

Stop Loss – 0.72655

Take Profit – 0.71855

Risk to Reward – 1:1

Profit & Loss Per Standard Lot = -$400/ +$400

Profit & Loss Per Micro Lot = -$40/ +$40

Fellas, now you can check out forex trading signals via Forex Academy mobile app. Follow the links below.

iPhone Users: https://apps.apple.com/es/app/fasignals/id1521281368

Andriod Users: https://play.google.com/store/apps/details?id=academy.forex.thesignal&hl=en_US

Categories
Forex Signals

AUD/USD Violates Upward Channel – Selling Setup Looms 

https://t.me/forexsignalsFA

The AUD/USD closed at 0.77647 after placing a high of 0.77819 and a low of 0.77387. AUD/USD pair rose for the third consecutive session on Thursday amid the rising risk-sentiment in the market and the broad-based US dollar weakness. The US dollar was weak on Thursday due to increased hopes for a large stimulus package worth $1.9 trillion from the US’s new Democratic government. Joe Biden, who took office on Wednesday, signed many executive orders to help the US economy cope with the coronavirus pandemic crisis.

The smooth transition supported the risk sentiment at the White House, and it supported the risk-sensitive currency Aussie that ultimately added in the upward momentum of the AUD/USD pair. On the other hand, the US dollar index that measures the value of the US dollar against the basket of six currencies fell by 0.2% to 90.04 level and weighed on the greenback that ultimately added in the gains of AUD/USD pair.

Meanwhile, at 05:00 GMT, the MI Inflation Expectations for December came in as 3.4% against November’s 3.5% on the data front. At 05:30 GMT, the Employment Change from Australia remained flat at 50.0K. The Unemployment Rate from Australia for December dropped to 6.6% against the forecasted 6.7% and supported the Australian Dollar that added further gains in AUD/USD pair. 

From the US side, at 18:30 GMT, the Philly Fed Manufacturing Index for January improved to 26.5 against the predicted 11.2 and supported the US dollar that capped further upside in AUD/USD pair. The Unemployment Claims from last week were reduced to 900K from the predicted 930K and supported the US dollar. For December, the Building Permits improved to 1.71M against the predicted 1.60M and supported the US dollar. The Housing Starts from December also improved to 1.67M against the predicted 1.56M and supported the US dollar that limited the AUD/USD pair’s gains. 

Despite the strong macroeconomic data and less than expected unemployment claims from the US, the AUD/USD pair continued posting gains on Thursday as investors’ focus remained over the rising hopes for further stimulus measures from the US government and the US dollar’s weakness.

The AUD/USD pair was also rising because of the expansion in China’s GDP in the fourth quarter of 2020 by 6.5%. It made the country one of the few in the world to register positive growth for the year and supported the China-proxy Aussie that ultimately added gains in AUD/USD pair.


Daily Technical Levels

Support Resistance

0.7716 0.7780

0.7677 0.7803

0.7653 0.7843

Pivot Point: 0.7740

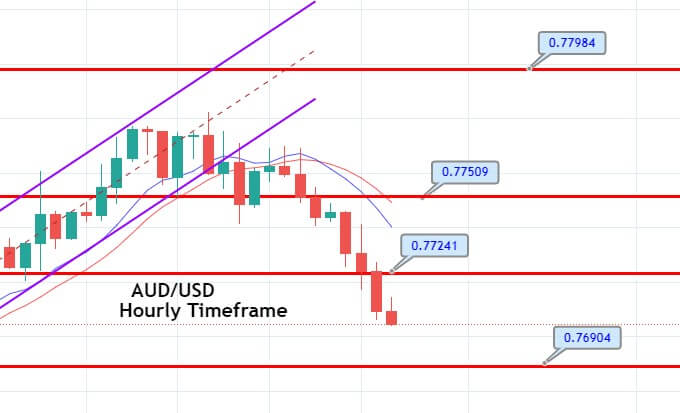
The AUD/USD pair has violated the support level of 0.7724 level, and it’s holding below the same resistance level right now. On the lower side, the AUD/USD may extend the selling trend until the 0.7696 level. The recent bearish engulfing candles are supporting selling bias in the AUD/USD pair. We should consider taking a selling trade below 0.7724 level today. Good luck! 


Categories
Forex Signals Uncategorised

EUR/AUD: The Bear Making a Run Again

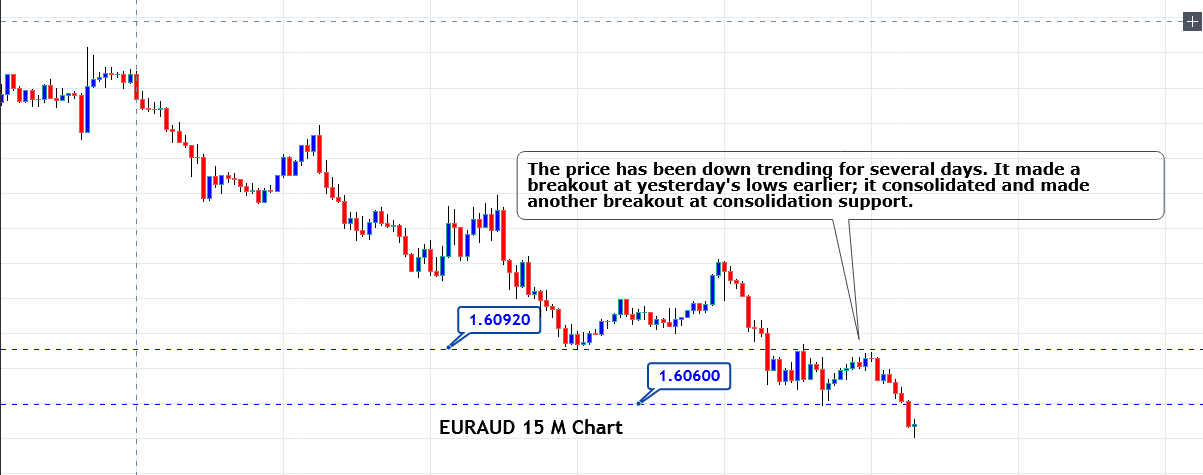
EUR/AUD has been bearish for the last two days. The pair made a bullish correction on the 15M chart to start its trading day. Then, it made a breakout at yesterday’s lowest low at 1.60920 and had a bounce at 1.60600. The price then consolidated within these two levels. Upon producing a doji candle followed by a bearish engulfing candle the pair made a breakout at the level of 1.60600. An entry has been triggered right after the breakout candle’s closing at 1.60472. The price may make a bearish move up to the level of 1.60472. However, it may find its next support around 1.60080. We may consider taking a partial profit at that level depending on its bearish momentum.

Trade Summary:

Entry: 1.60472

Stop Loss: 1.60872

Take Profit: 1.59372

The risk for the trade per standard lot is $ 300.14, Mini lot $ 30.01 and Micro lot $ 3.00. The risk-reward is 1:2.75. Thus, the reward for the per standard lot is $825.38, Mini lot $ 82.53 and Micro lot $ 8.25.

Categories
Forex Signals

EURUSD: Heading towards the South

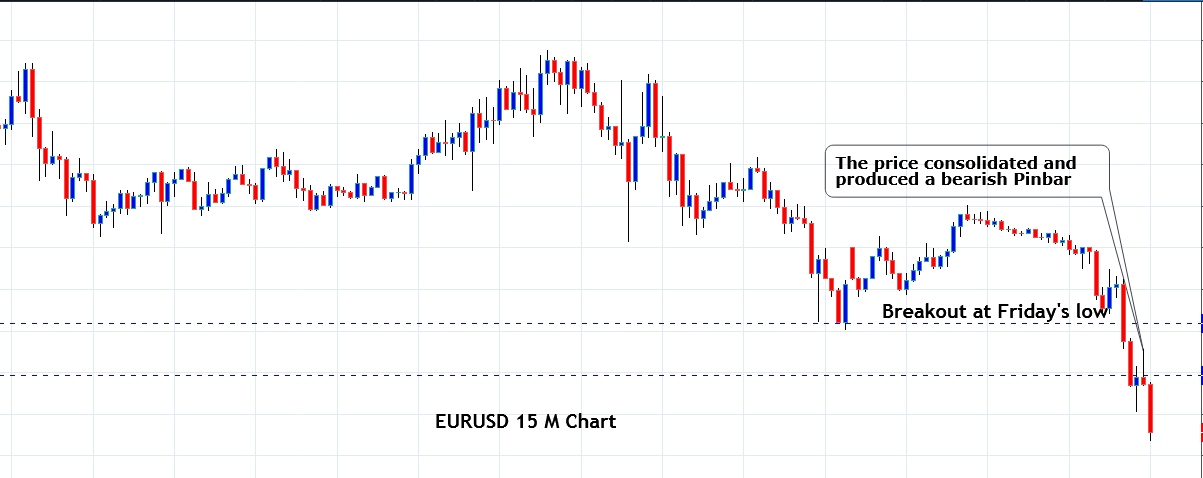
EURUSD produced a bearish candle on the daily chart Friday. The 15 M chart shows that the price made a bearish correction to start its trading day today. It found its resistance at 1.21380 and made a bearish move. It made a breakout at the level of 1.2110 by producing a good-looking bearish Marubozu candle. The pair produced one more bearish candle and then consolidated around the level of 1.21000. Upon producing a bearish Pin Bar, the price seems to get more bearish. It may head towards the level of 1.20700 with good bearish momentum. The price may consolidate or make a bullish correction around the level before finding its next direction as far as the 15M chart is concerned.

Trade Summary:

Entry: 1.21002

Stop Loss: 1.21002

Take Profit: 1.20802

The risk for the trade per standard lot is $100, Mini lot $10 and Micro lot $1. The risk-reward is 1:2. Thus, the reward for per standard lot is $200, Micro lot $ $20 and Mini lot $ 2.

Categories
Forex Signals

EUR/GBP Continues its Bearish Move


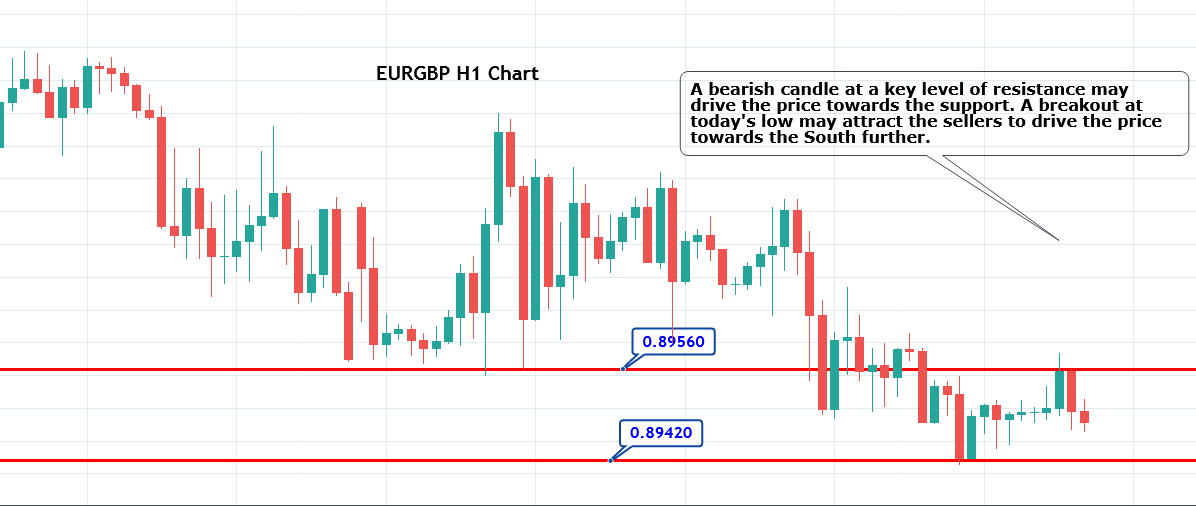
EUR/GBP had a bearish day yesterday. The H1 chart shows that the pair made a bearish move to start its trading day and found its support at 0.89420. It produced a bullish inside bar and headed towards the North in search of its resistance. The level of 0.89560 worked as a level of resistance and produced a bearish candle with a tiny lower shadow. However, the candle closed with a long bearish body producing at the 61.8% Fibo level. Thus, the price may continue its bearish move towards support. If it makes a breakout at today’s low, then the sellers may go short and drive the price towards the downside. We have triggered a Sell Stop order at 0.89375.

Trade Summary:

Entry: 0.89375

Stop Loss: 0.89555

Take Profit: 0.89195

The risk for the trade per standard lot is $ 197.94, Mini lot $ 19.79 and Micro lot $1.97. The risk-reward is 1:1. Thus, the reward for per standard lot is $ 197.94, Mini lot $ 19.79 and Micro lot $1.97.

Categories
Forex Signals

EUR/NZD: Heading towards the South


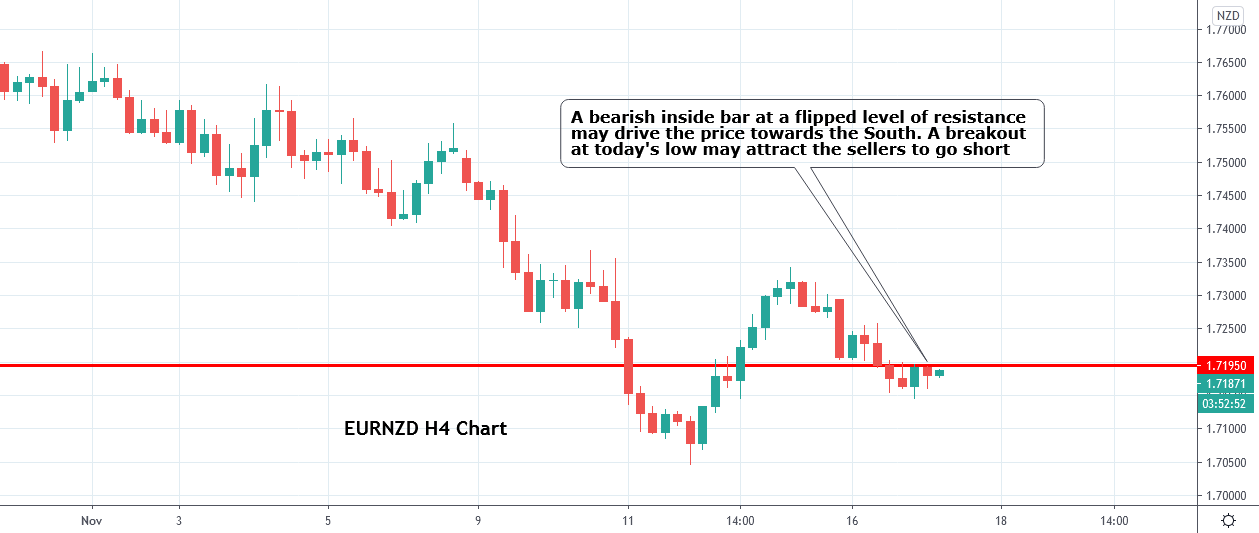
EUR/NZD has been in a bearish correction on the daily chart. However, the H4 chart shows that the price has been heading towards the South upon finding its resistance around 1.73200. The price consolidated within 1.71900-1.71390. The H4 chart has produced a bearish inside bar at 1.71900. Thus, if the price heads towards the South and makes a breakout at today’s lowest low, it may head towards the South by offering a short entry. The price may find its next support around 1.70500, where it had a bounce earlier. If the price makes an H4 breakout at the level of 1.70500, the pair may remain bearish in the coming days.

Trade Summary:

Entry: 1.71262

Stop Loss: 1.71882

Take Profit: 1.70582

The risk of the trade per standard lot is $ 899.06, $ 89.906 for a mini-lot, and $ 8.99 for each micro-lot. The risk-reward is 1:1.10. Thus, the reward per standard lot is $ $ 988.96, for Mini lot $ 98.89, and for Micro lot $ 9.88.

Categories
Forex Signals

AUD/USD Set to Complete 61.8% Fibonacci Retracement – Signal Update! 

Today in the early European trading session, the AUD/USD currency pair Managed To stop Its Previous Session losing streak and drew some modest bids on the back of the upbeat China trade numbers, which came out better than forecast. Also, capping the losses could be the light calendar in Asia amid the U.S. holiday. On the contrary, the fresh risk aversion wave, triggered by the US-China renewed tussle and Brexit issue, turned out to be a major factor that kept the lid on any further gains in the currency pair. 

In the meantime, the broad-based U.S. dollar strength backed by Friday’s released upbeat U.S. jobless rate and wage growth data also kept the currency pair under pressure. The AUD/USD currency pair is currently trading at 0.7285 and consolidating in the range between 0.7270 – 0.7298.

At the data front, China’s Trade Balance for August, in Yuan terms, arrived in at CNY416.59 billion against CNY196.21 billion expected and CNY442.23 billion last. Meanwhile, August exports arrived in at +11.6% vs.+2.1% expected and +10.4% last while imports arrived at -0.5% vs. -0.7% expected and +1.6% prior. 

As far as the USD terms’ data is concerned, the headline Trade Balance improved past-$50.5B forecast to $58.9B. The Exports increased by 9.5% versus 7.1% prior, whereas Imports eased to -2.1% against +0.1% expected and -1.4% prior. However, the Chinese exports and big surplus beat initially impressed the AUD bulls and became the key factor that kept the currency pair from losses.

Elsewhere, the market risk tone has been sluggish since the day started, possibly due to the renewed conflict between the U.S. and China. The war between both parties fueled after the U.S. punished Chinese technologies and diplomats by imposing several sanctions that have repeatedly irritated the Dragon Nation. In turn, China’s Foreign Ministry advised the U.S. to stop abusing the domestic companies on the day. 

As per the keywords, “Without evidence, the U.S. has abused national power to take measures on Chinese companies.” Apart from this, previous Chinese warnings to cut the U.S. debt buying also heated up an already intensified tussle. 

Also weighed on the risk sentiment is the rising coronavirus cases in Asian and Europe, fueling worries about the global economic recovery. As per the report, the coronavirus cases crossed 27 million cases as of September 7, as per the Johns Hopkins University data. However, these fears also kept the traders cautious.

At the USD front, the broad-based U.S. dollar managed to maintain its bullish trend and remain on the day’s bullish track. However, the U.S. dollar gains were supported by the upbeat U.S. labor market report, which revealed a slipped in the unemployment rate and a rise in U.S. Treasury yields. Thus, the gains in the U.S. dollar kept the currency pair under pressure. Whereas, the U.S. Dollar Index that tracks the greenback against a basket of other currencies rose by 0.18% to 92.882 by 12:05 AM ET (5:05 AM GMT).

Looking forward, the Labor Day Holiday in the U.S. will likely restrict the market moves. Whereas, the updates on the virus and Sino-American tension could not lose its importance. In the meantime, the market players will be interested in the headlines concerning the Brexit.


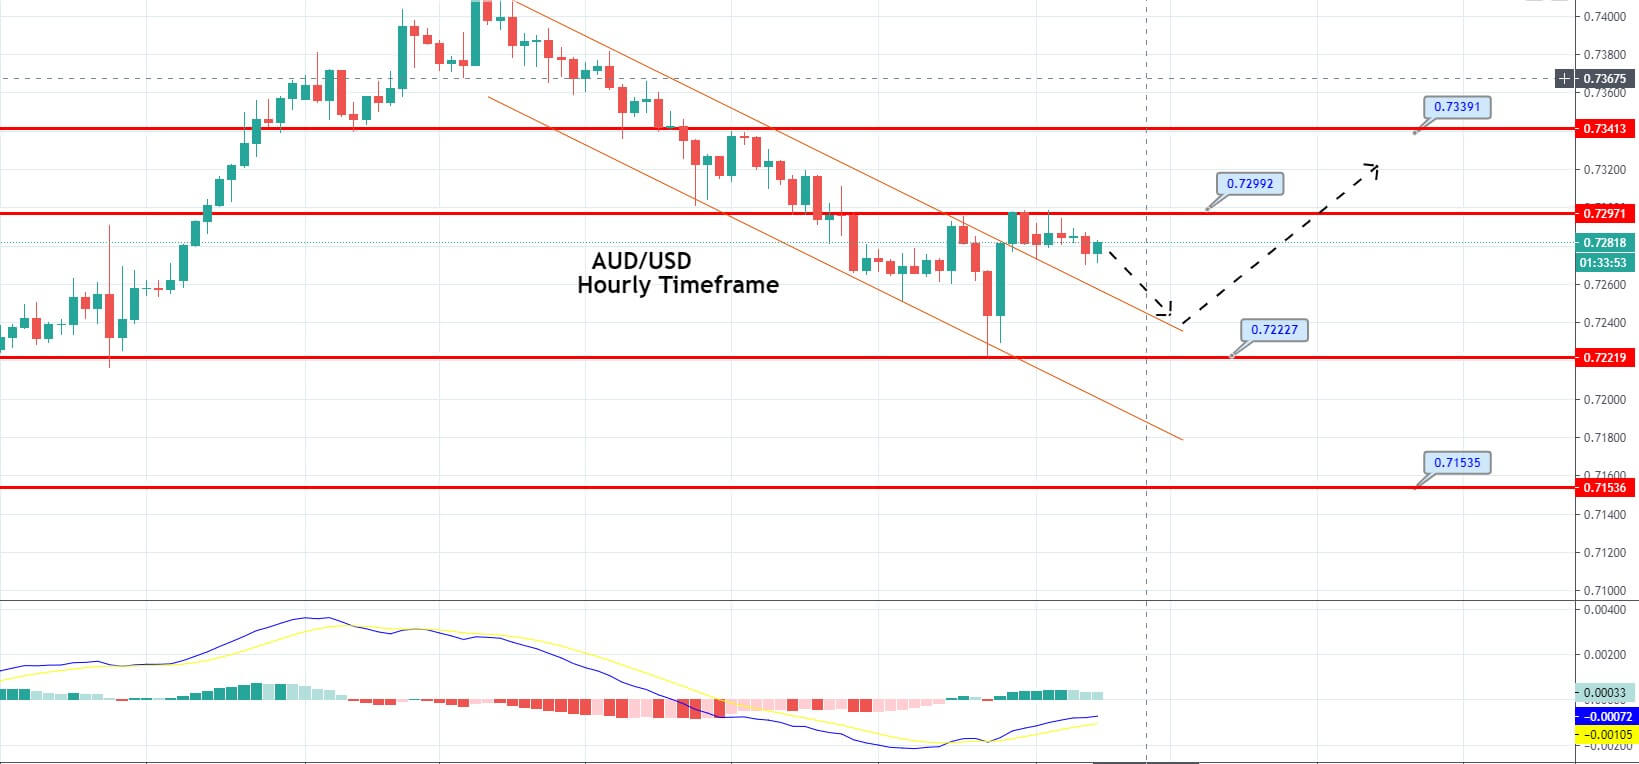
The AUD/USD pair is trading sideways over an immediate support level of 0.7277 level. Closing of candles above this level may drive upward movement in the market until the 0.7325 level. A bearish breakout of 0.7276 level may drive selling until the 0.7249 level today.

Entry Price – Buy Limit 0.72463

Stop Loss – 0.72063

Take Profit – 0.72863

Risk to Reward – 1:1

Profit & Loss Per Standard Lot = -$400/ +$400

Profit & Loss Per Micro Lot = -$40/ +$40

Fellas, now you can check out forex trading signals via Forex Academy mobile app. Follow the links below.

iPhone Users: https://apps.apple.com/es/app/fasignals/id1521281368

Andriod Users: https://play.google.com/store/apps/details?id=academy.forex.thesignal&hl=en_US
Categories
Forex Signals

GBP/USD Slips Below Double Top – Quick Update on Signal!

<script type=”text/javascript” src=”https://s3.tradingview.com/tv.js”></script>
<script type=”text/javascript”>
var tradingview_embed_options = {};
tradingview_embed_options.width = ‘100%’;
tradingview_embed_options.height = ‘350’;
tradingview_embed_options.chart = ‘g94yDlqK’;
new TradingView.chart(tradingview_embed_options);
</script>


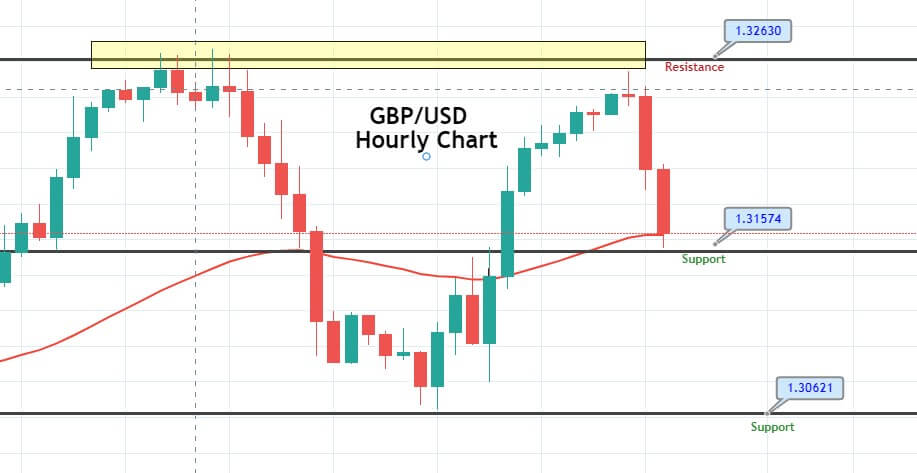
Entry Price – Sell 1.3193
Stop Loss – 1.3233
Take Profit – 1.3153
Risk to Reward – 1:1
Profit & Loss Per Standard Lot = -$400/ +$400
Profit & Loss Per Micro Lot = -$40/ +$40

Fellas, now you can check out forex trading signals via Forex Academy mobile app. Follow the links below.

iPhone Users: https://apps.apple.com/es/app/fasignals/id1521281368

Andriod Users: https://play.google.com/store/apps/details?id=academy.forex.thesignal&hl=en_US

Categories
Forex Signals

GBP/JPY Breaks Upward Trendline – Quick Update on Trade Setup! 

The Japanese cross pair GBP/JPY is trading sharply bearish amid weaker GBP and firmer JPY. The safe-haven pair has already violated upward trendline support 139.490, and now the same level is working as a resistance. The GBP/JPY may gain support and bounce off soon. 

The GBP/JPY currency pair extended its previous session, losing streak, and dropped further below 139.078 marks, mainly due weakness in the GBP. The upbeat market sentiment, backed by the optimism over a potential vaccine for the highly infectious coronavirus, undermined the safe-haven Japanese yen and helped currency pair to limit its deeper losses. 

In the meantime, the downbeat preliminary readings of Japan’s second quarter (Q2) Gross Domestic Product (GDP) also undermined the safe-haven Japanese yen currency and became one of the major factors that capped further downside for the currency pair.  

Despite concerns about the ever-increasing coronavirus cases across the world and worsening US-China relations, the investors continued to cheer the optimism over a potential vaccine for the highly contagious coronavirus disease. Also, supporting factors could be the suspension of the US-China online meeting regarding the trade deal. It is worth mentioning that the meeting was initially scheduled for Saturday while the delay leaves the phase one deal intact, for the time being at least.

On the contrary, the fears of growing COVID-19 cases in the U.S., Australia, Japan, and some of the notable Asian nations like India continually fueled doubts about economic recovery. As per the latest report, France recorded more than 3,000 new cases for the second day while Australia’s state Victoria marked the highest death loss, which resulted in an extended state of emergency until September 13. As well as, Singapore also reported 86 cases on the weekend. At the same time, New Zealand imposed fresh lockdowns after recording increased cases of Covid-19. However, these gloomy updates kept challenging the market risk-on tone, which might weaken the safe-haven JPY and help limit losses for the major.

Apart from the virus woes, the long-lasting tussle between the world’s two largest economies remained on the cards as China’s ambassador to the U.S. recently gave warning against the U.S. move to send ships to the South China Sea, which could raise further tensions between both nations and harm the trade deal. Whereas, President Trump announced yesterday that TikTok should give its U.S. operations to another company within one-month, or it will be banned in the U.S. due to significant security threats. In return, China’s Foreign Ministry recently said on the day that it would firmly oppose to U.S. actions.


Technically, the GBP/JPY pair was gaining support at 138.950 level, and I was suspecting if the pair will be able to hit our take profit. Therefore, we decided to close our forex trading signal beforehand at 139.002, securing 34.7 pips as we opened it at 139.348. For now, the pair is staying at 139.07 level, and closing of candles above 138.925 is supporting selling bias in the pair. Good luck! 

Categories
Forex Signals

U.S. Session Trade Setup – Crude Oil on Bullish Run Amid Upward Channel

The U.S. WTI crude oil futures continue to advance at $24.39 a barrel in the wake of optimization around the market sentiment and weaker U.S. dollar. Besides this, the latest report about the slowdown in inventories at Cushing since mid-March also continues to support crude oil prices.

The reason for the uptick in crude oil prices could also be attributed to the U.S. dollar weakness. The U.S. dollar is losing its bullish traction and struggling to gain any follow-through traction. Whereas, the U.S. dollar index stalled its moderate bounce just above 99.50 to now trade moderately lower at 99.40.

The start of the OPEC+ production cut by 9.7 million barrels a day also boosted the oil prices. Looking forward, the oil traders will keep their eyes on the weekly release of private inventory data from the American Petroleum Institute (API), which is scheduled to release at 20:30 GMT. The industry stockpile for the week ended on May 1 will likely follow the tracks of the previous reduction to 9.978 million barrels into the inventories.


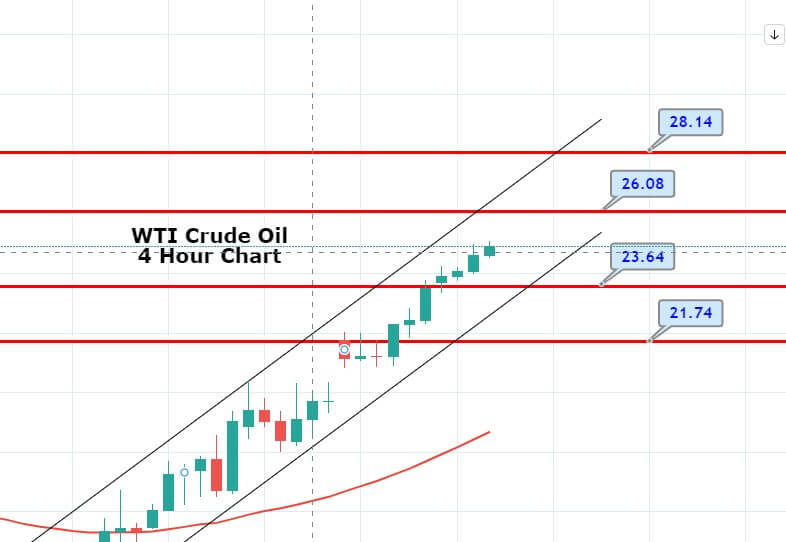
Crude oil has made a strong bullish recovery, as it has violated the resistance level of 21.82 level. Above 21.82, we may see oil prices soaring further higher until 25.02 level. For now, support holds around 21.85, but the bullish bias remains strong as the RSI is also heading north and may also lead oil prices on the upper side.

WTI Crude Oil – Trade Setup

Categories
Forex Signals

USD/JPY Braces to Trade Triple Bottom Breakout! 

The USD/JPY failed to stop its four-day declining streak and witnessed some further selling near two-weeks lows at 106.65 level, mainly due to the cautious mood around the equity markets, which strengthens the Japanese yen’s safe-haven demand and sent the pair down.

On the other hand, the broad-based US dollar weakness helps the pair to dip further below 107, the triple bottom level. It seems like the trader’s sentiment is badly damaged despite the latest positive hopes about easing coronavirus-related lockdowns worldwide and a push to accelerate the gradual re-opening of the economies. 

The safe-haven demand further increased by the fresh downturn in the US Treasury bond yields, which also contributed to the pair’s bearish moves. However, the latest pullback of the US dollar helped limit deeper losses.


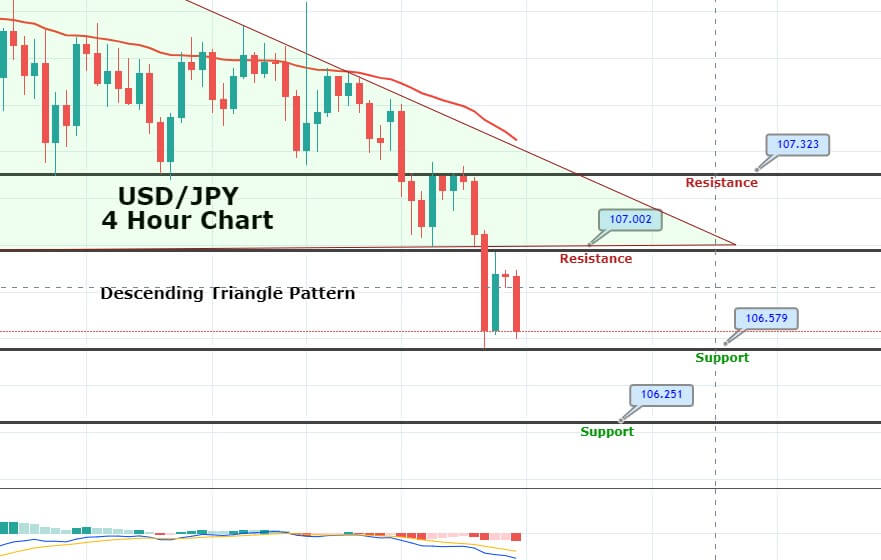
On the technical front, the USD/JPY was facing solid support around 107, the round figure, but it got violated over increased demand for safe-haven yen. At the moment, the USD/JPY is facing strong resistance around 107, along with support at 106.500, but this support seems weaker, and we may see USD/JPY prices falling further until 106.240 later today. Consider moving your stop loss at breakeven as soon as the signal starts yielding 20 pips profit. 

Entry Price: Sell at 106.744    

Take Profit 106.244    

Stop Loss 107.244    

Risk/Reward 1.00    

Profit & Loss Per Standard Lot = -$500/ +$500

Profit & Loss Per Micro Lot = -$50/ +$50

Categories
Forex Signals

AUD/USD Upward Trendline Supports – An Update on Buy Signal! 

The AUD/USD currency pair registered 5-day winning streak and continues to taking bids mainly due to the risk-on market sentiment. The pair has succeeded in recovering around 25-30 pips from the session lows and reached near the high end of its daily trading range at 0.6479 as most of the governments showing a willingness to reopen their economies. On the other hand, the latest pullback of the US dollar keeps the currency pair gains limited. 

Currently, the AUD/USD is trading at 0.6483 and consolidates in the range between the 0.6433 – 0.6483. Earlier in the day, the risk sentiment got support from the hopes of easing lockdowns in the major economies, including Australia, mainly due to the death toll dropped to its lowest level in the month. However, global scientists are still struggling to find the vaccine of the coronavirus (COVID-19).


Technically, the AUD/USD pair is gaining strong support around 0.6443, and closing of bullish engulfing pattern over this level may drive some buying in the Aussie dollar pair. The 50 EMA and MACD both are in support of the buying trend while an upward trendline on the 4-hour timeframe is suggesting chances of bullish trend continuation in the market. The Aussie dollar may continue trading bullish until next resistance area of 0.6536 and 0.65736. Hence, we opened a buying trade with an entry price of 0.64736.

Entry Price: Buy at 0.64736    

Take Profit .0.65736    

Stop Loss 0.64136    

Risk/Reward 1.67    

Profit & Loss Per Standard Lot = -$600/ +$1000

Profit & Loss Per Micro Lot = -$60/ +$100

Categories
Forex Signals

EUR/JPY Descending Triangle Pattern – Quick Update on Signal

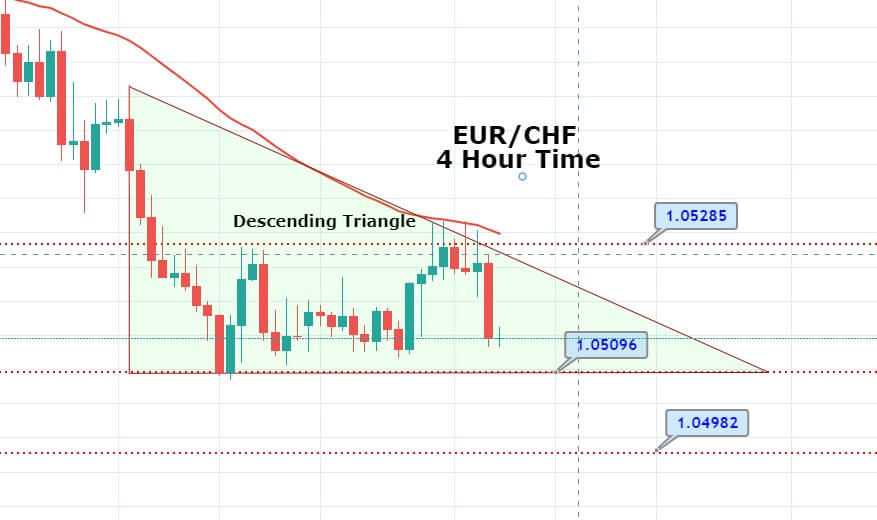
The EUR/CHF is trading in a selling channel, having dropped from 1.0520 level heading to test the triple bottom support zone of 1.0509. The demand for safe-haven appears to have increased due to the increased number of coronavirus cases around the globe. The strength of the single currency Euro is also keeping the pair supported. Most of the selling in the single currency euro rise in the wake of the dovish ECB monetary policy stance in the wake of the COVID19 crises.  

The single currency euro exhausted following the European Central Bank, which announced more stimulus to accommodate the coronavirus impact. The ECB endorsed new stimulus measures to support the euro-region economy to deal with the increasing damage of the coronavirus disease. 


The EUR/CHF has developed a descending triangle pattern on the 4-hour timeframe which is supporting the pair at 1.0509 along with resistance around 1.0528. On the 4 hour timeframe, a bearish breakout of 1.0509 can lead the pair towards 1.0490 and even lower. As we see, the 50 periods EMA gave a hard time to EUR/CHF, which faced strong resistance around 1.0525. Considering selling bias, we have entered the selling trade at 1.05159 with a stop loss at 1.05659 and take profit at 1.04659. 

Entry Price: Sell at 1.05159 

Take Profit 1.04659

Stop Loss 1.05659 

Risk/Reward 1.00

Profit & Loss Per Standard Lot = -$‭‭516.5‬/ +$516.5

Profit & Loss Per Micro Lot = -$51.65/ +$‭51.65

Categories
Forex Signals

Bitcoin breaking the 6,800 Level

The setup

Bitcoin was retracing the two large downward candles made between the past Sunday and Monday. We see also that the descending red trendline, which traces the tops of the underlying downward trend acts as resistance to stop further advances of BTC. The price approached the upper edge of the descending channel and bounced back from the $7,000 key level. Since then, it is behaving weakly. Now the breakout below the 6,800 level shows the sellers are in control.

Key Trading levels

Risk:

  • 1 BTC = $100 risk
  • 0.1 BTC = $10 risk
  • 0.01 BTC = $1 risk

The reward is 2x the risk.


Categories
Forex Signals

AUD/USD Violates Ascending Triangle – Let’s Enter on Retracement 

The AUD/USD pair is trading with a bullish bias on Wednesday, soaring from 0.6190 to 0.6220. Bullish bias in Aussie triggered over a better coronavirus scenario in China, especially after China lifted Wuhan city’s lockdown. Australia’s parliament passed an emergency A$130 billion stimulus package to combat the economy from the coronavirus pandemic, which is helping limit deeper declines and keep the pair above 0.6190 support.

All traders seem cautious due to the latest coronavirus situation and took bids in traditional safe-haven currency. This eventually helped the US dollar and turned out to be one of the key factors weighing on the perceived riskier currency the Aussie. Yesterday, the AUD/USD showed bearish bias, and the reason behind this decline in the Australian dollar was the fact that rating agency S&P reduced the outlook on the country’s AAA sovereign debt rating from stable to negative and expected the Australian economy to fall into a slowdown for the 1st-time since 30 years.

Looking forward, Wednesday’s release of the FOMC meeting minutes will be key to watch. The traders will keep their eyes on the COVID-19 clues for near-term direction. 

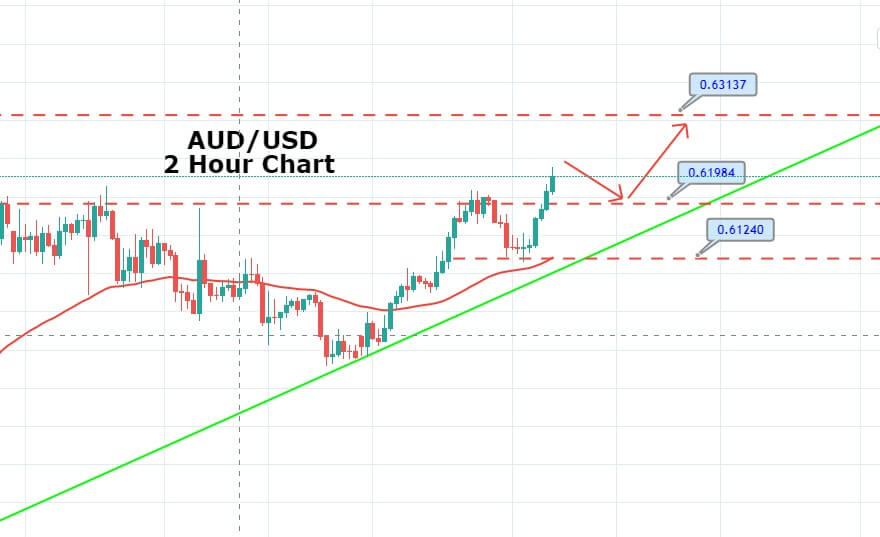
Technically, the AUD/USD has violated the resistance level of 0.6190, and the closing of candles above this level may drive bullish bias in the AUD/USD currency pair. Since the pair has entered the overbought zone, we may see it’s pricing showing a bearish retracement from 0.6225 level to 0.6190, and there we can open a bullish trade. 

On the 2 hour timeframe, the Aussie dollar has formed a bullish channel, while the AUD/USD 50 EMA also supports the bullish bias in the pair. Let’s place a buy limit at 0.61913 with a stop loss of around 0.61313 and take profit at 0.63023.

Buying Price: 0.61913

Take Profit  0.63023

Stop Loss 0.61313

Risk/Reward 1.85

Profit & Loss Per Standard Lot = -$600/ +$1110

Profit & Loss Per Micro Lot = -$60/ +$110

Categories
Forex Signals

EUR/JPY’s Double Top Pattern – Is It Going to Help Sellers? 

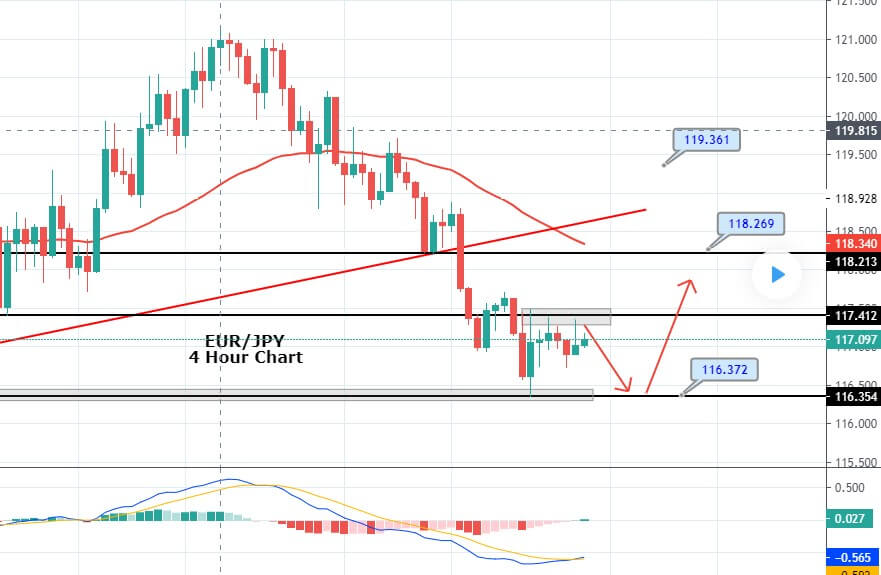
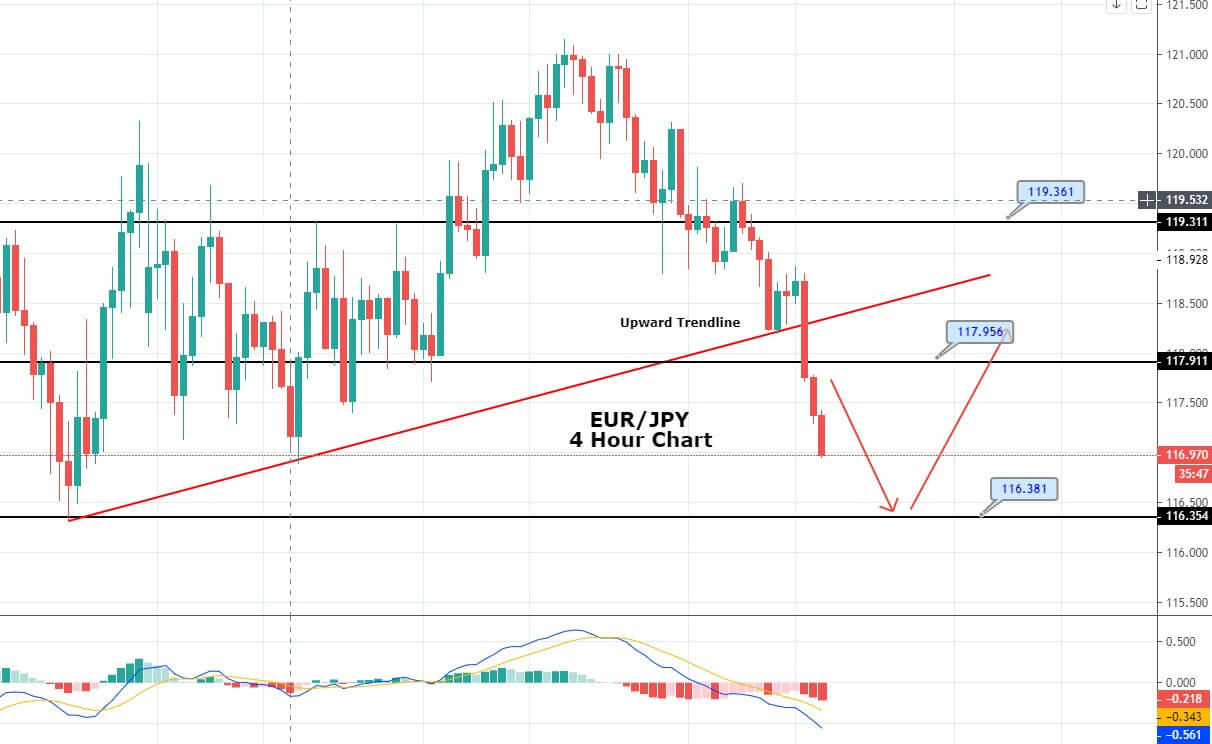
The EUR/JPY is trading at 117.150, holding mostly below a strong resistance level of 117.350, which is extended by the double top pattern. On the 4 hour timeframe, EUR/JPY may find a hard time breaking above 117.350 resistance due to an increased level of uncertainty and safe-haven appeal in the market. Alongside, a series of weaker than expected services PMI figures from the Eurozone may weigh on the EUR/JPY currency pair.

Fundamentally, the EUR/JPY may face bearish pressure due to weakness in the single currency euro. The Markit Eurozone Composite Output Index reported its biggest ever monthly drop in March to place a survey’s historic low of 29.7. Well, the figure isn’t just below the previous month’s 51.6 figure, but it also missed the economist’s forecast of 31.6, which is likely to drive sharp selling in Euro. 


Technically, the EUR/JPY is following a narrow range, which is extending selling bias below 117.450 and bull 116.350. The MACD is still holding around 0, suggesting neutral bias among traders. While the 50 periods EMA continues to support the selling trend in the pair. Today, the bullish breakout of 107.450/650 level may lead the EUR/JPY prices towards 118.300 level. Conversely, a bearish breakout of 116.900 level can drive selling until 116 and 115. 

Entry Price: Sell at 116.801

Take Profit 115.801

Stop Loss 117.601

Risk/Reward 1.25

Profit & Loss Per Standard Lot = -$737/ +$921

Profit & Loss Per Micro Lot = -$73.7/ +$92.1 

Categories
Forex Signals

Bear Continues its Domination

Chart EUR/JPY H1 Chart

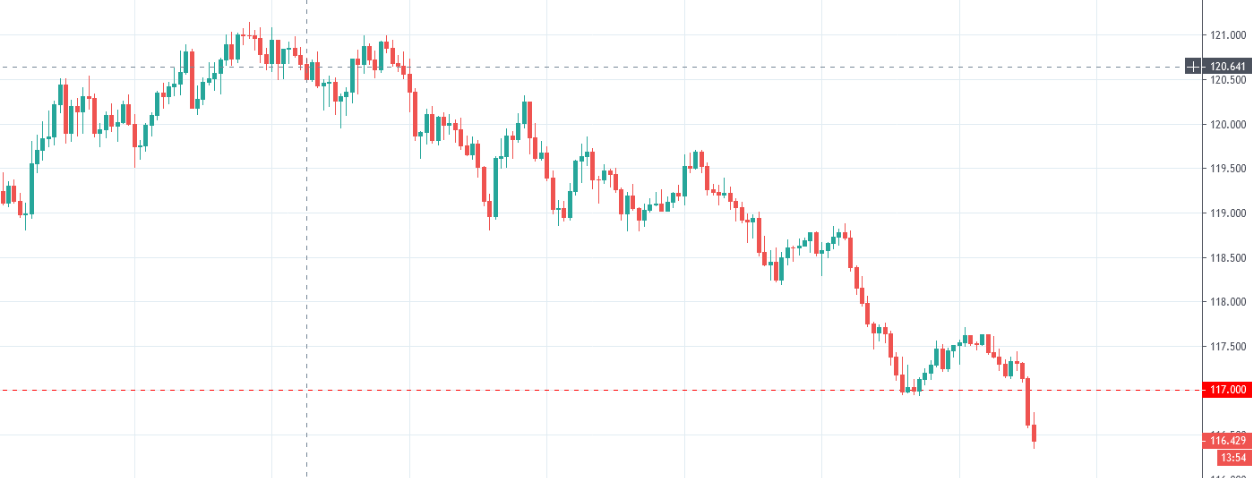
EUR/JPY made a strong bearish move on the H1 chart yesterday. The chart shows that it made a breakout at yesterday’s lowest low today. As of writing, the last candle closed well above the breakout candle. A short entry is triggered at 116.370. The price may head towards the South and find its next support at around the level of 115.255 area.

Let us have a look at the trade summary

Entry: Sell at 116.370

Stop Loss: Above 117.640

Take Profit: 115.255

Categories
Forex Signals

EUR/JPY Heading South to Examine Double Bottom – Buy Limit In Place 

The EUR/JPY is trading bearish, falling from 118.650 to 117 area in the wake of stronger Japanese yen and weaker Euro. On the fundamental’s front, most of the news is anti-Euro, and it’s likely to drive the selling trend in the Euro. 

The Italian administration is ramping up spending projects “significantly” to lessen the financial consequence of the coronavirus. The global central banks are on the move, so the Italian finance department is also pushing considering the death toll, which has now surpassed 12,000. 

At the same time, the headline Italy Manufacturing Purchasing Managers’ Index, which measures the progress in overall business conditions – dropped from 48.7 in February to 40.3 in March to indicate a decline in the health of the Italian manufacturing division for the eighteenth month running. 


On the technical front, the EUR/JPY currency pair is likely to find immediate support at 116.800, but it’s less likely to be held as the pair seems to fall further until 115.350 level. It’s the same level that supported the EUR/JPY pair back on March 9 and 12. Closing of the doji candle or bullish reversal candle will be an indication that investors are respecting this level and may drive buying sooner or later. 

Entry Price: Buy Limit at 116.307

Take Profit 117.307

Stop Loss 115.707

Risk/Reward 1.67

Profit & Loss Per Standard Lot = -$560/ +$934

Profit & Loss Per Micro Lot = -$56/ +$93.4

Categories
Forex Daily Topic Forex Videos

How To Get An Edge In Forex Using Statistical Thinking – Trade Like A Forex Titan Part 4

Stats for Traders IV – Determine the quality of a trading system

To determine if something is good or just a product of randomness is not easy. The pharma industry spends years and costly double-blind studies to determine if a new chemical compound is better than a placebo (distilled water, or just a pill of sugar). This kind of evidence is needed because, as we have seen, almost nothing is sure in mother nature.

How to determine the goodness of data set


Taking the example of the pharma industry, to assess the properties of the new drug, scientists basically create two data sets. One dataset contains all the data measurements of the specimens taking the placebo and another dataset recording the same data of the specimens being administered the drug. So they end up with two groups, and, basically, they want to know if both groups belong to the same statistical distribution or from a different one. The statistical test to do this analysis is called the T-Test.

The T-Test

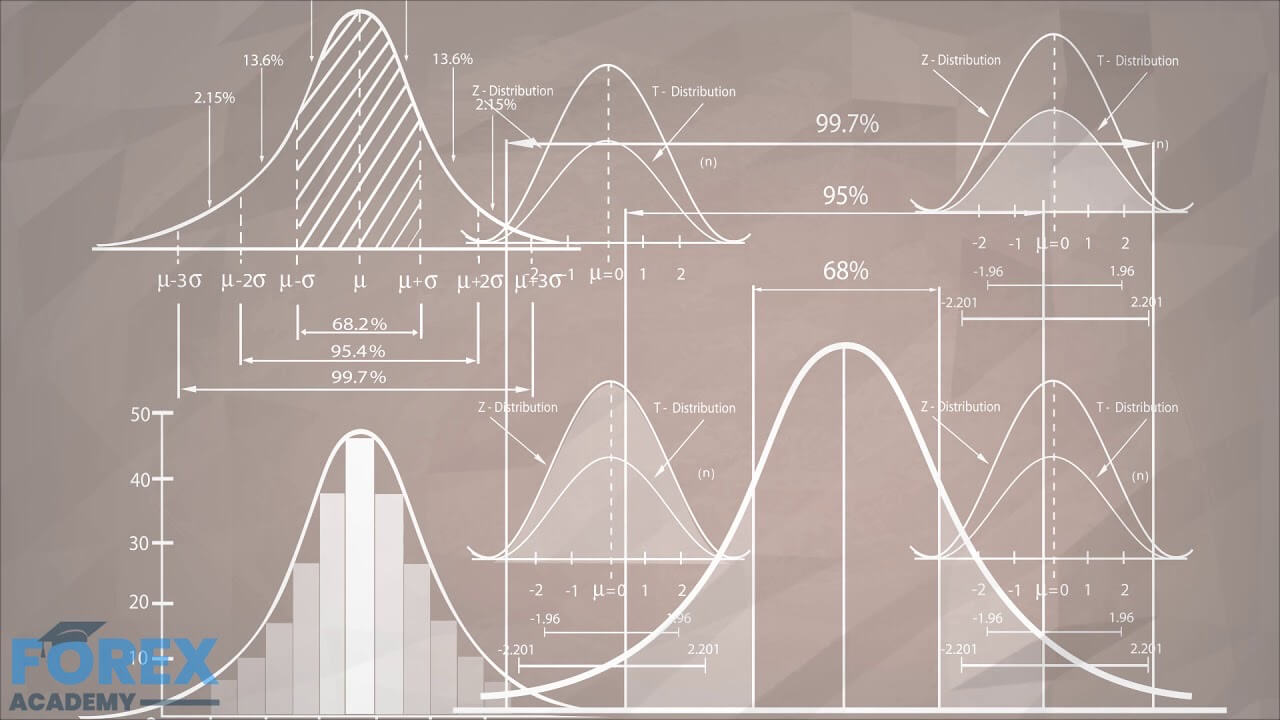
A T-test allows us to compare the average values of the two data sets and determine if they came from the same population. In the case of Pharma, the placebo group is the equivalent of a random sample with a zero mean, and scientists apply the T-Test to see if the average parameters of the group treated with the drug are similar or different from the placebo group. In the case of a trading system, we would like to know how far is the trading system away from a random trading system. The T-Test will answer not just the question of whether the system or strategy has the edge over a random pick, but it enables us to qualify and rank systems.

For a T-Test to be valid, we need to ensure several details! Scales of measurement must be standardized in both data sets. That means, the collection of the data should be standardized with one unit of trade, and preferably also using units of a standard Risk as a description of profits and losses.

The data collected is representative of the system. That means the data should be collected under all possible conditions the system will experience. The number of samples must be as large as feasible, and to comply with point 2 from a large historical database to account for every possible market situation: Bull, bear, sideways with low, mid and high volatility.
The standard deviation on both samples – random and strategy – should be similar. Making sure point 1 is guaranteed, point 4 is also insured.

The basic formula for when the size of both groups is equal:

t = (m1 — m2) / (σ / √N )

where m1 and m2 are the averages of the two groups and sigma σ is the standard deviation of the samples (assuming equal sigma on both)
if m2 is zero (random) the formula simplifies to:

Q = m / (σ / √N )
Where we have changed the t letter for Q, meaning quality, therefore knowing the average m and standard deviation sigma (σ) of a trading system, we can compute its quality Q.

We can look at m as the signal of our system

And σ / √N as the nose of the system.

Therefore, to maximize Q, we need to make m large and the denominator σ / √N as small as possible.

Qualifying trading systems.
From the Q equation, we can see that the denominator σ / √N is the ratio of the standard deviation and the square root of N, the number of trades. This makes it hard to compare systems with a different number of trades since it will make substantially better the same trade system as the number of samples grows.

SQN
Dr. Van K Tharp came with the idea of capping N the trade number to 100, even when the test is made with a large sample number. This way, we can compute m, the mean with all available data, but cut N to 100 to calculate the Q metric. That formula modification is called SQN, or System Quality Number.

SQN is
Q = m / (σ / √N ) when the sample size N is below 100 and
Q = m / (σ / 10 ) when the sample size N exceeds 100.

The SQN reveals if the system is worth trading. Systems below 1 are hard to trade because it presents a noise figure higher than the signal. That will create lots of doubts on a trader because, on multiple occasions, the system will underperform. An SQN of 1.5 is a very decent system, that can be traded with discipline. Systems beyond 2 are sound. If by chance, you end up with a system with SQN greater than 3, you’re a lucky fellow. Please call and share it with us.

The next release will explain how to make use of the SQN to assess the health of the markets.

Categories
Forex Trading Guides Ichimoku

Ichimoku Kinko Hyo Guide – A walk through a trade.

Ichimoku Kinko Hyo Guide – A walk through a trade.

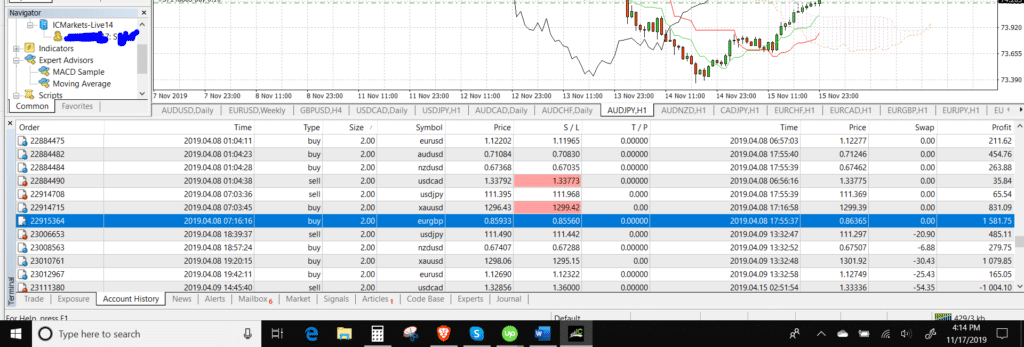
I want to preface this guide with a screenshot of my account.

Trade History
Trade History

The screenshot is a series of some of the trades I’ve made in early April 2019. I do this because this guide on trading with Ichimoku will target the trade that is highlighted. Additionally, I think it is important that if I am showing you an example of a trade for a guide, I should show that I had skin in the game. There are a great many guides and strategies that authors, analysts, and traders suggest, but few will share if they took the trade. The highlighted trade for the EURGBP is the trade I will be using for this guide. It is a great example of the trading methodology I use with the Ichimoku System.


Multiple Timeframe Analysis – Daily, 4-Hour, and 1-Hour

The Ichimoku Kinko Hyo system is most effective when utilizing multiple timeframes. It is the only way that I use the Ichimoku system. In my trading, I use the Daily, 4-hour, and 1-hour time frames. Multiple timeframes are extremely useful in filtering your trade entries and ensuring higher probability trade setups. The process below will go through the process I used to take the trade.

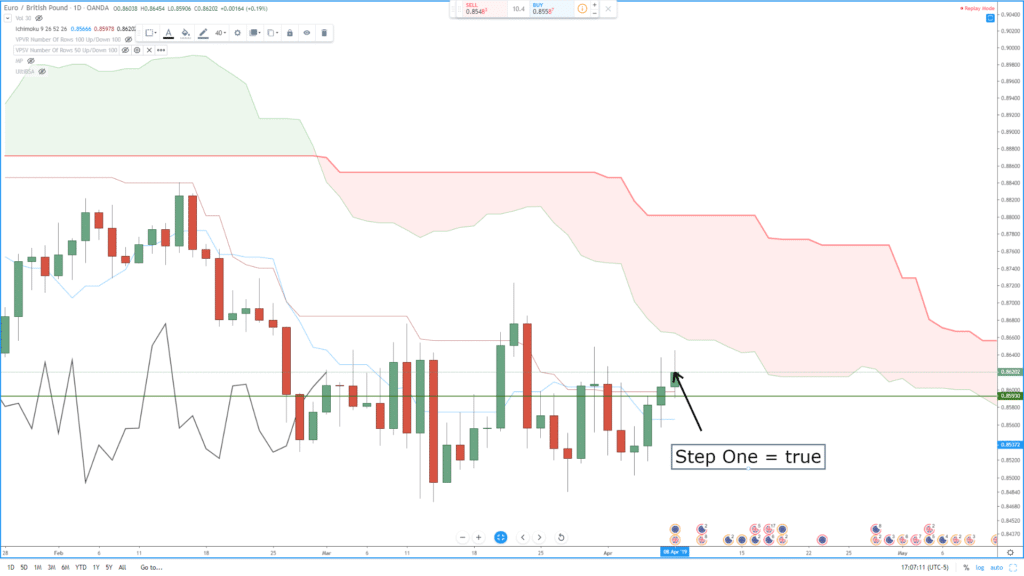
Step One – Daily Chart Check: Price greater than Kijun-Sen, NOT inside the Cloud.

Step One - Check Daily Cloud
Step One – Check Daily Cloud

The very first thing I check is the daily chart. If the price is inside the Cloud on the daily chart, I skip the chart. It’s dead to me. If the price is not inside the Cloud, I then look for where the price is in relation to the Kijun-Sen. The daily chart determines my trading direction. If the price is above the Kijun-Sen, I only take long trades. If the price is below the Kijun-Sen, I only take short trades.

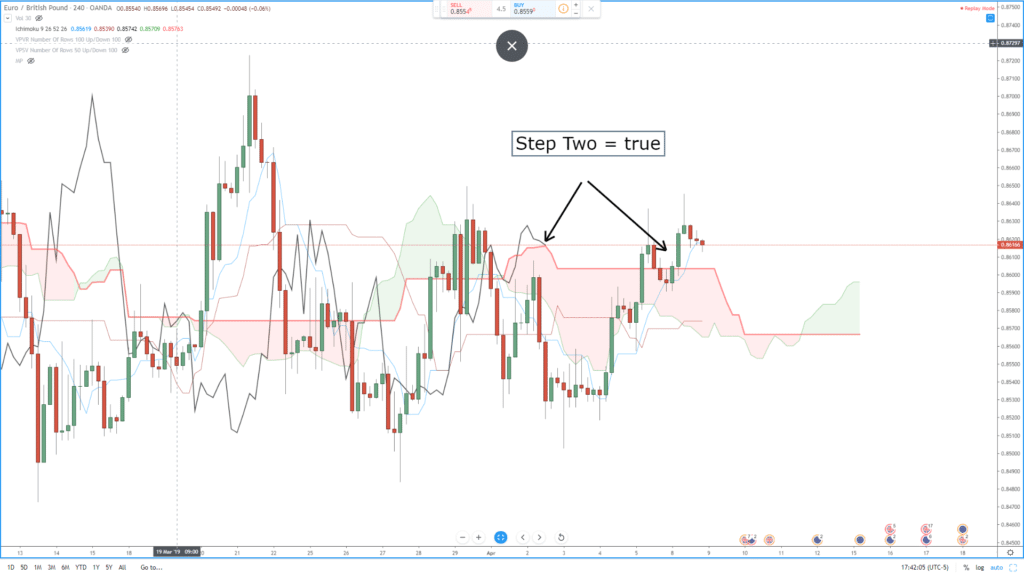
Step Two – 4-Hour Chart Check: Price above the Cloud, Chikou Span above candlesticks.

Step Two - Check 4-hour chart.
Step Two – Check the 4-hour chart.

If the daily chart determines the direction of my trading, the 4-hour provides the filter for the entry chart (the 1-hour chart). The only things I am concerned about with the 4-hour chart is that the Chikou Span is above the candlesticks, and that price is above the Cloud. Preferably, the Chikou Span would also be in ‘open space’ – but I don’t use it as a hard rule. I have not found the open space to be as important during the change of a trend or corrective move.

(a note about ‘Open Space’ – Open Space is a condition where the Chikou Span won’t intercept any candlesticks over the next five to ten trading periods. When the Chikou Span is in open space, this represents ease of movement in the direction of the trend with little in the form of resistance (or support) ahead.)

The EURGBP trade we are analyzing is a good example of why, at the current position, I don’t consider the open space as strict as I would on the hourly. I want to refer you back to the daily chart. If, on the daily chart, both price and the Kijun-Sen are below the daily cloud, but price moves above the Kijun-Sen – I don’t consider the open space variable as important on the 4-hour chart.

Step Three – 1-Hour Chart Check

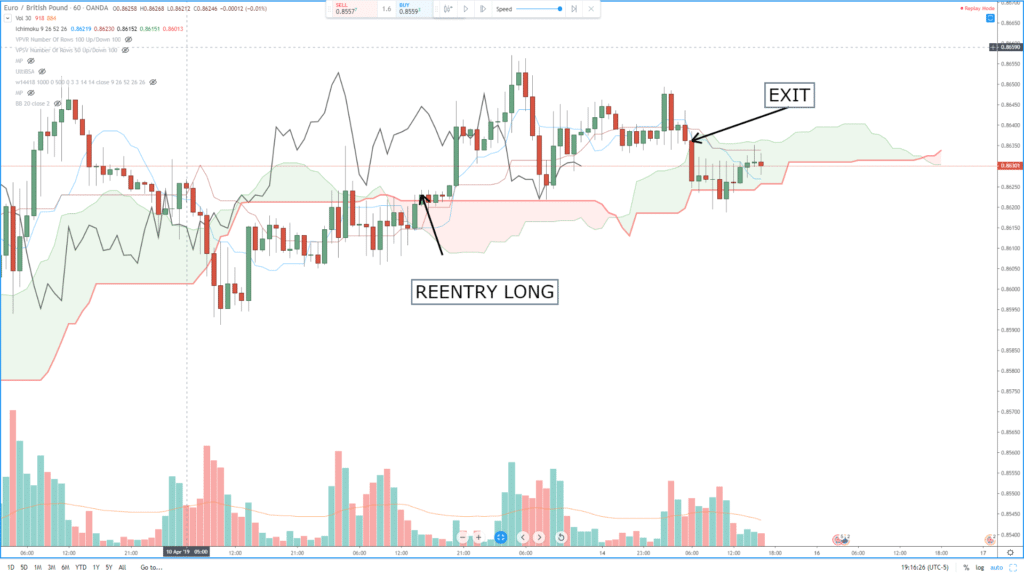
Step Three - 1-hour Entry
Step Three – 1-hour Entry

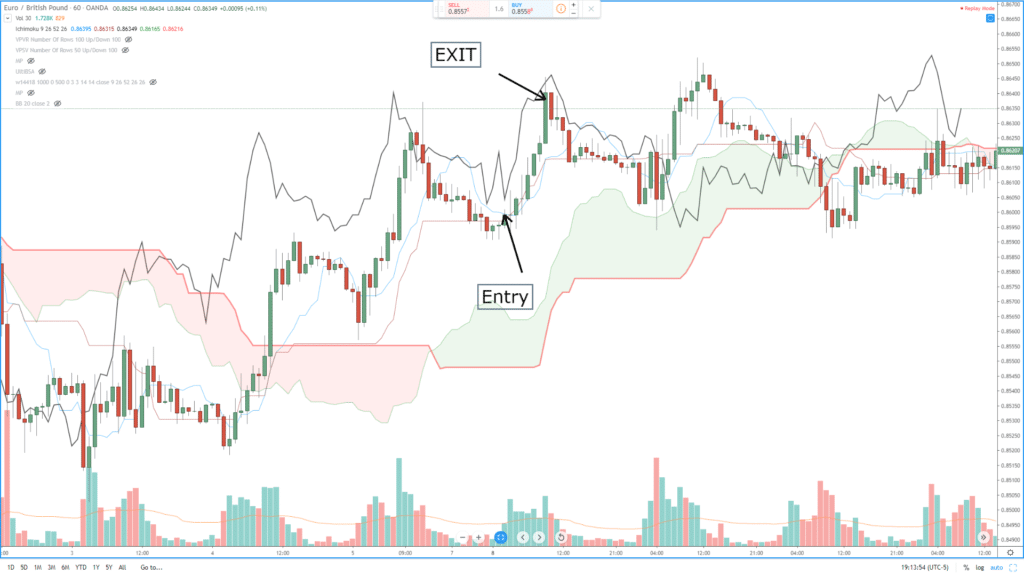
The 1-Hour chart is my entry chart. As long as Step One and Step Two are true, the 1-hour chart is where the bread and butter of the trading occurs. My entry rules are this:

  1. Future Span A is greater than Future Span B.
  2. Chikou Span above the candlesticks and in ‘open space’ – for five periods.
  3. Tenkan-Sen is greater than Kijun-Sen
  4. Price is greater than the Tenkan-Sen and Kijun-Sen.

I generally look for a profit target of 20-40 pips, depending on the FX pair. For example, on the NZDUSD, I would look for 20 pips, and on the GBPNZD, I would look for 40 pips. But there are some hard technical reasons to leave a trade before that profit target is hit. The list below represents my exit rules on the 1-hour Chart – I exit the trade if any of these conditions occur.

  1. Exit if Chikou Span below candlesticks for more than three consecutive candlesticks.
  2. Exit if price enters the 1-hour Cloud.
  3. Exit if Tenkan-Sen below the Kijun-Sen for more than five candlesticks.

Step Four – Reentry Rules

Step Four - Reentry
Step Four – Reentry

Entry rules are fine, but the problem isn’t always finding the entry. One of the hardest problems is creating rules for re-entering a trade. Mine are as follows:

  1. Tenkan-Sen and Kijun-Sen must be above the Cloud.
  2. Chikou Span above the candlesticks.
  3. Price greater than Kijun-Sen and Tenkan-Sen.

A quick summary of steps taken

  1. Checked the daily chart, the price was above the daily Kijun-Sen. The trade direction is long/buy.
  2. Check the 4-hour chart, the price was above the Cloud, and the Chikou Span was above the candlesticks.
  3. All 1-hour rules confirmed an entry; profit taken at 40 pips.
  4. Re-entered trade on 1-hour chart, exited when price entered the 1-hour Cloud.


Sources: Péloille, Karen. (2017). Trading with Ichimoku: a practical guide to low-risk Ichimoku strategies. Petersfield, Hampshire: Harriman House Ltd.

Patel, M. (2010). Trading with Ichimoku clouds: the essential guide to Ichimoku Kinko Hyo technical analysis. Hoboken, NJ: John Wiley & Sons.

Linton, D. (2010). Cloud charts: trading success with the Ichimoku Technique. London: Updata.

Elliot, N. (2012). Ichimoku charts: an introduction to Ichimoku Kinko Clouds. Petersfield, Hampshire: Harriman House Ltd.


Categories
Crypto Market Analysis

LTCUSD Target of 125 From Current Value Area


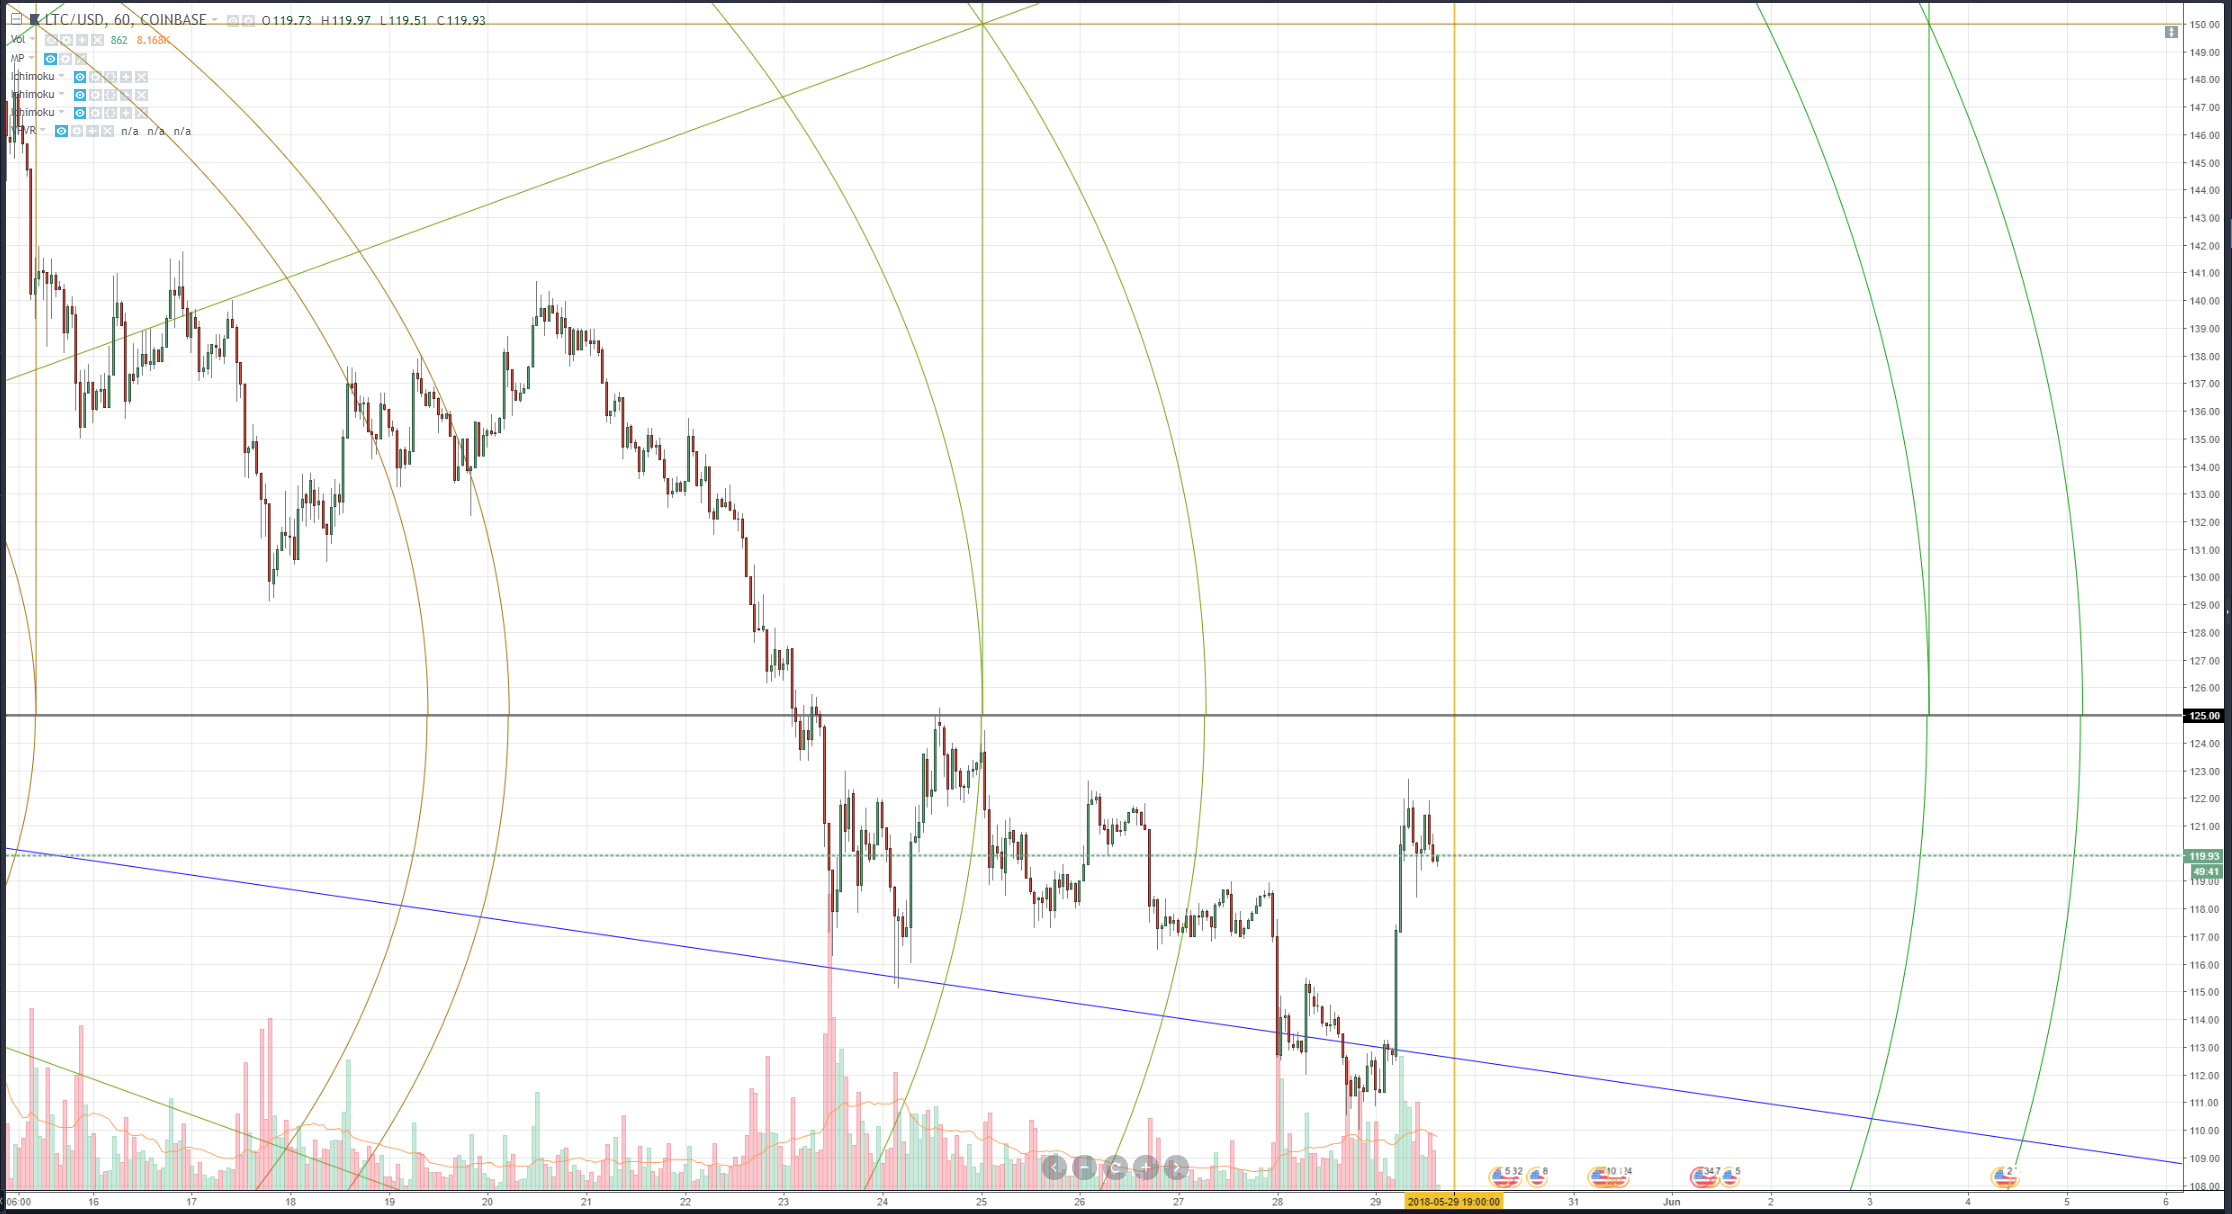
Litecoin has been responding very nicely to the 5×1 angle. It is also right up against a pivot in time. Out of the majors (I consider any currency traded on Coinbase to be a ‘major’), Litecoin is the most sold off and has the least major participation. Fundamentally, it has the most real use value. Considering that the support level was found right inside the 110 value area on that 5×1, the next zone to reach is 125. This brings Litecoin back above and into its major harmonic trading range. It is most definitely the laggard and the major with the most upside potential.

Categories
Forex Market Analysis

EURAUD short Signal

Fantastic conditions have been met for a short signal on the EURAUD pair.

EURAUD

Price is currently a few days before a pivot in time (red vertical line). Price has also been in a firm short-term uptrend over the past 9 days, which itself is a little extended. There is a beautiful bearish candlestick on the daily chart. Additionally, the RSI and CI are in a mirrored structure, with the CI in extremely overbought conditions. Target area should be the 1.594 zone.

©Forex.Academy