Categories
Forex Signals

NZD/USD Sell Signal Update – Quick Outlook! 

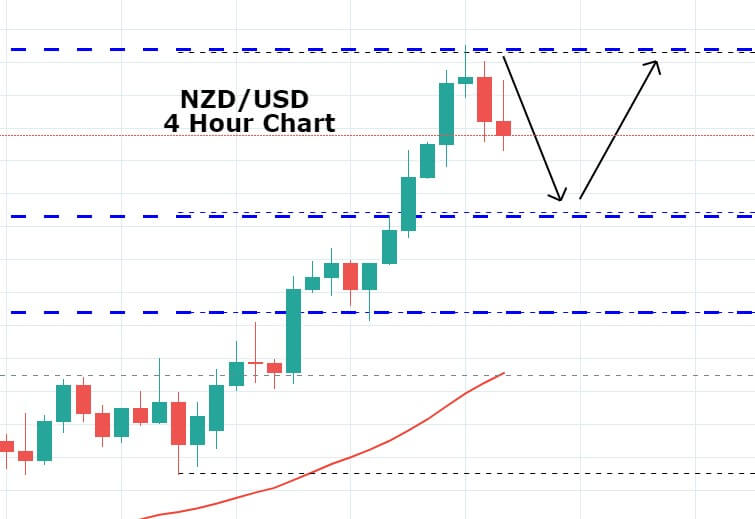
The NZDUD pair is trading at 0.7229 level, gaining immediate support around the 0.7224 mark. A bearish breakout of 0.7224 level can extend selling until 0.7214 and 0.7201. Conversely, a breakout of 0.7240 can lead the NZDUSD pair towards 0.7280.


Entry Price – Sell 0.72255

Stop Loss – 0.72655

Take Profit – 0.71855

Risk to Reward – 1:1

Profit & Loss Per Standard Lot = -$400/ +$400

Profit & Loss Per Micro Lot = -$40/ +$40

Fellas, now you can check out forex trading signals via Forex Academy mobile app. Follow the links below.

iPhone Users: https://apps.apple.com/es/app/fasignals/id1521281368

Andriod Users: https://play.google.com/store/apps/details?id=academy.forex.thesignal&hl=en_US

Categories
Forex Fundamental Analysis

NZD/USD Global Macro Analysis – Part 3

NZD/USD Exogenous Analysis

To effectively compare the US and the New Zealand economies, we will conduct exogenous analysis using the following fundamental aspects;

  • The US and New Zealand balance of trade difference
  • GDP growth differential in the US and New Zealand
  • The US and New Zealand interest rate differential

The US and New Zealand balance of trade difference

A country’s participation in international trade tends to determine the demand for its domestic currency. If a country is a net exporter, its currency will be in high demand in the forex market, increasing its value against other currencies.

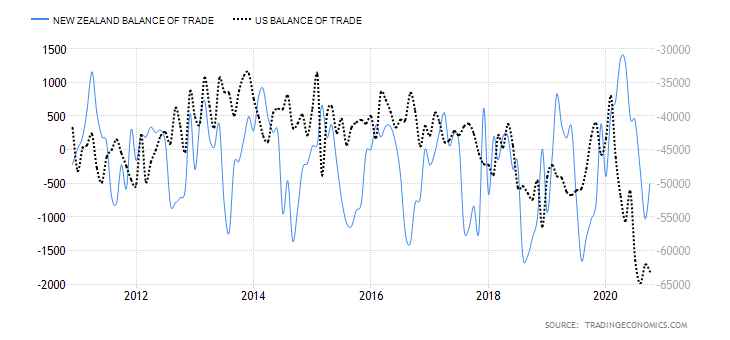
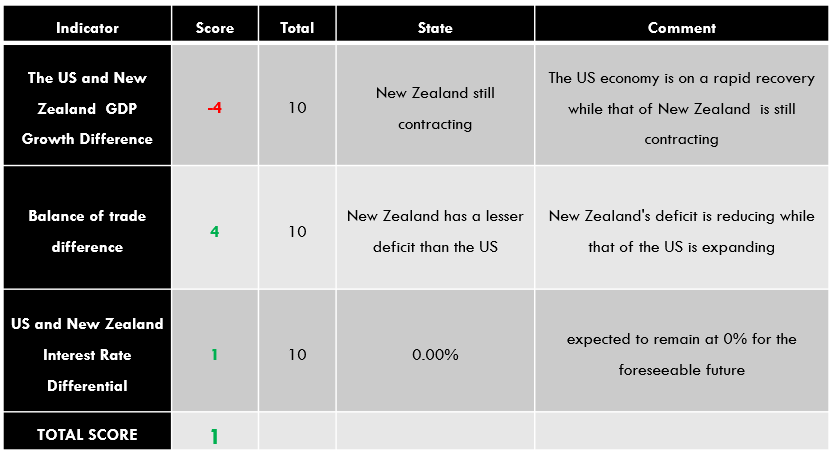
In October 2020, New Zealand’s trade deficit was NZD 500 million compared to the US trade deficit of $63.1 billion. Although New Zealand’s trade deficit is improving, it is still lower than the balance of trade in January. On the other hand, the US trade deficit has been widening throughout the year. The difference between the two countries’ balance of trade is the trade deficit differential. Based on its correlation with the price of the NZD/USD pair, we assign a score of 4.

GDP growth differential in the US and New Zealand

GDP growth differential is the difference between the rate at which the US and New Zealand economies are expanding. It will help to show which economy is growing at a faster pace hence impacting the exchange rate between the two countries. A country whose GDP is expanding faster will enjoy favorable domestic macroeconomic conditions. Hence its currency will appreciate.

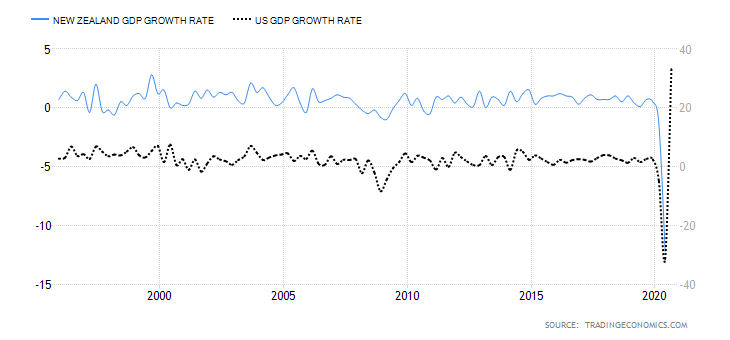
In Q3 of 2020, the New Zealand GDP contracted by 12.2% while that of the US expanded by 33.1%. That represents a GDP growth rate differential of 45.3%. If this trend continues, we should expect that the USD will strengthen against the NZD hence a bearish NZD/USD pair.

Based on our correlation analysis, we assign the GDP growth differential between the US and New Zealand a score of -4.

The US and New Zealand interest rate differential

The interest rate differential is the difference between the prevailing interest rates in New Zealand and the US. The country with a higher interest rate tends to attract more capital, inceasing the value of its currency.

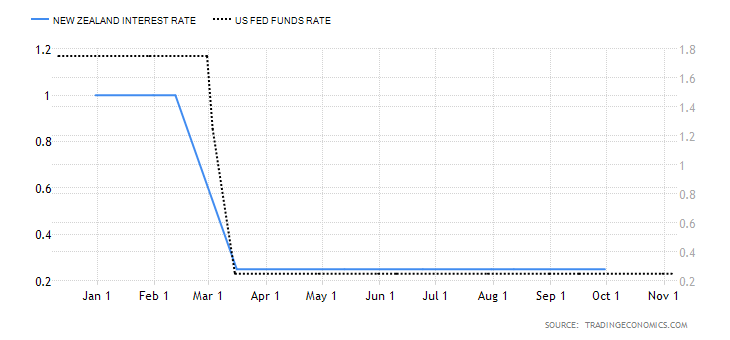
At the onset of the coronavirus pandemic, the Reserve Bank of New Zealand cut its official cash rate from 1% to 0.25%. During the same period, the US Federal Reserve cut the interest rate from 1.75% to 0.25%. Presently, the interest rate differential in NZD/USD is 0%.

Based on the correlation with the price of the NZD/USD pair, we assign a score of 1.

Conclusion

The NZD/USD pair has an exogenous score of 1. That means we should expect that the pair will continue on a mild bullish trend in the short-term. Note that this trend is also supported by technical analysis.

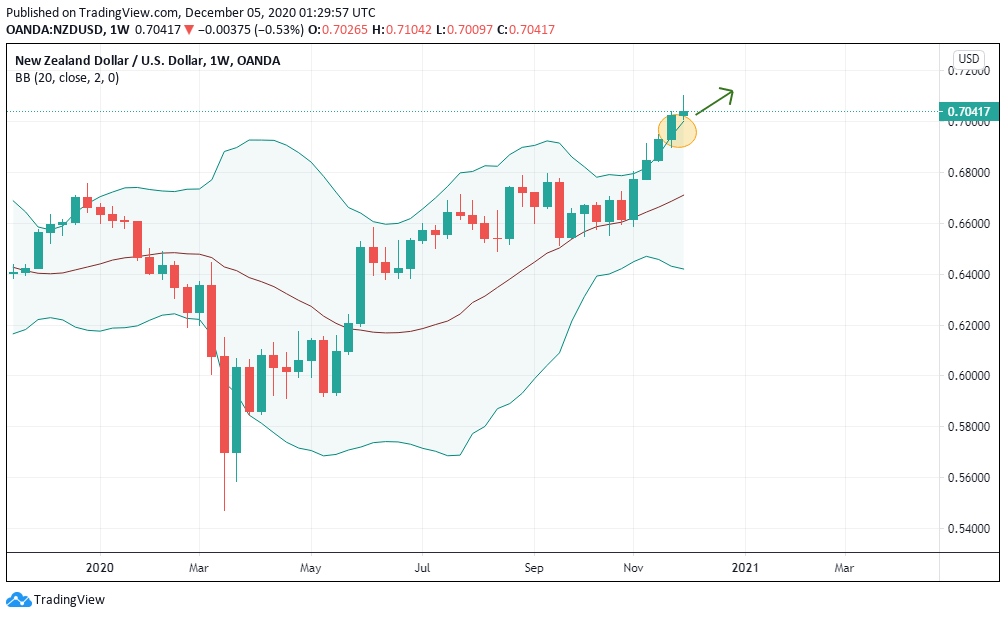
As seen in the above 1-week chart, the NZD/USD has successfully breached the upper Bollinger band indicating bullish momentum. This supports our fundamental analysis, as well. All the best.

Categories
Forex Fundamental Analysis

NZD/USD Global Macro Analysis – Part 1 & 2

Introduction

The global macro analysis of the NZD/USD pair will involve the endogenous and exogenous analyses of the US and New Zealand economies. The endogenous analysis will focus on domestic macroeconomic factors that drive the economy. The exogenous analysis will focus on economic indicators that comprehensively compare both the US and New Zealand economies.

Ranking Scale

Both the endogenous and exogenous factors will be ranked on a scale of -10 to +10. A negative ranking for the endogenous means that the factor had a negative impact on either the currency, while a positive ranking had a bullish impact on the currency.

Similarly, when the exogenous factor is negative, it has a bearish impact on the currency pair, while a positive ranking means it had a bullish impact.

Summary – USD Endogenous Analysis
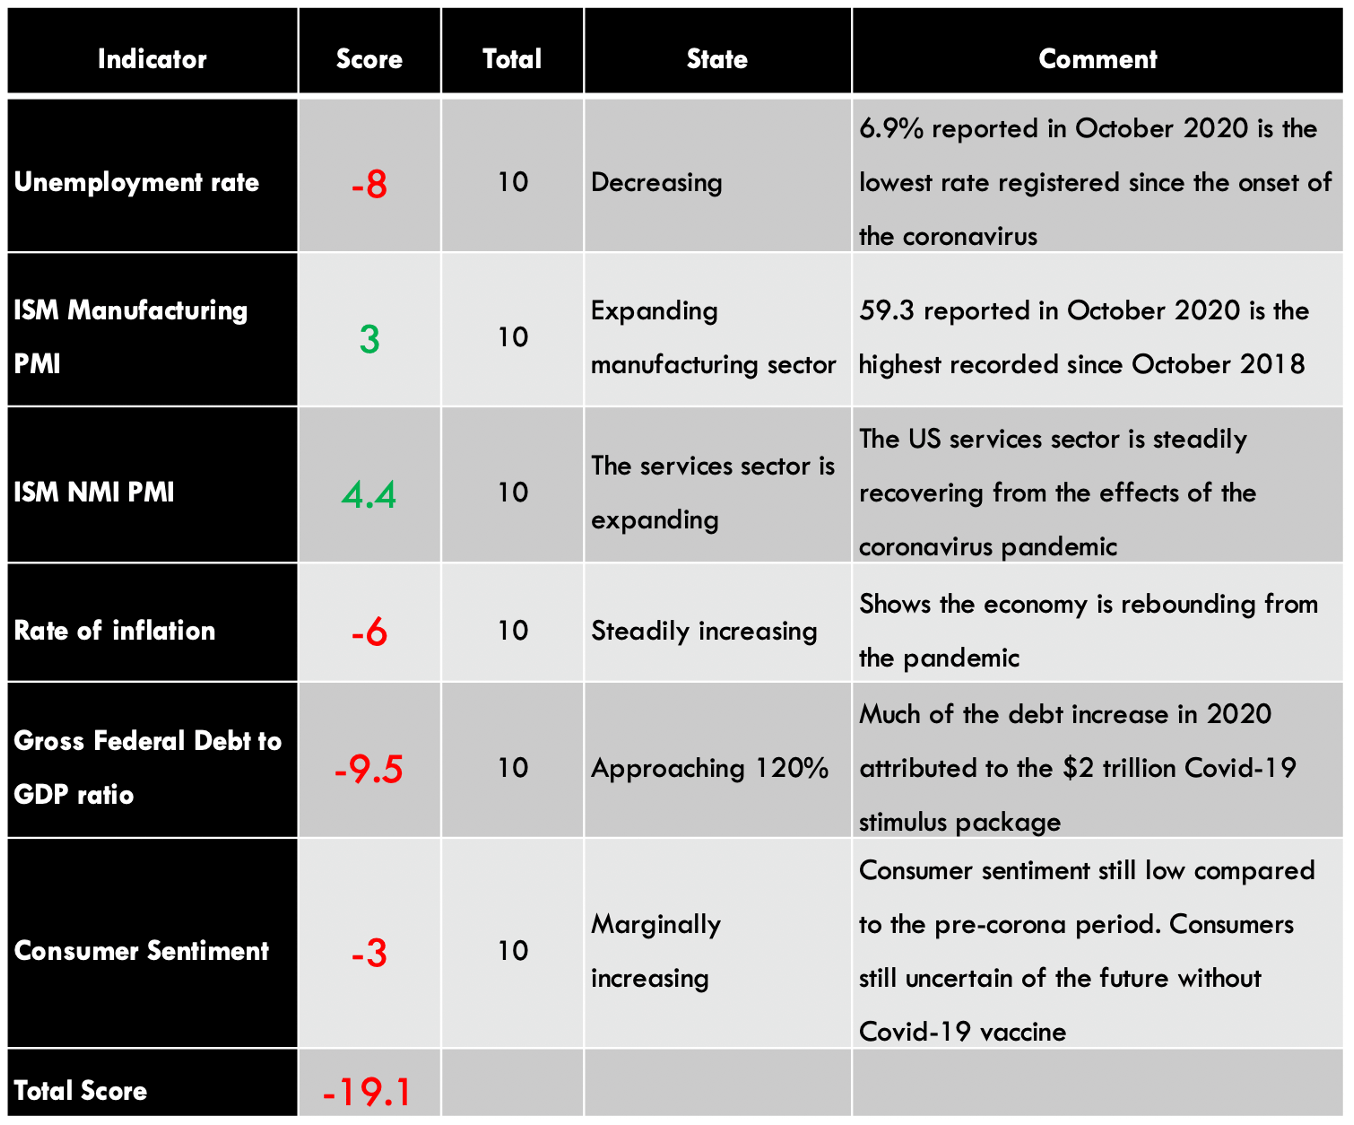
From the above table, a clear deflationary effect can be seen on the USD currency and implies that USD has depreciated in its value since the beginning of 2020. For the complete USD Endogenous Analysis, please check here.

Summary – NZD Endogenous Analysis

The NZD endogenous analysis has a total score of 4. This shows that the NZD appreciated in 2020.
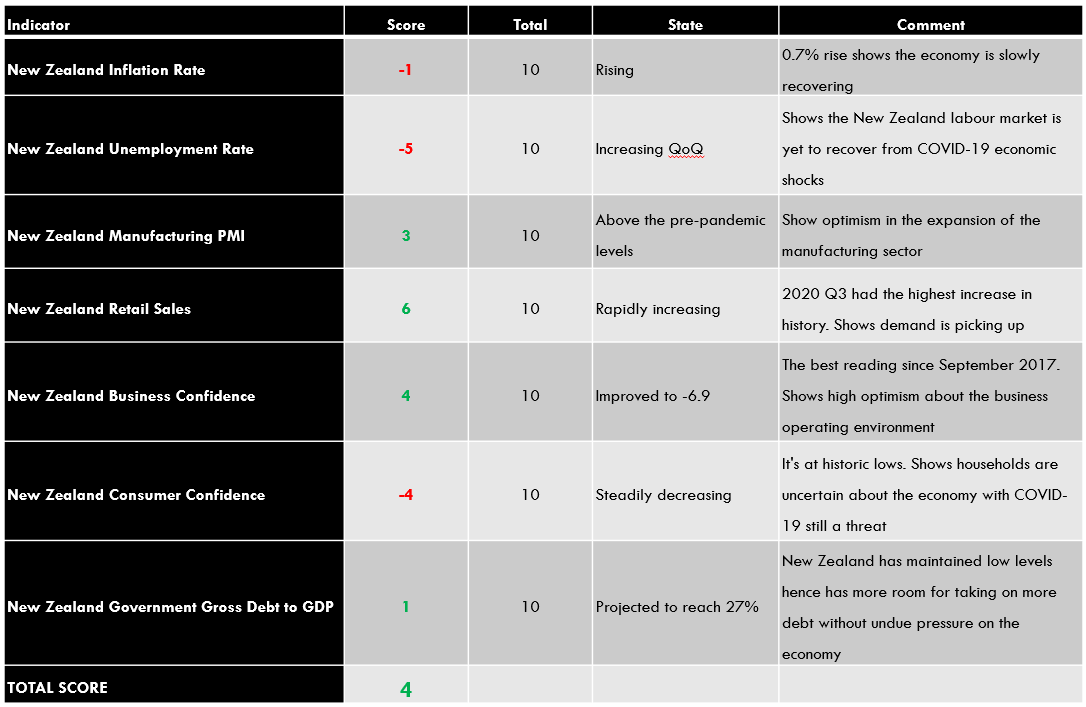
  • New Zealand Inflation Rate

The CPI is the most commonly used measure of inflation in New Zealand. Here are the top categories included in the CPI: Housing with a weight of 24.2%; food and non-alcoholic drinks 18.8%; transportation 15%; recreation 9.4%; alcoholic drinks 7%; clothing, household goods and services, health, and education all have a combined weight of 18.2%.

In September 2020, New Zealand CPI increased by 0.7%. Based on the correlation with the GDP, we assign a score of -1.

  • New Zealand Unemployment Rate

This rate shows the number of New Zealand’s working population out of work and actively looking for gainful employment. As an economic indicator, it can be used to show the economy’s ability to add new jobs to the market.
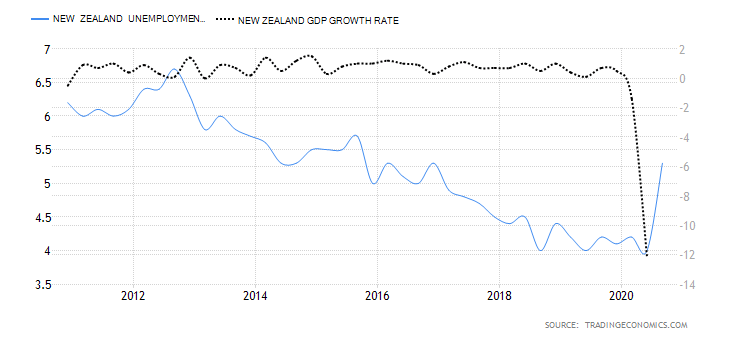
In Q3 of 2020, the New Zealand unemployment rate increased to 5.3% from 4% in Q2. This shows that the labor market is yet to recover from the economic shocks of the coronavirus pandemic. Based on correlation analysis, we assign a score of -5.

  • New Zealand Manufacturing PMI

This is an index that measures the growth in the manufacturing sector in New Zealand. It is a composite of new orders, employment, inventories, and orders delivered from the manufacturing sector. When the index is above 50, it means that the manufacturing sector in New Zealand is expanding. The sector is seen to be contracting when the index is below 50.

In October 2020, the index declined to 51.7 from 54. However, the index is above the pre-coronavirus levels. That implies the manufacturing sector is recovering swiftly. Based on the correlation analysis with GDP, we assign it a score of 3.

  • New Zealand Business Confidence

In any economy, business confidence goes hand-in-hand with business confidence. In New Zealand, the business confidence index is based on a survey of about 700 businesses. The index is the difference between the number of businesses that anticipate economic improvements and those that expect the economic conditions will decline. The index covers export intentions, profit expectations, employment intentions, activity outlook, and capacity utilization.

In November 2020, the ANZ Business Confidence was -6.9 compared to -15.7 in October. Although in the negative territory, the November reading is the highest since September 2017. This shows that more businesses are becoming optimistic about the future operating environment, mostly thanks to the aggressive expansionary monetary and fiscal policies.

Based on correlation analysis with the GDP, we assign ANZ business confidence a score of 4.

  • New Zealand Retail Sales

In New Zealand, retail sales data is aggregated quarterly. It measures the change in the value of goods and services purchased by households. Remember that consumer expenditure is the main driver of economic growth, which makes the retail sales data a leading indicator of GDP growth.
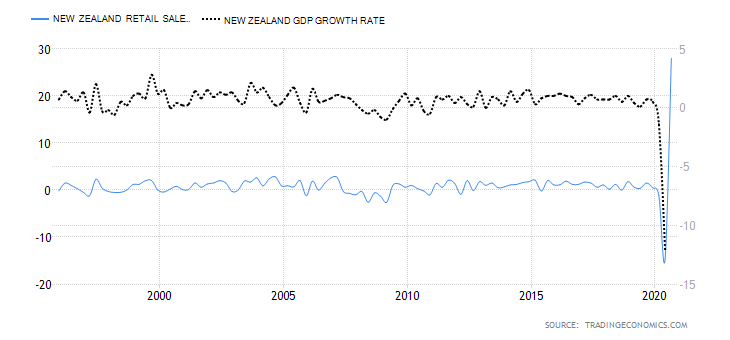
In Q3 of 2020, the New Zealand retail sales increased by 28% from a drop of 14.6% and 1.2% in Q2 and Q1, respectively. The 28% increase is the largest quarterly increase in 25 years. The YoY retail sales increased by 8.3% in Q3 compared to a 14.2% drop in Q2. Based on our correlation analysis, we assign the New Zealand retail sales a score of 6.

  • New Zealand Consumer Confidence

In New Zealand, consumer confidence tends to correlate with households’ willingness to spend in the economy. The Westpac McDermott Miller Consumer Confidence Index gauges the optimist of New Zealand households regarding the economy. The index covers households’ views on their finances, purchases in the economy, and the overall economy.

A score of above 100 shows an increasing level of optimism, while below 100 shows increasing pessimism.
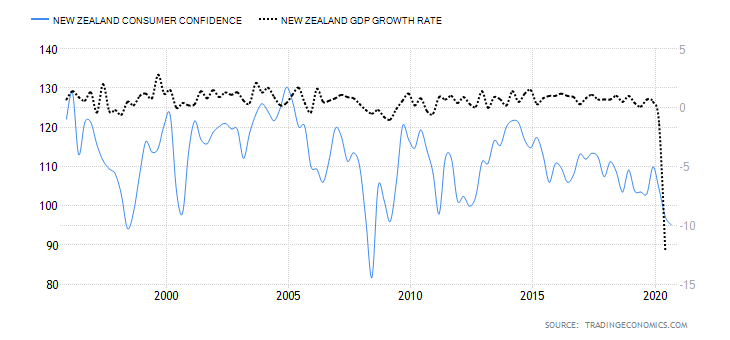
In Q3 of 2020, the New Zealand consumer confidence index dropped to 95.1 from 97.2 in Q2 and 104.2 in Q1. Q3 reading is the lowest in New Zealand since 2008. Based on its correlation with GDP, we assign a score of -4.

  • New Zealand Government Net Debt to GDP

Gross national Debt to GDP helps both local and foreign creditors gauge a country’s ability to service its debt. This indicator shows the level at which the domestic economy is leveraged. A lower ratio is preferable since it means that the country has a higher GDP compared to its debt. This means that it can be able to access cheap debt in the future.
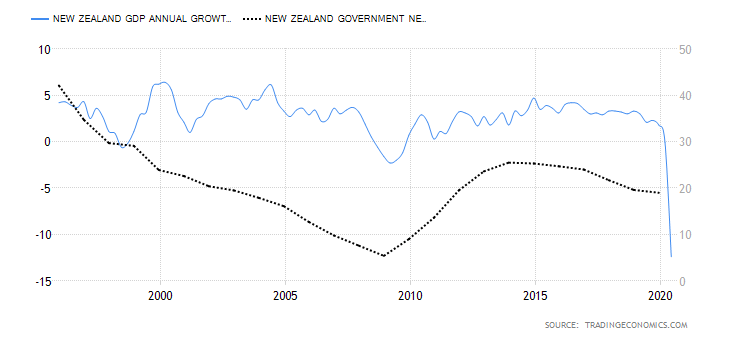
In the 2018/2019 fiscal year, the New Zealand government debt to GDP dropped to 19% from 19.6% in the 2017/2018 fiscal year. In 2020, the New Zealand government debt to GDP is projected to increase to 27% on account of the government’s aggressive spending to ease the economic pressure from the coronavirus pandemic. Based on correlation analysis with GDP, we assign New Zealand government debt to GDP a score of 1.

In the very next article, let’s analyze the exogenous indicators and forecast if this currency pair seems to be bullish or bearish in the near future.

Categories
Forex Signals

Sellers Loom in the NZD/USD Pair – Fibonacci Retracement Expected! 

The NZD/USD pair is trading bearish at 0.6375 level in the wake of profit-taking in New Zealand. The growing optimism about the easing of lockdown restrictions in most of the countries fueled the hopes for the sharp V-shaped recovery for the global economy, which eventually undermined the safe-haven U.S. dollar. The reason for the selling bias in the U.S. dollar could be associated with the absence of any conflicting news from the US-China, which ultimately boosted the market’s risk sentiment.

As in result, the broad-based U.S. dollar was sold during the day and pushed the currency pair further lower. Whereas, the U.S. Dollar Index, which tracks the greenback against a basket of six other currencies, stood at 97.362, down 0.3%, fell to levels last seen in the middle of March.

Apart from this, the risk-on market sentiment was further bolstered by the positive news that U.S. President Donald Trump stepped back from its previous day’s decision to use Federal militaries to halt the on-going protests near White House. Consequently, the dollar can gain support and drive the selling trend in the NZD/USD pair.


Technically, the NZD/USD prices are holding in the overbought zone at 0.6387, and soon we can expect bearish bias in the pair. The 50 EMA is holding around 0.6233, which signifies that technically the prices should be trading around 0.6233 level. The MACD has also started closing smaller histograms, which are also suggestings that NZD/USD prices can go after 38.2% Fibonacci support, which holds around 0.63256 level. 

Entry Price – Sell 0.63986

Stop Loss – 0.63978

Take Profit – 0.63586

Risk to Reward – 1.00

Profit & Loss Per Standard Lot = -$400/ +$400

Profit & Loss Per Micro Lot = -$40/ +$40

Categories
Forex Signals

Hard Luck, NZD/USD Stopsout – Let’s Focus On USD/CAD Setup! 

Earlier today, the NZD/USD trading signal got into losses and closed at stop-loss, costing us 60 red pips, even before we could update about its setup. The market is quite uncertain today and moving sideways without any clear setup. Anyways, now let’s take a look at the USD/CAD pair as it’s been on the move since the U.S. session has begun. 

A day before, the USD/CAD pair was closed at 1.41447 after placing a high of 1.41569 and a low of1.40226. Overall the movement of the USD/CAD pair remained bullish throughout the day. The pair USD/CAD posted dips during the Asian and European sessions following the reports of U.S. crude oil inventories showed a rise and reignited the oversupply concerns and hence affected the crude oil prices.

According to the American Petroleum Institute, the stockpiles of crude oil last week raised by 8.4Million barrels, which was more than the expected. 

Despite such inventory data, crude oil is making a bullish movement, causing a downtrend of USD/CAD was the report of Non-Farm Payrolls from the US ADP on Wednesday. 

The drop of more than 20 million jobs fell under the expectations and helped the U.S. dollar to pick up the pace. Strong U.S. dollar across the board added in the upward movement of USD/CAD pair and took its prices near 1.4157 level.

In the absence of any macroeconomic data from Canada, the pair USD/CAD relied on the U.S. dollar and crude oil prices on Wednesday. At 19:30 GMT, the Crude Oil Inventories from Energy Information Administration for last week showed that inventories dropped to 4.8M from 8.5M of expectations. The U.S. dollar was also strong on Wednesday due to the easing of lockdown measures across the globe, and this added in the rise of USD/CAD prices.


Daily Technical Levels

Support Resistance

1.4003 1.4093

1.3959 1.4139

1.3912 1.4183

Pivot Point: 1.4049

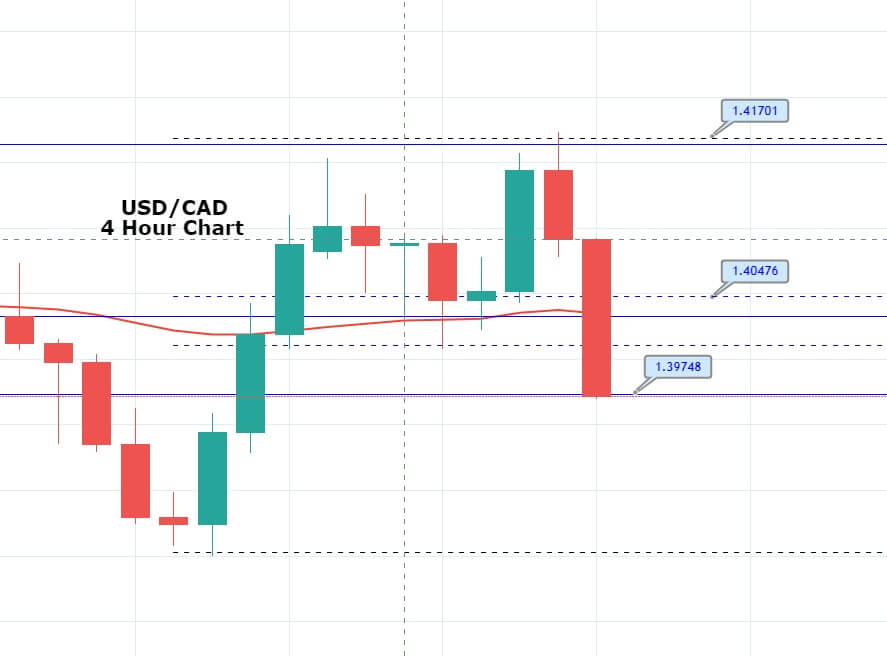
For now, the USD/CAD pair is making a strong sell movement, having dropped from 1.4130 to 1.3975 level. The pair has already completed 61.8% Fibonacci retracement at 1.3975, and below this, it can head to the next support level of 1.3900 level. Let’s keep an eye in 1.4020 level today, as selling trades can be seen below this level with a target of 1.3850 level. Good luck! 

Categories
Forex Market Analysis

NZD/USD long – attractive risk-reward ratio potential.

NZD/USD


The bigger picture on NZD/USD is very clear from the Elliott wave perspective. We see nice unfold of 5 waves down, starting from February 2018. The final move could be labelled as an ending diagonal pattern, which showing us a squeezing of the price action, and bear forces weakening, which should be followed by the strong sharp move up or pullback in at least 3 legs up, usually a zig-zag A-B-C pattern. Also, this trade could give us a very attractive risk-reward ratio potential.


DXY


As you can see on the chart, currently we are tracking the A-B-C zig-zag pullback pattern. We have two option, depending on how patient we are. The first one is to buy here with the target above the previous high 95.75 or to wait for this b wave of the A-B-C pattern to be finished in the 50-61% Fibo retracement area, and then to sell DXY with higher profit potential.


USD/CAD


As we expected the pair retraced and currently testing the previous resistance, now support level, which stands around 50% Fibonacci retracement. This is our sweet spot to start buying and building gradually our long position. Sooner or later we will see some sharp moves higher above the previous higher high 1,3226. because this leg should be labeled as a wave 3, which is usually the longest and the strongest.


AUD/USD


The bigger picture on Aussie is clear, the current price action is labelled as a wave 5, the final Elliott wave. On a smaller picture, the situation is a bit tricky, since we do not have yet any confirmation of when and where the pullback will start. So, for now, we should stay in a wait and see mode. We know for sure that the wave 5 must overcome the wave 4, so on a bigger picture we do expect Aussie weakening, but current market does not give us yet the good risk-reward trading opportunity.