Categories
Forex Assets

Fundamentals of the Australian Dollar (AUD) and the New Zealand Dollar (NZD)

The two currencies, the Australian Dollar and the New Zealand Dollar are quite highly correlated, which is why this article will deal with them both at the same time. Here, we’ll cover their historical backgrounds, economic impacts, correlation, recent market activity, and much more. 

Historical Background

Australia was populated by the British in an attempt to alleviate the overcrowded capacity of British prisons and grow the British Empire. The new colony grew to the extent that they created their own government in the end. The Australian Dollar, which is also known under the ISO symbol of AUD, is one of the top 10 currencies in the world. When compared to the country’s size, as well as that of its population and economy, the official currency of Australia is truly impressively ranked among other world currencies. This currency replaced the Australian pound in 1966 and is now considered a proxy for some vital strategies in the currency market. As opposed to the EUR/USD or USD/JPY crosses, which entail a number of goods and services trades that get intertwined with currency trades, the AUD’s privileged position mostly stems from forex trading alone.

Apart from the name and the symbol, the currency is nowadays also referred to as $A, $AU, or Aussie. Similar to the AUD, the New Zealand Dollar (ISO symbol: NZD) is one of the most traded currencies worldwide, which is again an interesting fact considering the quantity of goods and services exchange between New Zealand and the rest of the world. Another manner in which the NZD resembles the AUD is the impact of forex trading on currency strength. The other terms the NZD is also known by are NZ dollar, kiwi, or $NZ.

Most Traded Pairs

The most traded pairs are the two currencies against other major currencies, in particular against the USD, JPY, EUR, and GBP. Most liquidity of these two currencies and their most common pairs is generated from trading. Compared to the EUR/CHF cross, which is influenced by the goods and services (money) exchange between Europe and Switzerland, the liquidity in AUD and NZD pairs is an important difference. Currency pairs such as AUD/CAD or NZD/CHF involve very few trades of goods and services, so the money exchange mostly comes from traders, who are also not so great in numbers when it comes to these crosses.

Whenever liquidity is low, traders are faced with wide spreads and increased volatility especially with regard to news events. News announcements greatly impact the currency market’s trades of NZD and AUD, which is why crosses such as AUD/CHF and NZD/CHF are considered dangerous around the time any news comes out. Therefore, the most important question in terms of trading these two currencies is liquidity, which is why professional traders mostly focus on the crosses including the USD, JPY, EUR, and GBP.

Central Banks

Before the establishment of Australia’s central bank, the Reserve Bank of Australia (RBA), in 1960, the country relied on the Commonwealth Bank of Australia to issue the currency for the country. This task was moved away from the private bank into the government, which is responsible for the monetary policy at present. The RBA numbers nine employees who are all appointed by the government. The current Chair of the RBA is Mr. Philip Lowe, who took over the position from Mr. Glenn Stevens in 2016. The RBA holds 11 meetings per year on the first Tuesday of the month (all except January) when traders can expect announcements will be issued. The bank has a trifold mandate, with the stability of the currency, i.e. price stability and fighting inflation, being their primary goal. Their second aim is to maintain employment across the country, whereas the last one is the economic prosperity and welfare of people in Australia.

Unlike the ECB, whose mandate is more singular (inflation), the mandate of the RBA is quite wide. This comprehensive list of goals and tasks enables them to be rather flexible with regard to monetary policy. Australia and New Zealand are generally likely to show similarities in terms of economic policy. New Zealand’s central bank, the Reserve Bank of New Zealand (RBNZ), was established in 1934. The RBNZ comprises 10 members/governors who meet eight times a year. As of 2016, Professor Neil Quigley has been working at the position of Chair of the bank. The bank has a single mandate – price stability, yet unlike the ECB, the RBNZ seems to be more flexible. 

Economies

Australia, the 10th largest economy in the world, is strong in mining and agriculture, which make more than half of the country’s exports. Australia is a major commodities (iron, gold, etc.) exporter to Asian countries. Australia’s largest trading partner is China, which is an important fact for the currency market traders. The Chinese yuan (CNY) is, like the Indian rupee (INR), not allowed outside the country, which is why Australia and New Zealand are the means to get to this currency. This is why there is so much volume in these currencies despite the fact that they are not the largest economies in the world. Traders interested in the AUD are always advised to think of the strength of mining in Australia, commodity prices, and China. New Zealand’s economy is slightly behind Australia, ranked 16th in the world. Their economy is mostly focused on agriculture, which is why the country largely exports food and textile. New Zealand’s largest trading partner is China as well.

Economic Reports

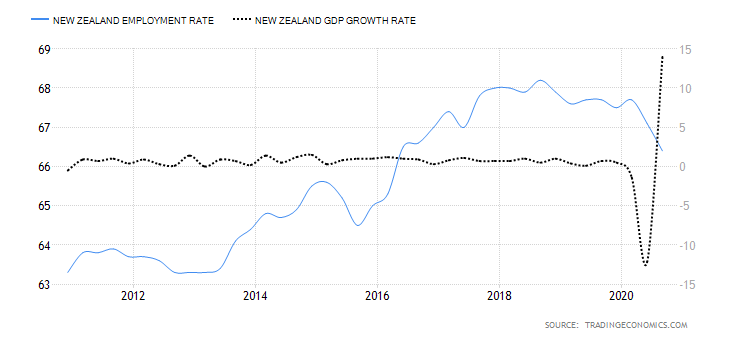
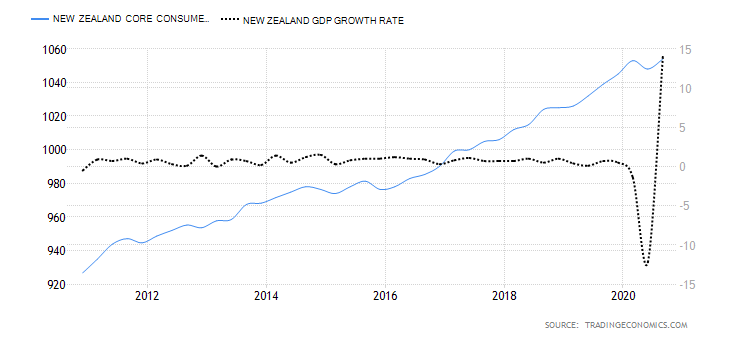
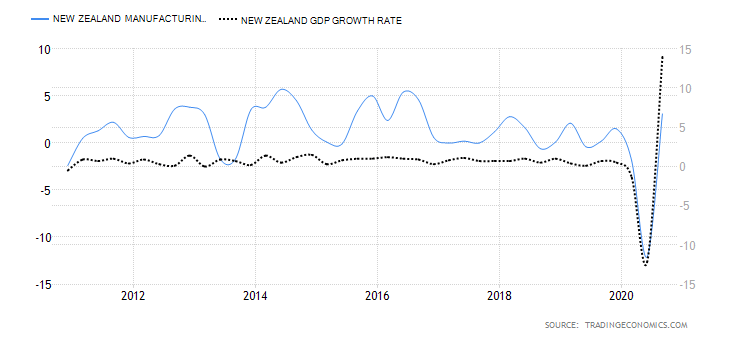
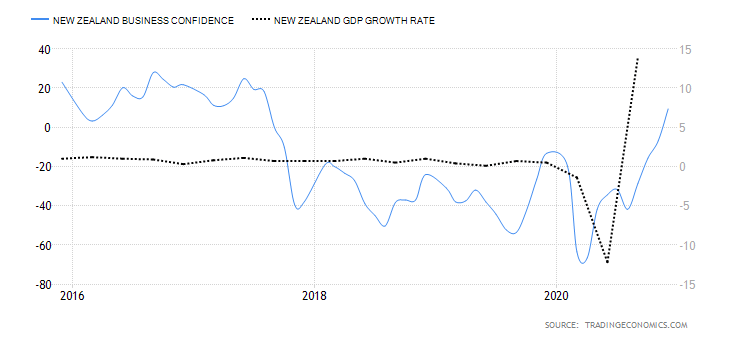
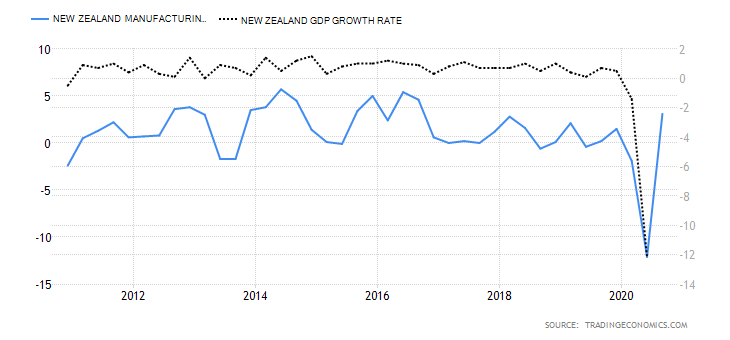
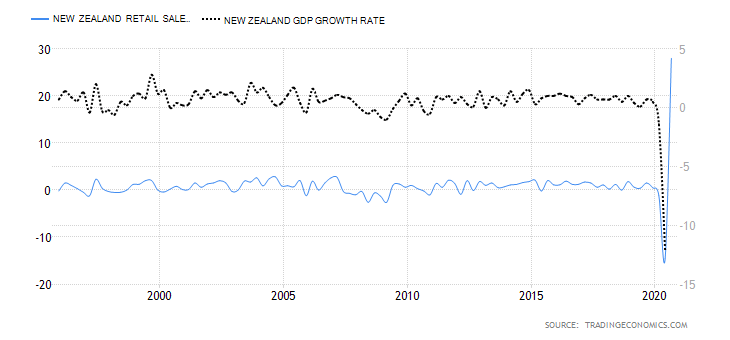
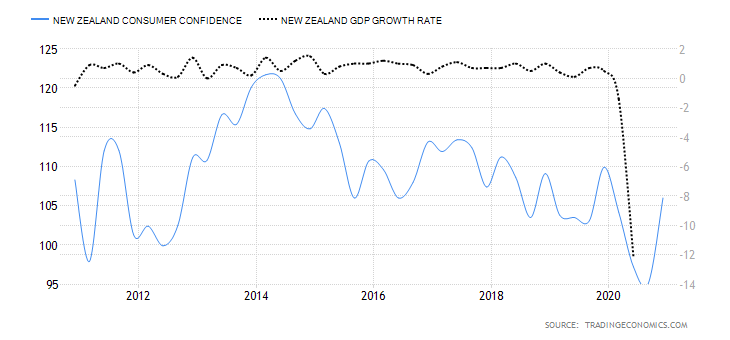
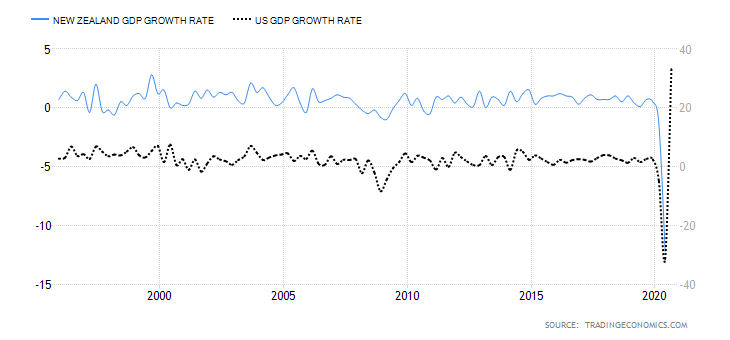
The reports traders should focus on are rather similar to those of the United States: quarterly GDP reports, monthly Employment Report, Retail Sales, and Producer and Consumer Price Index (CPI and PPI) for both the AUD and the NZD, including Westpac Consumer Sentiment for New Zealand. 

The AUD/SPX Correlation

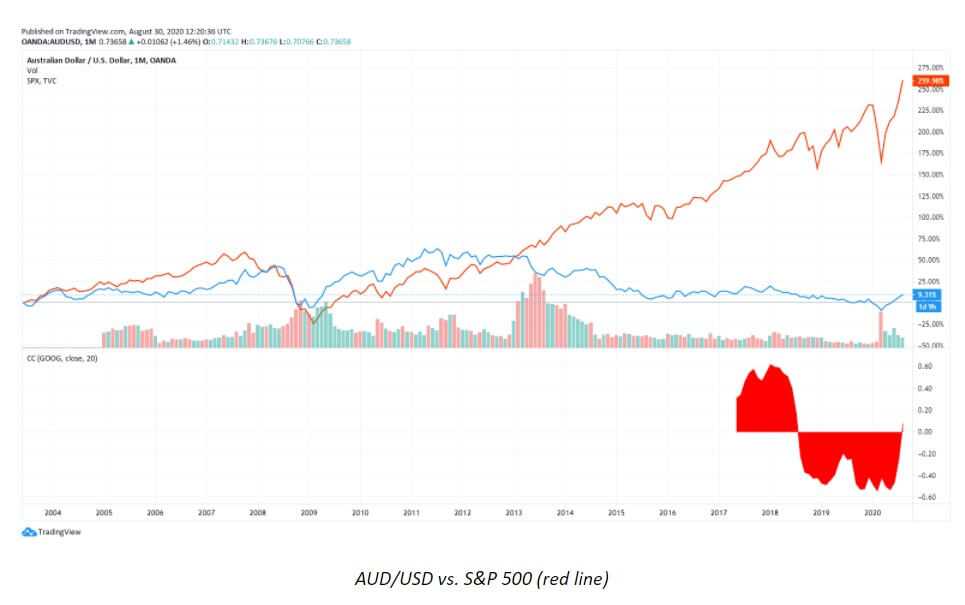
Australia is not the biggest economy, but the AUD is used extensively in the currency market as a proxy for growth. If economies are growing, there will be a demand for natural resources, causing the Australian exports to be strong and the country’s relationship with China, as one of the greatest economies in the world, comes into place here as well. Some of the greatest correlations we can see are found between the AUD and the USD as well as AUD and the S&P 500. Since the AUD is perceived as a proxy for growth, if traders assume that economies are going to grow, this will be bullish for the equities market and the currencies such as the AUD. As we can see from the chart below, the nature of this correlation has changed, but it is still quite high, exceeding 50%. Correlations can in general vary in strength during different periods; however, the AUD/SPX correlation can allow traders to draw some conclusions and expect changes in the prices of the AUD should the price of equities increase.

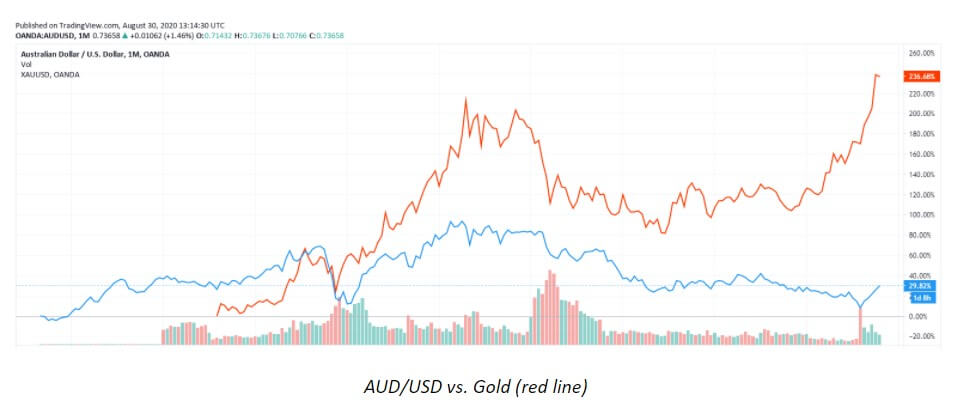
Another important AUD/USD correlation concern is gold, which has historically been one of the most prominent correlations. Therefore, the increase in the price of gold has traditionally been bullish for the AUD. Any decrease in the price of gold is then bearish for the AUD.

With regard to the NZD, one of the strongest correlations exist between the AUD and the NZD, which is why many young traders make the mistake of going short on one and long on the other. Although the two tend to move in different directions at times, these currencies are still highly correlated. Therefore, due to their strong correlation, the insight into what is happening with the NZD should provide information on what is happening with the AUD and vice versa. 

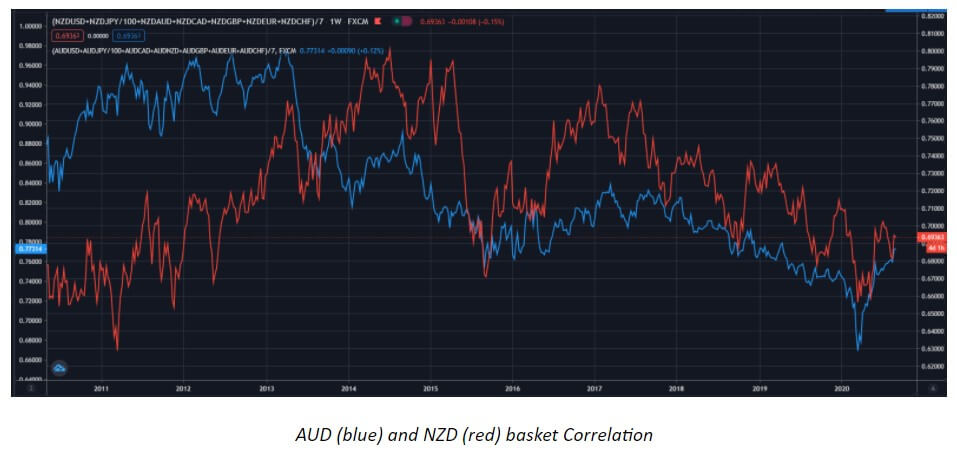
Owing to the similarities described above, if equities prices start to move up, this change will likely be bullish both for the AUD and the NZD. Should you come to the conclusion that a change in the price of gold is going to be bearish for the price of the AUD, the same conclusion can be applied to the NZD as well. 

Trading the NZD and the AUD

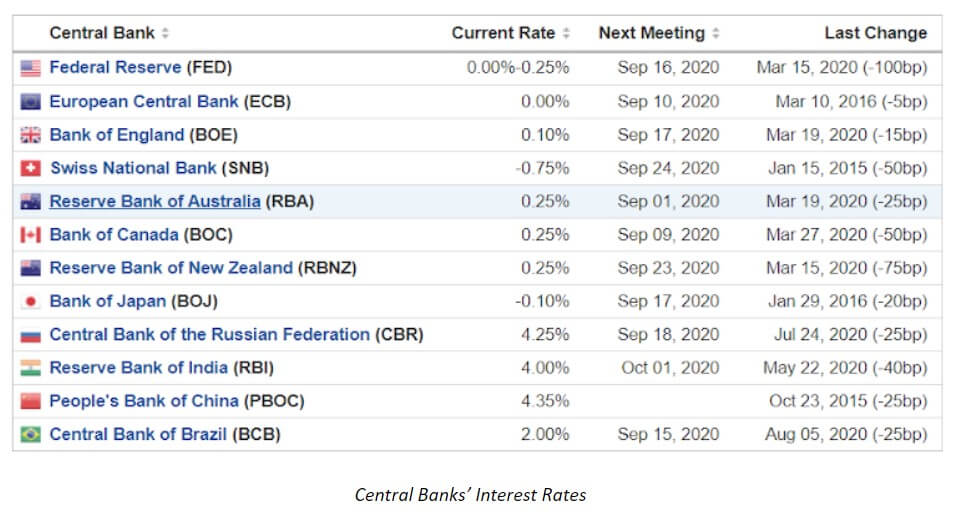
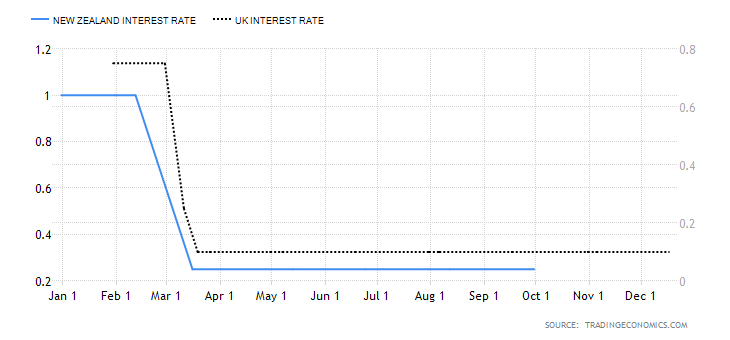
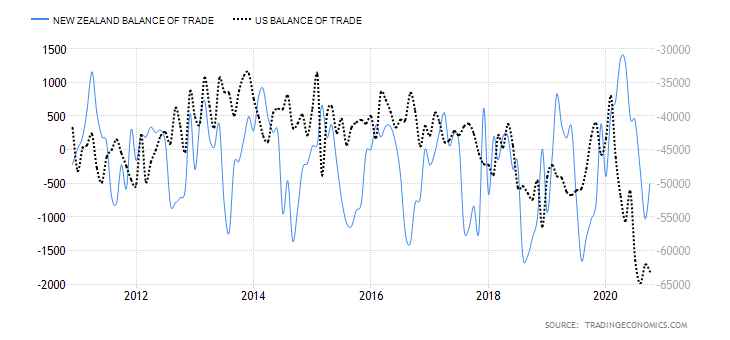
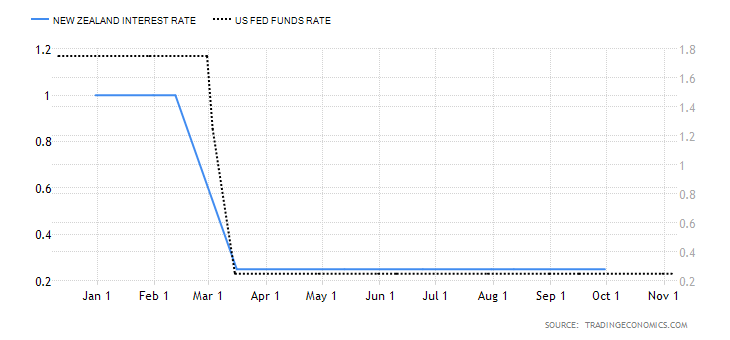
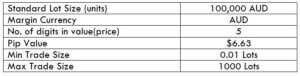
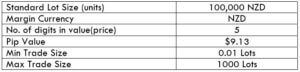
Both currencies require traders to take liquidity, proper selection of crosses, and avoiding news events into consideration. Currency pairs such as GBP/NZD can be great for traders, but they tend to get really volatile around the news announcements, leading to unpredictable moves and wide spreads. It is also important to remember that both New Zealand and Australian economies are focused on commodities and Asian countries. Concerning interest rates, both Australia and New Zealand keep their rates at 0.25%, which places them right in the middle among all major currencies’ central banks. Inflation in both countries tends to vary according to CPI and PPI reports. The two countries typically do not have any challenges with the trade deficit, as they are large exporters that typically carry a surplus. What is more, as these two currencies are tightly connected with global growth, commodity prices are important factors that determine what is happening to the AUD and the NZD. 

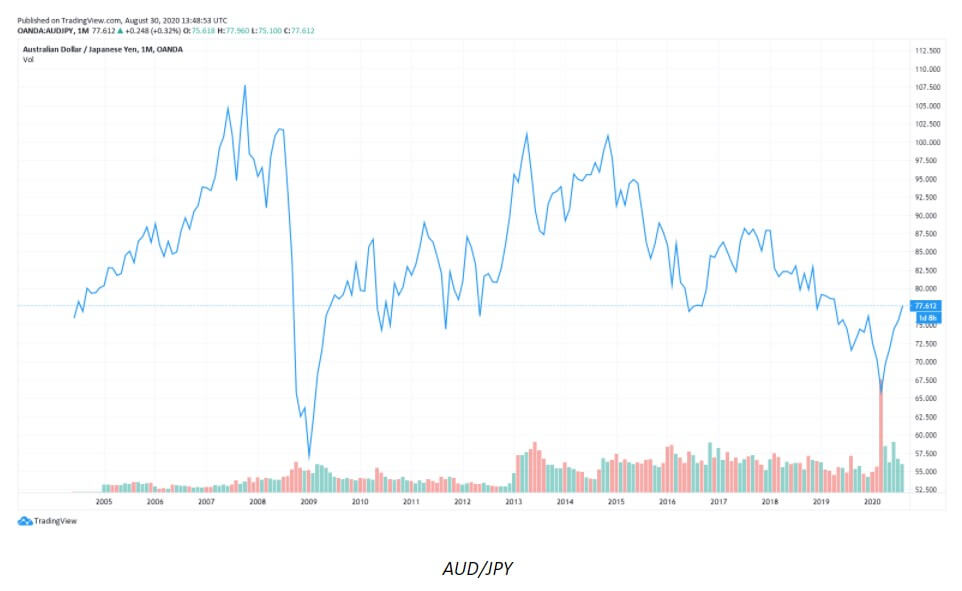
As a proxy for global growth, the NZD and AUD pairs will reflect any global panic. The 2008 AUD/JPY chart below reflects a large drop (a 50% loss) in the midst of the crisis that was affecting the entire world. Traders use these currencies to trade growth as well as to short and sell when there is a recession.

Recent Market Activity

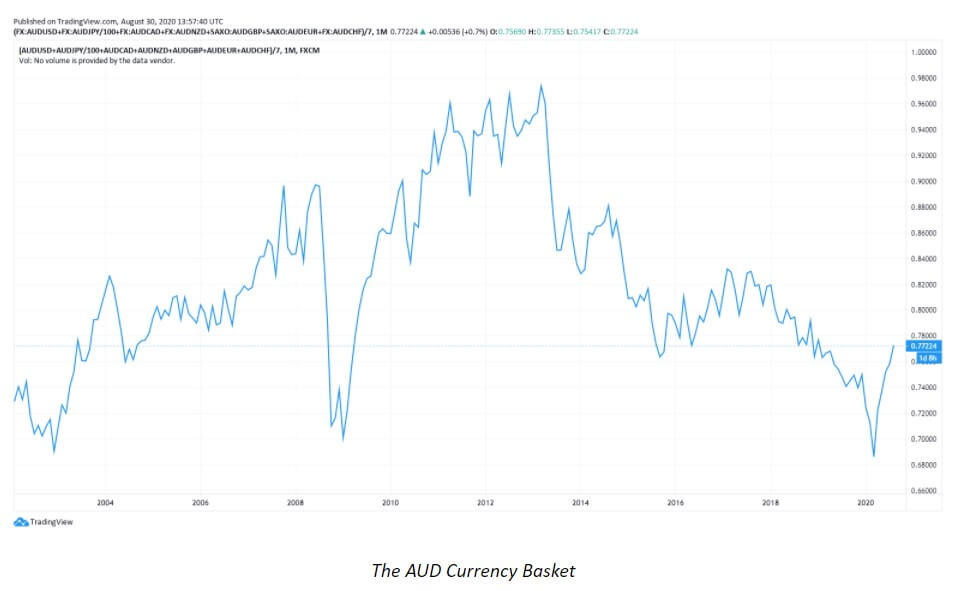
The AUD has been quite resilient lately with the price action slowly building up towards the end of the chart. While the chart did give a few breakouts in several places, they would simply fall. What is more, as we can see from the chart below, the past three months the price has been consolidating and this consolidation is likely to break out sometime soon. However, the CAD for example has shown how the breakdown itself is not as relevant, since the price of the Canadian dollar did break down for it to go up the very next day. The near future of the AUD may reveal similar tendencies, with the price either going straight up and growing even more or, on the other hand, going up and then pulling back in the opposite direction.

The longer the consolidation, the more difficult for the trader to assess the chart’s future movement as much resistance has been building up. Likewise, the shorter distances do allow the price to break out more easily, and the break-out and pull-back tendencies are generally much more often in such cases. The chart below shows how the currency has been doing well lately in 2020 from the technical point of view, with its strength supported by the equities and gold markets experiencing all-time highs, strong risk-on sentiments, and a weak USD. The end of the August 2020 chart reveals how the current trend should be bullish, but it is not, so it is a sign that something is wrong at the moment and that the currency should be handled with care. 

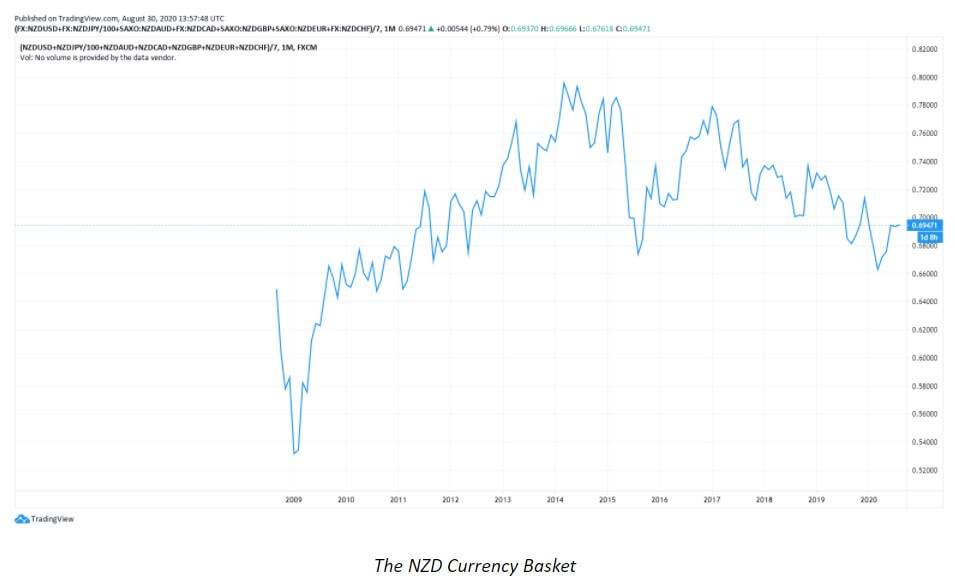
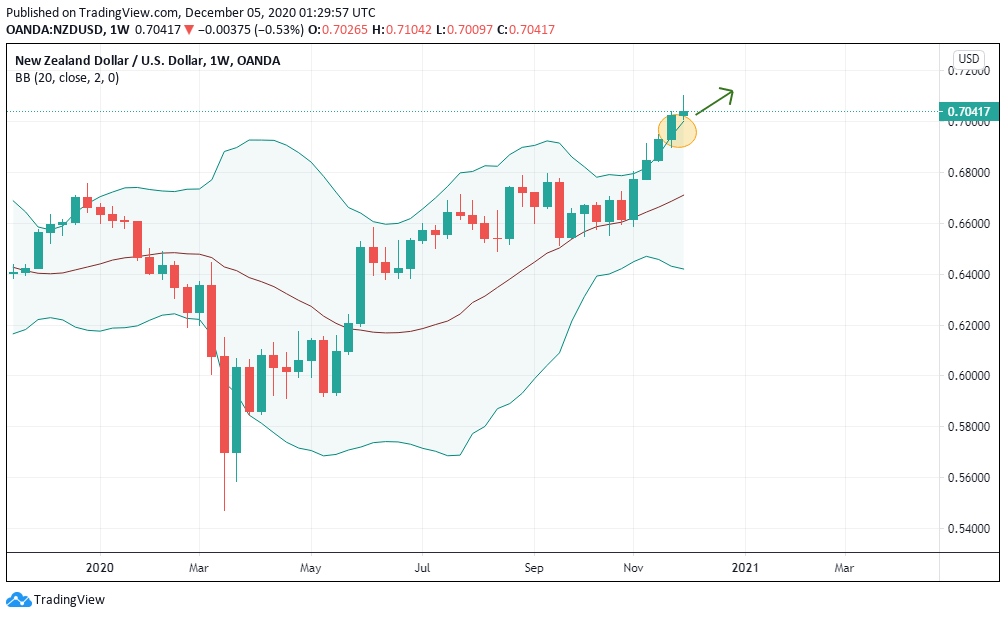
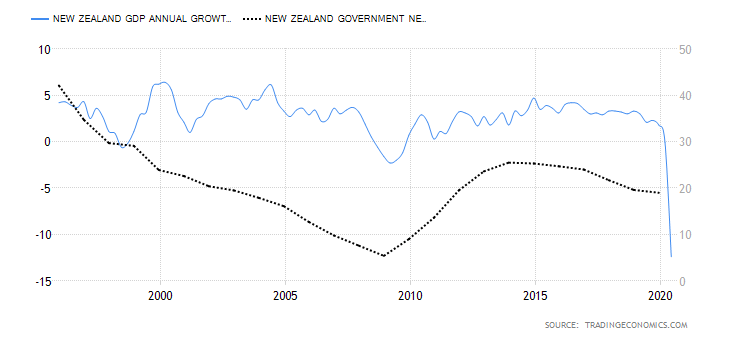
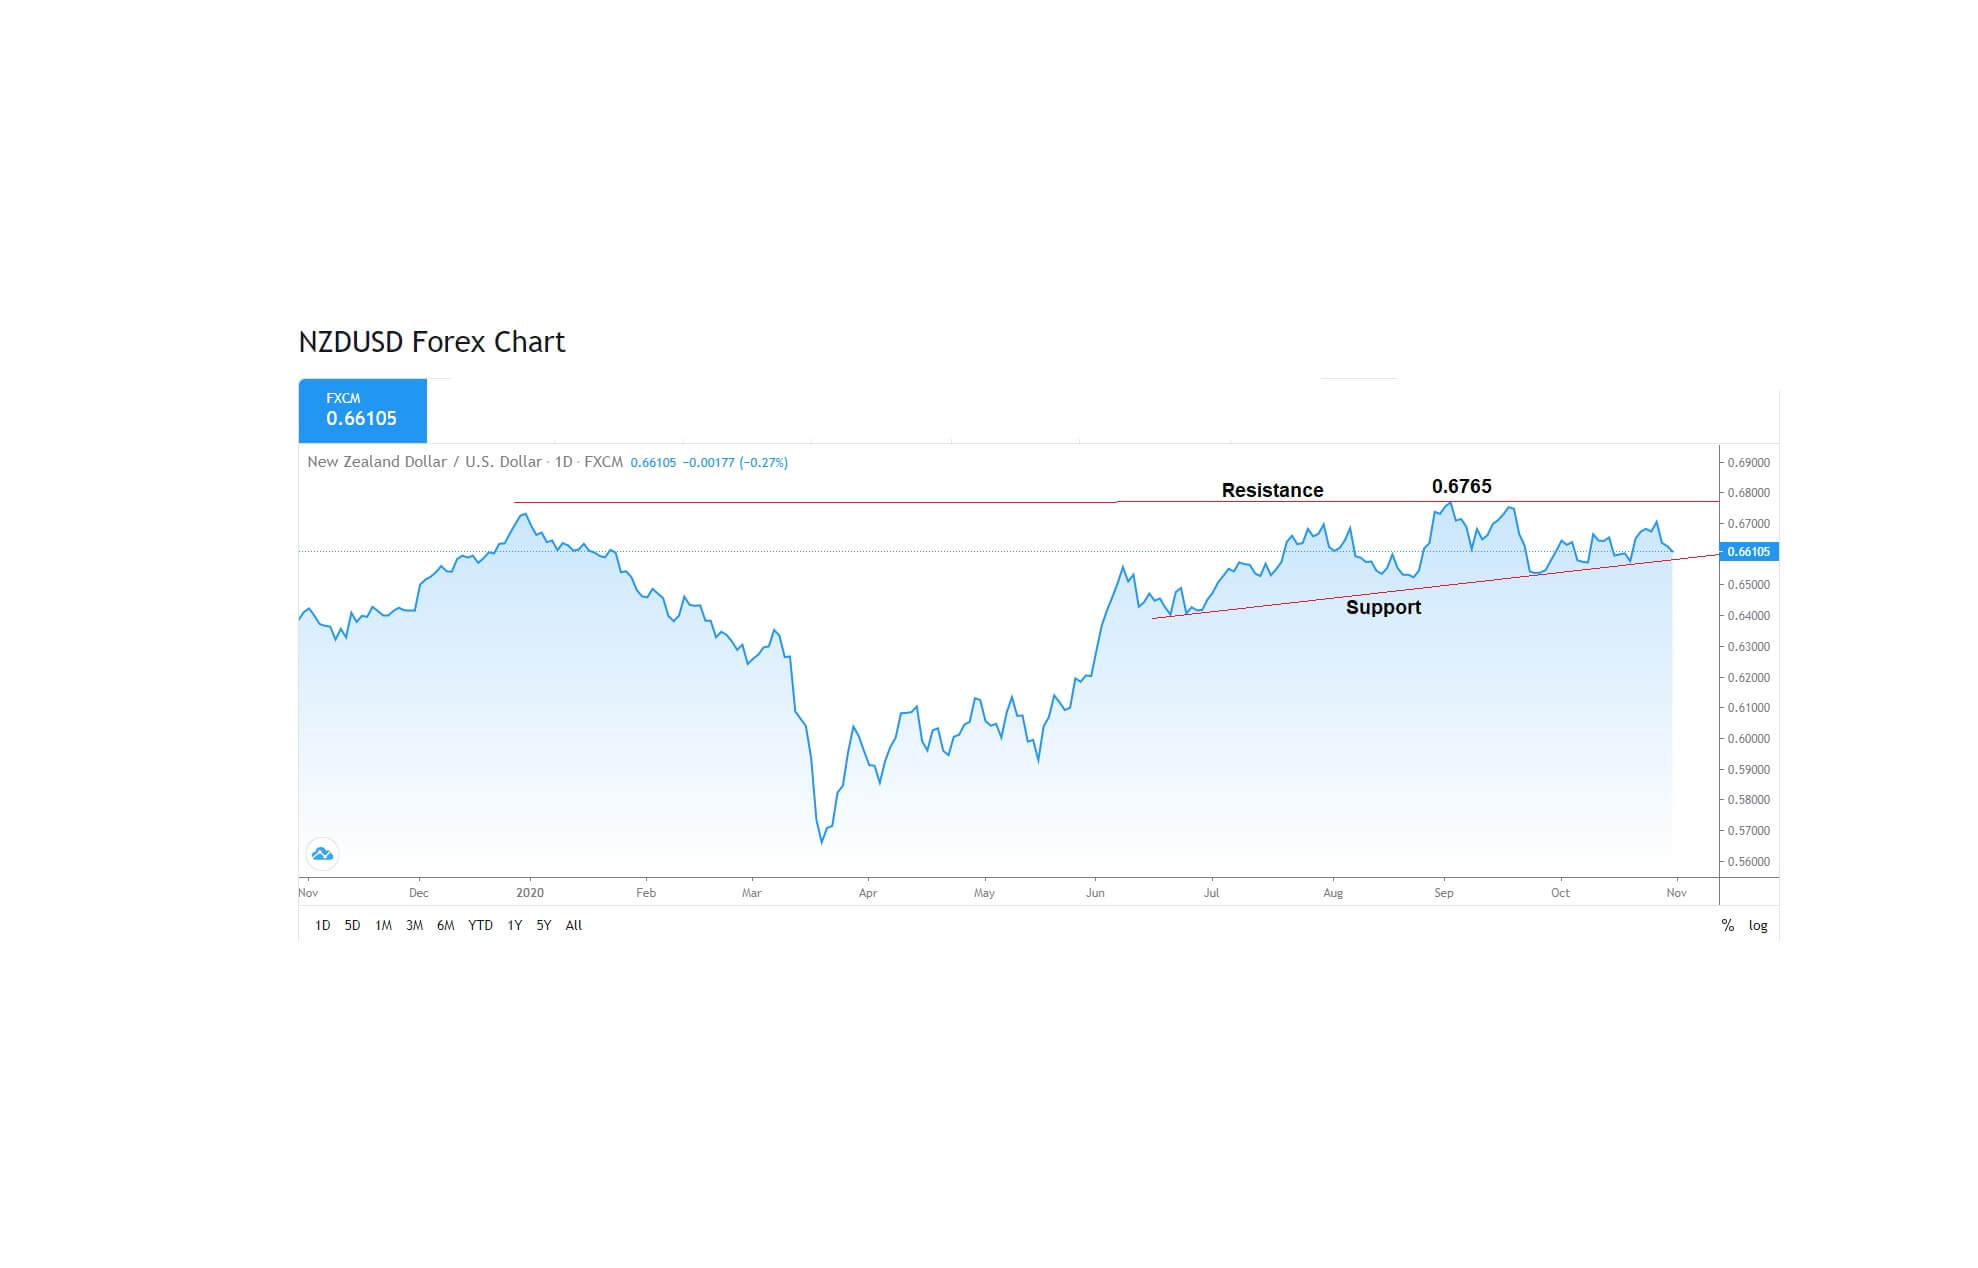
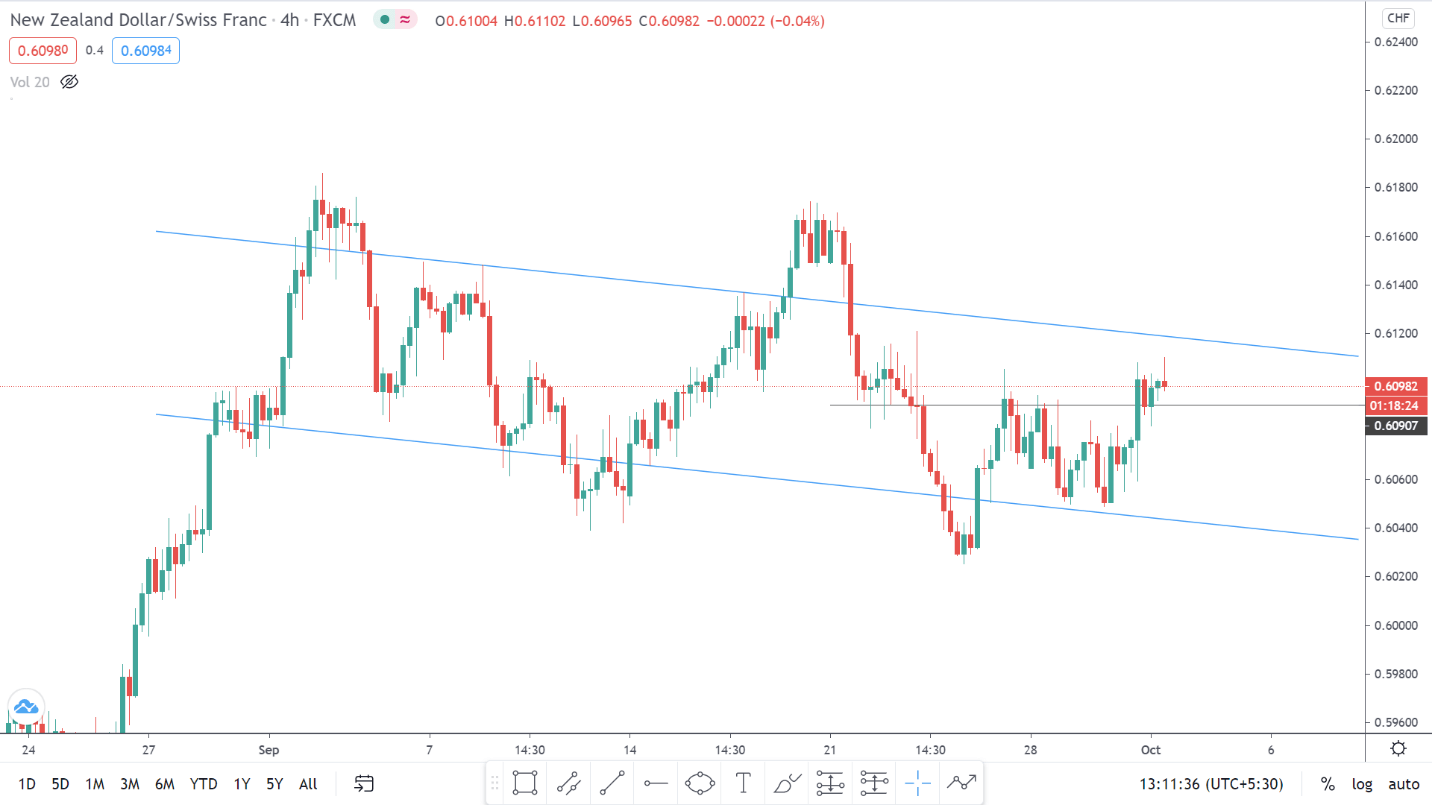
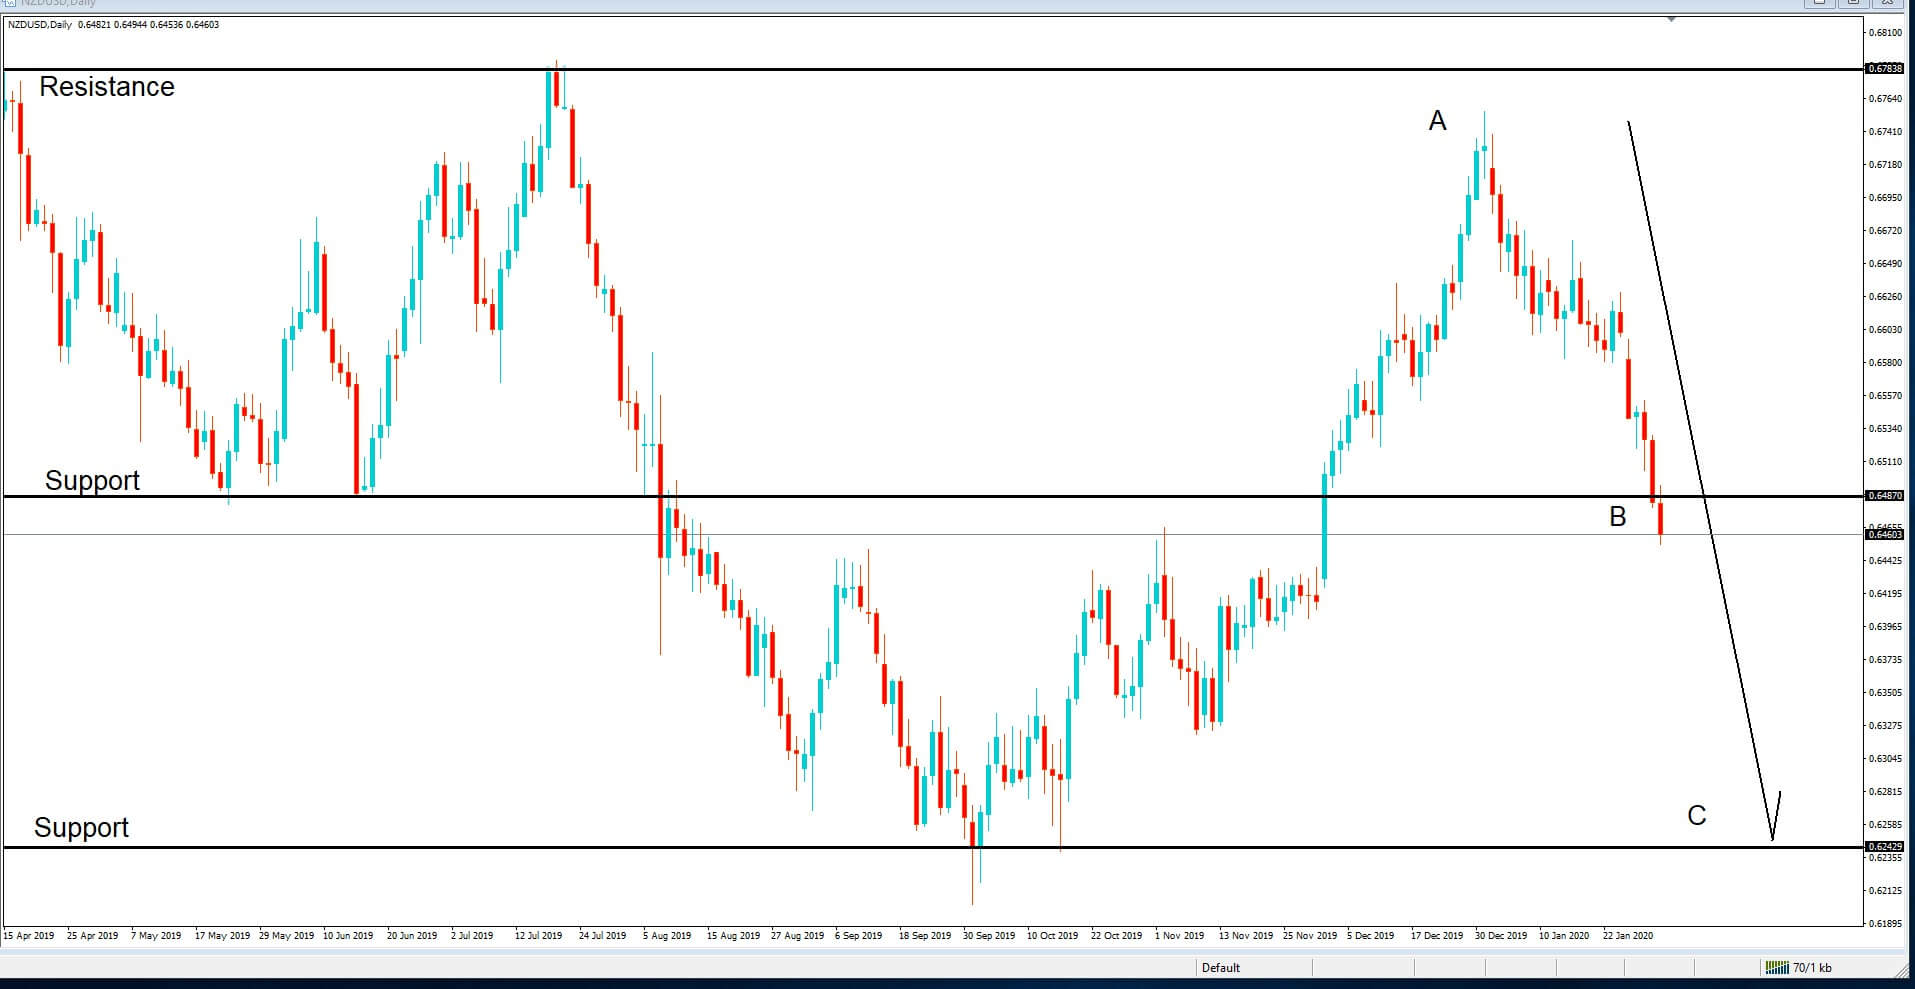
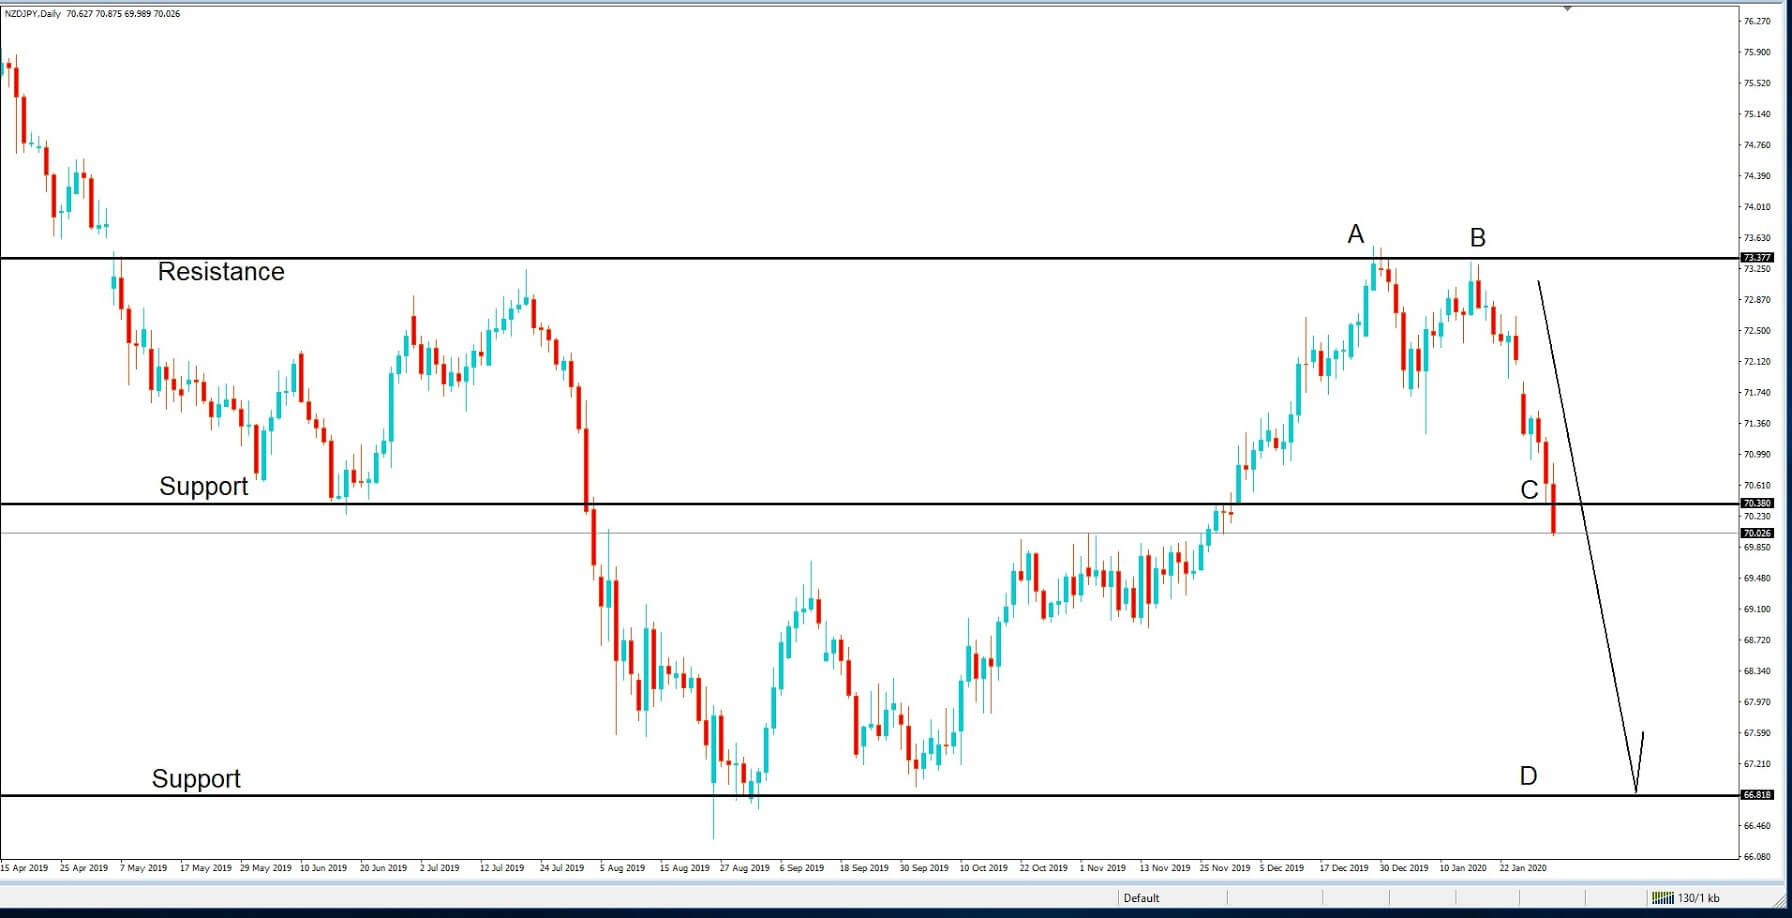
As the chart below reveals, the volatility seems to be on the low when it comes to the NZD lately. Compared to March, for example, the volatility level is much lower now. The NZD lost its momentum going upwards and in August 2020 started moving steadily in the opposite direction. The big move down may easily reach the bottom end, i.e. the support line, which would require a change in the overall outlook on behalf of traders.

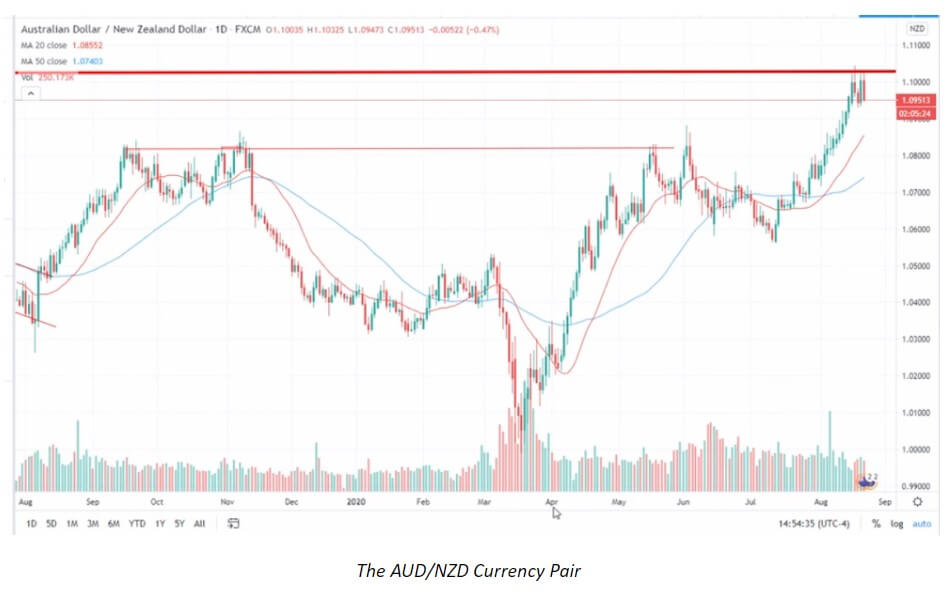
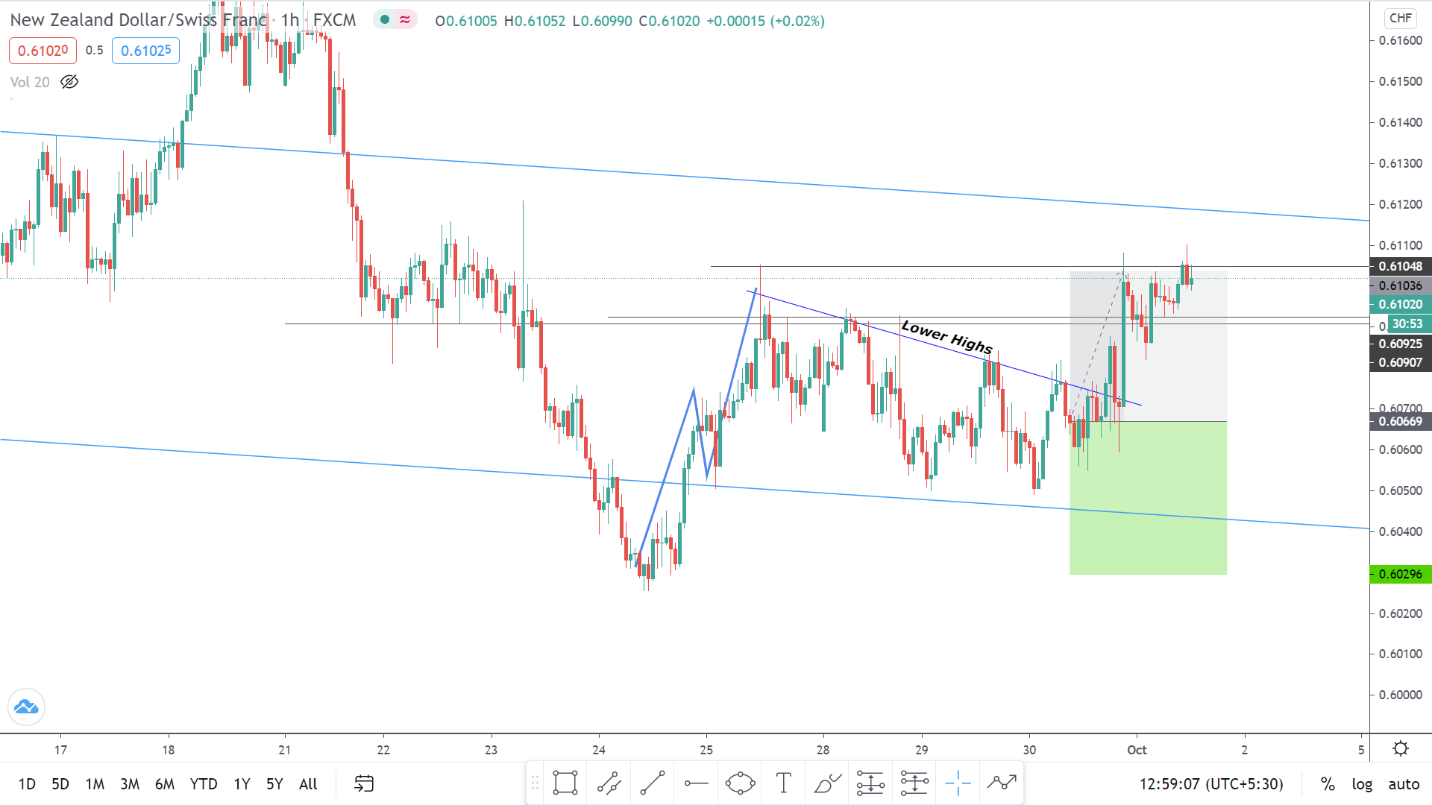
Traders have been able to see some divergence with the AUD/NZD pair in the last few weeks. If traders are thinking of whether to go short on one or the other currency, the NZD is currently a much better pick. The AUD and the NZD are similar, but if they break the level they have been approaching for a while now, traders might be able to witness a more significant divergence happening. Should traders encounter a slowdown, the AUD may turn out to be a better choice after all. Owing to the current progressions, traders are advised to pay close attention to this currency pair in the time coming.

So, what does the future hold for these two currencies? It’s tough to know, the same as with any currency pair, as there are simply too many factors that determine how the market moves. What we can say with certainty is that at this time the pair is delivering some excellent trade opportunities if you only know where to look.

Categories
Forex Fundamental Analysis

GBP/NZD Global Macro Analysis – Part 3

GBP/NZD Exogenous Analysis

  1. The UK and New Zealand Current Account Differential

The current account differential between the UK and NZ is the value of the subtraction of the NZ current account balance and the UK’s current account. For the GBP/NZD pair, if the current account differential is positive, it means that the UK has a higher current account balance than NZ. Thus, the price of the GBP/NZD pair will increase. Conversely, if the differential is negative, NZ has a higher current account balance than the UK. Theoretically, this means that traders would be bullish on the NZD; hence, the GBP/NZD pair price would drop.

In Q3 2020, NZ had a current account deficit of $2.48 billion while the UK a deficit of $20.97 billion. This means that the current account differential is -$18.49 billion. Thus, we assign a score of -5.

  1. The interest rate differential between the UK and New Zealand

The interest rate differential for the GBP/NZD pair is the difference between the UK and NZ’s interest rate. Carry traders and investors would direct their money to the currency, which offers higher interest rates. Therefore, if the interest rate differential for the GBP/NZD pair is positive, it means that the UK offers a higher interest rate than NZ. Hence, traders will be bullish on the GBP/NZD pair. Conversely, if the interest rate differential is negative, it means that NZ has a higher interest rate than the UK. This means that traders would be bearish on the GBP/NZD pair.

In 2020, the Reserve Bank of New Zealand cut its official cash rate from 1% to 0.1%, while the BOE cut the interest rate from 0.75% to 0.1%. In this case, the interest rate differential is 0%. Thus, we assign a score of 0.

  1. The differential in GDP growth rate between the UK and New Zealand

This differential shows which economy is expanding faster between the NZ economy and the UK economy. Comparing domestic economies using their GDP growth rates is more effective than using absolute GDP figures since they vary in size.

If the GDP growth rate differential is negative, the NZ economy is growing faster than the UK economy. This would result in a bearish trend for the GBP/NZD pair. Conversely, the pair will have a bullish trend if the differential is positive since it would mean that the UK economy is expanding more than the NZ economy.

The first three quarters of 2020 saw the NZ economy expand by 0.4% and the UK contract by 5.8%. In this case, the GDP growth rate differential is -6.2%. Hence, the score of -4.

Conclusion

Indicator Score Total State Comment
The UK and New Zealand Current Account Differential -5 10 A differential of – $18.49 NZ has a lower current account deficit than the UK.
The interest rate differential between the UK and New Zealand 0 10 0.00% The 0% interest rate differential is expected to persist in the short-term. That’s because neither the RBNZ and the BOE have scheduled changes in the monetary policy
The differential in GDP growth rate between the UK and New Zealand -4 10 -6.20% New Zealand’s economy expanded by 0.4% in the first three quarters of 2020, while the UK contracted by 5.8%
TOTAL SCORE -9

GBP/NZD exogenous factors have a cumulative score of -9. It means we should expect a continued downtrend in the pair for the short term.

In the above image, we can see that this pair’s weekly chart trading below the 200-period MA for the first time since August 2019. Cheers.

Categories
Forex Fundamental Analysis

GBP/NZD Global Macro Analysis – Part 1 & 2

Introduction

In this analysis, we will analyze endogenous factors that influence both the UK and New Zealand economies. The analysis will also include exogenous factors that impact the exchange rate between the GBP and the NZD.

Ranking Scale

We’ll rank the endogenous and exogenous factors on a scale from -10 to +10.

The score of the endogenous factors will be determined from correlation analysis between the GDP growth rate. If the score is negative, the endogenous factor had a devaluing effect on the domestic currency. Conversely, if the score is positive, the factor led to the appreciation of the domestic currency.

Similarly, we’ll do a correlation analysis between the exogenous factors and the GBP/NZD exchange rate. If the correlation is negative, the factor results in a drop in the exchange rate. If positive, then the exogenous factor increases the exchange rate.

Summary – GBP Endogenous Analysis

-15 score on Pound’s Endogenous Analysis indicates that this currency has depreciated since the beginning of 2020.

Summary – NZD Endogenous Analysis

A positive 5 indicates that the New Zealand dollar has appreciated since the beginning of this year.

Indicator Score Total State Comment
New Zealand Employment Rate -7 10 66.4% in Q3 2020 The NZ labor market is yet to recover from the economic disruptions of the pandemic
New Zealand Core Consumer Prices 1 10 1054 points in Q3 2020 From Q1 to Q3, inflation has increased by 1 point
New Zealand Industrial Production 5 10 A 3.1% increase in Q3 The NZ industrial sector is rebounding from a 12.1% drop in Q2.
New Zealand Business Confidence 7 10 Was 9.4 in November November showed the first positive reading in ANZ business confidence since August 2018
New Zealand Consumer Spending 5 10 Q3 spending was 41.335 billion NZD. Q3 consumer spending was the highest recorded in 2020. This shows that the domestic demand has recovered beyond the pre-pandemic period
New Zealand Construction Output -4 10 Q2 output dropped by 24.2% The worst decline in construction output in about 18 years. It’s bound to increase as COVID-19 restrictions ease
New Zealand Government Budget Value -2 10 2020 projected deficit of 4.5 billion NZD This would be a drop from a surplus of 7.5 billion NZD in 2019. Attributed to the increase in government spending during the pandemic
TOTAL SCORE 5
  1. New Zealand Employment Rate

The employment rate shows the growth in New Zealand’s labor market. The change in the labor market shows how the economy is performing – especially in the coronavirus pandemic. The labor market shows if the economy is churning out new jobs or if jobs are lost. Thus, the growth of the labor market is a leading indicator of economic growth.

In Q3 2020, New Zealand’s employment rate dropped to 66.4% from 67.1% in Q2 and 67.7% in Q1. This shows that the labor market is yet to recover from the economic shocks of the pandemic. The New Zealand employment rate has a score of -7.

  1. New Zealand Core Consumer Prices

This indicator samples the price changes in a basket of the most commonly purchased goods and services by households. The price changes represent the rate of inflation in the overall economy. Note that the computation of the core consumer prices excludes goods and services whose prices tend to be volatile. It helps avoid seasonal distortions in the index.

In Q3 of 2020, the core consumer prices in New Zealand rose to 1054 points from 1048 in Q2. The index had only increased by 1 point in 2020. Thus, we assign a score of 1.

  1. New Zealand Industrial Production

Industrial production in New Zealand refers to the YoY change in total manufacturing sales. It measures the YoY change in sales volume in the manufacturing sector. A survey of 13 industries across the manufacturing sector is surveyed to derive the YoY manufacturing sales data for the whole sector. Some of these industries include; petroleum and coal products, metal products, machinery, equipment and furniture, and food and beverage. Naturally, expansion in industrial production corresponds to the expansion of the economy.

New Zealand manufacturing sales rose by 3.1% in Q3 2020 from a drop of 12.1%. This is the largest YoY increase in manufacturing sales in three years. It shows that the economy is rebounding. We assign a score of 5.

  1. New Zealand Business Confidence

NZ business confidence is a survey of about 700 businesses. They are polled to establish their expectations about the future business operating environment and economic growth in general. Some aspects surveyed include; activity outlook, employment prospects, capacity utilization, and investment decisions.

In December 2020, the NZ ANZ business confidence rose to 9.4 from -6.9 in November. This shows an increased optimism in NZ businesses since it is the first positive reading since August 2018. Thus, we assign a score of 7.

  1. New Zealand Consumer Spending

This measures the value of the quarterly consumer expenditure in NZ. Changes in consumer expenditure go hand in hand with domestic demand changes in the economy, which drive GDP growth.

In Q3 2020, the NZ consumer spending increased to NZD 41.335 billion from NZD 35.197 billion in Q2. More so, the Q3 consumer spending is more than the NZD 40.04 billion recorded in Q1. Consequently, the NZ consumer spending has a score of 5.

  1. New Zealand Construction Output

This indicator shows the overall change in the value of all construction work done by contractors in NZ. It compares the YoY quarterly change, which helps to show if the economy is expanding or contracting.

In Q2 2020, the NZ construction output dropped by 24.2% compared to the 4.1% drop in Q2. This is the worst drop in over 18 years. Thus, we assign a score of -4.

  1. New Zealand Government Budget Value

This is the difference between the revenues that the NZ government collects and the amount it spends. Deficits arise if the revenues are less than expenditures, while surplus occurs when the revenues exceed expenditure.

In 2019, the NZ government had a budget surplus of NZD 7.5 billion. In 2020, it was projected that the budget would hit a deficit of NZD 4.5 billion. This is due to increased government expenditure to alleviate the pandemic’s economic shocks while revenues have been depressed due to nationwide shutdowns. Thus, we assign a score of -2.

For the exogenous analysis of both of these currencies, you can check our very next article. In case of any queries, let us know in the comments below. Cheers.

Categories
Forex Fundamental Analysis

EUR/NZD Global Macro Analysis – Part 1 & 2

Introduction

In conducting the global macro analysis for the EUR/NZD pair, we will analyze the endogenous factors that impact the EU and New Zealand economic growth. We’ll also analyze exogenous economic factors that affect the EUR/NZD pair’s exchange rate in the forex market.

Ranking Scale

We will rank the effects of the endogenous and exogenous factors on a sliding scale of -10 to +10. The endogenous factors will be ranked based on correlation analysis with the GDP growth rate. When the endogenous ranking is negative, it means that the domestic currency will depreciate and appreciate when positive.

Similarly, the exogenous factors are scored based on correlation analysis with the EUR/NZD pair’s exchange rate. A positive score means that the EUR/NZD pair’s price will rise and drop if the score is negative.

Summary – EUR Endogenous Analysis

Based on the factors we have analyzed, we have got a score of -3, and we can expect the Euro to be marginally depreciating in 2020.

Summary – NZD Endogenous Analysis

A score of -4 on NZD Endogenous Analysis implies that in 2020, the NZD has depreciated as well.

Employment change measures the quarterly change in the number of people who are gainfully employed. It can be used as a comprehensive measure of the labor market changes, which corresponds to economic growth.

In Q3 of 2020, Employment in New Zealand dropped by 0.8%, from a 0.3% drop in Q2 to 2.709 million. The Q3 reading is the largest drop in QoQ employment since Q1 of 2009. We assign a score of  -6.

  • New Zealand GDP Deflator

This indicator measures the quarterly changes in the price of all economic output in New Zealand. It is regarded as the most specific inflation measure since it covers price changes for every good and service produced.

In Q2 of 2020, the New Zealand GDP deflator dropped to 1238 points from 1242 in Q1. This shows that the economy contracted in Q2. Hence, we assign a score of -3.

  • New Zealand Manufacturing Sales

New Zealand manufacturing sales track the change in the volume of total sales made in the manufacturing sector. The indicator tracks the sales in 13 industries, which comprehensively represents New Zealand’s economy. The changes in the volume of sales are directly correlated to the growth of the economy.

In Q3 of 2020, the YoY manufacturing sales in New Zealand increased by 3.1% after dropping by 12.1% in Q2 and 1.9% in Q1. The increase in Q3 is the largest recorded since January 2017. However, since the overall industrial production is still at multi-year lows, we assign a score of -6.

  • New Zealand Manufacturing PMI

This index is aggregated from a survey of purchasing managers in the manufacturing sector. It is a composite of scores regarding output in the sector, prices, expected output, employment, new orders, and inventory. When the PMI is above 50, it means that the manufacturing sector is expanding. A PMI score below 50 shows that the sector is contracting. Naturally, these periods of expansions and contractions are leading indicators of changes in the GDP growth rate.

In November 2020, the New Zealand manufacturing PMI rose to 55.3 from 51.7 in October. The rise was due to increased new orders, inventory, production, and deliveries, as uncertainties surrounding COVID-19 decreased. We assign a score of 4.

  • New Zealand Retail Sales

The retail sales track the changes in the quarterly purchase of final goods and services by households in New Zealand. Although retail sales are often affected by seasonality and tend to be highly volatile, it is a significant measure of the overall economic growth since consumer expenditure is one of the primary drivers of GDP growth.

In Q3 of 2020, New Zealand retail sales increased by 28% from 14.8% recorded in Q2. Historically, the Q3 retail sales increase is the largest rise recorded in New Zealand since 1995. The increase was driven by increased expenditure on groceries, vehicles, and household goods. On average, the QoQ New Zealand retail sales figure has grown by 4.1%. We assign a score of 4.

  • New Zealand Consumer Confidence

The New Zealand consumer confidence is also called the Westpac McDermott Miller Consumer Confidence Index. The index measures the quarterly change in consumers’ pessimism or optimism about the performance of the economy. When the index is above 100, it shows increased optimism by households, and that below 100 shows pessimism.

In the fourth quarter of 2020, New Zealand consumer confidence rose to 106 from 95.1 in Q3. The increased optimism was driven by higher readings in both the current and expected financial situation. We assign a score of 2.

  • New Zealand Government Net Debt to GDP

Investors use this ratio to determine if the economy is capable of servicing its debt obligations. Consequently, the government’s net debt to GDP affects the government securities yield and determines a country’s borrowing costs. Typically, levels below 60% are deemed favorable.

In 2019, the New Zealand Government Net Debt to GDP dropped to 19% from 19.6% in 2018. In 2020, it is projected to range between 27% to 32%, which would be the highest since 1998. We assign a score of 1.

In the next article, we have done the exogenous analysis of both EUR and NZD pairs to accurately forecast this currency pair’s future trend. Please check that out. Cheers.

Categories
Forex Fundamental Analysis

NZD/USD Global Macro Analysis – Part 3

NZD/USD Exogenous Analysis

To effectively compare the US and the New Zealand economies, we will conduct exogenous analysis using the following fundamental aspects;

  • The US and New Zealand balance of trade difference
  • GDP growth differential in the US and New Zealand
  • The US and New Zealand interest rate differential

The US and New Zealand balance of trade difference

A country’s participation in international trade tends to determine the demand for its domestic currency. If a country is a net exporter, its currency will be in high demand in the forex market, increasing its value against other currencies.

In October 2020, New Zealand’s trade deficit was NZD 500 million compared to the US trade deficit of $63.1 billion. Although New Zealand’s trade deficit is improving, it is still lower than the balance of trade in January. On the other hand, the US trade deficit has been widening throughout the year. The difference between the two countries’ balance of trade is the trade deficit differential. Based on its correlation with the price of the NZD/USD pair, we assign a score of 4.

GDP growth differential in the US and New Zealand

GDP growth differential is the difference between the rate at which the US and New Zealand economies are expanding. It will help to show which economy is growing at a faster pace hence impacting the exchange rate between the two countries. A country whose GDP is expanding faster will enjoy favorable domestic macroeconomic conditions. Hence its currency will appreciate.

In Q3 of 2020, the New Zealand GDP contracted by 12.2% while that of the US expanded by 33.1%. That represents a GDP growth rate differential of 45.3%. If this trend continues, we should expect that the USD will strengthen against the NZD hence a bearish NZD/USD pair.

Based on our correlation analysis, we assign the GDP growth differential between the US and New Zealand a score of -4.

The US and New Zealand interest rate differential

The interest rate differential is the difference between the prevailing interest rates in New Zealand and the US. The country with a higher interest rate tends to attract more capital, inceasing the value of its currency.

At the onset of the coronavirus pandemic, the Reserve Bank of New Zealand cut its official cash rate from 1% to 0.25%. During the same period, the US Federal Reserve cut the interest rate from 1.75% to 0.25%. Presently, the interest rate differential in NZD/USD is 0%.

Based on the correlation with the price of the NZD/USD pair, we assign a score of 1.

Conclusion

The NZD/USD pair has an exogenous score of 1. That means we should expect that the pair will continue on a mild bullish trend in the short-term. Note that this trend is also supported by technical analysis.

As seen in the above 1-week chart, the NZD/USD has successfully breached the upper Bollinger band indicating bullish momentum. This supports our fundamental analysis, as well. All the best.

Categories
Forex Fundamental Analysis

NZD/USD Global Macro Analysis – Part 1 & 2

Introduction

The global macro analysis of the NZD/USD pair will involve the endogenous and exogenous analyses of the US and New Zealand economies. The endogenous analysis will focus on domestic macroeconomic factors that drive the economy. The exogenous analysis will focus on economic indicators that comprehensively compare both the US and New Zealand economies.

Ranking Scale

Both the endogenous and exogenous factors will be ranked on a scale of -10 to +10. A negative ranking for the endogenous means that the factor had a negative impact on either the currency, while a positive ranking had a bullish impact on the currency.

Similarly, when the exogenous factor is negative, it has a bearish impact on the currency pair, while a positive ranking means it had a bullish impact.

Summary – USD Endogenous Analysis

From the above table, a clear deflationary effect can be seen on the USD currency and implies that USD has depreciated in its value since the beginning of 2020. For the complete USD Endogenous Analysis, please check here.

Summary – NZD Endogenous Analysis

The NZD endogenous analysis has a total score of 4. This shows that the NZD appreciated in 2020.

  • New Zealand Inflation Rate

The CPI is the most commonly used measure of inflation in New Zealand. Here are the top categories included in the CPI: Housing with a weight of 24.2%; food and non-alcoholic drinks 18.8%; transportation 15%; recreation 9.4%; alcoholic drinks 7%; clothing, household goods and services, health, and education all have a combined weight of 18.2%.

In September 2020, New Zealand CPI increased by 0.7%. Based on the correlation with the GDP, we assign a score of -1.

  • New Zealand Unemployment Rate

This rate shows the number of New Zealand’s working population out of work and actively looking for gainful employment. As an economic indicator, it can be used to show the economy’s ability to add new jobs to the market.

In Q3 of 2020, the New Zealand unemployment rate increased to 5.3% from 4% in Q2. This shows that the labor market is yet to recover from the economic shocks of the coronavirus pandemic. Based on correlation analysis, we assign a score of -5.

  • New Zealand Manufacturing PMI

This is an index that measures the growth in the manufacturing sector in New Zealand. It is a composite of new orders, employment, inventories, and orders delivered from the manufacturing sector. When the index is above 50, it means that the manufacturing sector in New Zealand is expanding. The sector is seen to be contracting when the index is below 50.

In October 2020, the index declined to 51.7 from 54. However, the index is above the pre-coronavirus levels. That implies the manufacturing sector is recovering swiftly. Based on the correlation analysis with GDP, we assign it a score of 3.

  • New Zealand Business Confidence

In any economy, business confidence goes hand-in-hand with business confidence. In New Zealand, the business confidence index is based on a survey of about 700 businesses. The index is the difference between the number of businesses that anticipate economic improvements and those that expect the economic conditions will decline. The index covers export intentions, profit expectations, employment intentions, activity outlook, and capacity utilization.

In November 2020, the ANZ Business Confidence was -6.9 compared to -15.7 in October. Although in the negative territory, the November reading is the highest since September 2017. This shows that more businesses are becoming optimistic about the future operating environment, mostly thanks to the aggressive expansionary monetary and fiscal policies.

Based on correlation analysis with the GDP, we assign ANZ business confidence a score of 4.

  • New Zealand Retail Sales

In New Zealand, retail sales data is aggregated quarterly. It measures the change in the value of goods and services purchased by households. Remember that consumer expenditure is the main driver of economic growth, which makes the retail sales data a leading indicator of GDP growth.

In Q3 of 2020, the New Zealand retail sales increased by 28% from a drop of 14.6% and 1.2% in Q2 and Q1, respectively. The 28% increase is the largest quarterly increase in 25 years. The YoY retail sales increased by 8.3% in Q3 compared to a 14.2% drop in Q2. Based on our correlation analysis, we assign the New Zealand retail sales a score of 6.

  • New Zealand Consumer Confidence

In New Zealand, consumer confidence tends to correlate with households’ willingness to spend in the economy. The Westpac McDermott Miller Consumer Confidence Index gauges the optimist of New Zealand households regarding the economy. The index covers households’ views on their finances, purchases in the economy, and the overall economy.

A score of above 100 shows an increasing level of optimism, while below 100 shows increasing pessimism.

In Q3 of 2020, the New Zealand consumer confidence index dropped to 95.1 from 97.2 in Q2 and 104.2 in Q1. Q3 reading is the lowest in New Zealand since 2008. Based on its correlation with GDP, we assign a score of -4.

  • New Zealand Government Net Debt to GDP

Gross national Debt to GDP helps both local and foreign creditors gauge a country’s ability to service its debt. This indicator shows the level at which the domestic economy is leveraged. A lower ratio is preferable since it means that the country has a higher GDP compared to its debt. This means that it can be able to access cheap debt in the future.

In the 2018/2019 fiscal year, the New Zealand government debt to GDP dropped to 19% from 19.6% in the 2017/2018 fiscal year. In 2020, the New Zealand government debt to GDP is projected to increase to 27% on account of the government’s aggressive spending to ease the economic pressure from the coronavirus pandemic. Based on correlation analysis with GDP, we assign New Zealand government debt to GDP a score of 1.

In the very next article, let’s analyze the exogenous indicators and forecast if this currency pair seems to be bullish or bearish in the near future.

Categories
Forex Market Analysis Forex Videos

Forex – New Zealand Dollar Set To Remain Powerful! How to Trade The Coming Weeks…


Is the New Zealand dollar bucking the trend?

Thank you for joining this forex academy educational video. In this session, we will be taking a look at some technical analysis for the New Zealand dollar.

As many countries in the western world are still in the grip of the Coronavirus pandemic, and with many western countries now seeing a second wave, New Zealand has managed to maintain a low infection rate.
The New Zealand dollar, also known as the kiwi, is a major currency and one of the top currencies traded against the United States dollar.

Other major currencies have seen huge swings against the United States dollar and other currencies. The kiwi has remained one of the best performers.

In this yearly chart, if we go back to the beginning of the year, we can see that the pair topped out around 0.6700 before being sold off heavily in the middle of march, and this was largely attributed to the United States dollar being bought as a safe-haven currency and before the pandemic really began to take hold in the US.

Since then, the New Zealand dollar has climbed up to record highs for the year to a peak in September at 0.6765, and although it is off of that high, a clearly defined line of support can be seen on the chart, and where this support line is moving higher, potentially offering a squeeze back to the resistance line and possibly beyond.
At the time of writing, the exchange rate was 0.6610, and with a high of 0.6765, it represents a fall from the high of only 155 pips.

If we now take a look at the EURUSD pair, we can see that while the NZDUSD pair was peaking at its high, the EURUSD pair was also peaking at a defined area of resistance at 1.1940. It subsequently pulled back to its current low of 1.1647, which may become an official support line if it moves higher, and where this move is -293 pips or almost twice the fall in pip value of the NZDUSD pair. This is another indication that traders believe the kiwi is worth buying.
This was further helped this week by the reserve bank of New Zealand, which stated that it would begin to cut back on its government bond purchases and that the economic activity was rising while the coronavirus was under control.
Safe-haven currencies saw some buying with continual downward pressure on the USDJPY pair last week, which tried to hit the key 104.00 level, and the US dollar also becoming a safe-haven currency, moving to fresh highs of above 94.00 on the DXY index, and yet again this did not cause a huge sell-off in the New Zealand dollar, as it held to the support line.

The week ahead is a monumental one with potentially a change in leadership for the US presidential office, and it is extremely difficult to predict where things might go from here. However, once the dust has settled, the economic indicators favor the New Zealand dollar, and we believe this will become a bid currency.

Categories
Forex Signals

NZDCHF Bearish channel in Action

Introduction

NZDCHF has been moving in a downward channel since the beginning of September.

After the most recent push by the sellers attempted to breach past the bottom of the channel, but failed and came right back in. The reaction from the buyers came in quite strong but ended up holding below the Resistance at 0.60907. This puts the channel currently in a halt state.

On the 1H timeframe, the buyers began to make higher highs and higher lows. However, after reaching the Resistance, there were no further higher highs. In other words, the market went into a consolidation state.

Soon later, the sideways movement tuned into lower high sequences, indicating that the sellers are making an attempt to take the market at least to the recent low (0.60296), ahead of the market going back to the top of the channel.

In hindsight, the higher demand at the bottom of the channel eventually led to the price head to higher levels. And the reason for the demand kicking in could be due to the strengthening of the New Zealand Dollar.

Categories
Forex Assets

Trading The NZD/HKD Forex Exotic Currency Pair

Introduction

NZD represents the official currency of New Zealand, while HKD is the official currency of Hong Kong. It is an exotic-cross currency pair where NZD is the base currency, and HKD the quote currency. The price of NZDHKD determines the value of HKD, which is equivalent to one NZD. In other words, this pair represents 1 NZD per X HKD. For example, if the pair is trading at 5.14452, we would need about 5.1 HKD to purchase one NZD.

NZD/HKD Specification

Spread

To get the Spread value, we just have to subtract the Bid price from the Ask price. The value of the spread is set by a broker. However, the amount in pips depends on the type of execution model used for executing the trades.

Spread on ECN: 31 pips | Spread on STP: 35 pips

Fees

Like other financial markets, Forex has some fees that a trader needs to pay while they take a trade. Note that the broker does not take any fee on STP accounts, but a few fees are charged on ECN model accounts.

Slippage

The slippage is a set of pips formed by the difference between the demanded price by the trader and the execution price by the broker. The main reason for the occurrence of slippage is market volatility or the broker’s execution speed.

Trading Range in NZD/HKD

Procedure to assess Pip Ranges

  1. Add the ATR indicator to your chart
  2. Set the period to 1
  3. Add a 200-period SMA to this indicator
  4. Shrink the chart so you can assess a large time period
  5. Select your desired timeframe
  6. Measure the floor level and set this value as the min
  7. Measure the level of the 200-period SMA and set this as the average
  8. Measure the peak levels and set this as Max.

NZD/HKD Cost as a Percent of the Trading Range

The volatility values from the above table show how the cost varies with the change in volatility. The ratio between total cost and the volatility values reconverted into percentages to have a better outlook.

ECN Model Account 

Spread = 31 | Slippage = 5 | Trading fee = 8

Total cost = Spread + Slippage + Trading Fee

= 31 + 5 + 8

Total cost = 44

STP Model Account

Spread = 35 | Slippage = 1 | Trading fee = 0

Total cost = Spread + Slippage + Trading Fee

= 35 + 1 + 0 = 36

The Ideal way to trade the NZD/HKD

The NZDHKD is a pair with high liquidity. Therefore, trading this exotic currency pair seems to be feasible. We can see from the above table that the highest Percentage of values are barely above 100%. It means this currency pair is relatively less expensive to trade.

The most significant costs are in the hourly timeframe only, as the costs in 2H, 4H, and daily timeframes are also low. However, every trader should avoid the volatile market condition. Therefore, the best way to trade this pair is to look out for the possibilities to be on lower timeframes also while sticking to the average volatile level.

Also, traders can reduce the trading costs further by eliminating market orders and placing orders as ‘limit’ and ‘stop.’ In this case, slippage can completely be avoided. Please go through the below table to further understand this.

STP Model Account (Using Limit Orders)

Spread = 31 | Slippage = 0 | Trading fee = 0

Total cost = Spread + Slippage + Trading Fee

= 31 + 0 + 0 = 31 

Categories
Forex Assets

Asset Analysis – Trading The NZD/QAR Forex Exotic Pair

Introduction

NZD is the authorized currency of New Zealand, while the QAR (Qatari Rial) is the official currency of Qatar. The combination of these two currencies forms the NZDQAR exotic pair. As a trader, we aim to identify the possible movement in this pair by an appropriate analysis method and make money from the differential.

Understanding NZD/QAR

In every currency pair, the first currency is known as the base currency, and the second currency is known as the quote currency. We can quote it as 1 NZD per X numbers of QAR. For example, if the NZDQAR pair’s value is at 2.4460; therefore, we need almost 2.4460 QAR to buy one NZD.

NZD/QAR Specification

Spread

The bid price is the price level that buyers are willing to pay when they buy an instrument. Similarly, ask price is the lowest price that a seller is willing to pay when they sell a currency pair. The difference between these prices is known as Spread. This value changes with the change of the execution model.

Spread on ECN: 12 pips | Spread on STP: 17 pips

Fees

The fee or commission in Forex is similar to the one that is pair to stockbrokers where it is automatically deducted from traders’ accounts when they take a trade. However, an STP account does not take any fees but a few pips on ECN accounts.

Slippage

There is some market condition when we enter a buy or sell trade, but the trade opens some pips higher or lower, known as Slippage. The Slippage might happen when the market is volatile.

Trading Range in NZD/QAR

Procedure to assess Pip Ranges

  1. Add the ATR indicator to your chart
  2. Set the period to 1
  3. Add a 200-period SMA to this indicator
  4. Shrink the chart so you can assess a large time period
  5. Select your desired timeframe
  6. Measure the floor level and set this value as the min
  7. Measure the level of the 200-period SMA and set this as the average
  8. Measure the peak levels and set this as Max.

NZDQAR Cost as a Percent of the Trading Range

With the volatility values obtained from the above table, we can see how the cost varies as the volatility of the market varies. All we did is, got the ratio between the total cost and the volatility values and converted into percentages.

ECN Model Account 

Spread = 12 | Slippage = 5 | Trading fee = 8

Total cost = Spread + Slippage + Trading Fee

= 12 + 5 + 8 = 25

STP Model Account

Spread = 17 | Slippage = 5 | Trading fee = 0

Total cost = Spread + Slippage + Trading Fee

= 17 + 5 + 0 = 22

The Ideal way to trade the NZD/QAR

The NZD/QAR is a currency pair that has a lot of volatility and liquidity. Therefore, it is easier for a trader to trade this exotic-cross currency. If we analyze the table mentioned above, we can say that the H1 timeframe has the highest cost as a percentage of the trading range at an average of 44.64%, where the average movement is almost 56 pips. The increase in volatility provides higher price fluctuation, but it is often risky for a trader as there is a possibility of unwanted stop loss hit and reverse back.

Moreover, in the monthly timeframe, the price of the NZD/QAR provides an excellent movement with a low cost of an average of 0.77% only. Therefore, if we trade this pair in a higher timeframe, we might reduce the risk of market volatility. We can also use limit orders in the place of market orders to further reduce the costs, as shown below.

STP Model Account (Using Limit Orders)

Spread = 12 | Slippage = 0 | Trading fee = 0

Total cost = Spread + Slippage + Trading Fee

= 12 + 0 + 0 = 12

Categories
Forex Assets

Analyzing The Costs Involved While Trading The NZD/SGD Exotic Forex Pair

Introduction

NZD/SGD is the abbreviation for the native currencies of New Zealand and Singapore. It is considered an exotic pair, where NZD is the first (base) currency, and SGD is the second (quote) currency.

Understanding NZDSGD

This pair’s price determines the value of SGD, which is equivalent to one New Zealand Dollar, NZD. We can quote it as 1 NZD per X number of SGD. For example, if the NZDSGD pair’s value is at 0.90759, we need almost 0.90759 SGD to buy one NZD.

NZDSGD Specification

Spread

The spread comes from the difference between the bid and the ask prices offered by the broker. This value is controlled by the brokers; therefore, traders don’t have a say in this. This value varies on the type of execution used for performing the trades. Below are the ECN and STP values for NZD/SGD currency pair.

Spread on ECN: 26 pips | Spread on STP: 31 pips

Fees

The fee or commission in Forex is similar to the one that is paid to stockbrokers, where it is automatically deducted from traders’ accounts when they take a trade. Note that there are no fees on STP trading accounts, but a few pips are charged on ECN accounts.

Slippage

Slippage happens when a trader tries to open a trade in a price, but it opens at another price. The main reason to occur slippage is the market volatility and the broker’s execution speed.

Trading Range in NZDSGD

Procedure to assess Pip Ranges

  1. Add the ATR indicator to your chart
  2. Set the period to 1
  3. Add a 200-period SMA to this indicator
  4. Shrink the chart so you can assess a large time period
  5. Select your desired timeframe
  6. Measure the floor level and set this value as the min
  7. Measure the level of the 200-period SMA and set this as the average
  8. Measure the peak levels and set this as Max.

NZDSGD Cost as a Percent of the Trading Range

If we look at the volatility values at the above table, we can see how the cost changes with the change in volatility of the market. We just have got that ratio and converted into percentages.

ECN Model Account 

Spread = 26 | Slippage = 5 | Trading fee = 8

Total cost = Spread + Slippage + Trading Fee

= 26 + 5 + 8

Total cost = 39

STP Model Account

Spread = 26 | Slippage = 5 | Trading fee = 0

Total cost = Spread + Slippage + Trading Fee

= 26 + 5 + 0

Total cost = 31

The Ideal way to trade the NZDSGD

The NZDSGD is a currency pair that has a lot of volatility and liquidity. Therefore, it is easier for a trader to trade this currency pair. The above-mentioned percentage values are all within almost 500%. It is an indication that the cost is higher in the lower timeframe and lowers in the higher timeframe.

In other words, the cost rises with an increase in volatility. Therefore, the risk of this pair is that it is highly volatile. However, the best time to trade in this pair is when the volatility is at the average value. A decrease in volatility is ineffective, while the increase in volatility is risky. Therefore, sticking to the average value is suitable for this pair.

Furthermore, there’s an additional way to lessen the cost of the trades you execute. This is by placing a pending order as a ‘limit’ order instead of a ‘market’ order. In this case, there will be no slippage. So, in this example, the total cost will be reduced by five pips.

STP Model Account (Using Limit Orders)

Spread = 26 | Slippage = 0 | Trading fee = 0

Total cost = Spread + Slippage + Trading Fee

= 26 + 0 + 0

Total cost = 26

Categories
Forex Assets

Costs Involved While Trading The NZD/INR Forex Currency Pair

Introduction

The abbreviation of NZD/INR is the New Zealand Dollar paired with the Indian Rupee. Here, NZD is the official currency of New Zealand, and Indian Rupee is India’s currency. Like other currency pairs, NZD/INR provides some decent movement that allows traders to make money from the forex market.

Understanding NZD/INR

In NZD/INR currency pairs, NZD is the base currency (First Currency), and the INR is the quote currency (Second Currency). In a currency pair’s sell trade, we trade the base currency to buy the quote currency and vice versa. Therefore, if the NZD/INR pair is trading at 49.02, it means we should have 49.02 INR to buy 1 NZD.

Spread

As price and bid price is a common term in the forex market, most of the traders should know. The price represents the price in which we sell a currency pair. On the other hand, the bid price is the price at which we take a buy trade.

The difference between the asking price and the bid price is called the spread, usually a charge that the broker takes from a trader. Below are the spread values for the NZD/INR Forex pair.

ECN: 36 pips | STP: 41 pips

Fees

A Fee is a cost that traders pay to the broker as a charge to take a trade. This fee differs on the type of broker (ECN/STP) we use.

Slippage

In some cases, when we take a trade at a particular price, it might ignore the level and open the trade at another price, which is usually known as Slippage. The Slippage can occur at any price level and at any time, usually when the market remains volatile.

Trading Range in NZD/INR

Our aim as a trader is to eliminate losses and minimize trading risks. The trading range here will indicate how much we will make as a profit or loss within a timeframe. To calculate the exact value, we will use ATR is a technical indicator that suggests the price movement in a currency pair. In the lower table, we interpret the minimum, average, and maximum pip movement in a currency pair. We will assess it merely by using the ATR indicator merged with 200-period SMA.

Procedure to assess Pip Ranges

  1. Add the ATR indicator to your chart
  2. Set the period to 1
  3. Add a 200-period SMA to this indicator
  4. Shrink the chart so you can assess a considerable time period
  5. Select your desired timeframe
  6. Measure the floor level and set this value as the min
  7. Measure the level of the 200-period SMA and set this as the average
  8. Measure the peak levels and set this as Max.
  9. NZD/INR Cost as a Percent of the Trading Range

The price of trade differs on the type of brokers and varies based on the volatility of the market. The full cost of trade involves fees, spread, and sometimes Slippage if the volatility is higher.

ECN Model Account

Spread = 36 | Slippage = 5 |Trading fee = 8

Total cost = Slippage + Spread + Trading Fee = 5 + 36 + 8 = 49

STP Model Account

Spread = 41 | Slippage = 5 | Trading fee = 0

Total cost = Slippage + Spread + Trading Fee = 5 + 41 + 0 = 46

The Ideal way to trade the NZD/INR

Considering the table, we should evaluate these two factors to make trading decisions in the NZD/INR pair. The trading cost and volatility are two critical factors that trade should contemplate when trading in the currency market.

In timeframes, we can see the price movement fluctuates from the minimum volatility and the average volatility. As a trader, we aim to make a profit from this pip movement and variation. However, it often becomes challenging to make a profit if there is no sufficient variant in the pip value. As per the price mentioned above, the NZD/INR pair is profitable in swing trading and day trading.

Categories
Forex Assets

How Expensive Is It To Trade The NZD/MYR Currency Pair

Introduction

The abbreviation of NZD/MYR is the New Zealand Dollar paired with the Malaysian Ringgit. Here, NZD is the official currency of New Zealand and many others like the Pitcairn Islands and the Cook Islands. It is also to be the tenth most traded currency in the Foreign exchange market. MYR stands for the Malaysian Ringgit, and it is the official currency of Malaysia, which is further divided into 100 sens.

Understanding NZD/MYR

In NZD/MYR currency pairs, NZD is the base currency (First Currency), and the MYR is the quote currency (Second Currency). In the foreign exchange market, while we sell the currency pair, we always trade the base currency and simultaneously purchase the quote currency and vice versa. The market value of NZD/MYR helps us to understand the intensity of MYR against the NZD. So if the exchange value for the pair NZD/MYR is 2.7977, it means we need 2.7977 MYR to buy 1 NZD.

Spread

Foreign brokers hold two different prices for currency pairs: the ask and bid price. The ask (offer) price is the price in which we sell an asset, and bid(purchase) is the cost at which we buy it. The difference between the ask-bid price is called the spread. Below are the spread values for the NZD/MYR Forex pair.

ECN: 38 pips | STP: 43 pips

Fees

A Fee is the costs that we tradesmen pay to the broker for initiating a trade. This fee differs on the type of broker (ECN/STP) we use.

Slippage

When we want to achieve a trade at an appropriate price, but instead, if the trade gets fulfilled at a distinctive price, we call that distinction as Slippage. The Slippage can occur at any point in time, but often we can counter a volatile market.

Trading Range in NZD/MYR

As a trader, our main interest should be to prevent losses and minimize risks. The trading range here will ascertain the amount of income we will make or lose within a timeframe. ATR is a technical indicator that suggests the price movement in a currency pair. In the lower table, we have the interpretation of the minimum, average, and maximum pip movement in a currency pair. We will assess it merely by using the ATR indicator merged with 200-period SMA.

Procedure to assess Pip Ranges

  1. Add the ATR indicator to your chart
  2. Set the period to 1
  3. Add a 200-period SMA to this indicator
  4. Shrink the chart so you can assess a large time period
  5. Select your desired timeframe
  6. Measure the floor level and set this value as the min
  7. Measure the level of the 200-period SMA and set this as the average
  8. Measure the peak levels and set this as Max.

NZD/MYR Cost as a Percent of the Trading Range

The price of trade differs on the type of brokers and varies based on the volatility of the market. The full cost of trade involves fees, spread, and sometimes Slippage if the volatility is higher.

ECN Model Account

Spread = 38 | Slippage = 5 |Trading fee = 8

Total cost = Slippage + Spread + Trading Fee = 5 + 38 + 8 = 51 

STP Model Account

Spread = 43 | Slippage = 5 | Trading fee = 0

Total cost = Slippage + Spread + Trading Fee = 5 + 43 + 0 = 48

The Ideal way to trade the NZD/MYR

With the assistance of the above tables, let us estimate these two factors to the trade the NZD/MYR pair. Volatility and cost are two aspects a trader must contemplate for trading any currency pair in the foreign exchange market.

In several timeframes, we can see the pip movement is tremendously elevated between the min volatility and the avg volatility. As a day trader, the objective is to attain profits from the pip variation of the market. It becomes challenging to make profits from the market if there is no variation in the pip value. Hence, trading this pair can be considered both profitable and risky. The answer to the question if trading this pair is expensive, is yes.

Trading using Limit Orders (STP Account Model)

To decline our expenses of trade, we can place the trades using limit orders as a substitute for market orders. In doing so, we can avoid the Slippage that will help lower the total cost of the trade. An instance of a Limit order is given below using the STP model.

Spread = 43 | Slippage = 0 | Trading fee = 0

Total cost = Slippage + Spread + Trading Fee = 0 + 43 + 0 = 43

Categories
Forex Assets

How Expensive Is It To Trade The NZD/DKK Forex pair?

Introduction

NZD is the symbol of the New Zealand dollar, and it is the 10th most traded currency in the Foreign Exchange market. It is the official currency of New Zealand and some other countries like Cook Islands, Niue, the Ross Dependency. Whereas DKK stands for Danish Krone, and it is the official currency of Denmark, Greenland, and the Faroe Islands.

The currencies in the Foreign exchange market are traded in pairs. NZD/DKK is the acronym for the New Zealand dollar against the Danish Krone. In this case, the first currency (NZD) is the base currency, and the second (DKK) is the quote currency.

Understanding NZD/DKK

To find the comparative value of one currency in the Forex market, we need another currency to evaluate. If the value of the first(base) currency goes down, the value of the second (quote) currency moves up and vice versa. The market value of NZD/DKK determines the strength of DKK against the NZD. It can be clearly understood as 1 NZD is equal to how much of DKK. So if the exchange price for the pair NZD/DKK is 4.1943, it means we need 4.1943 DKK to buy 1 NZD.

Spread

Forex brokers have two different rates for currency pairs: the bid & ask price. Here the “bid” price at which we can OFFER the base currency, and The “ask” price is at which we can ACQUIRE the base currency. Therefore, the difference between the ask and the bid price is called the spread. Some brokers, instead of charging a split fee for trading, they already have the fees inherent in the spread. Below are the ECN and STP for the pair:

ECN: 15 pips | STP: 20 pips

Fees

When we place any trade, there is some payment/commission we need to pay to the broker. A Fee is simply that payment that we pay to the broker each time we open a position. The fee also fluctuates from the type of broker we use; for instance, there are no charges on STP account models, but a few pips on ECN accounts.

Slippage

The difference between the anticipated and executed price at which the trade is implemented can be termed as Slippage. It can appear at any time but mostly happens when the market is fast-phased and volatile.

Trading Range in NZD/DKK

The trading range is a tabular interpretation of the pip movement in a currency pair for separate timeframes. Using this, we can gauge the risk on a trade for each timeframe. A trading range effectively represents the minimum, average, and maximum pip movement in a currency pair. This can be assessed quickly by using the ATR indicator combined with 200-period SMA.

Procedure to assess Pip Ranges

  1. Add the ATR indicator to your chart
  2. Set the period to 1
  3. Add a 200-period SMA to this indicator
  4. Shrink the chart so you can assess a large time period
  5. Select your desired timeframe
  6. Measure the floor level and set this value as the min
  7. Measure the level of the 200-period SMA and set this as the average
  8. Measure the peak levels and set this as Max.

NZD/DKK Cost as a Percent of the Trading Range

The cost of trade primarily varies on the broker and fluctuates based on the volatility of the market. This is for the reason that the total cost includes Slippage and spreads apart after the trading fee. Following is the description of the cost variation in terms of percentages. The knowledge of it is discussed in the subsequent sections for ECN and STP accounts.

ECN Model Account

Spread = 15 | Slippage = 5 |Trading fee = 8

Total cost = Slippage + Spread + Trading Fee = 5 + 15 + 8 = 28

STP Model Account

Spread = 20 | Slippage = 5 | Trading fee = 0

Total cost = Slippage + Spread + Trading Fee = 5 + 20 + 0 = 25

The Ideal way to trade the NZD/DKK

The NZD/DKK is an exotic currency pair, and the volatility in this pair is moderate. As seen in the range table above, the average pip movement on the 1hour time frame is 68. We must know that the cost of trade declines as the volatility of the pair increases. But this should not be held as an advantage because it is unsafe to trade high volatile markets as the prices rise and fall swiftly.

For instance, in the 1-hour timeframe, the maximum pip range value in this pair is 119 pips, and the minimum pip range value is 20 pips. When we compare the fees for both the pip movements, we find that for 20 pip movement fees is 140.00%, and for a 119 pip movement, the fess is only 23.53%.

So, we can substantiate that the prices are more significant for low volatile markets and high for extremely volatile markets. Hence, we must constantly try to make our entries and exits when the volatility is minimum or average than to that of maximum values. But if your preference is certainly towards decreasing your trading costs, you can trade when the market’s volatility is near the maximum values with optimal risk management.

Categories
Forex Assets

Asset Analysis – Trading The NZD/SEK Exotic Cross Currency Pair

Introduction

NZD/SEK is the acronym for the currency pair New Zealand dollar versus the Swedish Krona. It is marked under the exotic cross-currency pair category. In this pair, NZD will be the base currency, and SEK will be the quote currency. In this article, we shall understand everything about trading this currency pair.

Understanding NZD/SEK

The price of this pair in the foreign exchange market determines the value of SEK comparable to one NZD. It is quoted as 1 NZD per X SEK. So, if the value of this pair is 5.8296, these many Swedish Kronor (SEK) are required to purchase one NZD.

Spread

Trading the Forex market usually does not involve spending a lot of fees like the Stock market. Here, Forex brokers make profits through spreads. It is nothing but the difference between Bid – Ask prices of an asset. Some broker has the cost inherent into the buy and sell prices of the currency pair; instead of charging a separate fee. Below are the spread values of ECN and STP brokers for the NZD/SEK pair.

ECN: 48 pips | STP: 53 pips

Fees

A Fee is the charges we pay to the stockbroker for executing a particular trade. The fee fluctuates from the type of broker we choose. For example, the fee on the STP accounts is zero, but we can expect a few additional pips on ECN accounts.

Slippage

Slippage is the contrast between the price expected by the trader for execution and the price at which the agent executed the price. There is this variation due to the high market volatility and more passive execution speed.

Trading Range in NZD/SEK

The trading range is used at this point; to measure the volatility of the NZD/SEK pair. The amount of money we will gain or lose in an allotted timeframe can be evaluated using the trading range table. The minimum, average, and maximum pip movement of the currency pair is exemplified in the trading range. This can be evaluated simply by using the ATR indicator combined with 200-period SMA.

Procedure to assess Pip Ranges

  1. Add the ATR indicator to your chart
  2. Set the period to 1
  3. Add a 200-period SMA to this indicator
  4. Shrink the chart so you can assess a large time period
  5. Select your desired timeframe
  6. Measure the floor level and set this value as the min
  7. Measure the level of the 200-period SMA and set this as the average
  8. Measure the peak levels and set this as Max.

NZD/SEK Cost as a Percent of the Trading Range

The rate of trade varies on the stockbroker and fluctuates according to the volatility of the market. This is because the trading cost includes fees, slippage, and the spread. The rate of variation in terms of percentage is given below.

ECN Model Account

Spread = 48 | Slippage = 5 |Trading fee = 8

Total cost = Slippage + Spread + Trading Fee = 5 + 48 + 8 = 61

STP Model Account

Spread = 53 | Slippage = 5 | Trading fee = 0

Total cost = Slippage + Spread + Trading Fee = 5 + 53 + 0 = 58

The Ideal way to trade the NZD/SEK

The NZD/SEK is termed as an exotic-cross currency pair and has a low volatile market. Looking at the pip range table, the average pip movement on the 1H timeframe is 115 pips, which implies high volatility. As we know, the higher the volatility, the smaller will be the cost to implement the trade. Nonetheless, this is not a benefit to trading in a volatile market; it involves higher risk.

For instance, in the 1M time frame, the Maximum pip range value is 1938, and the minimum is 503. When we evaluate the trading fees for both the pip movements, we notice that for 503 pip movement fees is 12.13%, and for the 1938 pip movement, fess is only 3.15%. Therefore, from the above instance, we can determine that trading the NZD/SEK currency pair will be on the expensive side.

Categories
Forex Assets

Analyzing the Trading Costs on ‘NZD/CZK’

Introduction

NZD/CZK is the abbreviation for the Euro Area’s Euro against the Czech Koruna. This pair is considered an exotic-cross currency pair. Here, the NZD is the base (first) currency, and the CZK is the quote (second) currency. NDZ is the official currency used in New Zealand, while CZK is the native currency of the Czech Republic.

Understanding NZD/CZK

The price of this pair in the foreign exchange market defines the value of CZK equivalent to one NZD. It is quoted as 1 NZD per X CZK. So, if the value of this pair is 14.8124, these many Korunas are required to purchase one NZD.

Spread

Spread is the mathematical difference between the bid and the asking price offered by the broker. This value is distinct in the ECN account model and STP account model. An approximate value for NZD/CZK pair is given below.

ECN: 43 pips | STP: 48 pips

Fees

The fee is the price/compensation that one pays for the trade. There are no charges on STP accounts, but a few additional pips are levied on ECN accounts.

Slippage

Slippage is a variation between the value proposed by the trader, and the trader indeed received from the broker.

Trading Range in NZD/CZK

The tabular interpretation of the pip movement of a currency pair in separate timeframes is called as the trading range is the. These values are helpful in influencing the profit that can be produced from a trade before-hand. To uncover the value, you must multiply the below volatility price with the pip value of this pair.

Procedure to assess Pip Ranges

  1. Add the ATR indicator to your chart
  2. Set the period to 1
  3. Add a 200-period SMA to this indicator
  4. Shrink the chart so you can assess a large time period
  5. Select your desired timeframe
  6. Measure the floor level and set this value as the min
  7. Measure the level of the 200-period SMA and set this as the average
  8. Measure the peak levels and set this as Max.

NZD/CZK Cost as a Percent of the Trading Range

Trading Range is the interpretation of the total price variation of trades for distinct timeframes and volatilities. The values are achieved by discovering the ratio amongst the total price and the volatility value; it is expressed as a percentage.

ECN Model Account

Spread = 43 | Slippage = 5 |Trading fee = 8

Total cost = Slippage + Spread + Trading Fee = 3 + 43 + 8 = 56 


STP Model Account

Spread = 48 | Slippage = 5 | Trading fee = 0

Total cost = Slippage + Spread + Trading Fee = 5 + 48 + 0 = 53

Trading the NZD/CZK

The bigger the percentage values, the higher is the price on the trade. From the preceding tables, we can see that the values are sizeable in the min column and relatively less significant in the maximum column. This means that the prices are high when the volatility of the market is low.

It is neither suitable to trade when the market’s volatility is elevated nor when the costs are high. To balance out between both these aspects, it is perfect to trade when the volatility of the pair is in the array of the average values.

Additionally, to decrease your costs even beyond, you may place trades using limit orders as a substitute for market orders. In executing so, the slippage will not be involved in the computation of the total costs. And this will put down the cost of the trades by a sizeable number. An example of the same is given below.

STP Model Account (Using Limit Orders)

Spread = 48 | Slippage = 0 |Trading fee = 0

Total cost = Slippage + Spread + Trading Fee = 0 + 48 + 0 = 48

Categories
Forex Assets

NZD/PLN – Analyzing This Exotic Forex Currency Pair

Introduction

NZD/PLN is the short form of the currency pair New Zealand dollar vs. Polish Zloty. Here, the New Zealand dollar (NZD) is the base currency, and the Polish Zloty (PLN) is the quote currency. In this article, we intend to comprehend everything you need to know about trading this currency.

Understanding NZD/PLN

The price of NZD/PLN signifies the value of the Polish Zloty corresponding to one New Zealand Dollar. It is estimated as 1 NZD (New Zealand Dollar) per X PLN (Polish Zloty). So, if the market value of NZD/PLN is 2.4940, these many Polish Zloty are required to buy one NZ dollar.

Spread

The distinction between the ask & bid costs is recognized as the spread. It changes with the implementation model used by the stockbrokers. Further down are the spreads for NZD/PLN currency pairs in both ECN account models & STP account models:

ECN: 30 pips | STP: 35 pips

Fees

There are certain charges levied by the broker to open every spot in the trade. These charges can be referred to as the commission or fees applicable to the trade. Note that these charges are only applicable to the ECN accounts and not on STP accounts. However, a few additional pips are changed on STP account models.

Slippage

Due to high market volatility and the broker’s slow implementation speed, slippage is common. It is a variance in price intended by the trader and price implemented by the broker.

Trading Range in NZD/PLN

The trading range is essentially a tabular interpretation of the pip movement in the NZD/PLN currency pair for distinct timeframes. These figures can be used to ascertain the trader’s risk as it helps us determines the approx. gain/loss that can be incurred on a trade.

Procedure to assess Pip Ranges

  1. Add the ATR indicator to your chart
  2. Set the period to 1
  3. Add a 200-period SMA to this indicator
  4. Shrink the chart so you can assess a large time period
  5. Select your desired timeframe
  6. Measure the floor level and set this value as the min
  7. Measure the level of the 200-period SMA and set this as the average
  8. Measure the peak levels and set this as Max.

NZD/PLN Cost as a Percent of the Trading Range

The total cost consists of slippage, trading fee, and the spread. This fluctuates with the volatility of the market. Therefore, traders need to place themselves to avoid paying high costs. Below is a table demonstrating the variation in the costs for various values of volatility.

ECN Model Account

Spread = 30 | Slippage = 5 |Trading fee = 8

Total cost = Slippage + Spread + Trading Fee = 5 + 30 + 8 = 43 


STP Model Account

Spread = 35 | Slippage = 5 | Trading fee = 0

Total cost = Slippage + Spread + Trading Fee = 5 + 35 + 0 = 40

The Ideal way to trade the NZD/NOK

NZD/PLN is an exotic-cross currency pair. In this case, we can see, the average pip movement in 1hr timeframe is 46, which signifies higher volatility. The smaller the volatility, the higher is the risk, and lesser is the cost of the trade and the other way around. For example, we can see from the trading range that when the pip movement is lesser, the charge is higher, and when the pip movement is higher, the charge is smaller.

To further decrease our costs of trade, the costs can be reduced even more by placing orders as a limit or stop as an alternative to the market orders. In executing so, the slippage will become zero and will lower the total cost of the trade further. In doing so, the slippage will be eliminated from the computation from the total costs. And this will assist us in decreasing the trading cost by a significant margin. An instance of the same is given below using the STP model account.

STP Model Account (Using Limit Orders)

Spread = 35 | Slippage = 0 | Trading fee = 0

Total cost = Slippage + Spread + Trading Fee = 0 + 35 + 0 = 35

Categories
Forex Assets

Everything About Trading The NZD/RON Forex Exotic Pair

Introduction

NZD/RON is the acronym for the New Zealand Dollar against the Romanian Leu. It is categorized as an exotic-cross currency pair that usually has a low trading volume. Here, the New Zealand Dollar is the base currency, and the Romanian Leu (on the right) is the quote currency. The RON (Romanian Leu) is the formal currency of Romania, and one RON is further divided into 100 bani.

Understanding NZD/RON

To identify the relative value of one currency, we require another currency to compare. If the base currency’s value comes down, the value of the quote currency goes up and contrariwise. If the market cost of this pair is 2.7393, then this amount of RON is required to buy one unit of NZD.


Spread

Foreign exchange brokers have two separate prices for currency pairs, which are categorized as the ask and bid price. The offering price is the bid price, and the buying price is the asking price. The difference between the bid/ask price is recognized as the spread. The spread is how stockbrokers make their revenue. Below are the spreads for NZD/RON currency pairs in both ECN & STP brokers.

ECN: 35 pips | STP: 40 pips

Fees

A Fee is a payment we pay to the broker each time we open a spot. There is no additional payment charged on STP accounts, but a few extra pips are charged on ECN accounts.

Slippage

Slippage is the difference between the trader’s predicted price and the actual price at which the trade is implemented. It can appear at any given time but often arises when the market is moving fast and is volatile.

Trading Range in NZD/RON

The amount of money we earn or lose in a timeframe can be estimated using the trading range table. It is an example of the minimum, average, and maximum pip movement in a currency pair. This can be measured simply by using the ART indicator with 200-period SMA.

Procedure to assess Pip Ranges

  1. Add the ATR indicator to your chart
  2. Set the period to 1
  3. Add a 200-period SMA to this indicator
  4. Shrink the chart so you can assess a large time period
  5. Select your desired timeframe
  6. Measure the floor level and set this value as the min
  7. Measure the level of the 200-period SMA and set this as the average
  8. Measure the peak levels and set this as Max.

NZD/RON Cost as a Percent of the Trading Range

The cost of trade generally differs on the broker and differs based on the volatility of the market. This is because the total cost also comprises slippage and spreads, excluding the trading fee. Below is the understanding of the cost variation in terms of percentages. The insights of it are discussed in the subsequent sections.

ECN Model Account

Spread = 35 | Slippage = 5 |Trading fee = 8

Total cost = Slippage + Spread + Trading Fee = 5 + 35 + 8 = 48  


STP Model Account

Spread = 40 | Slippage = 5 | Trading fee = 0

Total cost = Slippage + Spread + Trading Fee = 5 + 40 + 0 = 45

The Ideal way to trade the NZD/RON

Understanding the above tables is pretty simple. The percentage values are directly relative to the total cost of the trade. It is seen that the percentages are relatively high on the minimum column and vice versa. Now, coming to the best time to enter the market, it is when the volatility of NZD/RON is somewhere near the avg pip movement. Trading in such minutes will guarantee low costs as well as lower liquidity.

Speaking about timeframes, trading in 4H and Daily timeframe would be great, as the cost is manageable, and the trade is also not very time-consuming.

Another simple hack to cut down the cost is by trading using limit/pending orders instead of market orders. This will considerably lower costs on a trade because the slippage on the trade becomes 0. It many cases, the cost lowers by about 50% of the original value when we use limit orders.

Categories
Forex Videos

How To Trade The New Zealand Dollar Right Now! Corona Virus Continued

How to trade the New Zealand Dollar

New Zealand’s gross domestic product is largely derived from its international exports of milk powder, butter, cheese, meat, edible offal, and lamb as well as sales of beef, logs, and wood, crude oil, cereals, flour, and starch. It has an extremely efficient agricultural system. Its exports rose 4.8 percent over the previous year to NZD 5544 million in December 2019, after rising 7.3 percent in November. Exports to China rose by +5.8 percent and now running at 18% of its total exports. And while it is not as exposed to the same level as Australia to the Coronavirus crisis in China, it is seen as a perceived risk to the market and where the NZDUSD decreased 0.0025 or 0.39% to 0.6463 on Friday, January 31 from 0.6488 in the previous trading. The New Zealand dollar is one of the six major currencies. So let’s take a look at a daily chart of the NZDUSD pair, and try and find some directional bias.

Example A


In example A, we can see that daily price action has been largely contained within the resistance and support lines as noted on the chart, however, when price action failed to reach the resistance line at position A, we see a pullback lower in the pair and where price action has pushed below the support line at position B or 0.64870, and where this push lower coincides with sentiment and risk pertaining to the outbreak of the Coronavirus. It is highly unlikely that this outbreak will be contained any time soon and where no vaccine has yet been made. And therefore, we can presume that price action will be driven down to the 0.640 key level, and if breached, we may see a continuation down to our support line at position C and which should be considered a target.

Example B


To try and backup our Theory, we now turn our attention to example B, which is a daily chart of the New Zealand dollar against the Japanese yen. We have a similar situation in this chance where price action has been contained within an overall level of resistance and to periods of support that go back to May 2019. we are more interested in the recent activity as defined by position a price action failed to reach the resistance line at 73.40 on two separate occasions. Recently we can see that the New Zealand dollar has fallen against the Japanese yen and breached the support line at position C, and wear this price action coincides with a weakening in the New Zealand dollar due to its dependence on exporting to China coupled with the fact that is being bought because of its safe-haven status. Traders should be looking for opportunities to short this pair on their preferred time frame and where a target should be sought at around position the which is the 66.8 one support line held previously.

Traders should be looking out for New Zealand building permits and employment figures, which will be carefully analyzed for directional bias, but the key event to consider will be how the market responds to the Chinese markets opening after an extended Lunar New Year closure. This coincides with the Wuhan coronavirus outbreak. Trade balance and PMIs are due to be released.

Categories
Forex Assets

AUD/NZD – Everything About This Forex Currency Pair

Introduction

AUD/NZD is derived from the full-form of the currency pair, the Australian dollar, and the New Zealand dollar. It comes under the classification of cross currency pairs. In this pair, AUD is the base currency, and NZD is the quote currency.

Understanding AUD/NZD

The value of AUD/NZD depicts the value of NZD that is equivalent to AUD. It is simply quoted as 1 AUD per X NZD. For example, if the current value of this pair is 1.0405, then these many New Zealand dollars are needed to purchase one Australian dollar.

AUD/NZD Specification

Spread

Spreads are a typical way through which brokers make money. The pip difference between the bid price and the ask price is their profit margin, which is referred to as the spread. It varies from the type of account model.

ECN: 0.9 | STP: 1.8

Fees

The fee is basically the commission on a trade levied by the broker on each trade. Again, it varies from the type of account model.

Fee on STP = 0

Fee on ECN = 6 to 10 pips (starts from as low as one pip)

Slippage

The slippage is the difference between the broker’s executed price and the trader’s execution price. There is this variation as the order is executed using market execution. There are two reasons for slippage to take place.

  • Broker’s execution speed
  • Market’s volatility

Trading Range in AUD/NZD

Assessing the profit/risk is a great add-on to one’s trading analysis. With this, the trader can know how long he must before his trade performs. And below is the table that enables the analysis of it.

Procedure to assess Pip Ranges

  1. Add the ATR indicator to your chart
  2. Set the period to 1
  3. Add a 200-period SMA to this indicator
  4. Shrink the chart so you can assess a large time period
  5. Select your desired timeframe
  6. Measure the floor level and set this value as the min
  7. Measure the level of the 200-period SMA and set this as the average
  8. Measure the peak levels and set this as Max.

AUD/NZD Cost as a Percent of the Trading Range

This is one great application of the above table. By combining these values with the total cost of trade, one can determine variations in the costs by varying the parameters like volatility and timeframe.

ECN Model Account

Spread = 0.9 | Slippage = 2 |Trading fee = 1

Total cost = Slippage + Spread + Trading Fee = 2 + 0.9 + 1 = 3.9

STP Model Account

Spread = 1.8 | Slippage = 2 | Trading fee = 0

Total cost = Slippage + Spread + Trading Fee = 2 + 1.8 + 0 = 3.8

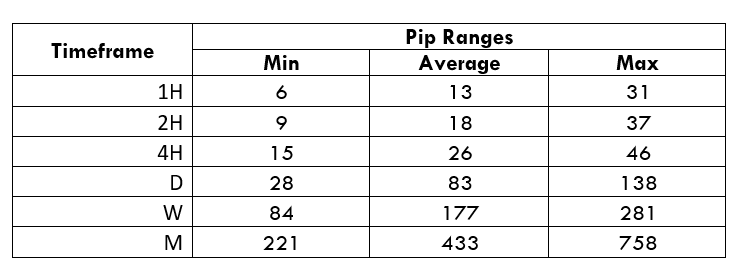
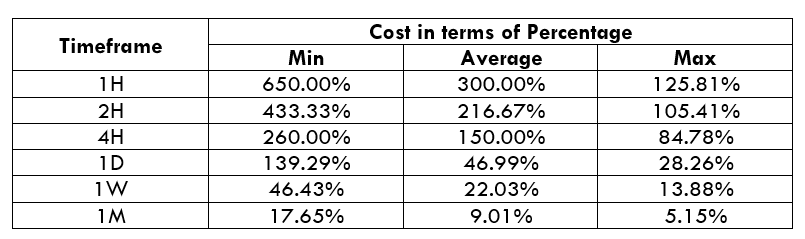
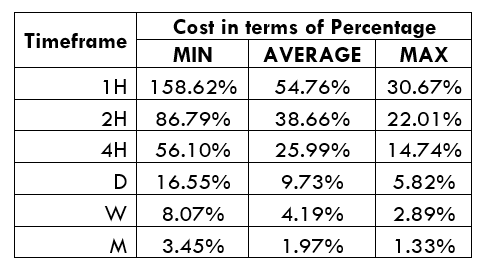
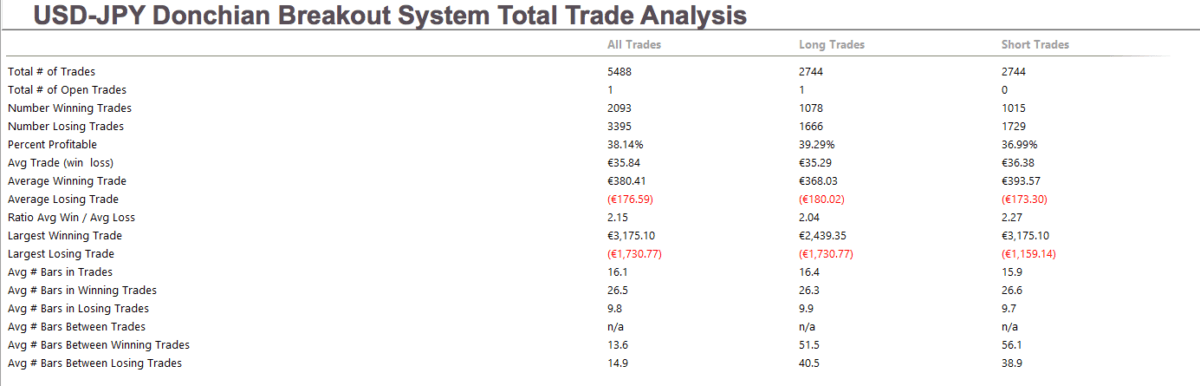
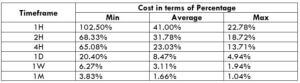
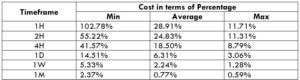
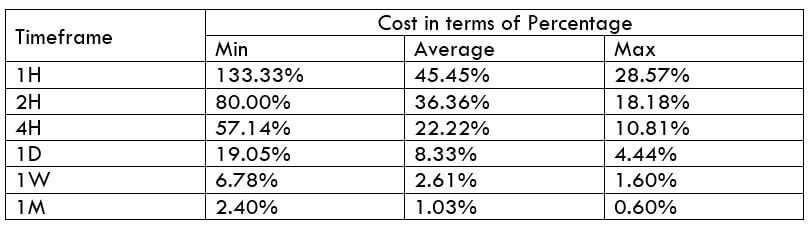
The Ideal way to trade the AUD/NZD

Before getting into finding the best way to trade this pair, let us comprehend what the above table has got to say.

The higher the magnitude of the percentages, the higher is the cost on the trade for that particular volatility and timeframe. The min column represents low volatility, and the max column represents high volatility.

It can clearly be ascertained from the table that the percentages are comparatively higher on the min column and lower on the max column. This means that the costs are high when volatility is low and vice versa.

But, it is not ideal to trade in neither of the two situations mentioned below.

When the volatility is high -> because of the risk involved
When the volatility is low -> because the costs are high

Now, to maintain a balance between all the parameters, it is best to trade when the pip movement is around the average values.

Furthermore, another simple way to reduce cost is by trading using a pending/limit order instead of market orders, as it will nullify the slippage on the trade. And this, in turn, will reduce the total cost of the trade as well.

Categories
Forex Assets

What Should You Know Before Trading The NZD/JPY Currency Pair

Introduction

NZDJPY, or the NZD/JPY or the New Zealand dollar against the Japanese yen, is a cross-currency pair in the Forex market. The left currency (NZD) represents the base currency, and the one the right (JPY) represents the quote currency.

Understanding NZD/JPY

The market value of NZDJPY is a value of JPY that is required to buy one NZD. It is quoted as 1 NZD per X JPY. For example, if the CMP (current market price) of NZDJPY is 72.657, then it takes 72.657 yen to buy one New Zealand dollar.

NZD/JPY Specification

Spread

Spread is the difference between the bid price and the ask price controlled by the broker. It varies across brokers and their type of execution.

ECN: 0.8 | STP: 1.7

Fees

On every trade a trader takes, there are few pips of fee on it. And this is only on ECN accounts because the fee on STP accounts is nil.

Slippage

Slippage, which happens on market orders, is the difference between the price asked by the client and the price he actually received. There are two primary reasons for it, namely, the broker’s execution speed and the change in volatility of the market.

Trading Range in NZD/JPY

The average, minimum, and maximum pip movement is determined in the trading range table. This comprehensive table helps traders assess the profit they can generate and loss they can incur in a given timeframe. Moreover, this table is helpful in analyzing the cost variation in a trade, which shall be discussed in the next section.

Procedure to assess Pip Ranges

  1. Add the ATR indicator to your chart
  2. Set the period to 1
  3. Add a 200-period SMA to this indicator
  4. Shrink the chart so you can assess a large time period
  5. Select your desired timeframe
  6. Measure the floor level and set this value as the min
  7. Measure the level of the 200-period SMA and set this as the average
  8. Measure the peak levels and set this as Max.

NZD/JPY Cost as a Percent of the Trading Range

The cost of a trade is not the same throughout the trading day. It varies based on the volatility of the market. Hence, it is necessary to know during what times the cost is high and what times it is low. This could be found out from the table illustrated below.

ECN Model Account 

Spread = 0.8 | Slippage = 2 |Trading fee = 1

Total cost = Slippage + Spread + Trading Fee = 2 + 0.8 + 1 = 3.8

STP Model Account

Spread = 1.7 | Slippage = 2 | Trading fee = 0

Total cost = Slippage + Spread + Trading Fee = 2 + 1.7 + 0 = 3.7

The Ideal way to trade the NZD/JPY

The magnitude of the cost percentage is directly proportional to the cost of a trade. So, the higher the value of the percentage, the higher is the cost of a trade. From the table, it can be observed that the cost is highest in the min column compared to the other two columns. This means that the costs are highest when the volatility of the market is low and vice versa, irrespective of the timeframe you’re trading. It is neither ideal to trade when the volatility of the market is high, nor when the costs are high. The average column is on the one we focus on. Trading when the volatility is at the average value is when you can expect moderate volatility and decent costs.

Also, you may reduce your costs by trading using limit or pending orders instead of market orders. This will bring the slippage to ground zero. This, in turn, will reduce the total cost of the trade as well. An example of the same is illustrated below.

Spread = 1.7 | Slippage = 0 | Trading fee = 0

Total cost = Slippage + Spread + Trading Fee = 0 + 1.7 + 0 = 1.7

Hence, it is seen that the costs have reduced by around 50% of the previous value.

Categories
Forex Assets

Knowing The Fundamentals Of NZD/USD Currency Pair

Introduction

New Zealand dollar versus the US dollar, in short, is referred to as NZD/USD or NZDUSD. This currency pair is classified as a major currency pair. In NZDUSD, NZD is the base currency, and USD is the quote currency. Trading the NZDUSD is as good as saying, trading the New Zealand dollar, as NZD is the base currency.

Understanding NZD/USD

The value (currency market price) of NZDUSD represents units of USD equivalent to 1 NZD. In layman terms, it is the number of US dollars required to purchase one New Zealand dollar. For example, if the value of NZDUSD is 0.6867, then 0.6867 USD is required to buy one NZD.

NZD/USD Specification

Spread 

The algebraic difference between the bid price and the ask price is called the spread. It depends on the type of execution model provided by the broker.

Spread on ECN: 1

Spread on STP: 1.9

Fees

Similar to spreads, fees also depend on the type of execution model. Usually, there is no fee on the STP model, but there is a small fee on the ECN model. In our analysis, we shall fix the fee to 1 pip.

Slippage

Slippage is the difference between the price asked by the trader for execution and the actual price the trader was executed. Slippage occurs on market orders. It is dependent on the volatility of the market as well as the broker’s execution speed. Slippage has a decent weight on the cost of each trade. More about it shall be discussed in the coming sections.

Trading Range in NZD/USD

The volatility of a currency pair plays a vital role in trading. It is a variable that differs from timeframe to timeframe. Understanding the range (min, avg, max) is essential for a trader, as it is helpful for reducing the cost of each trade.

The volatility gives the measure of how many pips the pair has moved on a particular timeframe. This, in turn, gives the approximate profit or loss on each timeframe. For example, if the volatility of NZDUSD on the 1H timeframe is 10 pips, then one can expect to gain or lose $100 (10 pips x $10 [pip value]) within an hour or two.

Below is a table that depicts the minimum, average, and maximum volatility (pip movement) on different timeframes.

AUD/USD PIP RANGES 

Procedure to assess Pip Ranges

  1. Add the ATR indicator to your chart
  2. Set the period to 1
  3. Add a 200-period SMA to this indicator
  4. Shrink the chart so you can assess a large time period
  5. Select your desired timeframe
  6. Measure the floor level and set this value as the min
  7. Measure the level of the 200-period SMA and set this as the average
  8. Measure the peak levels and set this as Max.

NZD/USD Cost as a Percent of the Trading Range

With the volatility values obtained in the above table, the total cost of each trade is calculated on each timeframe. These values are represented in terms of a percentage. And these percentages will determine during what values of volatility it is ideal to trade with low costs.

The total cost is calculated by adding up the spread, slippage, and trading fee. As a default, we shall keep the slippage at 2 and the trading fee for the ECN model at 1.

ECN Model Account

Spread = 1 | Slippage = 2 | Trading fee = 1

Total cost = Slippage + Spread + Trading Fee = 2 + 1 + 1 = 4

STP Model Account

Spread = 1.9 | Slippage = 2 | Trading fee = 0

Total cost = Slippage + Spread + Trading Fee = 2 + 1.9 + 0 = 3.9

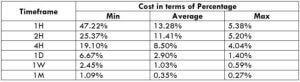
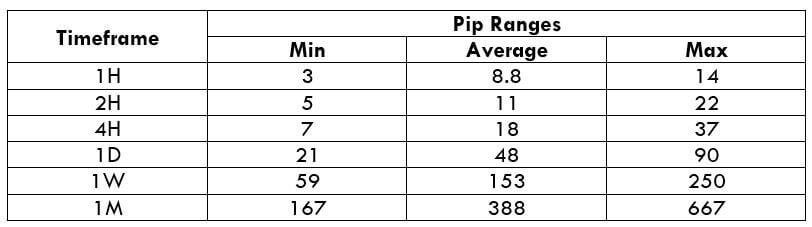
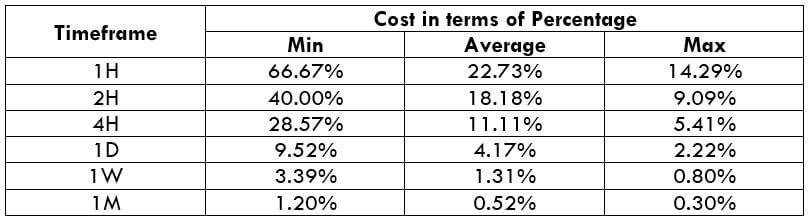
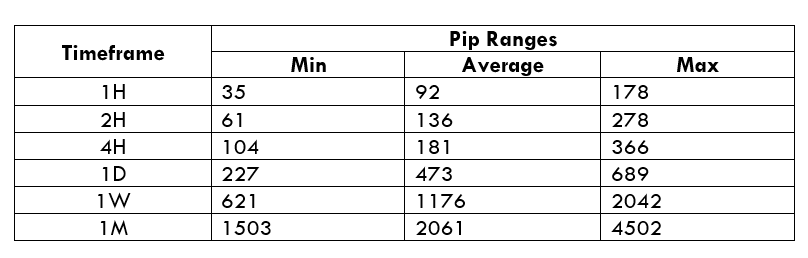
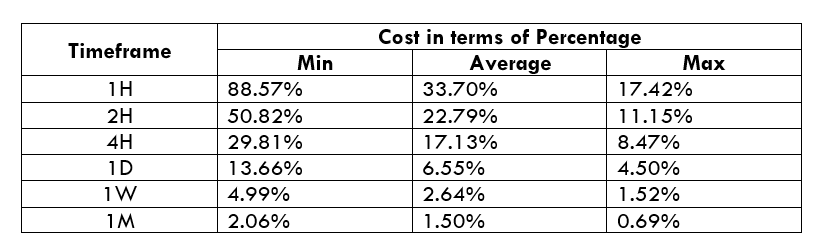
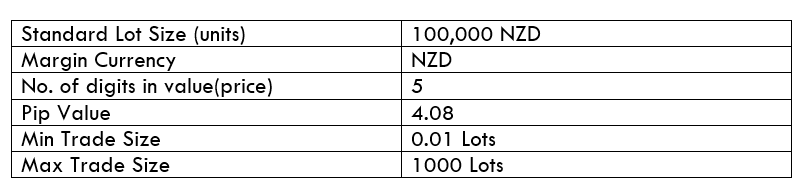
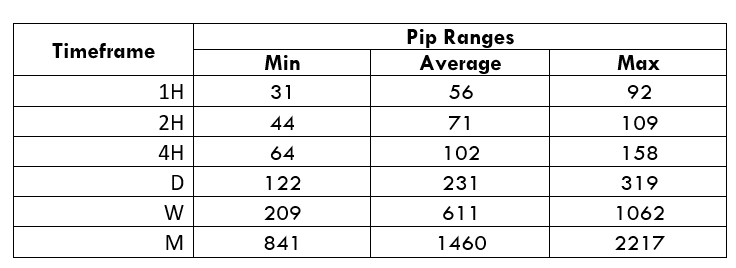
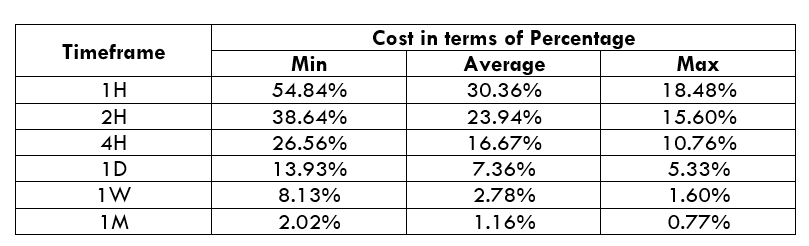
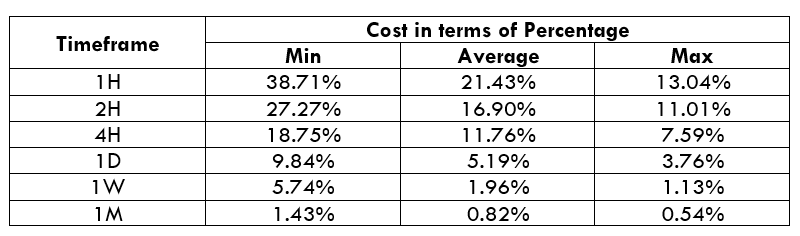
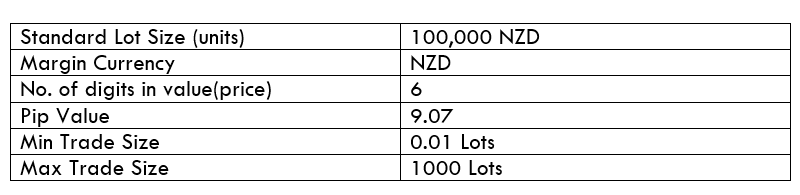
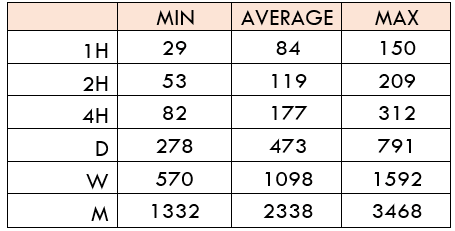
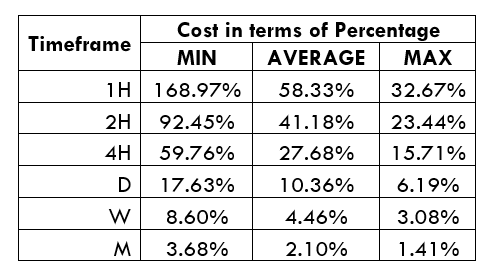
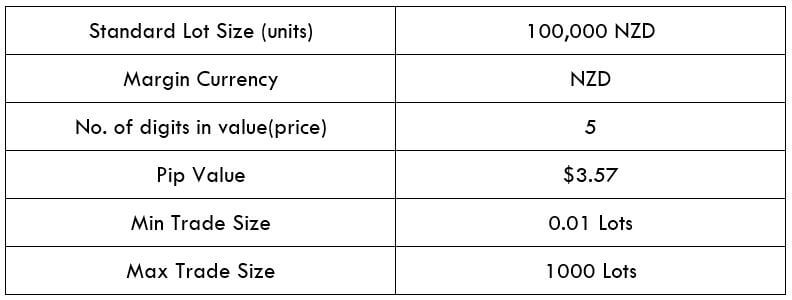
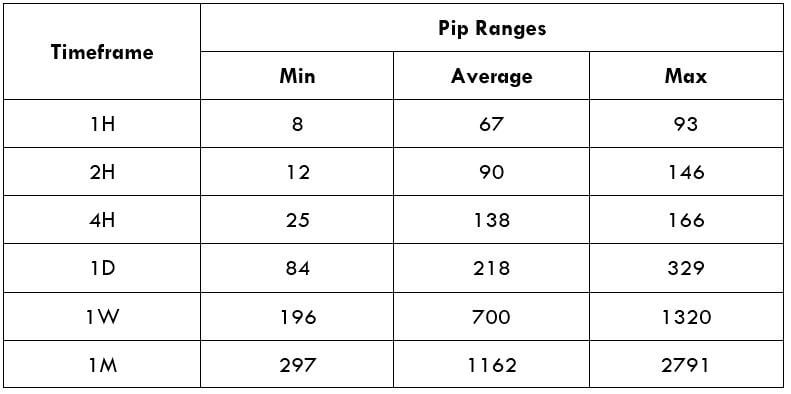
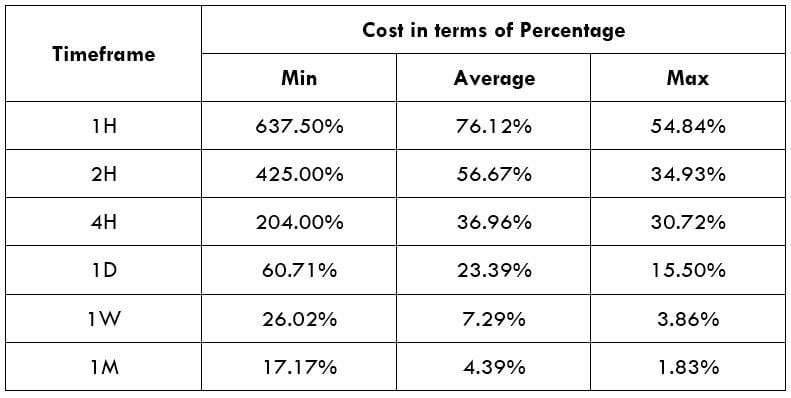
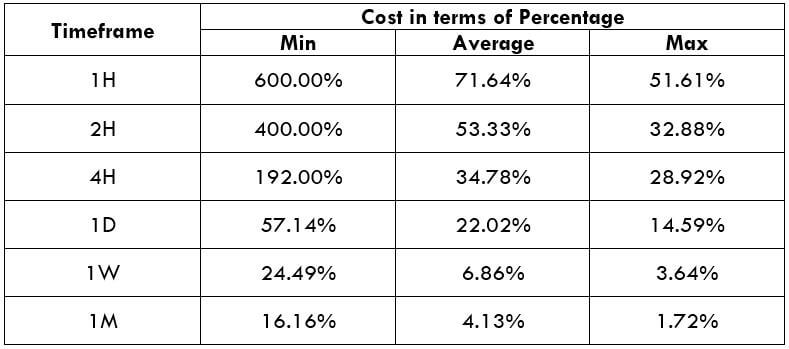
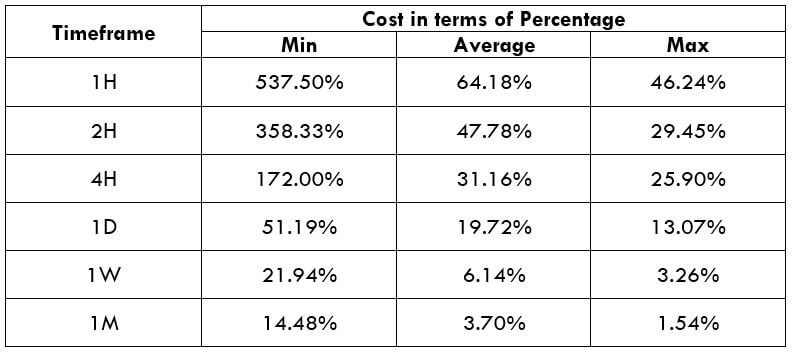
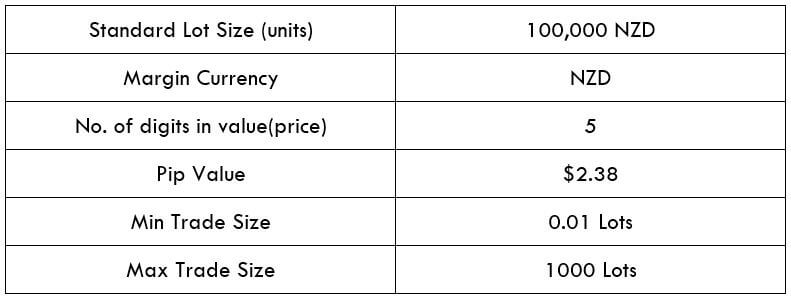
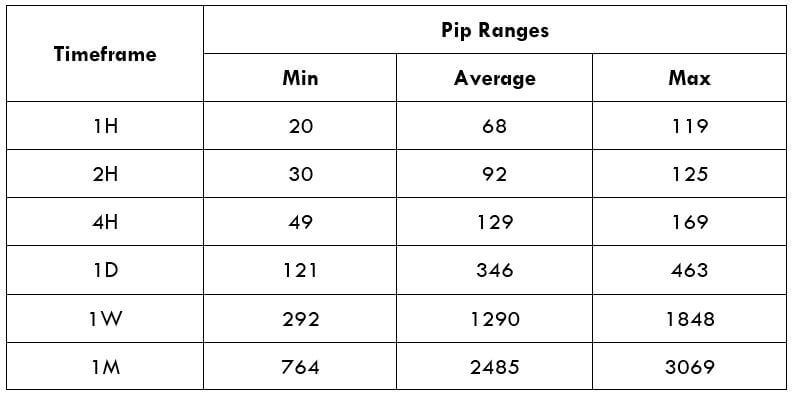
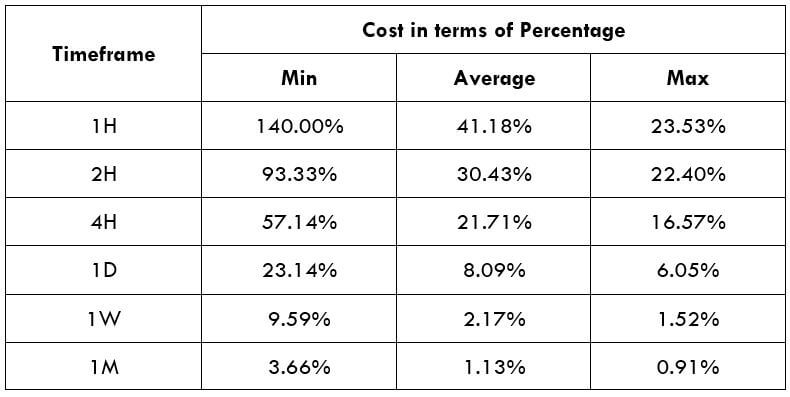
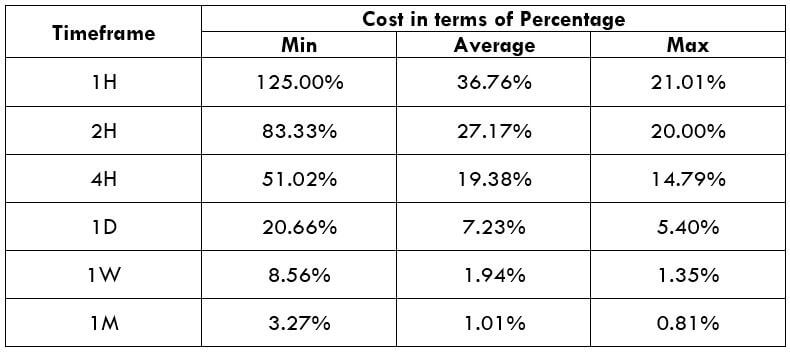
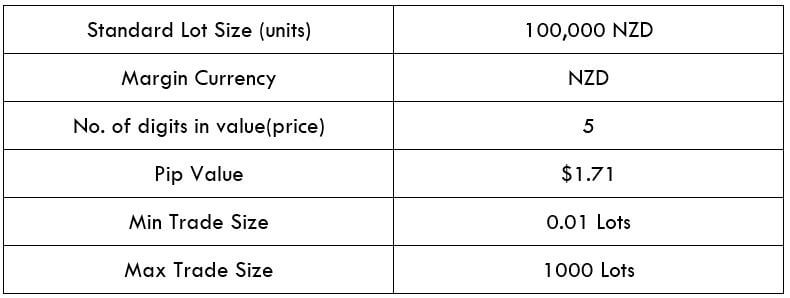
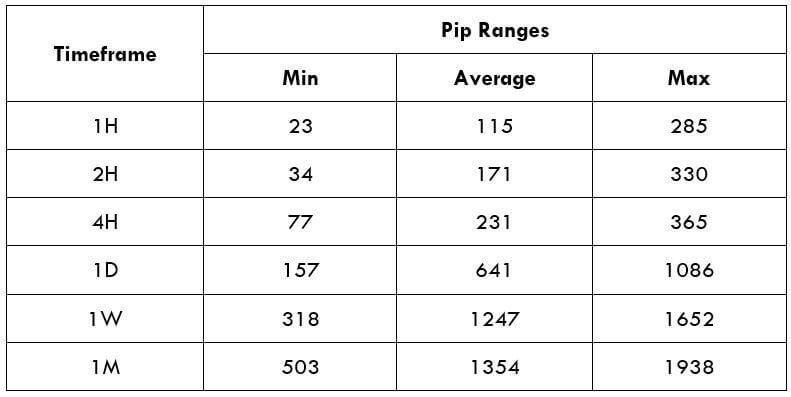
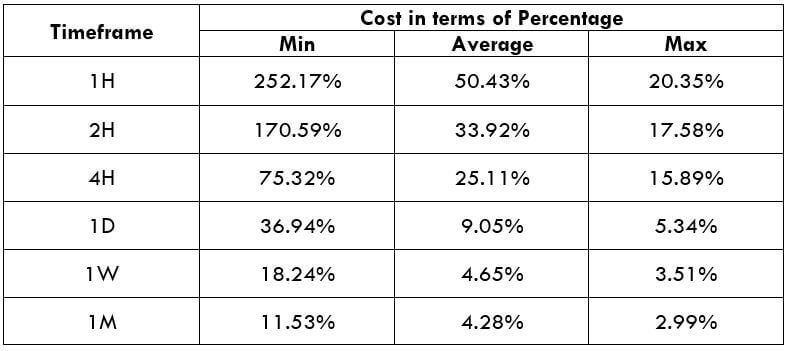
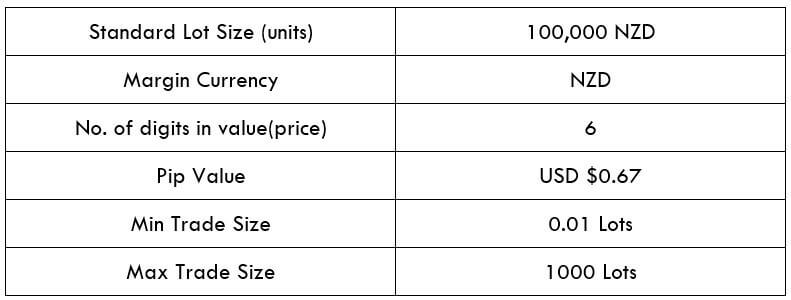
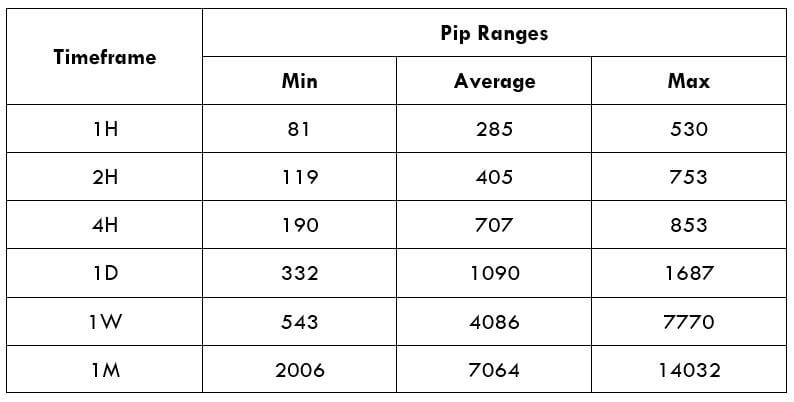
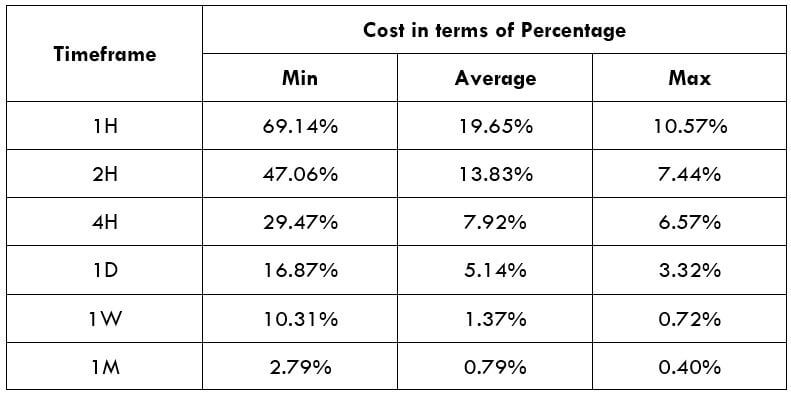
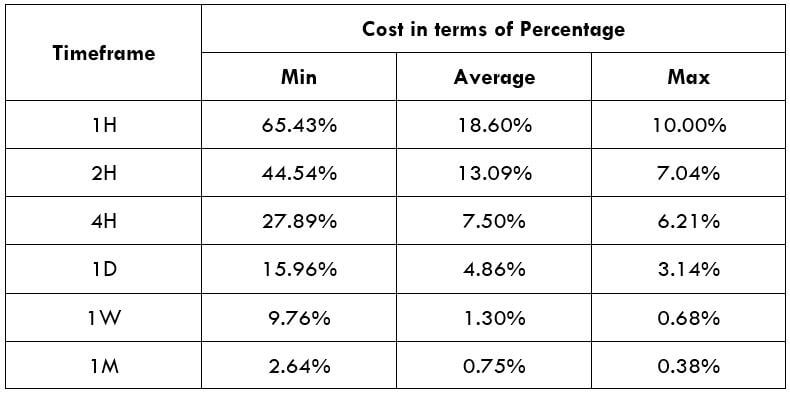
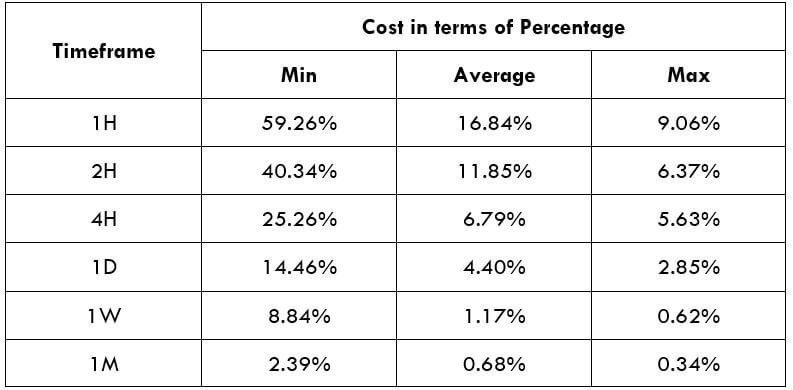
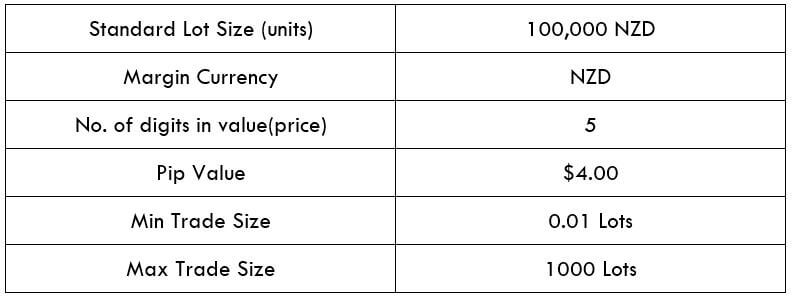
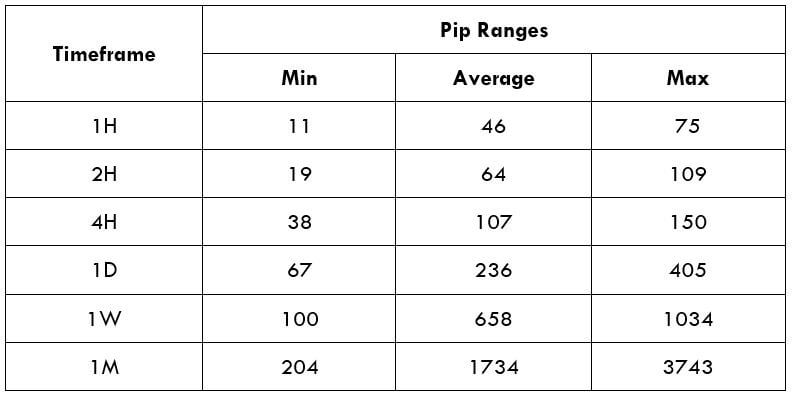
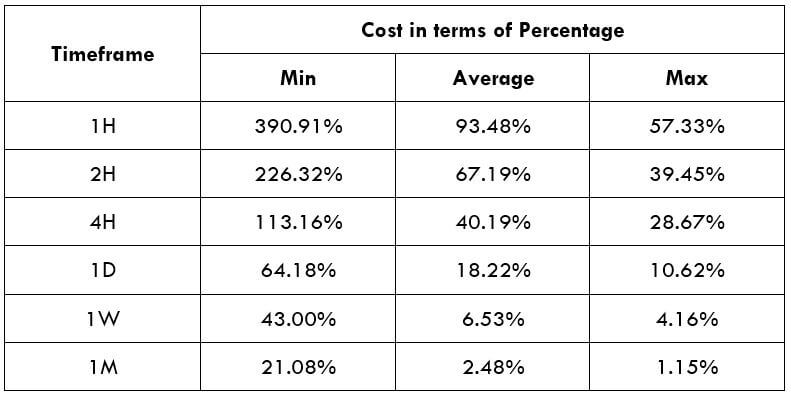
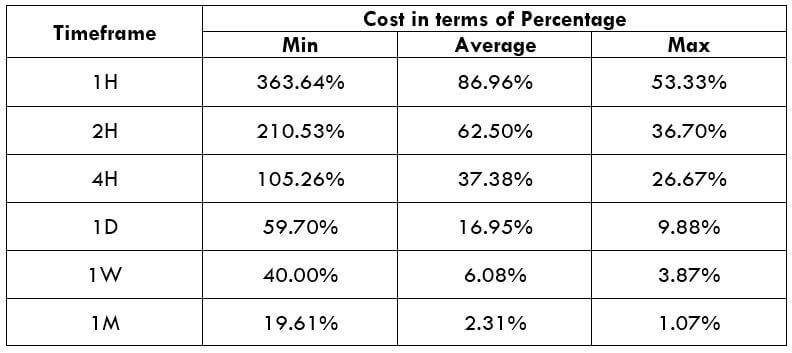
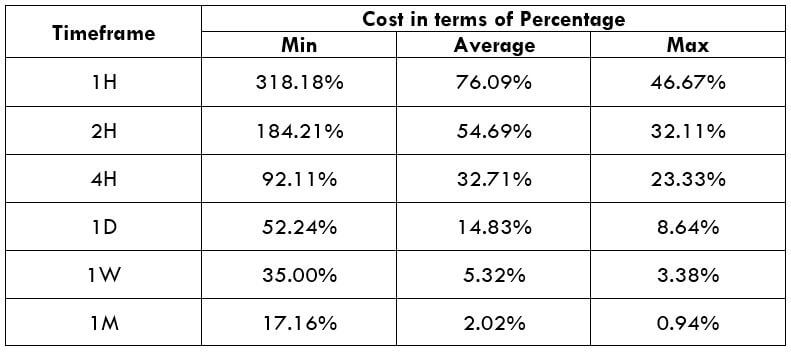
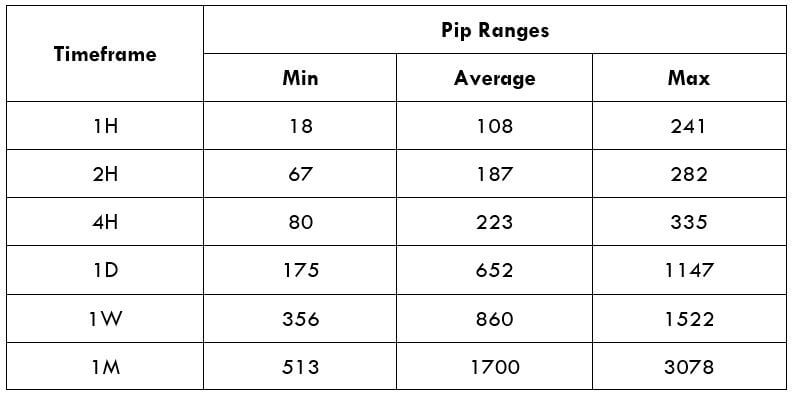
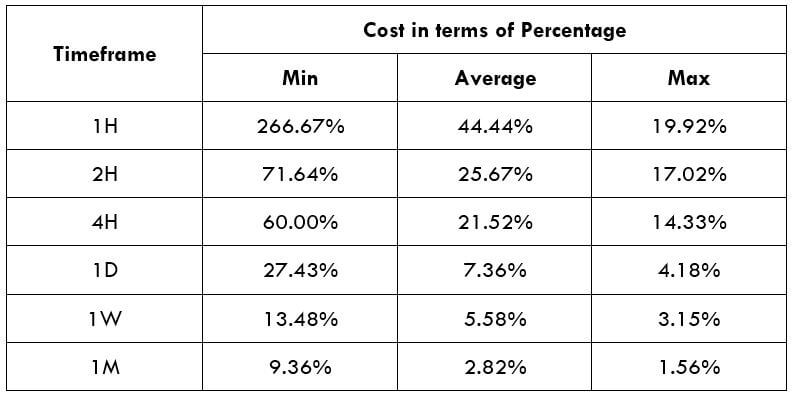
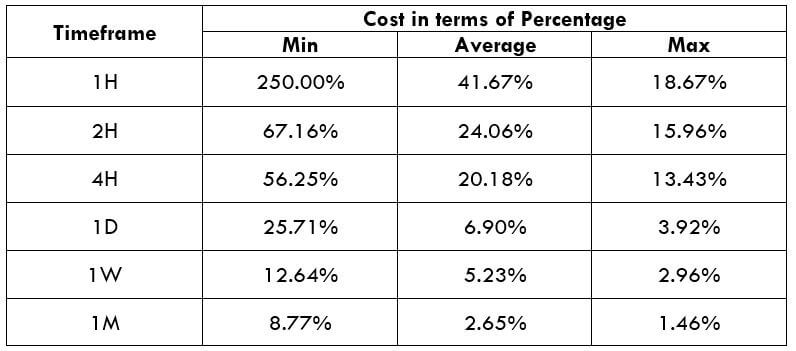
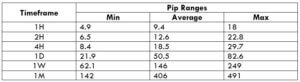
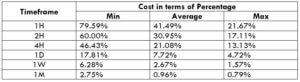
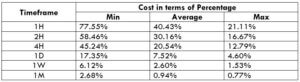
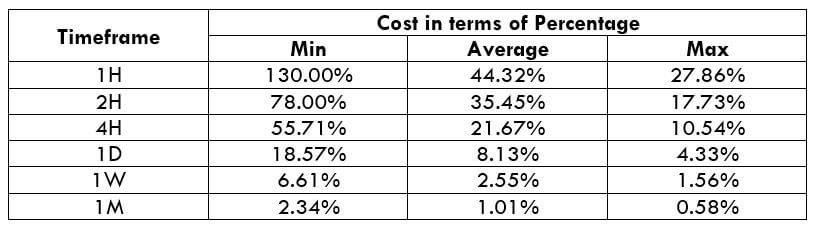
The Ideal Timeframe to Trade NZD/USD

The very first observation that can be made from the above two tables is that the total costs in both the model types are more or less the same. So trading on any one of the two accounts is a fine choice.

From the minimum, average, and maximum column, it can be ascertained that percentages (costs) are the highest on the minimum column of all the timeframes. In simpler terms, when the volatility of the currency pair is very low, the costs are usually on the higher side. Conversely, when the volatility is high, the costs are pretty low. Hence, it is ideal to trade during those times of the day when the volatility of the pair is at or above average. For example, a day trader can trade the 1H timeframe when the volatility of the currency pair is above 8.8 pips. This will hence assure that the costs are pretty low.

Another way to reduce the costs is by nullifying the slippage. This can be done by placing a limit order instead of executing them by a market order. This shall reduce the total costs by a significant percentage. An example of the same is given below.

Total cost = Slippage + Spread + Trading fee = 0 + 1 + 1 = 2

From the above table with nil slippage, it is evident that the costs have reduced by about 50%. Hence, to sum it up, to optimize the cost, it is ideal to trade when the volatility is above average and also enter & exit trades using limit orders rather than market orders.

Categories
Forex Market Analysis

What Happened Last Week and What Lies Ahead


Last Week Wrap-up


Economic Data Today:

UK

Last week started with a slightly upbeat UK Construction PMI report that slightly beat expectations and the Pound rallied on the news. Next day,  the Market Services PMI figure at 54.0, also beating the expectations continue pushing the Pound higher.

Euro-Zone

Meanwhile, April’s Euro-zone Producer Price Index (YoY) was 2.0%, below the expected 2.4%, while the Composite PMI came at 54.0, as expected.

Then, April’s Euro-zone Retail Sales (MoM) came slightly below expectations at 0.1%  but the year over Year figure kept steady at 1.7%.

What started moving the Euro up was an ECB spokesman’s announcement on June 5th’s “live” meeting discussion regarding QE, at their next June 14th meeting, sparkling the speculation about the end of massive bond purchases.


Dax and FTSE

The DAX and the FTSE 100 were having jumpy days, with gaps down that filled during the session. Investors were nervous seeing the FTSE at its near all-time highs, while German DAX suffering was caused by not so good numbers in production and factory orders in the negative territory growth (-2.5% MoM and -0.1% YoY).


Australia

June 6th woke up with the positive news about the Australian Economic Growth (YoY) soaring above analysts expectations for the first quarter, reaching 3.1%  above a forecasted 2.8%, and the Aussie jumped up on the news.


What lies ahead


G7 Meeting

The G7 meeting is the real news queen of this weekend, especially exciting after the verbosity depicted by US President Donald Trump and his tweet-driven messages complaining about his close allies for treating the US unfairly.

Trump, true to his style, refused to endorse a joint G7 declaration calling for a reduction of tariffs.


The best description of the meeting came from a fake Angela Merkel tweet:

https://twitter.com/Queen_Europe/status/1005483518271610882

What seems a sure thing is that the underlying trade war is alive and well, with 25% tariff on steel and 10% on aluminium from the EU, Canada and Mexico, after the expiration of the exemptions, and the speedy retaliation by the affected nations. This also raised the question about how alive the NAFTA space remains.

It is likely that this war on tariffs will remain active at least until mid-term elections in November.


Trump-Kim Summit

Expect the unexpected here. When two characters like these meet, the unexpected is common.  Trump says he’ll know if Kim is serious in less than 60 seconds and calls the summit a “one time shot” for the North Korean leader.

There is almost nothing at a stake here, as Kim Jon Un has already dismantled the North Korean Nuclear Testing Installations.


FED Rate Decision

It is widely expected that FED’s rate decision next Wednesday at 18:00 GMT+2 time will be a 0.25% increase that will put the FED funds rate between 1.75%-2%.

ECB Policy Meeting

The main theme, after the comments of chief economist Peter Praet, is whether the ECB plans to end the bond purchasing program will be announced.


Bank of Japan

Friday, June 15th will see the BoJ decision on rates, which the market expects to be kept on hold.  But everybody is expecting the words of BoJ governor Kuroda regarding inflation and quantitative easing.


Technical Analysis


S&P 500

The S&P 500 is behaving very bullishly. Friday’s close was near the high of the daily range and is heading towards its next resistance area marked in cyan. We have yet to see the effect of the news coming from the G7 meeting and Trump-Kim summit, but the overall picture is bullish.


 DAX

The DAX is not that optimist, although it is close to its 2018 peak. The price looked at on a weekly chart is moving at the top of what seems to be a descending channel, and Ehlers Adaptive Cyber Cycle shows that a potential bearish leg has started.


Last Friday, the daily chart showed an opening gap that was filled during the day helped by the strength in Wall Street, but the index broke the pennant formation down and the CyberCycle oscillator also signs a possible bearish continuation.


FTSE 100

The FTSE 100 has drawn three consecutive weekly bearish candles, but each one of them with less downward impulse than its preceding one. The price is within a triangular formation so it shows a corrective movement. The question now is whether it breaks up or down.  Ehlers Adaptive Cyber Cycle points to a bearish continuation, but it has to be confirmed by price action.


The daily chart doesn’t clarify the picture much. Last Friday’s candle is bearish but with a large lower shadow, which points to the bears weren’t in control, but the price moved below the blue trend line that was supporting the minor upward leg. We have to see weakness in the other side of the Atlantic for a confirmation of this bearish continuation.


Dollar Index

The Weekly chart of the DXI shows an Evening Star formation and the Cyber Cycle indicator has signs of a cycle change. Therefore my most probable scenario is for a bearish continuation on the Dollar. This means we will see strength in the Euro, the GBP and the JPY, and possibly in the Aussie and Kiwi as well.


The daily chart shows that the downward move is a bit oversold and it needs some days of retracement or sideways movement before a continuation. Last Friday’s price has drawn a bullish hammer and Thursday’s movement bounced off the 93.24 support.


Interesting Educational Charts from last week’s action


AUDUSD  and NZDUSD 60 min Charts

This is a classic Elliott Wave 5 waves upward movement within a large Pennant formation. The break of the pattern and the 5th wave is the start of the corrective downward movement. (click ‘play’ to watch the development)


The same pattern is seen in the NZDUSD:


AUDJPY

AUDJPY had a five-wave upward movement that went to its previous top, hitting resistance. A short setup was triggered then the price pierced the bullish trendline downwards.


BTCUSD

For those crypto junkies may I present a classical bearish pennant on the BTCUSD that showed a kind of exhaustion to the upside. The breaking of this triangular formation was a very good short setup.


Categories
Forex Market Analysis

market overview for US index & pairs

News

No need to say that that the hour talk now is about hitting Syria by US, France, & Great Britain

Of course, there’s a lot of action going on as U.S. tells UN it’s ready to hit Assad again, if necessary.

Also U.S. Eyes Russia Sanctions for Syria, U.K. Sees One-Time Hit.

UN Ambassador Nikki Haley, speaking Sunday on CBS’s “Face the Nation,” said U.S. Treasury Secretary Steven Mnuchin will announce new sanctions Monday that “go directly to any sort of companies that were dealing with equipment” related to Syrian leader Bashar al-Assad and his chemical weapons.

Oil prices, which already are above their three-year highs, may be about to jump further.

As Brent oil could spike to $80 a barrel if the U.S. and European Union reimpose sanctions on Iran, and as Western powers expand the scope of the Syrian civil war.


US Index

S&P500 behaviour has been intensively bearish on Daily frame, with a sideways movement during the last ten weeks.

There are perfectly well-noticed signs indicating that prices will be up active again.

Reversing from the support level at 88.35, bouncing from the uptrend’s  2018 low, and forming a double bottom, which is a reversal pattern, to give shape to a harmonic pattern (crab).

The price is facing a strong resistance test at the down trend lin from the high of May 2017, also with the red resistance zone (90.45-91.65).

If the price successfully breaks these levels, we can see it climbing up to its next zone (92.55-93.9). as it’s 61.8% & 78.6% Fibonacci, B harmonic level, and turn down from the high of 2017.

 EUR/USD

On 1H frame, we can see that the price broke the uptrend line provided by reversing from resistance zone (1.239-1.2425). The most important issue is that it approached the downtrend line traced from 2008 high.

The price draws a triangle that, if broken down, we can easily test the levels 1.23 then 1.226


GBP/USD

On 1H frame, the pair touched the resistance 1.428, with a megaphone pattern.

The price is expected to visit the 1.42 level to retest it. In case it breaks it, we can see it touching 1.415 and then 1.409


NZD/USD

The pair has faced its resistance level at 0.939 by breaking the uptrend line and rising reversal wedge. It’s supposed to retest the uptrend from the low of April at 0.732 then 0.727

Categories
Forex Market Analysis

Mixed Performance in the Major Pairs

Hot Topics:

  • NZD – Kiwi falls 0.46% waiting for PPI data release.
  • AUD – Making a triangulation expecting RBA Minutes.
  • JPY – Nikkei rises and pull the USDJPY.

Main currencies daily performance.

NZD – Kiwi falls 0.46% waiting for PPI data release.

In the Oceanic Session, the Statistic New Zealand (Stats NZ) will release the Producer Price Index (QoQ). The analyst consensus expects a fall in the PPI input from 1% to 0.3%, and in PPI output from 1% to 0.4%. This PPI forecast is aligned with the last CPI (QoQ) that reached 1.6% in Q4, below the 1.9% registered in Q3.

In the pair NZDUSD, we are observing the minimum recorded in the last session, which coincides with the weekly pivot point (0.73538). If the Kiwi falls below the weekly pivot, we will look for short positions up to the first weekly support level (S1 = 0.72707), which is a potential profit of approximately 80 pips.

AUD – Making a triangulation while expecting RBA Minutes.

Today the minutes of the last meeting of the Board of the Reserve Bank were announced, they decided to keep the interest rate unchanged at 1.50%. The Aussie in the hourly chart is developing a triangulation structure; in case of falling below 0.78912, it could get to drop to 0.77943. On the contrary, if it breaks higher, the objective would be 0.80097.


JPY – Nikkei rises and pull the USDJPY.

In the first session of the week, the Nikkei 225 index rose by 0.48%, and by inverse correlation pulled the USDJPY pair. The decorrelation between both instruments was commented on in our Daily Abstract on February 16th, where we mentioned that “this divergence in the correlation between the Nikkei Index and the USDJPY should be eliminated again” to converge in favour of the major trend of the indexes.

In the short-term, we will maintain long positions if the USDJPY climbs above 106.906 with the objective at 108.26 and a maximum extension at 110.

© Forex.Academy

Categories
Forex Market Analysis

Daily Abstract – 8th February 2018

Hot Topics:

  • NZD – RBNZ monetary policy meeting maintains the interest rate at 1.75 percent.
  • USOIL – Plunges after inventories data release.
  • GOLD – Falls driven by the dollar appreciation.


Main currencies daily performance.


NZD – RBNZ monetary policy meeting maintains the interest rate at 1.75 percent.

The RBNZ Monetary Policy Decision has decided to maintain the interest rate at 1.75%. In their statement, they say: “Equity markets have been strong, although volatility has increased recently”. Concerning the accommodative policy, RBNZ adds “Monetary policy remains easy, but is gradually becoming less stimulatory”. The members see “The growth profile is weaker in the near term, but stronger in the medium term”. Inflation in December “was lower than expected at 1.6%, due to weakness in manufactured goods”. The RBNZ statement ends signalling that “Monetary policy will remain accommodative for a considerable period, but policy may need to adjust accordingly”.

Technically the Kiwi maintains the bearish bias, as has been our central vision. We still expect continuity in the falls to the area of 0.71064 and 0.70634, an area from where we could begin to be alerted to evaluate potential bullish positions. For the moment we stay out of this pair.

NZD-USD hourly Chart ( Click image to enlarge)

USOIL – Plunges after inventories data release.

After the publication of the crude oil inventory data (1.895M actual vs estimated 3.189M), crude oil began to accelerate the bearish movement that has been developing since last week where we see a pattern of bullish failure. This fall could be in 5 waves; our conservative objective is at $59.75.

OIL WTI hourly Chart ( Click image to enlarge)

GOLD – Falls driven by the dollar appreciation.

Given the strength of the dollar, we expect more falls in gold. The zone that we propose as a control zone is in the bullish guideline which could act as a dynamic support level at $1251.26. We will be observing the development of the price movements to evaluate long-term bullish incorporations.

– First key support $1301.27.

– Second key support $1285.98.

Gold Daily Chart ( Click image to enlarge)

Categories
Forex Market Analysis

DAILY ABSTRACT – 7th February 2018.

Hot Topics:

  • AUD – RBA maintains the monetary policy, unchanged at 1.5%.
  • NZD – Higher before employment data release.
  • DOW – Stocks bounces after the “Black Monday”.

Main currencies daily performance.


AUD – RBA maintains the monetary policy unchanged at 1.5%.

In the overnight session, in the last monetary policy meeting, the Reserve Bank of Australia (RBA) decided to maintain the interest rate unchanged at 1.5% as expected by the analyst’s consensus. In the decision statement, Governor Philip Lowe said: “The low level of interest rate is continuing to support the Australian economy”. Concerning inflation, Governor Lowe added: “Inflation is low, with both CPI and underlying inflation running a little below 2%. Inflation is likely to remain low for some time”.

Although we are out of this pair, our central vision for the Aussie is to expect continuity in the bearish positions, looking for an area for structural long positions in the medium term.

AUD-USD 30-min. Chart ( Click image to enlarge)

NZD – Higher before employment data release.

Kiwi advances 0.51% in the middle of the session expecting the employment data release. The consensus foresees that unemployment will be nearer to 4.7%, a little higher than the previous rate which was 4.6%. The employment change (QoQ) expected is 0.4%, lower than the last quarter, which reached 2.2%. Despite the analyst’s forecast, the unemployment rate is at its lowest level since 2009.

In technical terms, we look for continuity in the weakness in the Kiwi, which could bring the price to the weekly support area (Weekly S1), which also has a confluence of levels with the daily support S1 (0.7244) as the target area.

NZD-USD hourly Chart ( Click image to enlarge)

DOW – Stocks bounces after “Black Monday”.

U.S. stocks start the session with a bearish gap after the high volatility registered this Monday. Exxon XOM (-7.66%), Boeing BA (-8.09%) and Cisco CSCO (-8.72%) were the ones that recorded the highest losses at the opening. As the session progressed, the technical rebound of principal stocks began. Cisco CSCO (6.60%), Microsoft MSFT (5.76%), Goldman Sachs (5.68%), Visa V (5.57%), Boeing BA (5.51%) and Chevron CVX gaining (5.48%), standing out at the end of the day. In the FAANG group, Netflix NFLX was the best performer which gained 8.82% and Amazon AMZN with 6.13%.

The Dow Jones index, on the other hand, has rebounded from the EMA of 200 periods, closing the session at the Fibonacci level F(50%) of all the registered falls; the next resistance will be level F(61.8). We maintain a neutral vision until we see how the current structure develops.

Dow-30 daily Chart ( Click image to enlarge)

Categories
Forex Market Analysis

WEEKLY FORECAST 5th – 9th February 2018.

Weekly Forecast Hot Topics:

  • NZD – Waiting for the optimism of the market to be replicated with the decision of the RBNZ.
  • AUD – No big expectations in the next monetary policy decision.
  • CAD – Continuity in the strengthening of the labour market.

Weekly performance

This week, the best performer was the Euro <EUR> (0.22%), pushed by the positive data on inflation and industrial activity. The worst performer was Aussie <AUD>,  its losses reach¡ng 2.22% due to weak inflation Australian data and the stronger US employment data. Those led to boost the Dollar <DOLLAR> (0.17%) and reverse the losses that were dragging in the week.


NZD – Waiting for the optimism of the market to be replicated with the decision of the RBNZ.

Last week the New Zealand Trade Balance (MoM) reported a historic surplus of $640M, the highest value since March 2015. The main factor contributing to this increase has come from dairy products exported to their principal trading partner, China.

This week, the leading data for the Kiwi will come from the employment indicators (QoQ) and the RBNZ interest rate decision. The unemployment figure is expected to increase slightly from 4.6% in October 2017 to 4.7%. As for the interest rate decision, no big surprises are expected, analysts expect the RBNZ to keep the interest rate at 1.75%.

Technically, we expect more downside moves for the Kiwi. In EURNZD we observe a bullish continuation that could reach 1.7174 before it starts a bearish sequence.

EUR-NZD 4-hour chart ( click on the image to enlarge)

AUD – No big expectations in the next monetary policy decision.

During the last trading period, inflation data (YoY) was published, which was expected to be equal to or higher than 2%. However, it did just reach 1.9%, baffling the market and removing the possibility of a new increase in the interest rate by the RBA.

For this week, the most expected event for the Aussie will be the monetary policy decision, in which no changes are expected in the current rate that is set at 1.5%.

On the technical level, we still expect weakness in the Aussie group before starting a new strengthening of the oceanic currency. In the EURAUD, we expect the price to reach the 1.6026 level, where it could complete a higher grade connector and start a new bearish cycle.

EUR-AUD daily chart ( click on the image to enlarge)


CAD – Continuity in the strengthening of the labour market.

This week will end with the publication of the Canadian employment data. Continuity in the strengthening of the labour market is expected, in the unemployment rate the estimated consensus is a slight increase that reaches 5.8%; however, current levels of unemployment are the lowest of four decades.

Technically, we continue to expect new lows for the Loonie, which could even lose the psychological support of 1.20, a large bearish cycle which started in January 2016.

USD-CAD daily chart ( click on the image to enlarge)


Categories
Forex Market Analysis

Daily Abstract – 1st February 2018

Daily Abstract’s Hot Topics:

  • DOLLAR – FOMC, Federal Reserve maintains an unchanged interest rate at the end of the Yellen age.
  • NZD – Kiwi the best currency performer of the session aided by the investors’ confidence in market conditions.
  • FAANG – AMAZON despite the bullish gap, closes lower  
  • FAANG – GOOGL and AAPL close mixed before the earnings release.
  • CRYPTOS – BTC tests the psychological 10,000 support.


Main currencies daily performance.

DOLLAR – FOMC, FEDERAL RESERVE MAINTAIN AN UNCHANGED INTEREST RATE AT THE END OF THE YELLEN AGE.

The Federal Open Market Committee (FOMC) members in their last meeting of the Yellen age have decided to maintain the interest rate unchanged at 1.50%. The labour market has continued to strengthen and economic growth has risen. This meeting has been the end of the Janet Yellen era as chair, next month the chair will be the Republican Jerome Powell, who has been confirmed by the Senate on January 24.

Our vision still considers a probability of turning bullish; if the index consolidates above the weekly pivot, our forecast will have more confidence in selling the Euro <EURUSD>. Additionally, we are positioned to sell the Euro from 1.250 level (see long-term pick EURUSD Watching the Weekly F38.2 )

US Dollar Index 1-hour chart ( click on the image to enlarge)


EUR-USD 30-min chart ( click on the image to enlarge)


NZD – INVESTORS’ CONFIDENCE IN MARKET CONDITIONS THE BOOST KIWI.

Favourable market conditions are boosting New Zealand’s agro-industry; the central factor has been the increase of the dairy products exports. Dairy products and their derivatives are the most relevant contributors to exports, about 95% of New Zealand dairy products are exported.

On the technical side, the Kiwi is making a consolidation structure; we expect if it breaks down, the target level is the confluence between Daily S2 and Weekly S1, the zone from the Kiwi could find buyers again.

NZD-USD 1-hour chart ( click on the image to enlarge)


FAANG – AMAZON DESPITE THE BULLISH GAP, CLOSES LOWER  

In the last session, Amazon <AMZN> opens higher by 1.53%, boosted by the project between Amazon and Berkshire Hathaway (the Warren Buffett’s company) to create a healthcare company with “reasonable costs”.

The chart shows us a clear bull trend. Bullish positions must be considered above the confluence between Daily R2 and Weekly R2, which could be working as strong resistance.

Amazon <AMZN> 1-hour chart ( click on the image to enlarge)


FAANG – GOOGL AND AAPL CLOSE MIXED BEFORE THE EARNINGS RELEASE.

Google <GOOG> has been the best performer of the session with a 0.88% advance, aided by the expectation before the earnings release, which will be after the closing market; the analyst consensus expects $31.87B of revenues and $9.98 earnings per share (EPS).

We expect that GOOG reaches the weekly R1 level ($1,191.32) during the session, a zone that could find sellers.

Google <GOOG> 1-hour chart ( click on the image to enlarge)


Another company that will release earnings, after the market closes, will be Apple <AAPL> which has closed with a -0.17% performance. The analyst expects $77.25B of revenues and $3.85 EPS.

In the AAPL case, it is probable that it will reach the 164.22 level, the zone from where it could find buyers to the weekly pivot point (173.60).

Apple <AAPL> 4-hour chart ( click on the image to enlarge)


CRYPTOS – BTC TESTS THE PSYCHOLOGICAL 10,000 SUPPORT.

In the last session and the past week, Bitcoin <BTCUSD> has been testing the psychological level $10,000; we expect that BTC plunges to $8,074 level as a continuation of the bearish cycle started on the 17th December 2017.

BitCoiun <BTC> 4-hour chart ( click on the image to enlarge)


Categories
Forex Market Analysis

Hot Topics – December 18 to 21, 2017

Hot Topics:

  • US DOLLAR – THE BEARISH BIAS DUE TO TAX REFORM CONTINUES.
  • GBP-USD – BREXIT NEGOTIATIONS AND ECONOMIC GROWTH DRIVES STERLING.

This past week presented significant advances for the New Zealand dollar with a 2.25% advance, due mainly to the weak inflation data (YoY) shown by the American economy (1.7% vs. 1.8% expected). The increase of the interest rate by the FOMC was not enough to reverse the advance of the Kiwi.

The worst performance of the week was exhibited by the British Pound with a -0.41% loss. The BoE decided to keep the interest rate at 0.5% in the context of an increase in unemployment for a second consecutive month, reaching 4.3%. On the other hand, inflation (YoY) scored a 3.1% advance, the highest level for almost six years; specialists believe that CPI is reaching a peak and that it could mainly impact the cost of the services sector.


 US DOLLAR – THE BEARISH BIAS DUE TO TAX REFORM CONTINUES

Dollar begins a bearish week in the context of uncertainty over the approval of tax revision legislation with the aim of making American companies more competitive.

The Republican Senator Bob Corker has expressed concern about the fiscal deficit that can result from the tax cuts. Despite having a position in favour of the tax review, doubts remain in the approval of the reform, in the same way that the Senate rejected the Trump Administration’s proposal to suppress Obamacare last July.

The Greenback has broken the bullish guidance that has reached S3; there is a possibility that it will develop a bullish reversal movement up to the weekly pivot level. You can find more information in our article Finding Trade Opportunities Using Pivot Points.


GBP-USD – BREXIT NEGOTIATIONS AND ECONOMIC GROWTH DRIVES STERLING.

Economic growth and negotiations for Brexit continue to be the primary drivers of the Sterling. On Wednesday, the governor of the BoE will address the Parliament in the context of the hearing of the Select Committee of the Treasury on the November Financial Stability Report.

The British Prime Minister, Theresa May, has assured the Parliament that she is looking for the Brexit transition to be completed within two years. The first phase of the Brexit negotiations has been on the rights of EU citizens in Britain. EU members have agreed to move to the second stage, which focuses on the transition and future commercial relations. The British Parliament has urged May to stand firm in the interests of the United Kingdom, such as a previous Prime Minister, Margaret Thatcher.

Technically, the Pound is developing a corrective structure, with a bias for bullish continuation. The RSI shows a bullish divergence; however, we expect a retracement towards the weekly pivot zone and then continue with the bullish movement in the medium-long term.

 EUR-USD – CORRECTIVE STRUCTURE IN DEVELOPMENT

The single currency is developing a corrective structure; the RSI has not yet shown evidence of rupture. We expect the price to make a bearish movement in five; that means, the euro could move up to R1 and then fall to S2, thus completing a five-wave sequence.


 USD-CAD – LOONIE CONTINUES IN A SIDEWAYS RANGE MOVEMENT.

The Loonie continues in a sideways range formation, waiting for data to act as a catalyst. Most probably, the previous movement will continue to R2 (1.30 level). The RSI is forming a triangular structure that is finding resistance at level 60. The bullish bias still prevails, with the average of 9 periods under the RSI.


 NZD-USD – A PENNANT THAT COULD BE A PAUSE OF A NEW RALLY.

Last week, the Kiwi was the best currency performer with a 2.25% increase against the USD. This week it is developing a pennant pattern, manifesting a pause with further continuity of the bullish movement. The RSI, on the other hand, is forming a corrective structure. We expect a false move towards the weekly pivot, and then, continuing the upward cycle to the zone of R2 (0.715).


Categories
Forex Market Analysis

Outlook for 10.24.2017

EUR/USD

The US Dollar is hesitant as President D. Trump told reporters he is very close to a decision about who should chair the Federal Reserve, which includes current Fed Chair, Janet Yellen. It also weighs on the US currency the rumors about Trump’s plan to reform taxes.

On the Euro front, European Central Bank is expected to announce on Thursday a possible timetable for a reduction of its asset purchases, as economic data suggest the Eurozone might witness a higher than expected economic expansion in 2017. Reducing asset purchases might, likely, be accompanied with a continuation of low interest rated, as Eurozone inflation data seems to be stable

Sideways channel movement on the EUR/USD pair

The Euro 1-hour price has been trending down since Oct, 19 when it draws an almost perfect triple top (1). Yesterday it touched Oct, 18th lows and bounced from there, and piercing up the downward trendline

Overall, the EUR/USD pair seems to trade in a sideways channel, but its current price may allow for a profitable trade, with a target touching the upper trend line (fig.1).


GBP/USD

JP Morgan analysts are convinced that shorting the GBP is still the way to go

The GBP is, still, affected by the Brexit process, but no major news about it is expected today. Slower consumer expending and softening of economic sentiment press policymakers to keep interest rates unchanged, which weighs on the British currency.

Daniel Hui, a foreign exchange strategist at J.P. Morgan said that their conviction to short the GBP is still high because they felt UK rate hikes were “overpriced”, given the “weak starting point for UK growth” and the reality of a Brexit shock that keeps dominating the medium-term outlook.

There is evidence that today’s lows might be the start of a new up-leg that may carry GBP/USD prices up to, at least, the highs of this lateral channel

GBP/USD daily price is experiencing a sideways movement, after retracing more 70% of its upward movement from its lows in August 2017

Possible scenarios:

  1. Today’s lows (1.31653) might be the start of a new up-leg that may carry GBP/USD prices up to, at least, the highs of this lateral channel (1.32272), provided that prices cross over the downward trend line.
  2. If the price does not continue up and reverse near the BB mean, then the downward leg is continuing to its next floor, at 1.31, and a good reward to risk trade is possible at about 1.3177.


USD/JPY

Japan was in focus yesterday, as prime minister, Shinzo Abe is back in power

Japan was in focus yesterday, as prime minister, Shinzo Abe is back in power, after his victory this weekend, that drove the yen downward yesterday. Today, we see a bounce that set prices to test the highs of yesterday’s session. Tuesday, the Japanese currency, instead of focusing on Japan’s manufacturing PMI, slightly lower in October, it seems to pay more attention to interest rate differentials.

Mid-term, the USD/JPY is trading on a lateral price channel whose low is at about 107.7 and it’s high is at 114.34. Currently, the price, trading at 113.71, is moving closer to the top of that channel.

A short-term bottom at (1) in sync with the MACD signal crossover, marks the start of a new uptrend. The red 10-period BB is sloping strongly up, so prices are heading for a test of the recent highs at (3), and, potentially break them up.

The best possible action here is to scalp on a short timeframe, such as 15 min charts or shorter, being aware that we are at the highs of a mid-term channel. Long and short-swing trades must wait for a clear signal or news event


USD/CHF

The Swiss National Bank (SNB) is keeping an expansive monetary policy that drives Swiss CHF down

The Swiss National Bank (SNB) considers the CHF to be over-valued, so it is keeping an expansive monetary policy that is driving the Swiss currency down. The SNB policy of negative interest rates contributes to the downward currency trend.

To sum up, the Swiss economy is slowing down, its growth rate (+0.3%) is losing track compared to the one registered in the Eurozone (+2.3%) in the second 2017 quarter.

USD/CHF is at overbought but still strongly moving up

The USD/CHF weekly is on a sideways channel with a lower limit at 0.942, and an upper limit at 1.0365. Its current price – 0.9896- is at about the middle of this channel. On a daily and weekly basis, the price is in overbought territory.

Today the USD/CHF is trading strongly up, and its hourly chart is currently at overbought territory as well, with its price touching the 3rth Bollinger band (+3STD) (1). On such a strong trend, the best thing to do is wait for a price pullback to create a short-term support near the mean of the Bollinger bands (2) and set a long trade there.


AUD/USD

Tomorrow, Australia’s quarterly inflation data will be released.

The Aussie is under pressure as the soft Chinese housing data was weaker than expected. China is a major partner for Australia, and China’s economic health shakes Australian currency for the good and the bad. The Housing Price Index grew in China by 6.3%, after an 8.3% increase in August. Next Wednesday, Australia will release its quarterly inflation figures.

AUD/USD is currently in a downtrend

The AUD/CAD pair, on a weekly chart, is moving on a downward leg, in a sideways channel that started in Jan 2015. The channel has a slight upward bias.

On the daily chart, the AUD/USD pair is down-trending after drawing a double top (July and September 2017). Actually, the price is below the -1 Bollinger Band showing that the downtrend is still in place

The most probable scenario for the AUD/USD pair is to go down to at least 0.766, or, even deeper, to touch the lower weekly trend line (0.7518). The MACD crossover to the downside confirms the bearish bias of this currency pair


USD/CAD

USD continues to show strength against the Canadian currency. Tomorrow’s interest rate decision by the Bank of Canada will bring a confirmation (or denial) to the strong uptrend od this currency pair. The odds of a new rate hike are getting lower, after weak economic data ahead of the BoC meeting.

Canada Wholesale sales rose by just 0.5% in line with forecasts, although, it seems the market expected a bit more increment.

USD/CAD moving up with strength
The USD/CAD pair, on a weekly chart, is in the middle of a retracing trend, starting at the beginning of September, which has retraced 35% of the length of the downward move. Its daily chart shows the currency pair approaching the ceiling of a potential wide and sideways price channel. The other notable fact being, a price breakout through 1.25953, starting a new impulsive leg up.


NZD/USD

NZ Government to reform RBNZ process to set rates.

The Kiwi dollar is under pressure since the government announced its plans to reform the Reserve Bank of New Zealand. NZ Labor-led coalition said it will modernize the bank’s process for rate-setting and adapt it into a format that was more “growth-friendly”. Giving hints about expansionist monetary policy. Analysts say the RBNZ reform is already well priced by the market, and have downplayed its impact on interest rate expectations.

NZD/USD is currently at the bottom of a down-trending channel

On a daily chart, the NZD/USD pair is trending down on a channel that started on July, 27. Actually, the price is oversold, well below the -2 Bollinger Band. The price is near a mid-term support, so it’s in the process of bottoming out, as is clearly seen in its hourly chart.

A possible scenario for the next few hours is a retracement from here to test resistance points at about 0.695. If it stalls without breaking 0.6908, and MACD turns bearish the retracement is failing, and the downtrend might resume testing the lows made in May 2017.