News Commentary
We have a busy week coming up. What will follow the consequences of the G7 summit, and what news will be released regarding the US-North Korea summit. We also have the Federal Central Bank meeting (FOMC), the European Central Bank meeting, and the Bank of Japan meeting who all have to decide their rates and give hints about the economic polices.
US
U.S. President Donald Trump threatened to stop trading with countries that do not reduce barriers to American exports.
Trump said on Saturday that he had instructed his representatives not to endorse the G7 communique and that his administration was considering imposing tariffs on automobiles, further raising the spectre of a trade war that has unnerved Washington’s top allies.
U.S. President Donald Trump and North Korean leader Kim Jong Un are expected to land in Singapore on Sunday within hours of each other in advance of a historic summit over the reclusive country’s arsenal of nuclear weapons.
The unprecedented meeting comes after weeks of sometimes-contentious discussions and was briefly cancelled amid North Korean outrage over messaging from some U.S. advisers.
The Federal Reserve is almost certain to raise interest rates by a quarter point for a second time this year at the conclusion of its two-day policy meeting at 18:00 GMT on Wednesday.
EUR
The Euro strengthened on rising bets that the European Central Bank (ECB) may soon announce it will start shooting off its massive bond purchase program.
The central bank’s chief economist Peter Praet, a close ally of President Mario Draghi, said the ECB would discuss next week whether to end bond purchases later this year.
Some reports said that at its next policy meeting this week, the ECB could declare on when its quantitative easing program would end.
“The market will start to focus on the ECB from now on. Politics in Italy and Spain will play second fiddle as we now have new governments in both countries,” said Kazushige Kaida, head of foreign exchange at State Street Bank.
AUD
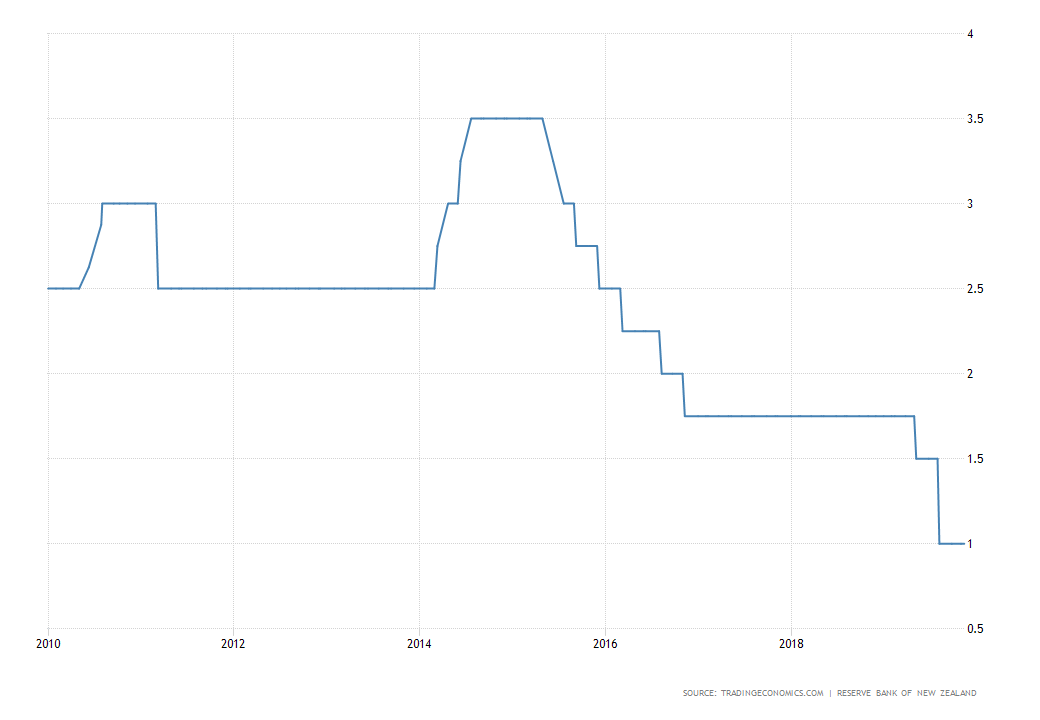
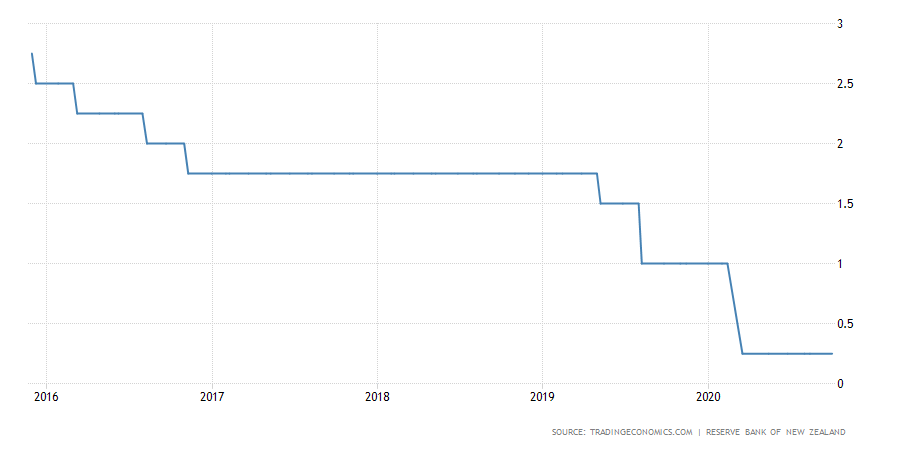
The RBA Board decided to leave the cash rate unchanged at 1.50%.
“The recent data on the Australian economy has been consistent with the Bank’s central forecast for GDP growth to pick up, to average a bit above 3% in 2018 and 2019. Business conditions are positive and non-mining business investment is increasing. Higher levels of public infrastructure investment are also supporting the economy. Stronger growth in exports is expected. One continuing source of uncertainty is the outlook for household consumption. Household income has been growing slowly, and debt levels are high” declared media section of the RBA.
The Australian dollar was supported by GDP growth numbers, which rose 1% in the first quarter of 2018, beating the estimated 0.8%. On an annualised basis, growth was 3.1%, above both the expected 2.8% and the previous quarter’s 2.4% gain.
JPY
The Bank of Japan (BoJ) is seen keeping policy on hold at the conclusion of its two-day rate review on Friday, including a pledge to keep short-term interest rates at minus 0.1%.
BoJ Governor Haruhiko Kuroda will hold a press conference afterwards to discuss the decision.
Kuroda has previously said the central bank will telegraph to markets how it plans to exit from ultra-easy policy when conditions for hitting its price goal become robust.
Chart Analysis
US INDEX
On the daily chart, the price had successfully broken the ascending trend from the high of 2017, along with the resistance level to eventually reach the key resistance 95.15 to bounce back from there. The price shaped a reversal pattern (wedge) which closed with a break beneath it.
With divergence in RSI, the price is expected to have a correction to the key support at 92.6 which is located at the broken trend too.
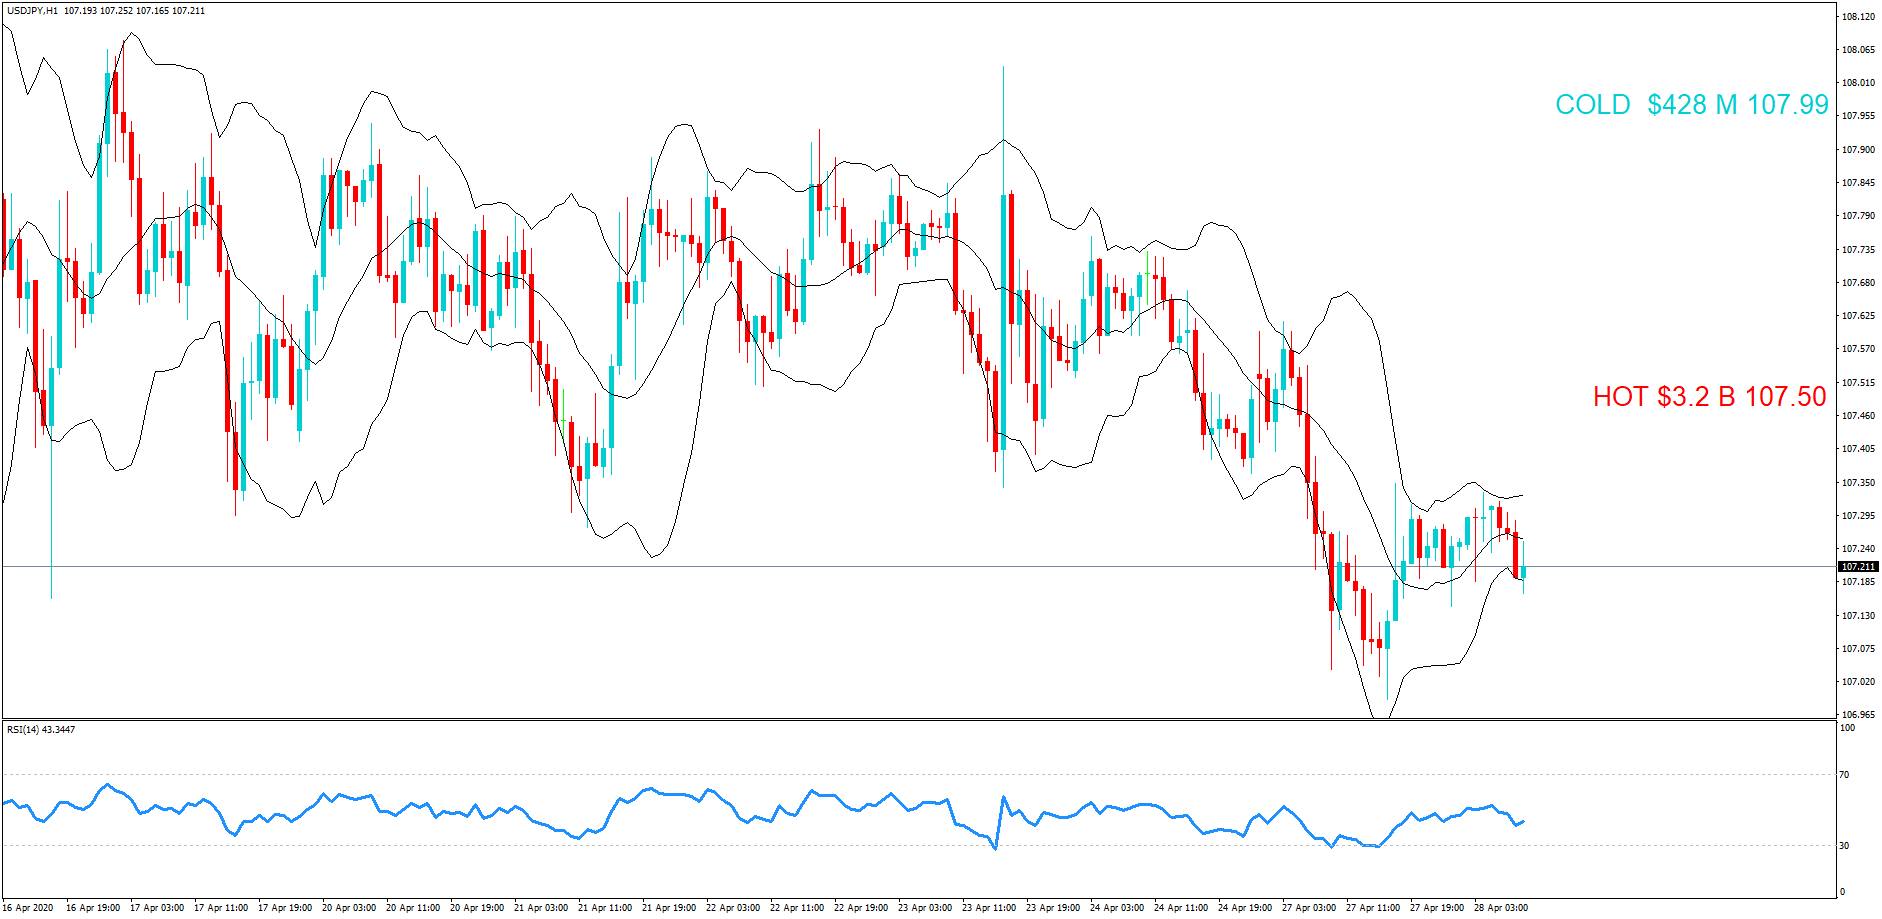
USD/JPY
On the daily chart, the pair had broken the ascending channel followed by bouncing from the descending trend from the high of 2017 and the key resistance of 111.1.
The price also broke the support 110.05 to reach the next support 108.15 to get back up again from this level to retest the level at 110.05.
As you can see on the chart, the price is moving according to Elliot waves. By forming the A & B waves, we are waiting for the next move down to hit the C level which is located at the support 106.9.
So, any bounce now with price action will enhance the down run.
AUD/JPY
On the daily chart, we can see that the price is moving sideways between the resistance zone 84.4-84.15 and the support zone 81.2-80.5.
The price has now entered the red resistance area with a possible bounce.
Also, watch the ascending channel which has formed to be considered as a flag pattern. The pattern boosts the original trend which is a down one
So, any bounce now with price action will push the price to fall.
AUD/NZD
On the daily chart, as we expected before, the price had made its way up to targets at the resistance zone 1.0815-1.0865, boosted by a BAT harmonic pattern.
The price has already made its retracement as we expected it too.
Bouncing from the support zone and the uptrend from the low of April, and the broken descending trend from the high of 2017, the price is supposed to continue its bullish movement up to the 1.1045 level.
USD/CAD
On the daily chart, as expected, the price made its way into the resistance zone of 1.289-1.298, almost reaching the key resistance at 1.309, with an approach from the descending trend line starting from the high of 2015, and the upper edge of the horn pattern.
The price has already bounced beneath the key resistance and the resistance zone and got back above it again, but it couldn’t go much further to form a pinbar, to take the price firstly to the support level at 1.274.
AUD/USD
On the daily chart, the price had a false break beneath the support zone 0.75-0.7535 with a pin bar. That enhances the AB=CD harmonic pattern, with breaking a descending channel. The pair rose with an engulfing candle above the support zone.
Along with divergence in RSI, the price is ready for the next move up to 0.774 which is a level with a combination of the lower trend line from the high of 2018 and the broken uptrend.
The price may have a little retracement before heading this target.
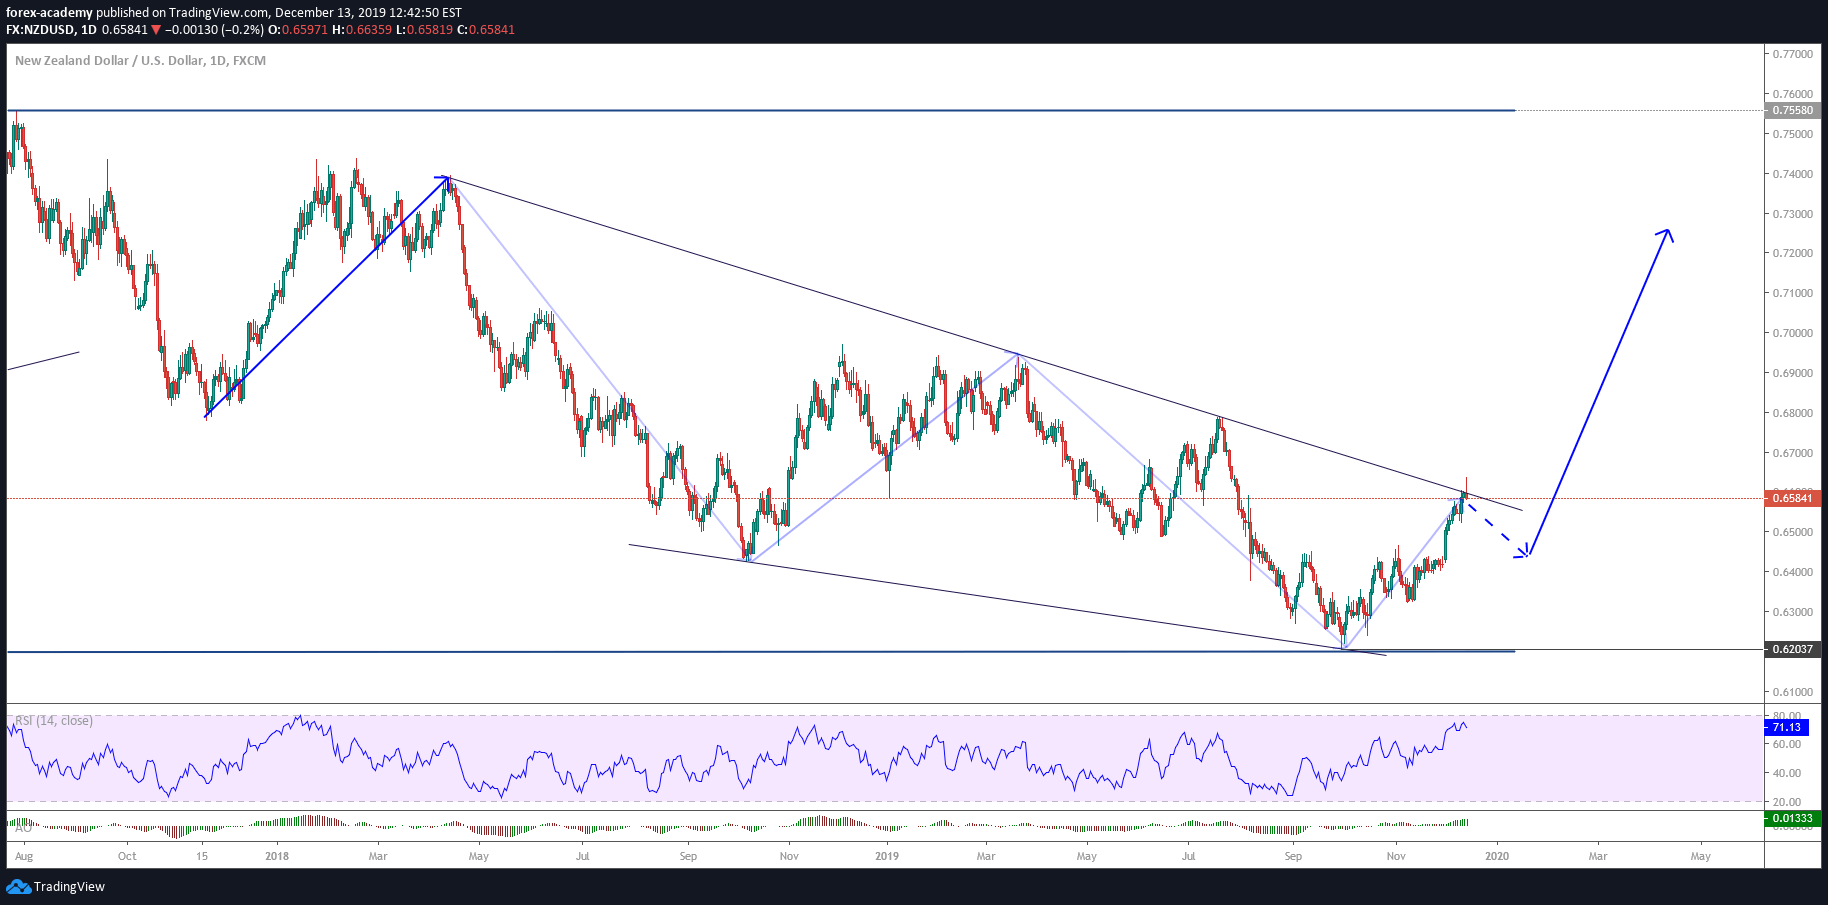
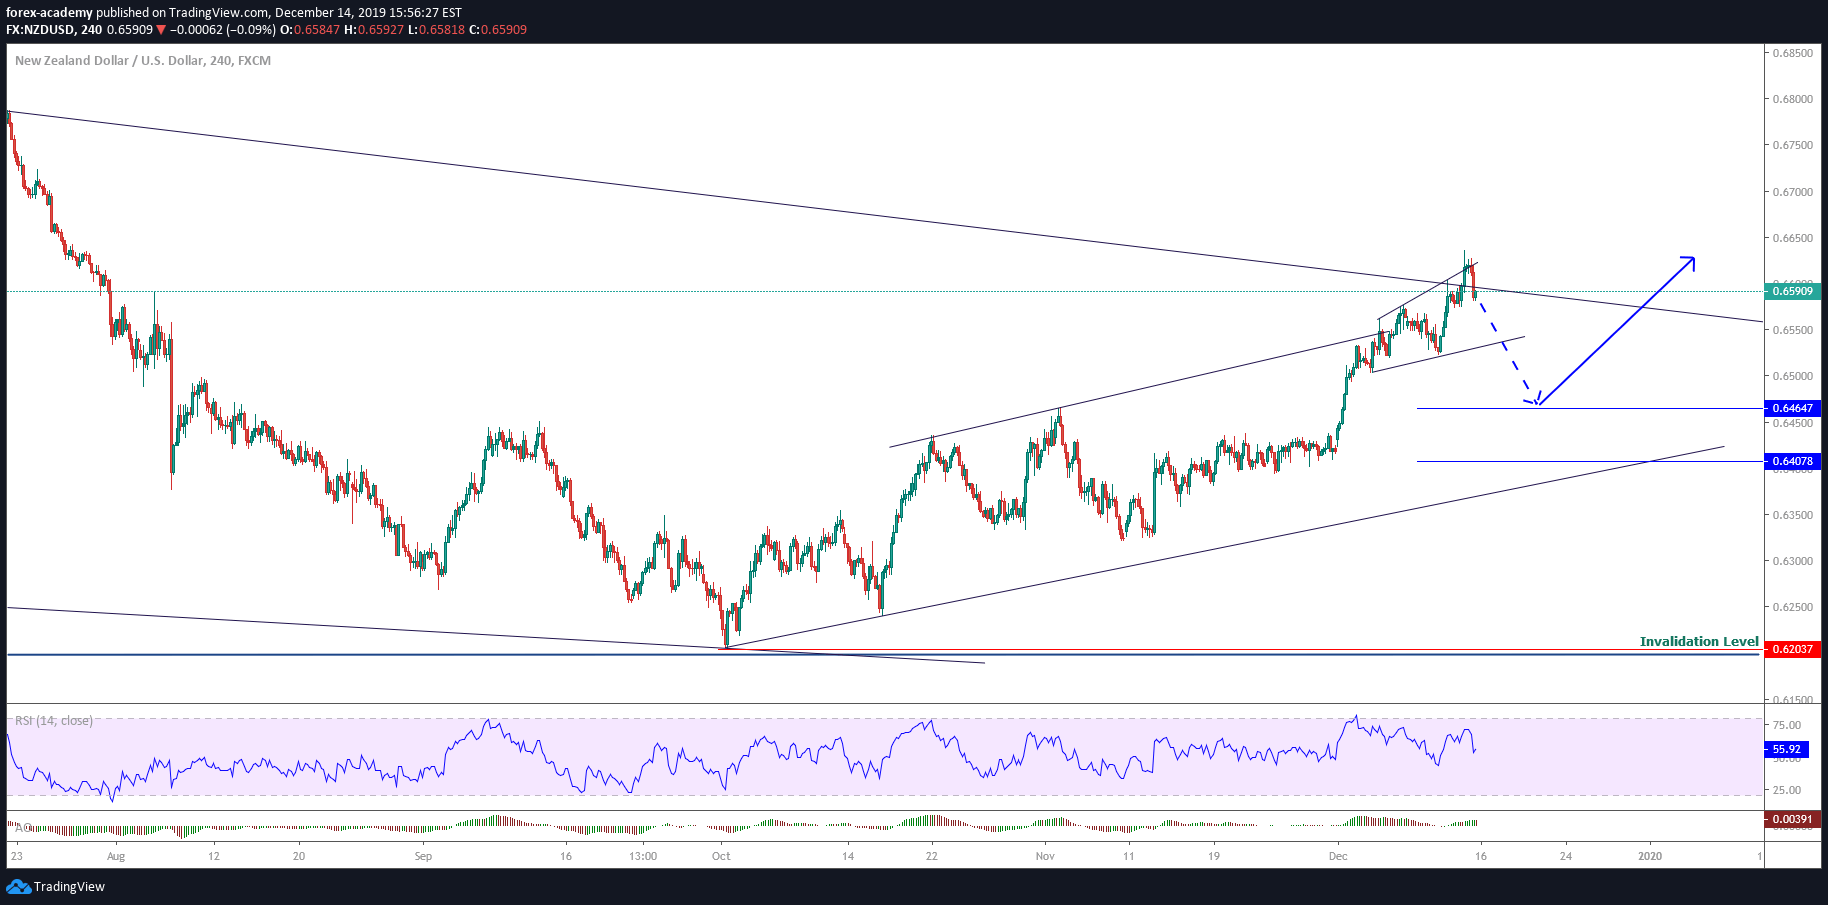
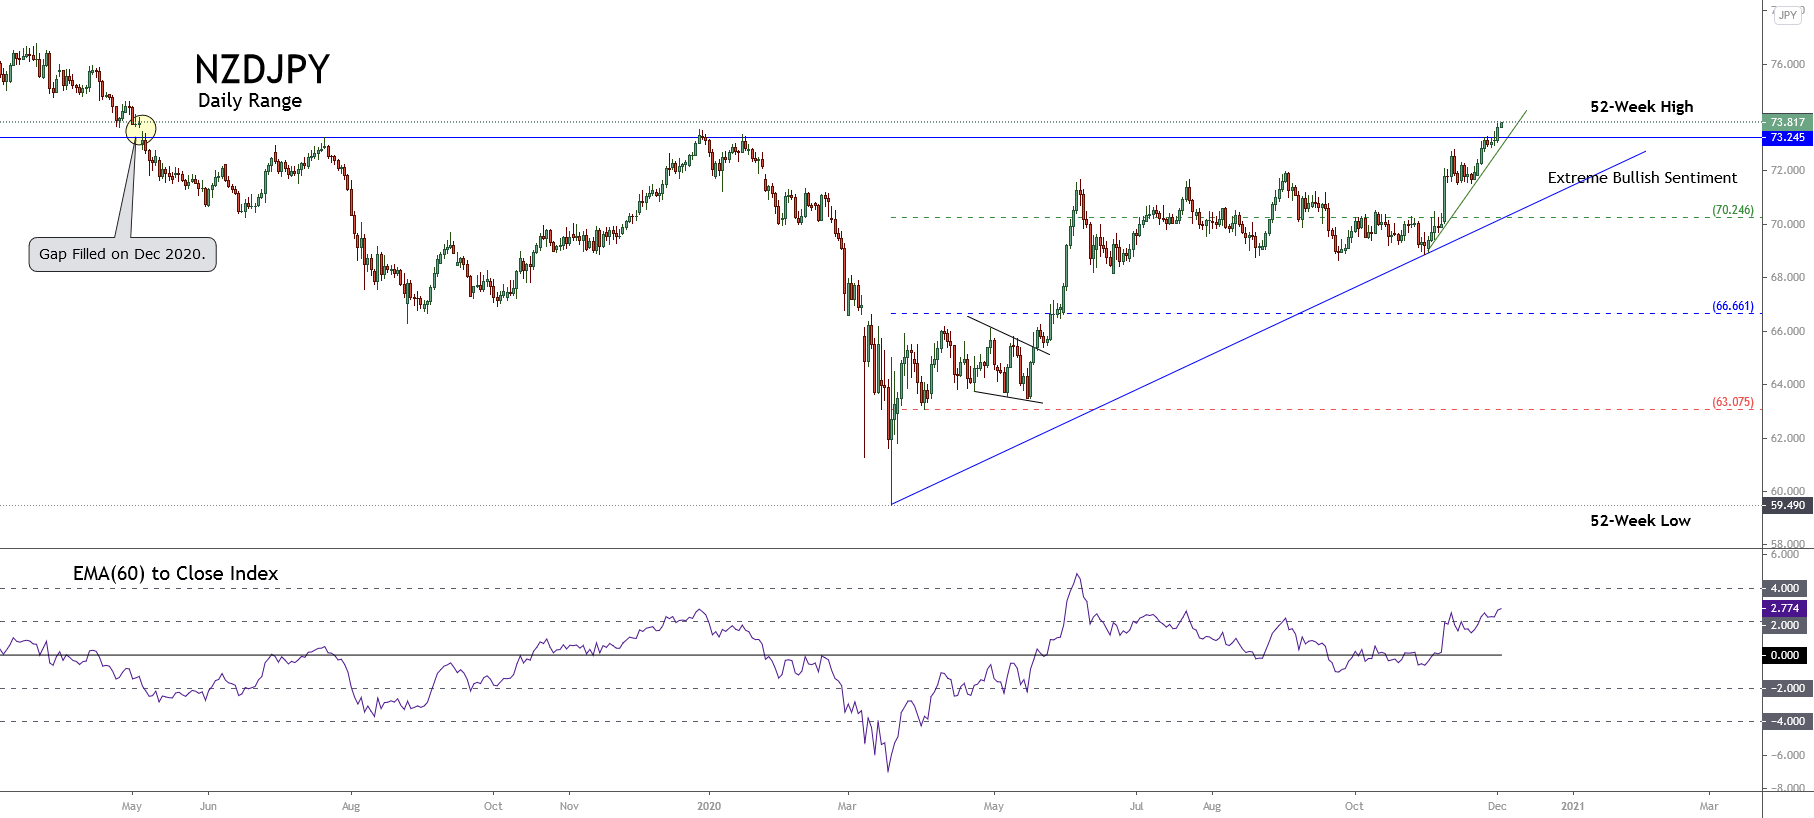
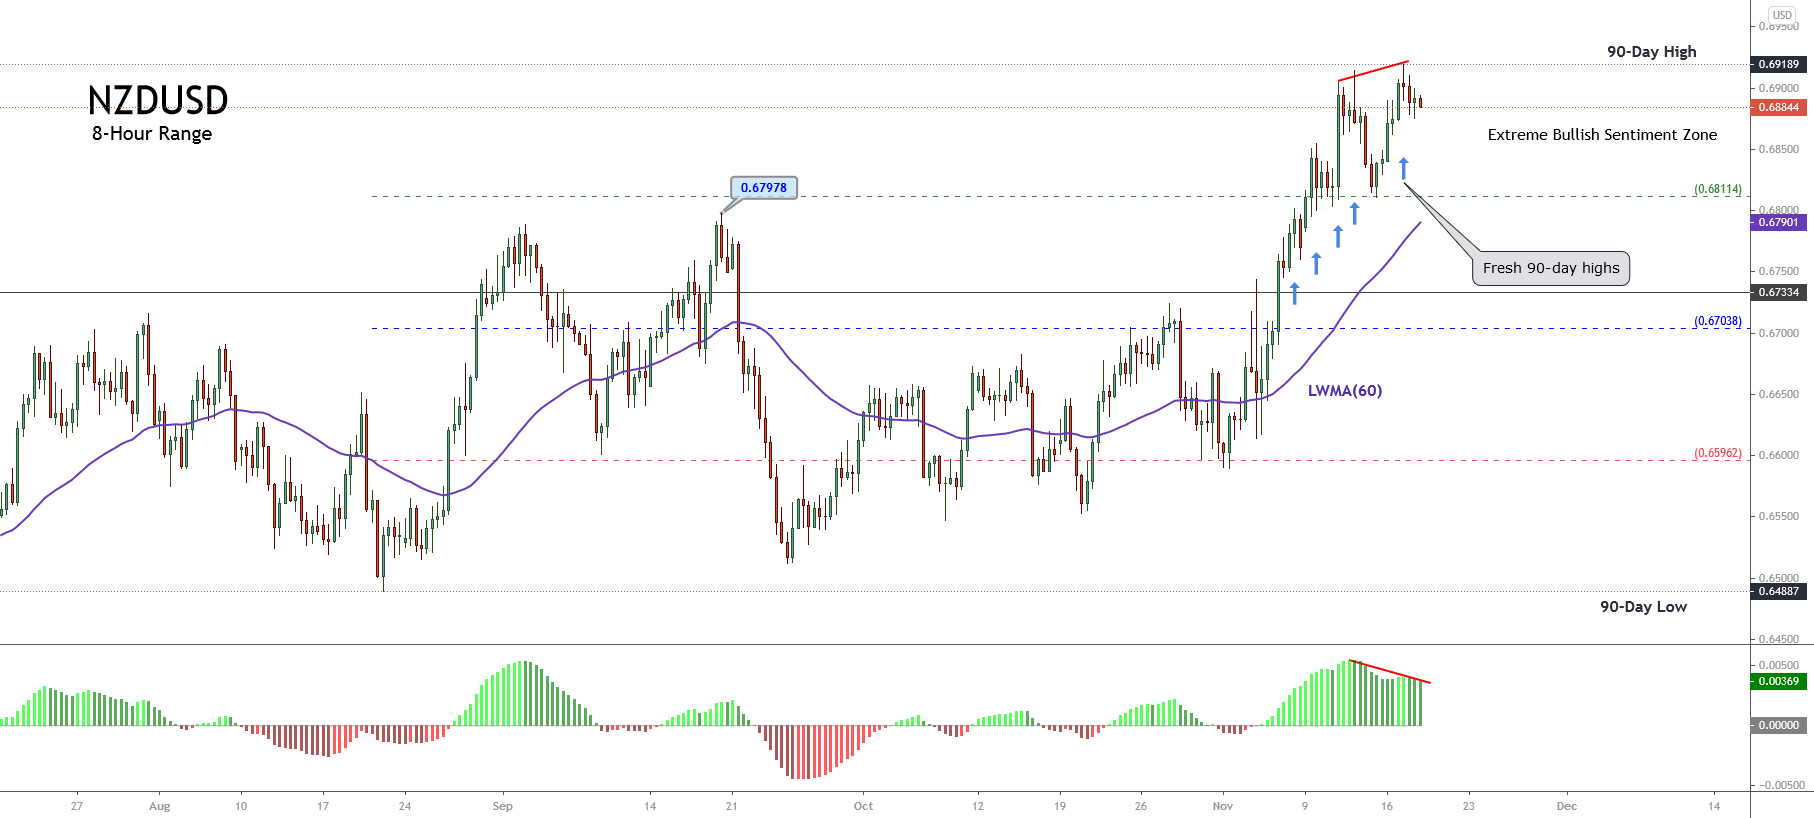
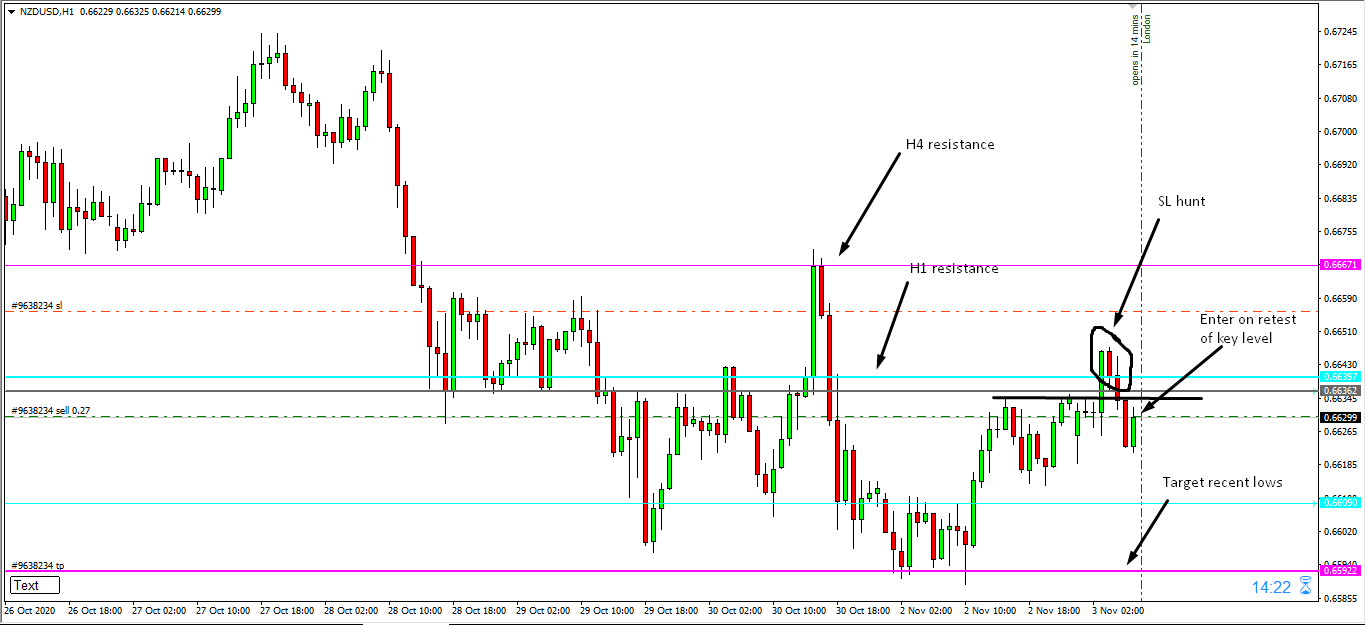
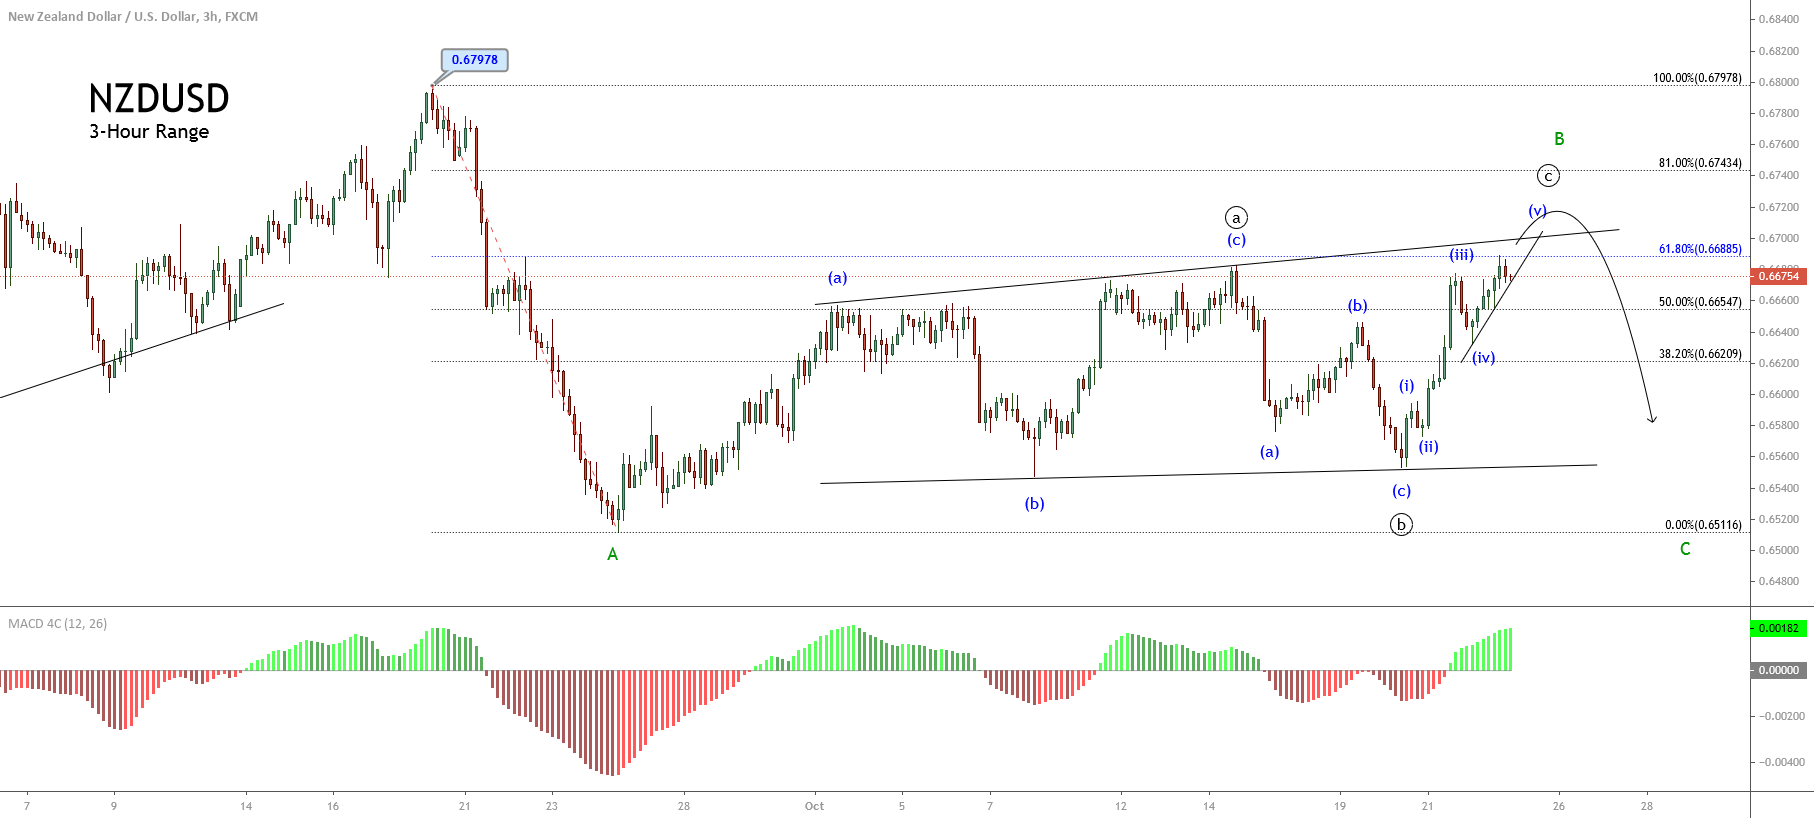
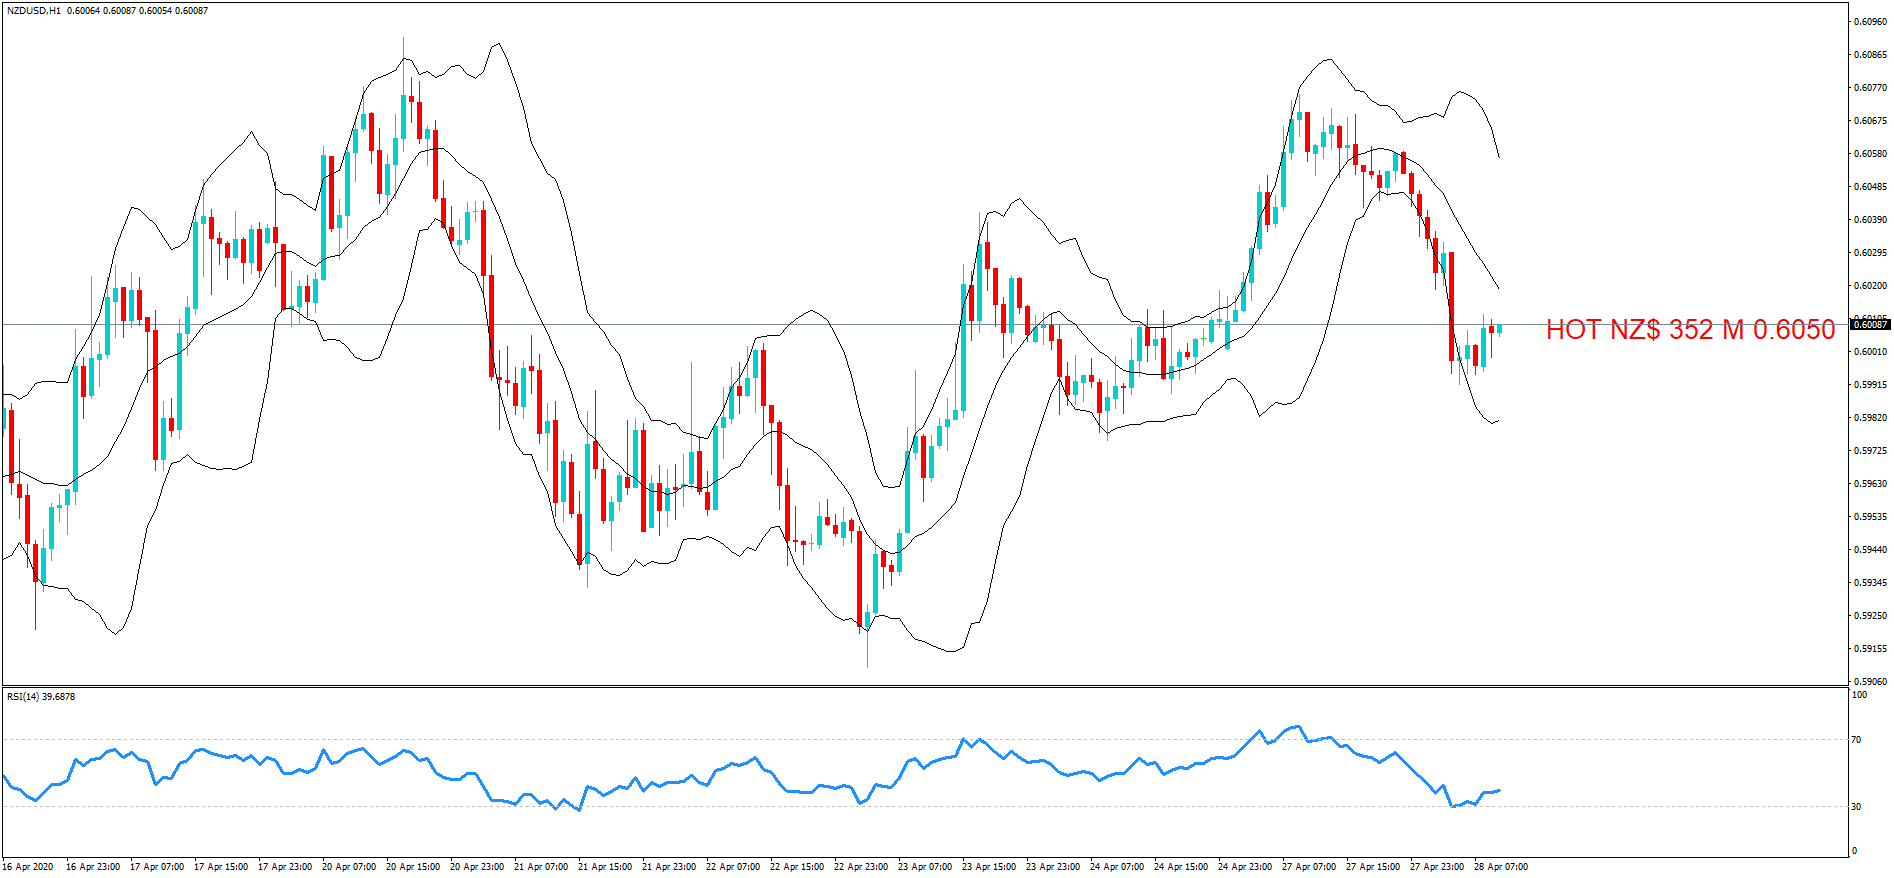
NZD/USD
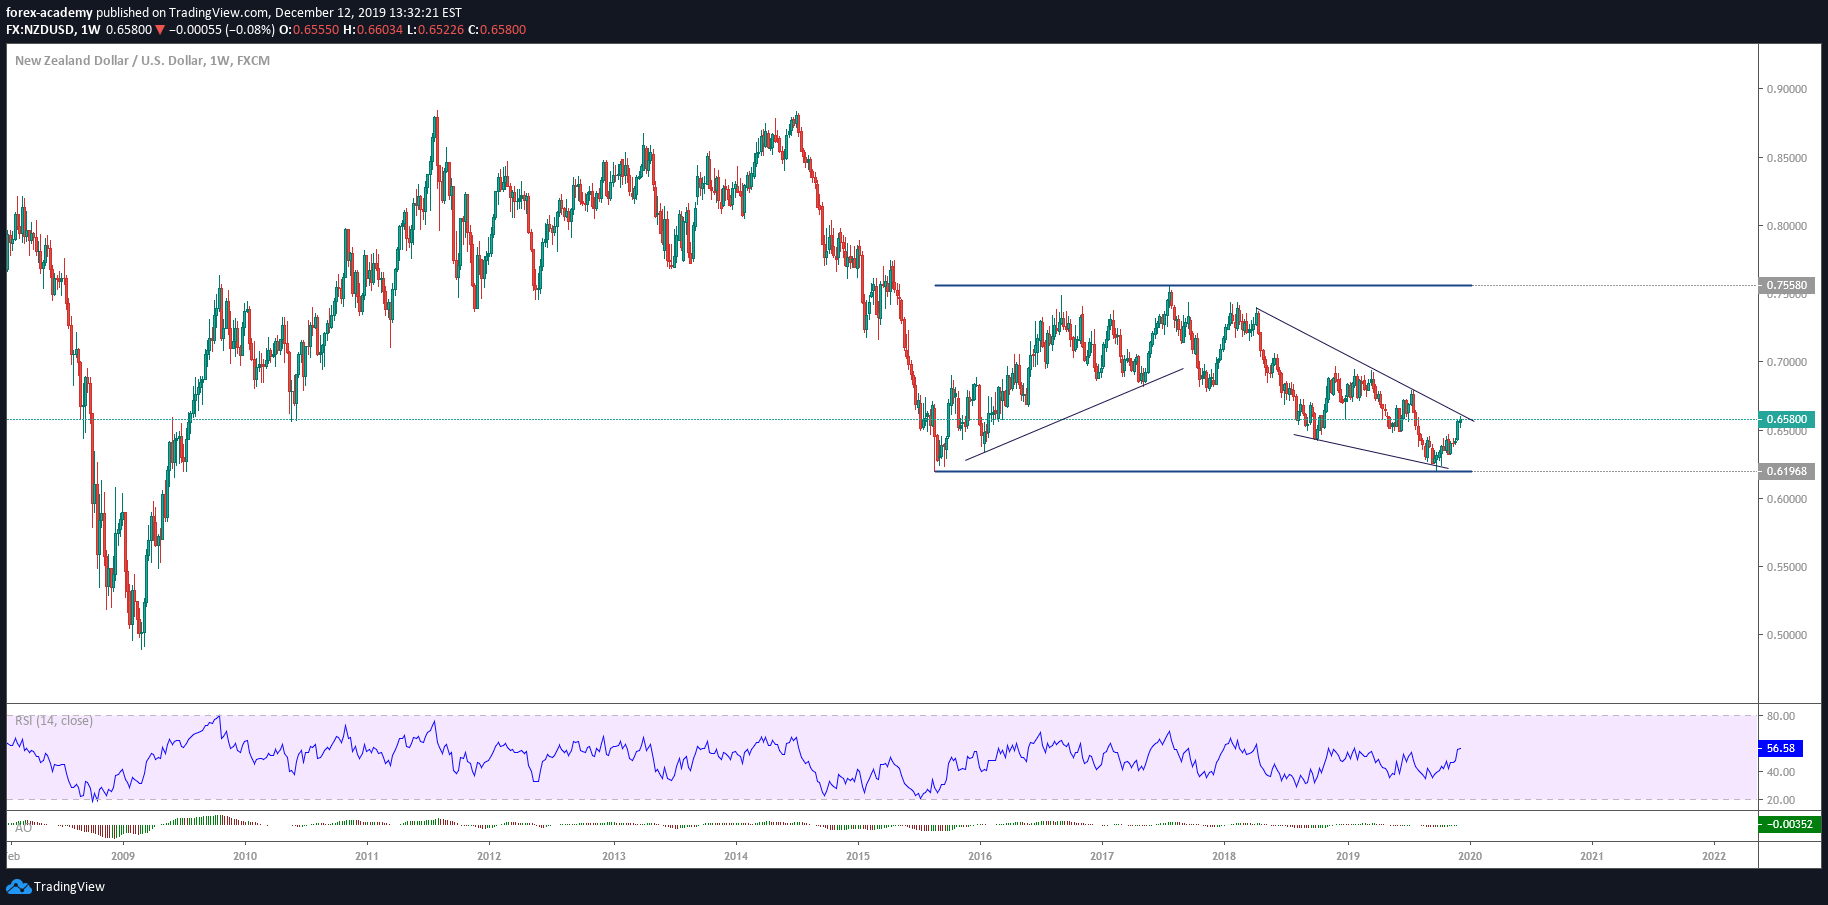
On the daily chart, as we expected before, the pair had bounced from the ascending trend with an engulfing candle, along with breaking a descending trend, to reach our target at the resistance zone at 0.697-0.702.
According to the BAT-shaped harmonic pattern we expected, the price has already reached our first target and is expected to reach the B point at the next resistance zone of 0.7155-0.7185.
The price may have a little retracement before heading this target.

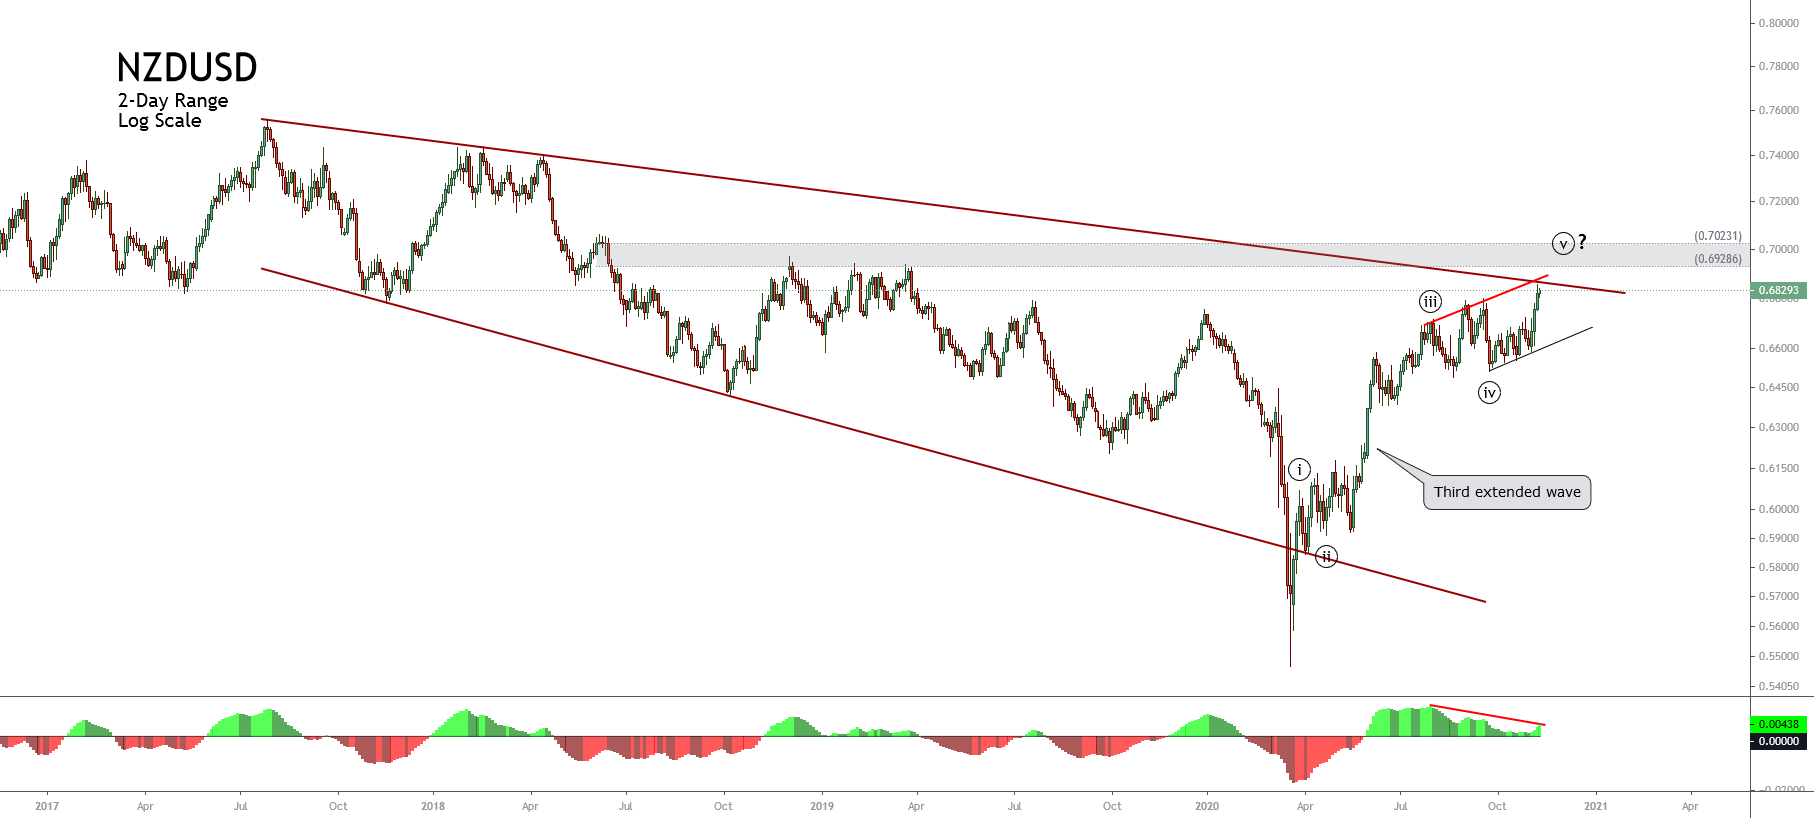
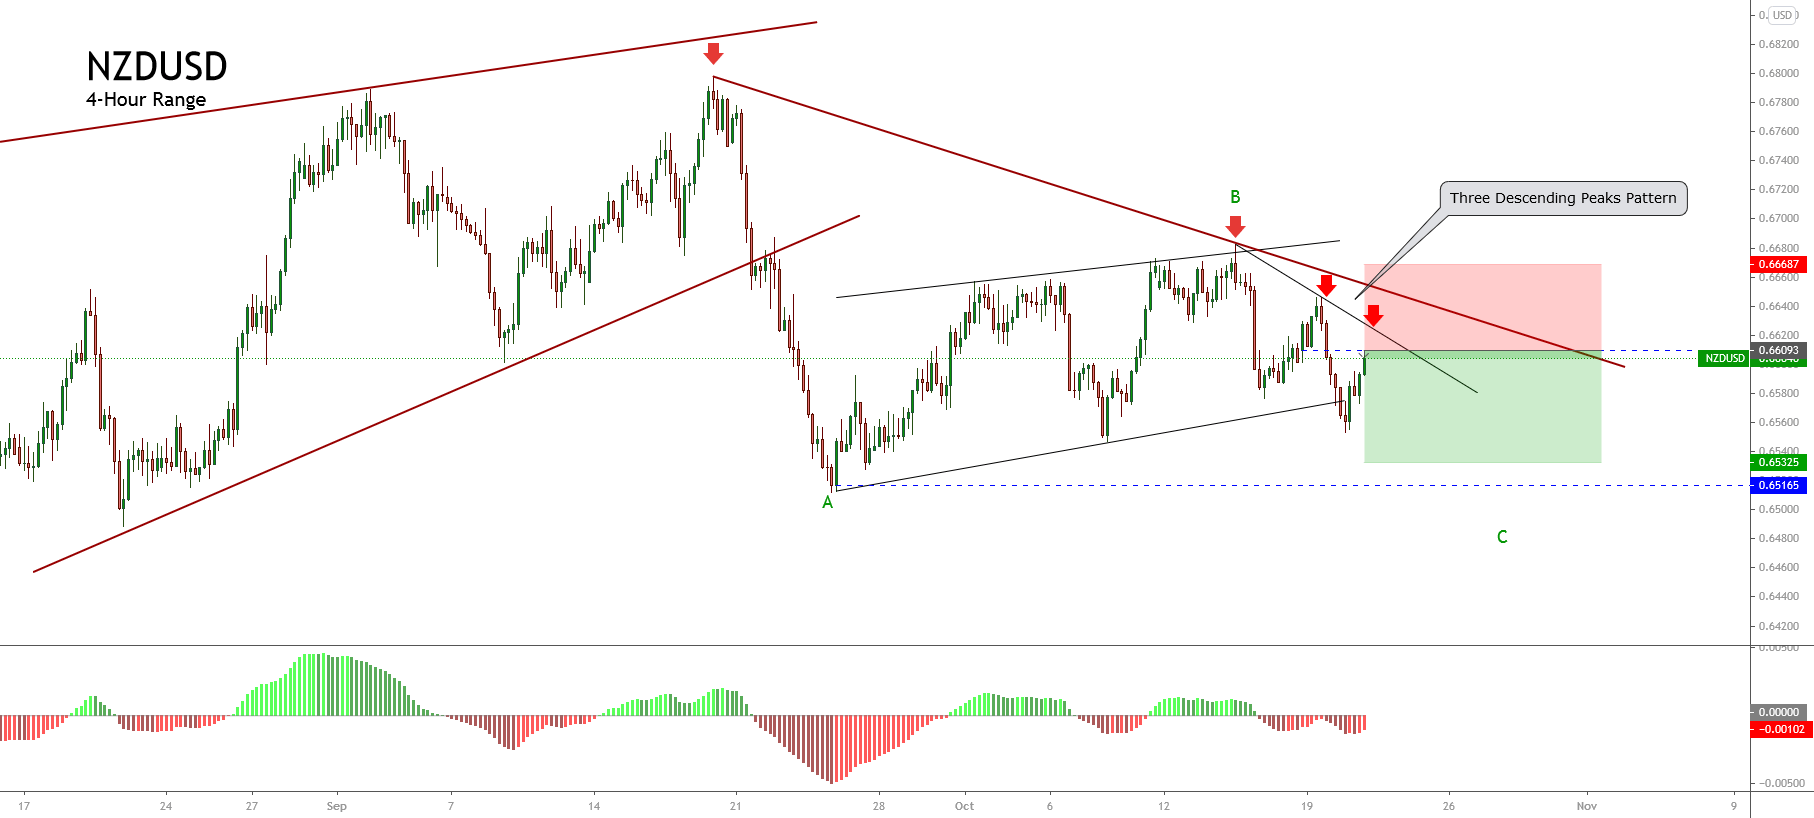
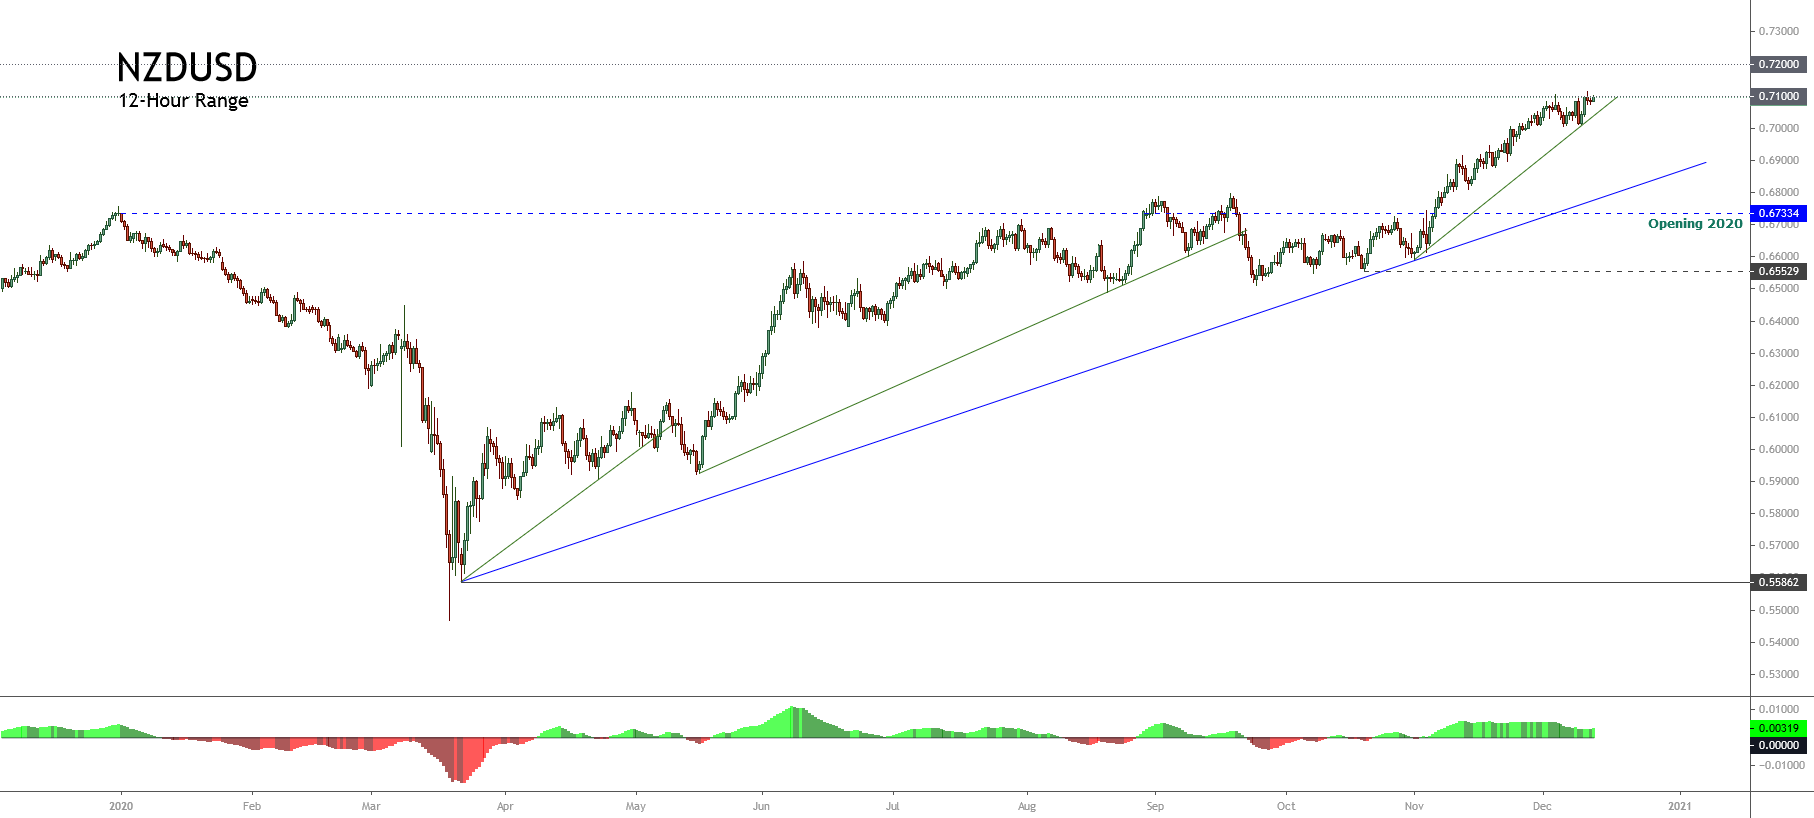 Considering that the NZDUSD pair currently re-tests the 0.71 level, the price could extend its gains, reaching a new yearly high, to find resistance in the next psychological resistance of 0.72.
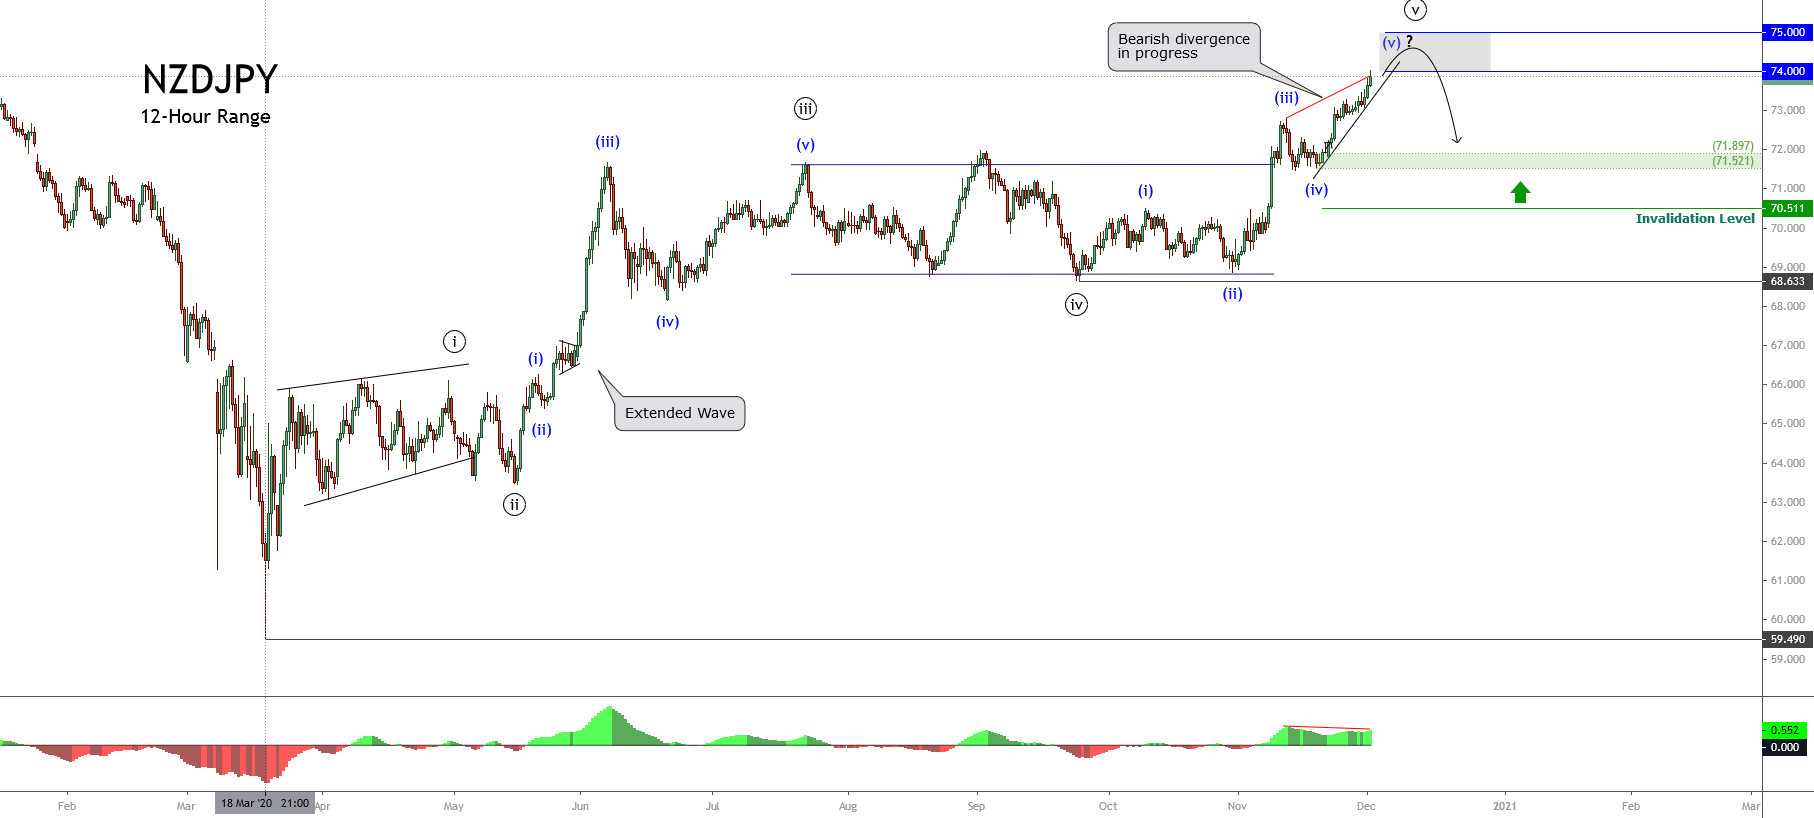
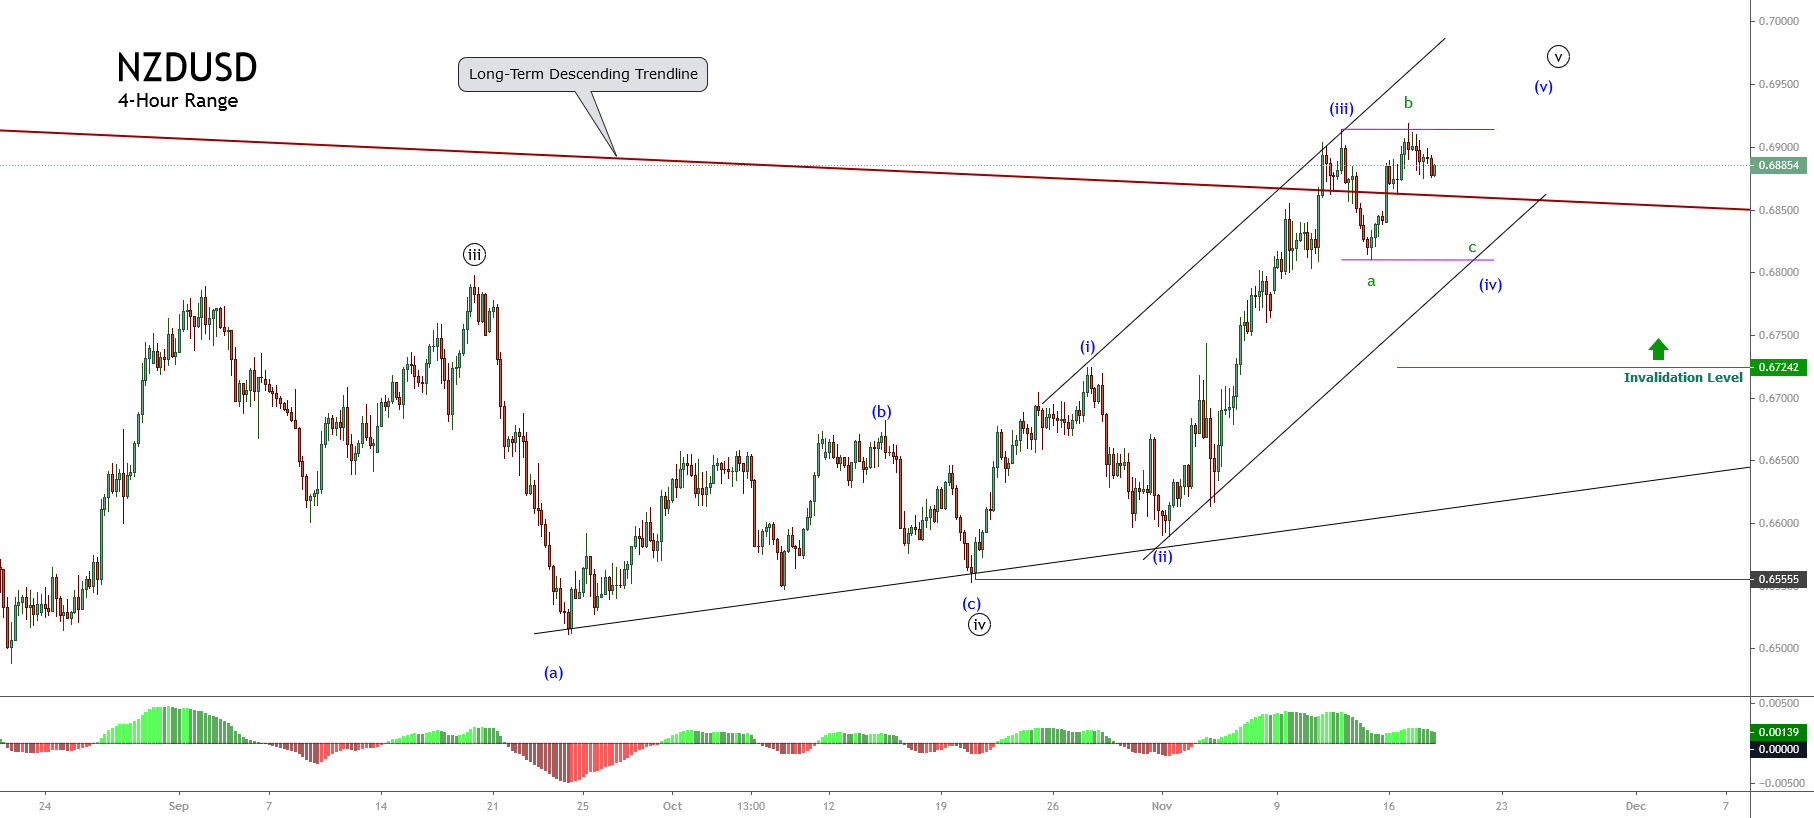
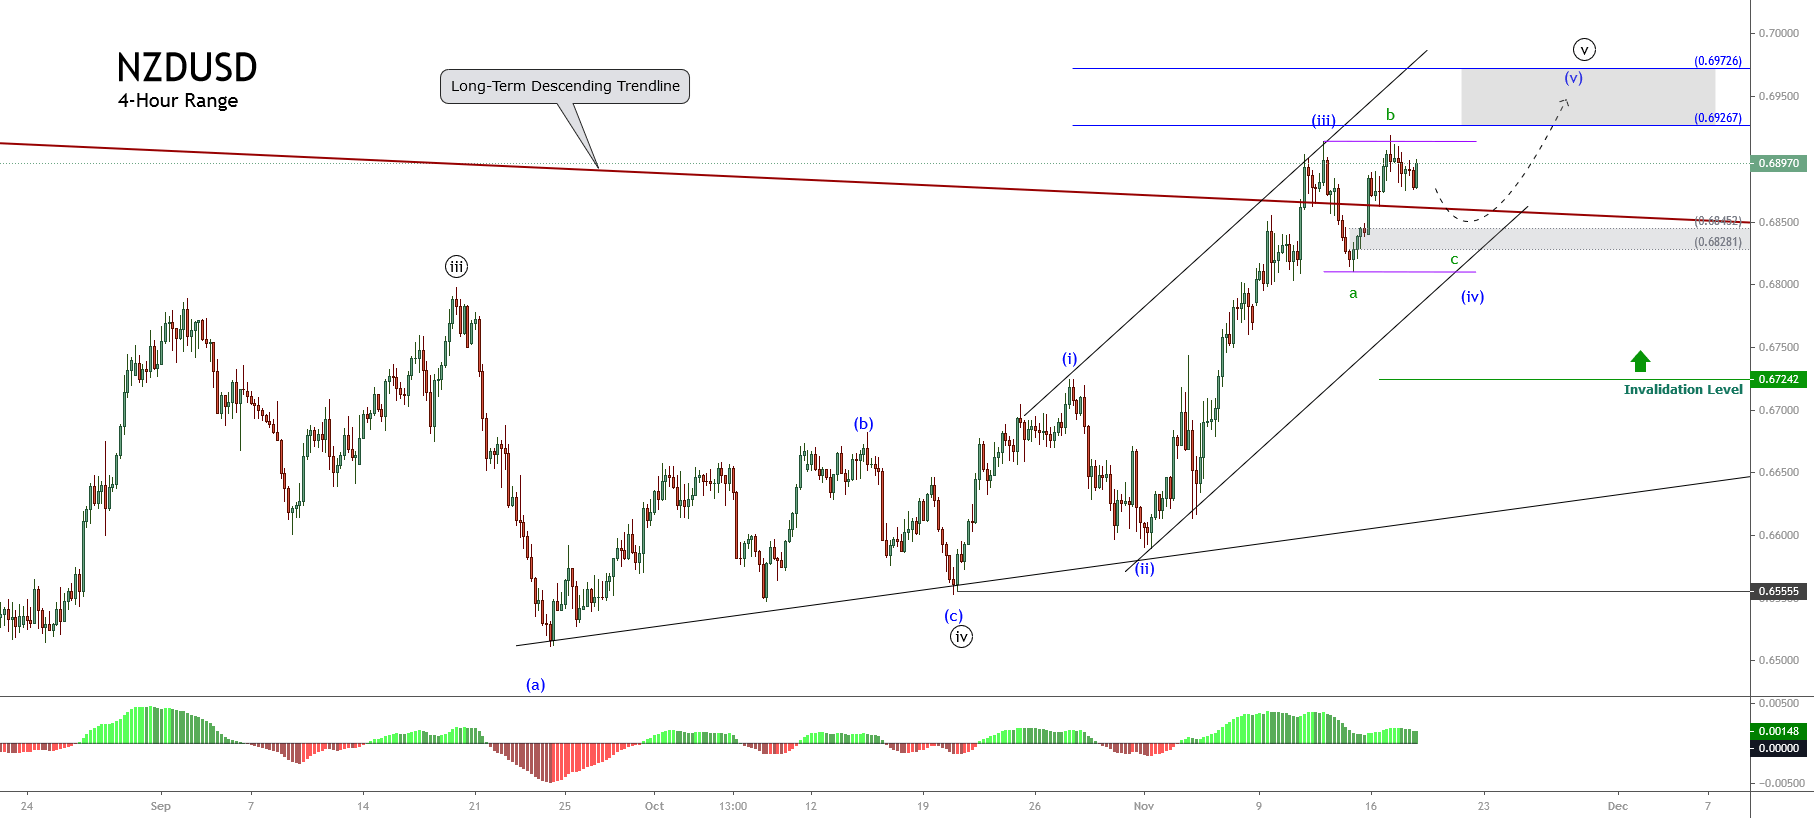
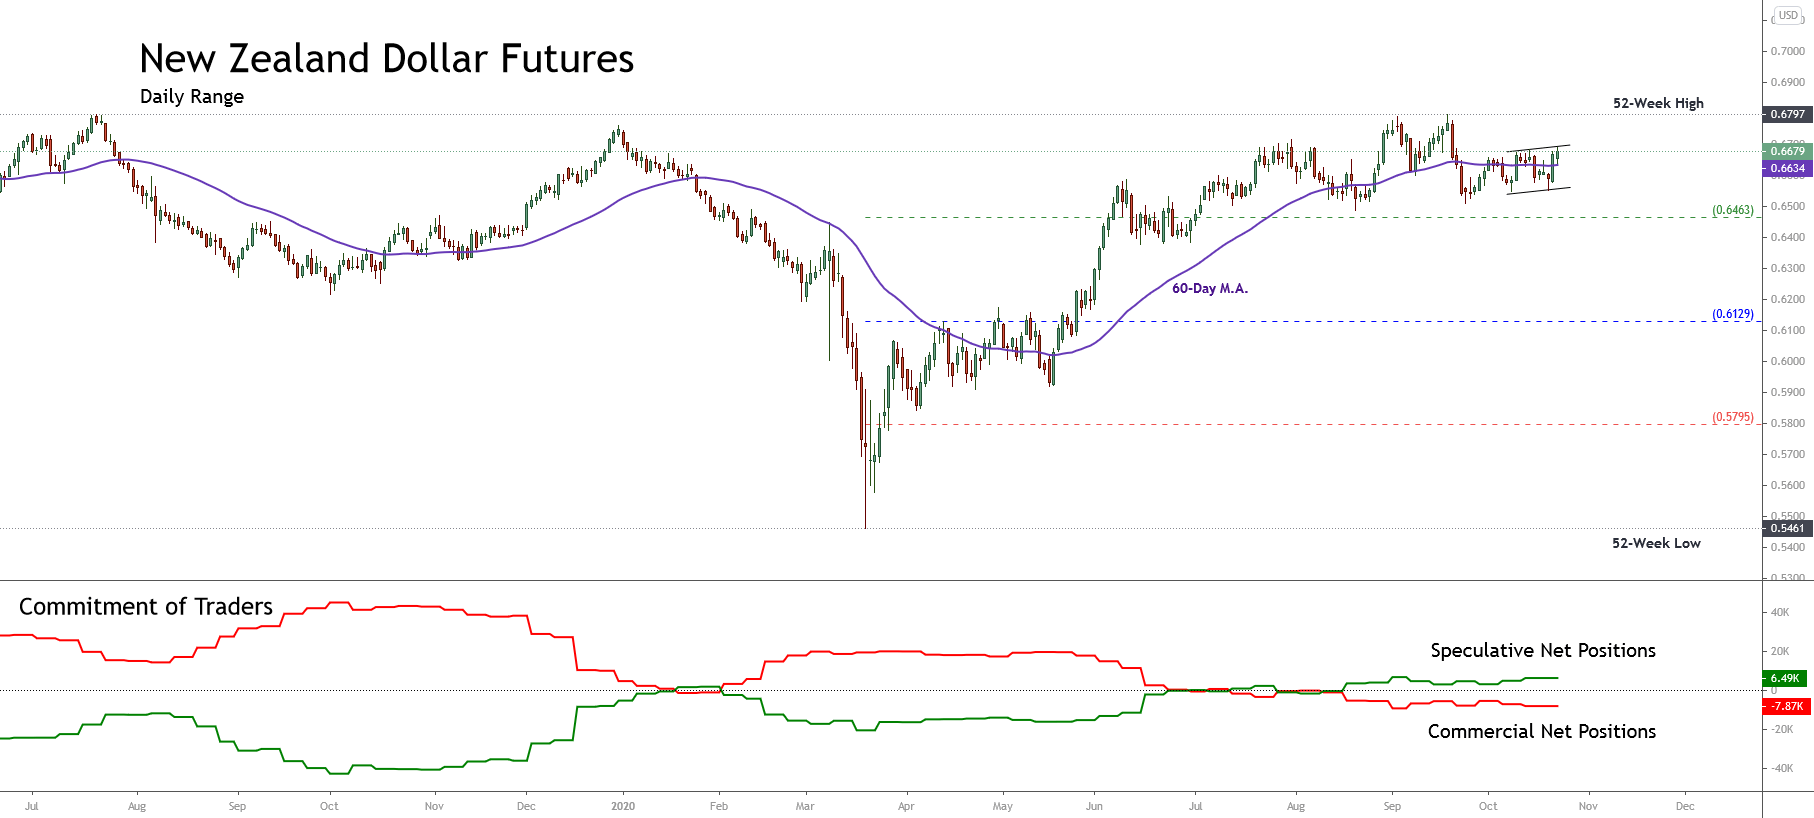
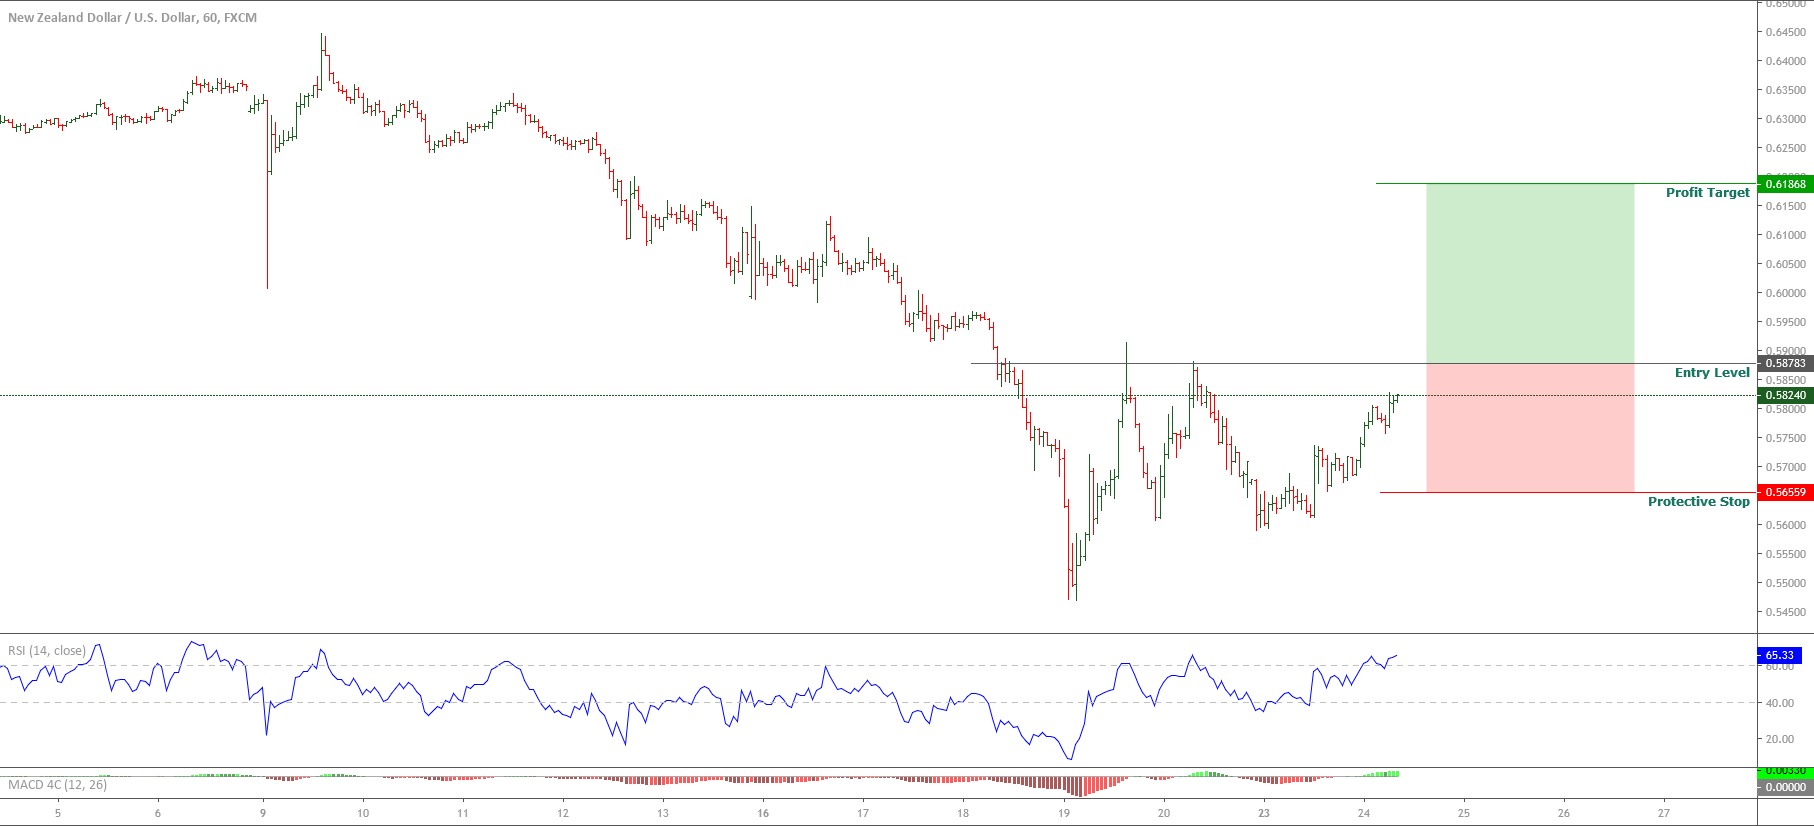
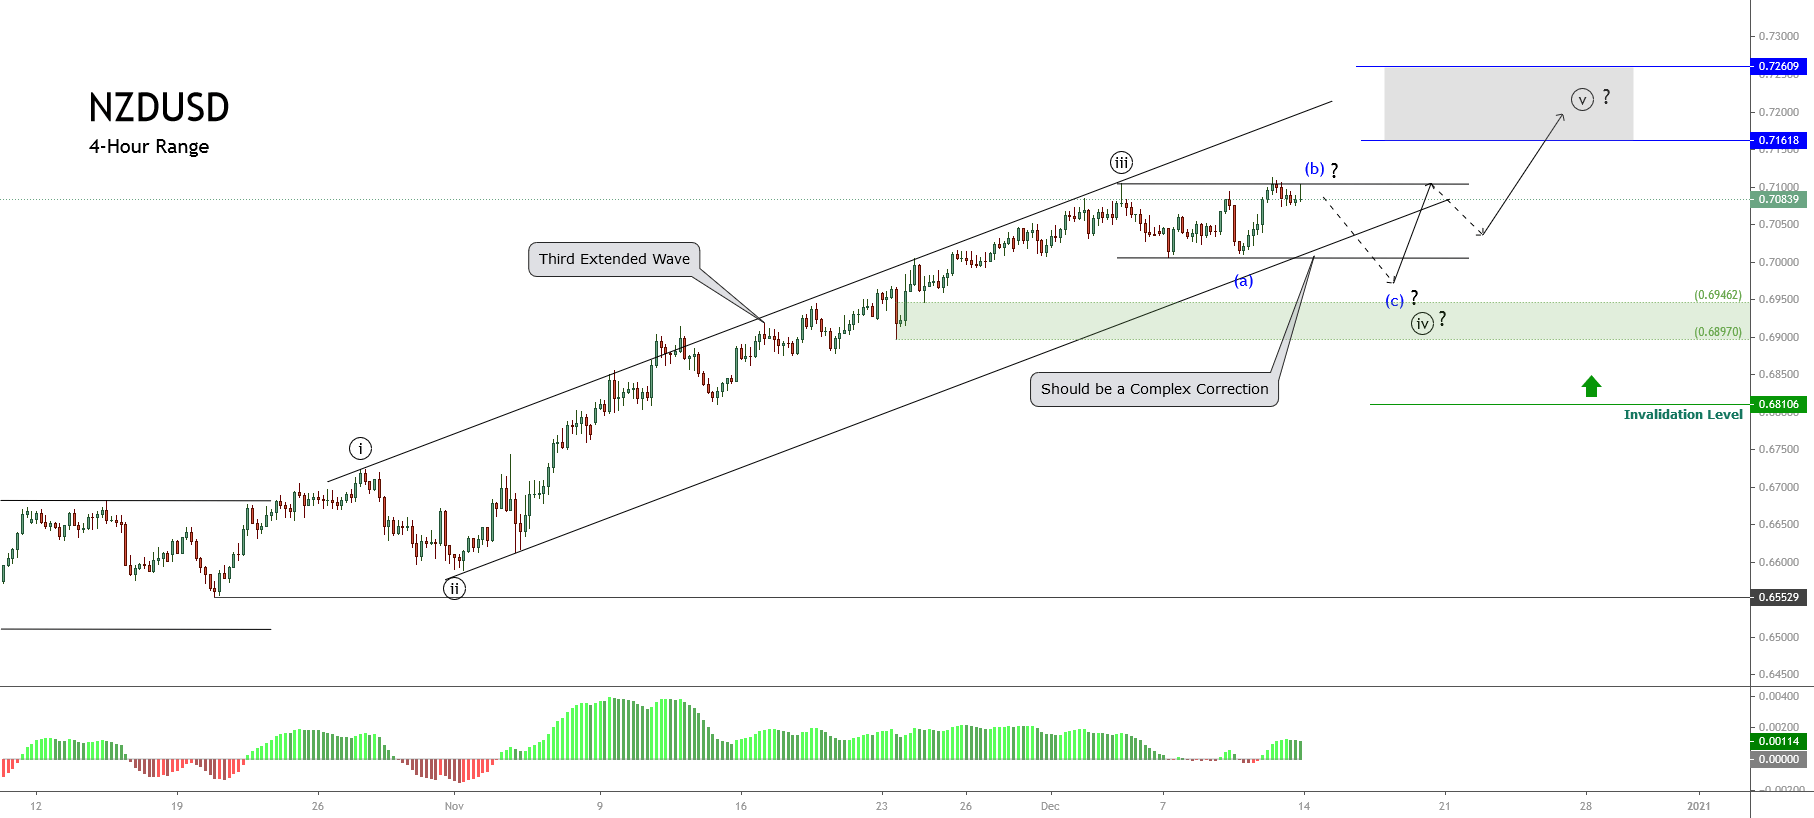 The previous chart illustrates the impulsive structure that continues progressing and looks to develop its fourth wave of Minute degree labeled in black. Moreover, in the chart, we should remark that the third wave, which looks like the extended wave of the incomplete impulsive sequence identified in black, has found resistance at 0.71043 on December 03rd.

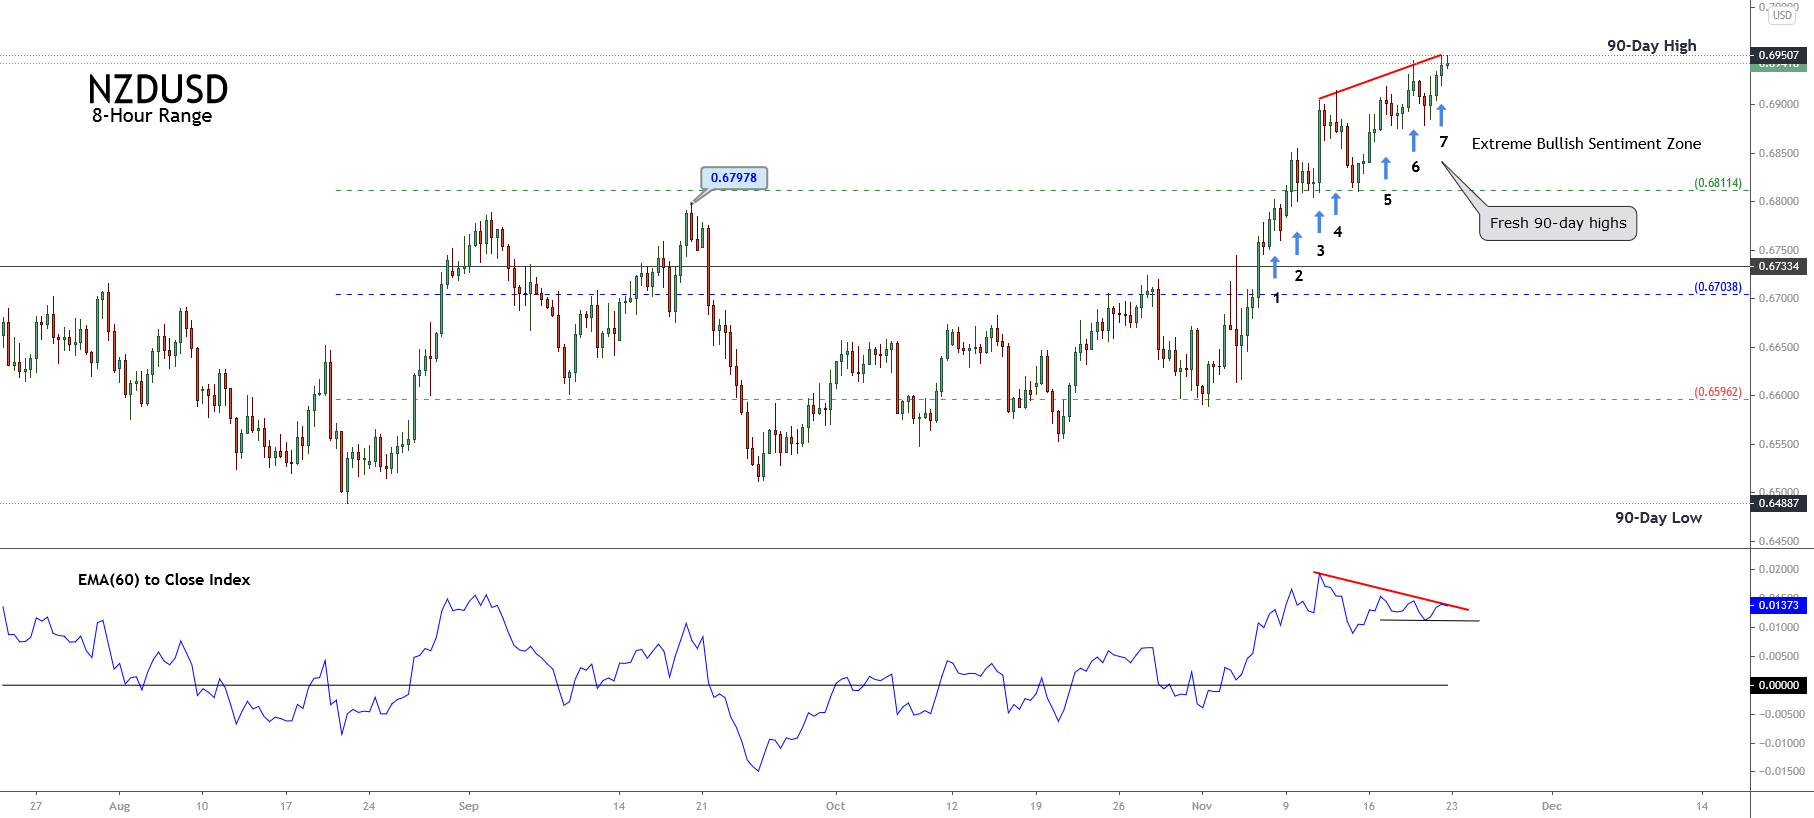
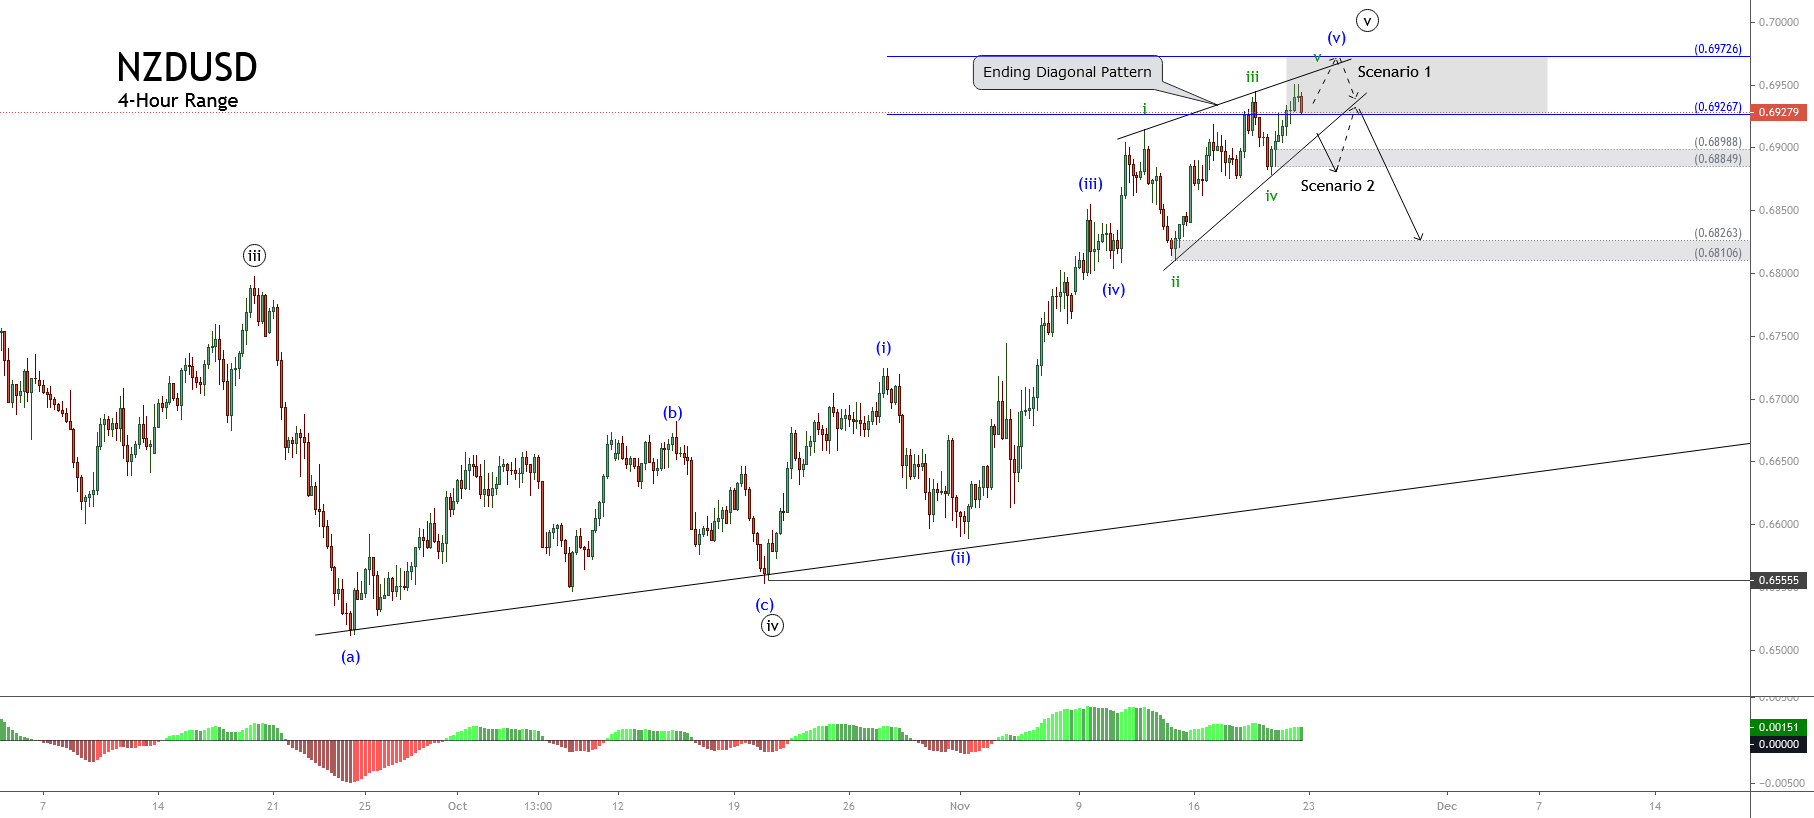


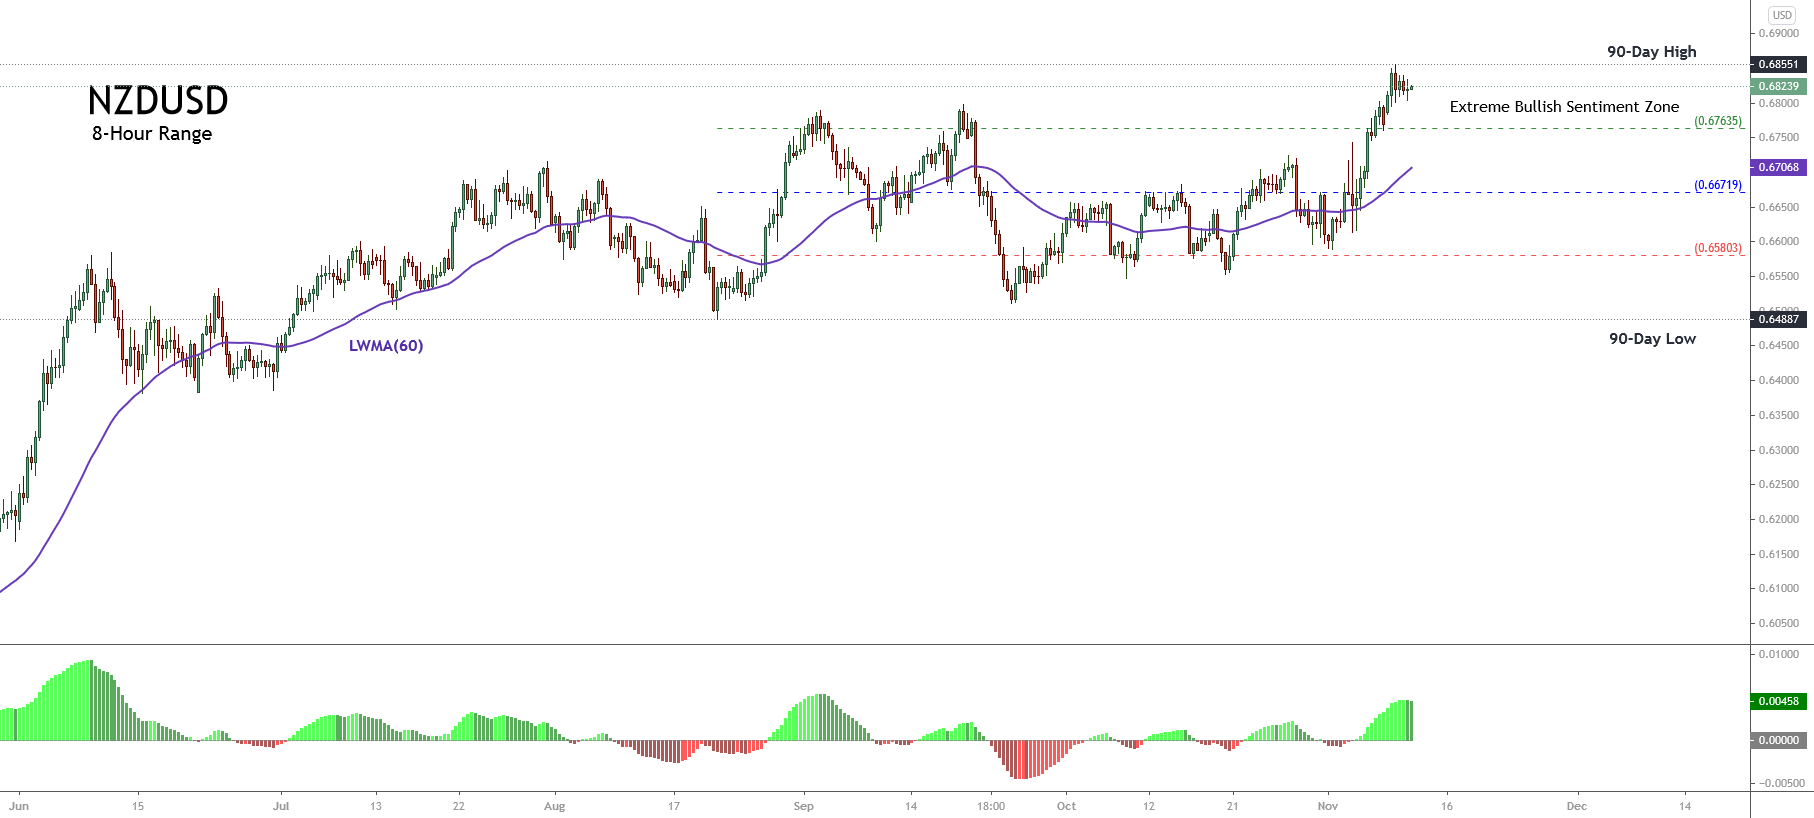
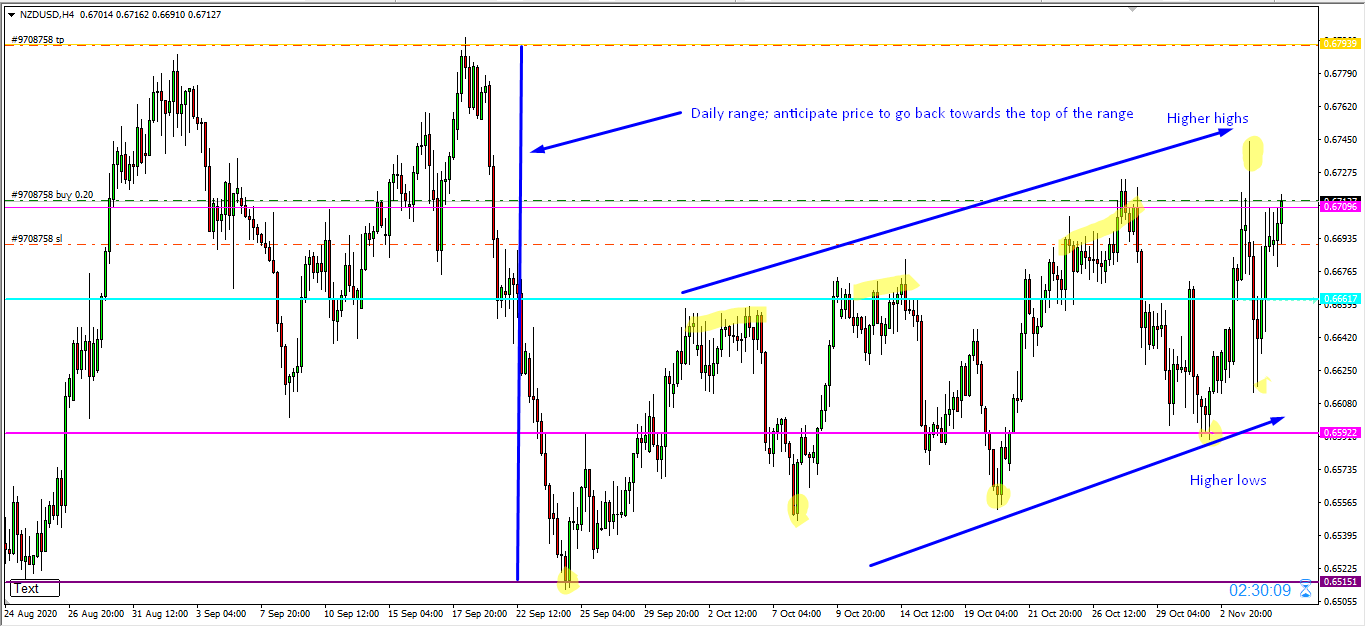

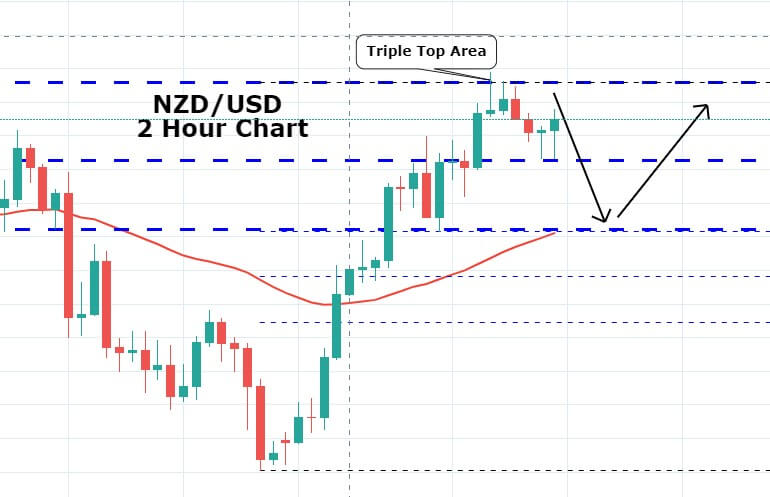


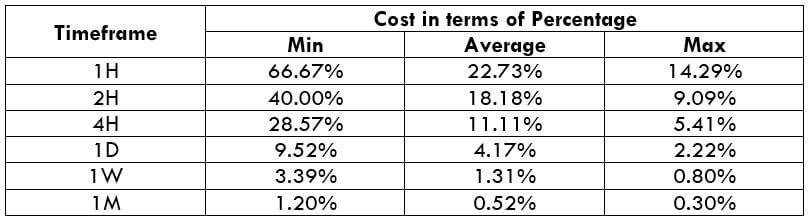
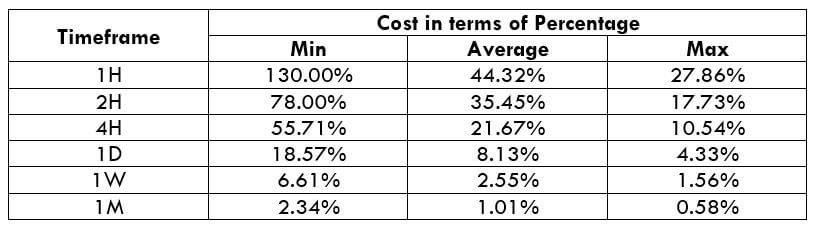 The Ideal Timeframe to Trade NZD/USD