Categories
Forex Assets

What Should You Know Before Trading The CHF/JPY Currency Pair

Introduction

CHFJPY is a symbolic representation of the Swiss franc against the Japanese yen. Here, CHF is the base currency, and JPY is the quote currency. Since it does not have USD involved, it is classified as a cross-currency pair.

Understanding CHF/JPY

The market price of this pair is the number of JPY that are required to purchase one CHF. It is quoted as 1 CHF per X JPY. For example, it’s current value is 112.31, then 112.31 yen are needed to buy one Swiss franc.

Spread

Spread in forex is the difference between the bid price of a currency and the ask price of it. And this pip difference is used up by the brokers as a form of fee. However, it is not a fixed value. It varies from brokers to brokers.

ECN: 1.3 | STP: 2.1

Fees

Spread is not the only form of fee that is levied by the brokers. There is a commission on the trade as well. The commission is nil on STP accounts, but pips on ECN accounts.

Slippage

When entering a trade using market orders, the trader does not get the exact price he intended when he executed it. There might be a difference in pips. This difference is referred to as slippage. Slippage may be in favor of or against the trader.

Trading Range in CHF/JPY

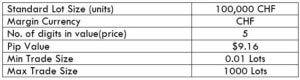
The trading range is simply a representation of the minimum, average, and maximum pip movement in a currency pair. With these values, one can assess how much money a trader will be risking in a particular timeframe. For example, if the average pip movement on the 4H in this pair is 15 pips, then a trader can expect to win or lose $150.6 in about 4H or so.

Procedure to assess Pip Ranges

  1. Add the ATR indicator to your chart
  2. Set the period to 1
  3. Add a 200-period SMA to this indicator
  4. Shrink the chart so you can determine a large time period
  5. Select your desired timeframe
  6. Measure the floor level and set this value as the min
  7. Measure the level of the 200-period SMA and set this as the average
  8. Measure the peak levels and set this as Max.

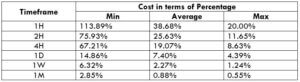
CHF/JPY Cost as a Percent of the Trading Range

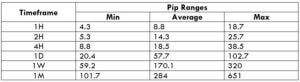
Apart from knowing the profit or loss can one can incur in a given timeframe, it is necessary to assess the cost of these trades as well. Below is a table that represents the cost variation in different volatilities. And these costs are determined by finding the ratio between the total cost and the volatility.

ECN Model Account

Spread = 1.3 | Slippage = 2 |Trading fee = 1

Total cost = Slippage + Spread + Trading Fee = 2 + 1.3 + 1 = 4.3

STP Model Account

Spread = 2.1 | Slippage = 2 | Trading fee = 0

Total cost = Slippage + Spread + Trading Fee = 2 + 2.1 + 0 = 4.1

The Ideal way to trade the CHF/JPY

The forex market is open 24hours. However, it is not ideal to enter the market at any time. There are times when the costs are low, and times when it’s high.

The percentages in the table are directly proportional to the costs of the trade. It is seen that the percentages are high in the minimum column, and low in the maximum column. Hence, we can conclude that costs are inversely proportional to the volatility of the market. Now, when it comes to choosing the right time to trade, it is best to enter during those times when the volatility of the market is around the average values. This will ensure enough volatility in the market and low costs as well.

In addition, placing orders using limit/pending orders reduces costs too because this will completely nullify the slippage on the trade and will bring down the total cost significantly.

Categories
Forex Market Analysis

Daily: Trade Tensions Continue, Non-Farm Payrolls, UK Growth


NEWS COMMENTARY


The U.S. dollar was lower against other currencies on Monday, as trade tensions put expectations for a Federal Reserve rate hike in September under pressure.

trade tensions with China continued, as U.S. President Donald Trump warned he would impose tariffs on $267 billion worth of Chinese imports, on top of an earlier promise of tariffs on $200 billion worth of Chinese goods.

China’s foreign ministry said on Monday that it would “respond to any news steps on trade”.

“If the U.S. side obstinately clings to its course and takes any new tariff measures against China, then the Chinese side will inevitably take countermeasures to resolutely protect our legitimate rights,” Foreign Ministry spokesman Geng Shuang said.

The US index was down despite Friday’s upbeat jobs report increasing expectations of a fed rate hike in at its next meeting September 25-26.

US non farm payrolls were close to expectations but the market is entirely focused on wages and the report showed hourly wages up 0.4% higher than 0.2% expected.

It was a different story in Canada where employment fell  to 51.6K jobs compared to +5.0K expected. Hourly wages there also fell to 2.6% compared to 3.0% previously and 3.5% two months ago

The British economy posted the fastest expansion in nearly a year as the services sector remained powerful  in the three months through July. Growth beat economist estimates to come at 0.6 & with construction output and retail also providing an enhancement. Separate figures showed the trade deficit in goods narrowed to a five-month low of 9.97 billion pounds ($13 billion) in July.


chart analysis


DAX

On the daily chart, we can see that the price had a bearish rally for the past six weeks until it reached the key support zone of 11900.8-11742.4

It’s also the lower side of the descending channel along with 88.6% Fibonacci

The price is technically expected to have its way up back again to the key resistance level 12582.46 which is the top of descending channel and the broken ascending trend


OIL

On the daily chart, the price is moving sideways between the support area 66.2-64.15 and the resistance area 74.45-72.45

After breaking the ascending trend, the price turned back to this support zone with bounce from an ascending trend as shown

The price now is retesting this zone with price action “pin bar”, to have a bullish movement again

So, it’s expected to go up to the resistance zone of 72.45-74.45


CHFJPY

On the daily chart, the pair is facing a punch of resistance levels

Firstly the key resistance 116, secondly the weekly descending line from the high of 2015, third the up side of the ascending channel which is considered as a flag, and finally the overbought on RSI

So, the piece is expected to turn back down to the support 112.8


NZDJPY

On the daily chart, the pair is facing a punch of support levels

Firstly the key support zone 72.65-72.35, secondly the down side of the descending channel, third the AB=CD harmonic pattern, forth the double bottom reversal pattern, and finally the divergence on RSI

So, the price is supposed to get back up again to the resistance 74.01


Categories
Forex Market Analysis

CHF/JPY reaches main support levels

Main scenario:

The pair had reversed from the key resistance at 113.05 which was the top of the ascending channel & 50% Fibonacci level

The price successfully went down to reach the support 111.3, along with the upper side of the ascending channel

The resistance 111.9 is crucial level, if the price closes above it, we may see the price hiking to 113.05 again


Alternative scenario:

If the price couldn’t break through that resistance and closes beneath the support 111.3, a possible bearish momentum would take place to the next support at 110.3


Entry:

The price is about to form an engulfing candle, but we will have to wait for a break above the 111.3 level to secure the entry


Stop loss:

As long as the 111.3 level was a stable support, it will be the appropriate stop loss.


Take profit:

The red resistance zone of 112.55-113.05 was the last area that stopped the price, so we can make them our first and second targets


Trade duration:

It’s considered as a swing trade, so patience and consistency are needed.


Warning level:

If the support & ascending channel are broken, I would consider closing the trade as it may have more bearish momentum then.


Categories
Forex Market Analysis

Daily Market Update: EU Data Remains Stable, PBoC Efforts to Support Yuan


 News Commentary


European data was still steady even after sentiment remained cautious with flash services PMI data easing slightly with 54.4, less than expected of 55.0. Meanwhile flash manufacturing PMI came positive with 55.1, more than expected of 54.7.


The Japanese yen cut most of its gains frustrating expectations about the Bank of Japan starting a fresh round of stimulus at its scheduled policy meeting next week.

Japan’s central bank is discussing changes to its interest-rate targets and stock-buying techniques, sending bond yields and the yen rocketing higher on Monday.


Risk appetite was mostly stable across markets after Beijing vowed to pursue a more ‘vigorous’ financial policy, stepping up efforts to support growth among growing economic struggle conditions.


 Chart Analysis


US INDEX

On the daily chart, the price has bounced from the red resistance zone for the third time to shape the reversal triple top.

Price has recently formed another reversal pattern to assure the bearish bias with the wedge.

Followed by a break beneath an ascending trend on RSI, the index is settled down at the ascending trend line, if it’s broken, the price will move its way back to the support zone 93.2-92.6.


USD/JPY

The pair had broken before the key level at 111.3 along with a descending trend line from the high of 2015, to reach the resistance of 113.15 to then bounce from there as a retracement.

Now, the price is located at a good long-buy position according to;- the support of 111.3, the retest of the broken descending trend, 23.6% Fibonacci level and the ascending channel.

All these factors may boost the price further to go back to the level 113.15 and more if the price witnesses a suitable price action from these levels.


AUD/USD

On the daily chart, the pair reached back the green support zone again to shape a double top pattern.

Followed by divergence on RSI, our bullish view is still the same: if the price manages to stay above the support area and the key level 0.7455, it will be heading towards the combination of levels of descending trend, ascending channel and resistance zone at 0.7655-0.774.


NZD/USD

On the daily chart, the price retested the green support zone 0.675-0.6695, followed by divergence in RSI.

An AB=CD harmonic pattern has been shaped to reinforce the bounce.

If the price could break above the key level at 0.6845, the price will be supposed to head back to the top of the descending channel with the resistance zone at 0.697-0.703 only if it manages to hold above the green zone.


AUD/JPY

On the daily chart, as we expected, the price has bounced from the red resistance zone at 83.9-85.95 with an engulfing bar.

The price is expected to continue its reversal to keep going in its sideways movement to the support zone 81.2-80.5.


CHF/JPY

On the daily chart, as we expected, the price has bounced according to the key levels that the price has recently reached the resistance zone at 112.85-113.05, reversal wedge, moving average 200 and 50% Fibonacci.

Followed by AB=CD harmonic pattern, if the price could break beneath the key level 111.9, the price is expected to go down to 111.9 then 110.3.


Categories
Forex Market Analysis

Daily Market Update: Trump Comments on Rate Hikes, Japan & Canada CPI


News Commentary


The dollar reversed against the currency basket on Thursday after U.S. President Trump said he was “not happy” about the Federal Reserve rate hikes but the downside was limited amid optimism over the U.S. economy.

“I’m not happy about it,” President Donald Trump said about interest-rate increases during an interview with CNBC Thursday, claiming that “higher rates put the United States at a disadvantage.” Trump insisted, but, he also sees that “Fed do what they feel is best.”

However, Powell earlier this week said gradual interest rate hikes would be “the best way forward” for the economy, citing stronger labour markets, and inflation that had met the Fed’s 2% objective.


The US and China are continuing a full-blown trade war. The People’s Bank of China (PBOC) is increasingly favouring a weaker Yuan after setting the Yuan reference rate at 6.7671 versus previous day’s fix of 6.7066.


The Japanese Yen started Friday’s trading session slightly affected by the release of local inflation data. June’s national CPI was 0.7%, lower than forecasts of 0.8% and in line with May’s result. However, the Yen may rise as trade war tensions may increase risk aversion.


All eyes will be on Canadian CPI at 12:30 GMT with a forecast of 0.1% such as with June’s reading. Traders will follow the result to get any conclusion about soon rates hike.


 Chart Analysis


US INDEX

On the daily chart, the price has bounced from the red resistance zone for the third time to shape the reversal triple top.

The price has recently formed another reversal pattern to assure the bearish bias with the wedge.

Followed by a break beneath an ascending trend on RSI, the index is supposed to move its way back to the support zone of 93.2-92.6.


AUD/USD

On the daily chart, the pair went back to the green support zone again to shape a double top pattern.

Followed by divergence in RSI, our bullish view is still the same: if the price manages to still be above the support area, it will be heading towards the combination of levels of the descending trend, ascending channel and resistance zone at 0.7655-0.774.


NZD/USD

On the daily chart, the price retested the green support zone 0.675-0.6695, followed by divergence in RSI.

An AB=CD harmonic pattern has been shaped to reinforce the bounce.

The price is supposed to head back to the top of the descending channel with the resistance zone at 0.697-0.703, but only if it manages to hold above the green zone.


AUD/JPY

On the daily chart, as we expected, the price has bounced from the red resistance zone at 83.9-85.95 with engulfing bar.

The price is expected to continue its reverse to keep going in its sideways movement to the support zone 81.2-80.5.


CHF/JPY

On the daily chart, it’s obvious to recognise by the key levels that the price has recently reached the resistance zone at 112.85-113.05, reversal wedge, moving average 200 and 50% Fibonacci.

Followed by AB=CD harmonic pattern, the price is expected to go down to 111.9 then 110.3


Categories
Forex Market Analysis

Daily Market Update: Release of US Prelim GDP, and Big Day for the Canadian Dollar


News Commentary


Italian President Sergio Mattarella assigned a former-IMF economist as a temporary Prime Minister.

Now the eurozone’s third-largest economy, Italy will hold new elections in September 2018. Investors may consider whether these elections will strengthen or weaken Italian populist forces.

Besides, economists have concluded that the ECB will begin hiking rates in the middle of next year.

German retail sales & preliminary CPI will be released today with a forecast of 0.5% & 0.3% respectively, followed by Spanish flash CPI with an expectation of 1.7%.

Two big releases for the US are the ADP Non-Farm Employment Change with a forecast of 191K after a previous reading of 204K, and preliminary GDP of 2.3%.

The big announcement today goes for the Bank of Canada with their overnight rate to be stable at the last level of 1.25%, followed by the rate statement which may catch any notes about rate hikes.


Chart Analysis


AUD/NZD

On the daily chart, as we expected before, the price had made its way up to targets at the resistance zone 1.0815-1.0865, boosted by a BAT  harmonic pattern.

The price is going to have a little retracement at these levels to continue its bullish movement up to the 1.1045 level.


CHF/JPY

On the daily chart, the price reversed from the support zone of 107.6-108.4, then broke the descending channel up to reach the key resistance at 112.1.

The price had made a pullback from this level to retest the channel & the zone.

So, the price is expected to revisit these level before approaching the 38.2% Fibonacci at 112.1-112.6.


 NZD/USD

On the daily chart, the pair is still being traded above the ascending trend and the support of 0.6875, with oversold on RSI.

We can also notice that there’s a descending channel that the price has already broken, along with a BAT harmonic pattern which is already shaped. So, we can conclude that the last break beneath the upward trend line was a false break and the pair is about to restart its bullish momentum towards the resistance zone of 0.697-0.702.