Categories
Forex Assets

Trading The JPY/HUF Forex Exotic Currency Pair

Introduction

In the JPY/HUF currency pair, JPY represents the currency of Japan. On the other hand, HUF is the Hungarian Forint. This currency pair represents the value of Hungarian Forints (quote currency) per Yen (base currency). This pair can be represented as 1 JPY per X HUF. For example, if the value of this currency pair is at 2.91 (CMP), then about 2.9 HUF is required to purchase one JPY.

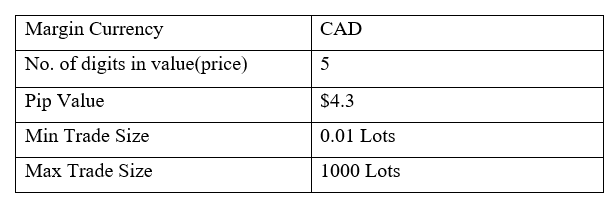
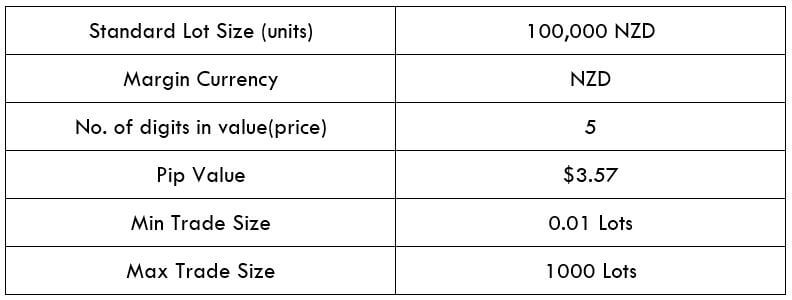
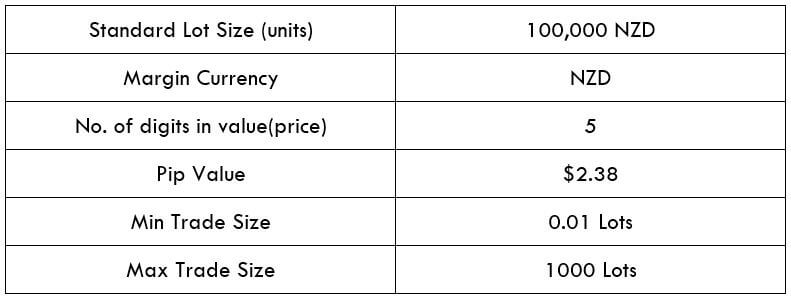
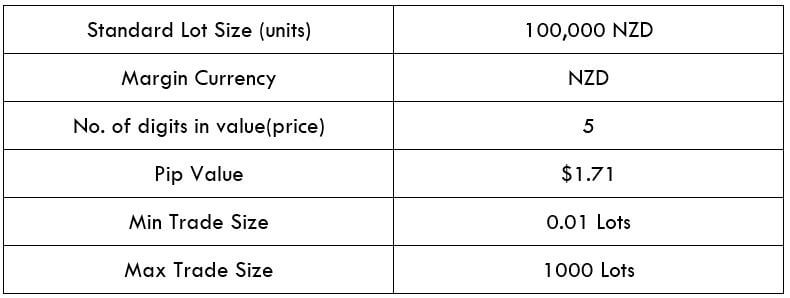
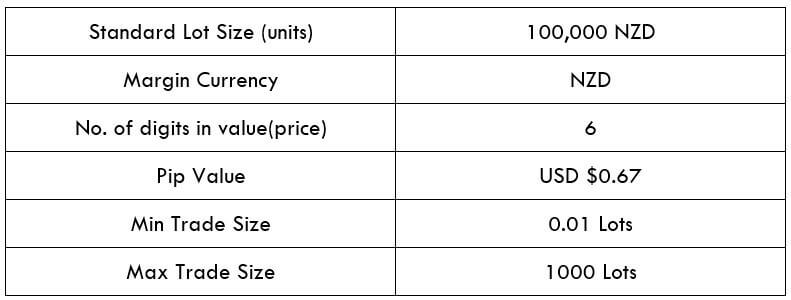
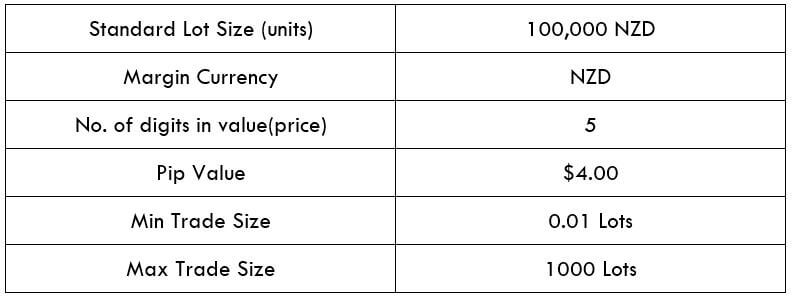
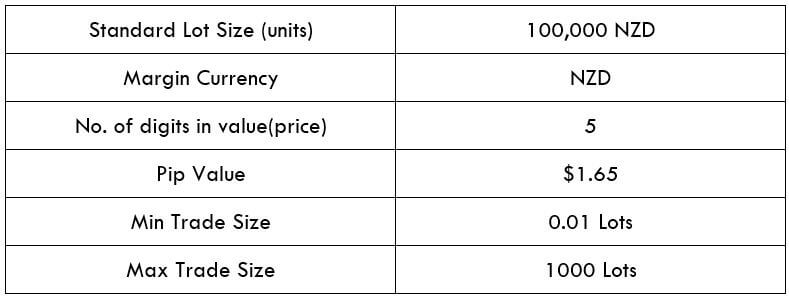
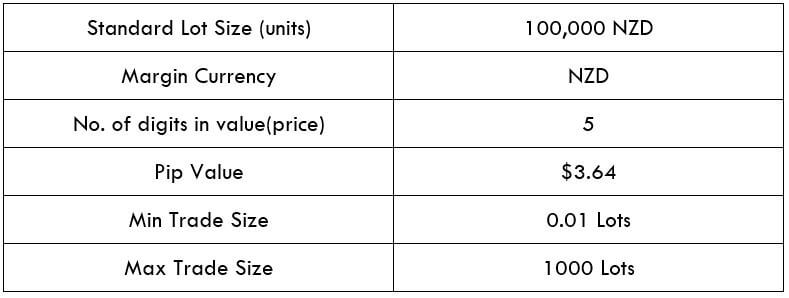
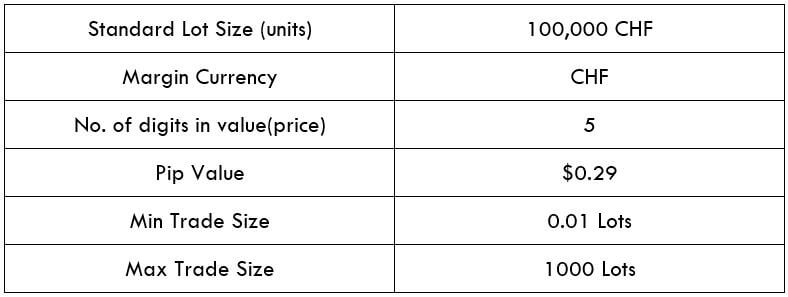
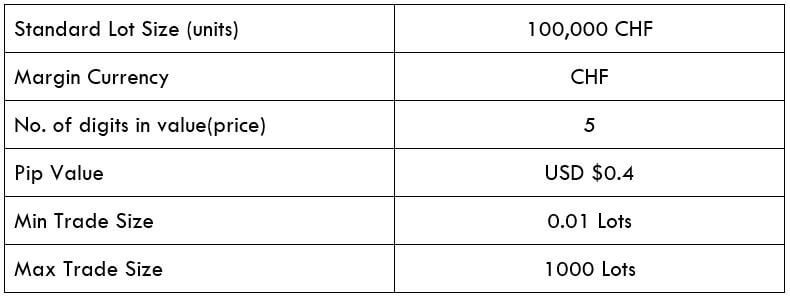
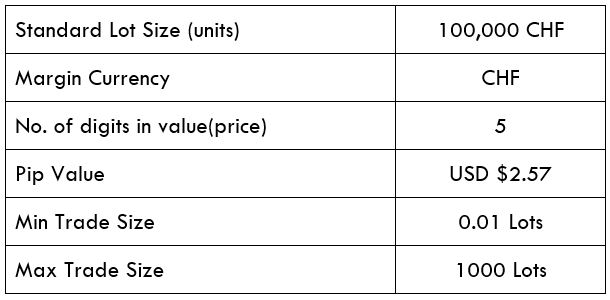
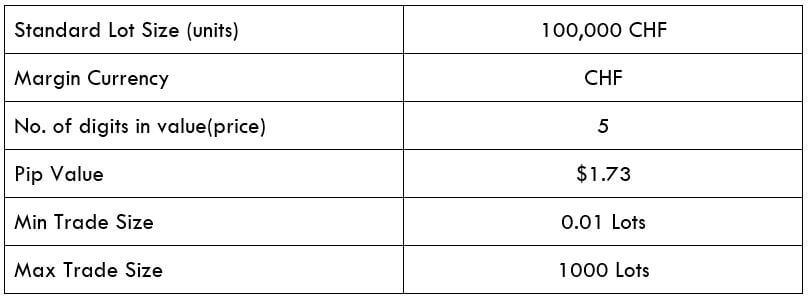
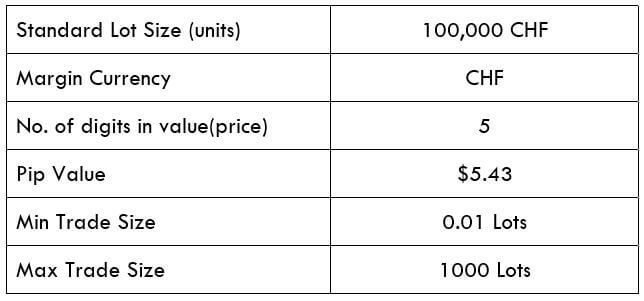
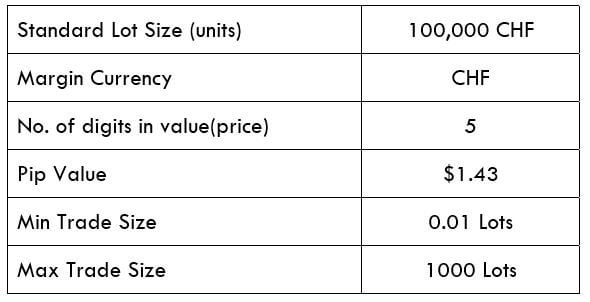
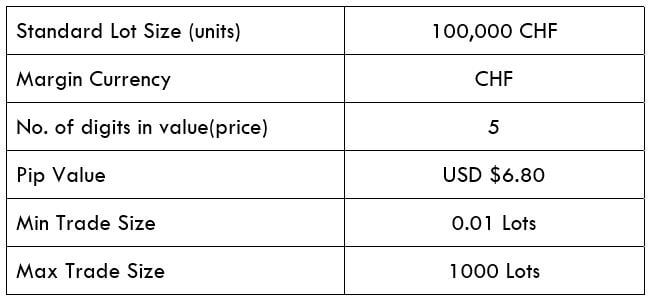
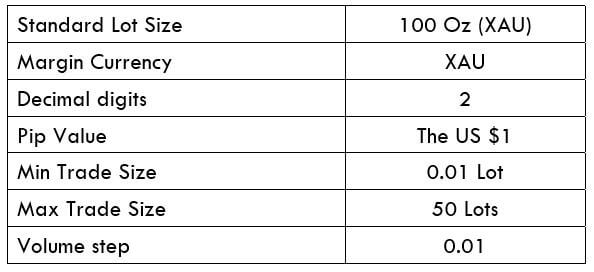
JPY/HUF Specification

Spread

If we want to determine the spread, we should subtract the Bid price and the Ask price. Spread is a trading charge that the broker takes as soon as we open a trade. This value changes with the change of the execution model.

Spread on ECN: 13 pips | Spread on STP: 18 pips

Fees

Every broker takes a trading fee from a trader. The process of taking the fee is almost the same as every broker in the world. Note that the fee is only applicable to ECN accounts.

Slippage

Slippage happens when the execution price and open trade price are not the same. The volatility and the broker’s execution speed are the main cause of slippage.

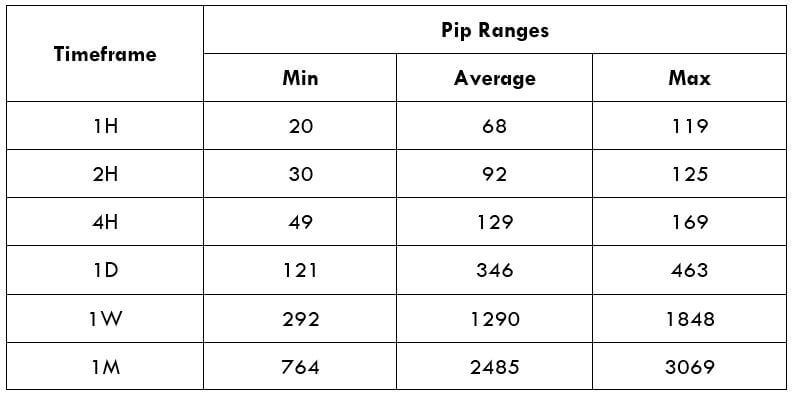
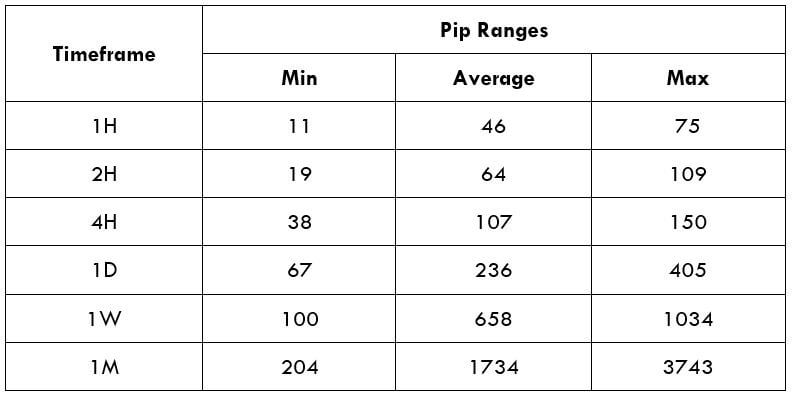
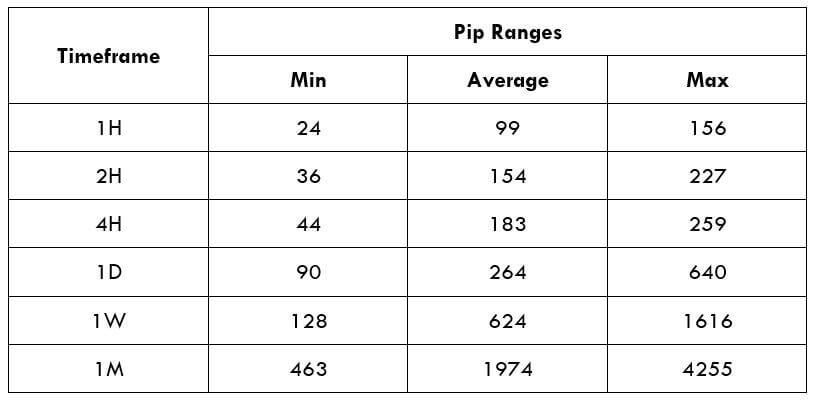
Trading Range in JPYHUF

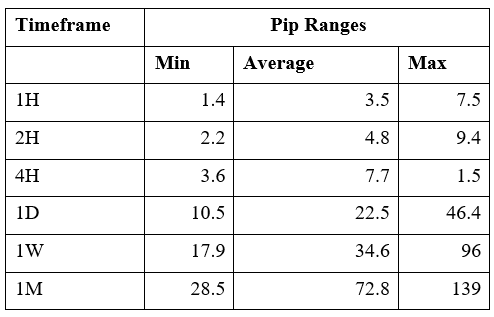
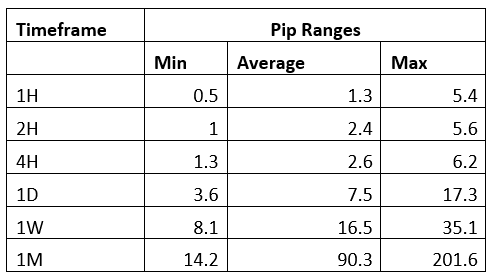
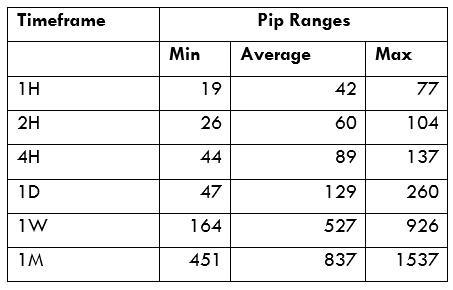
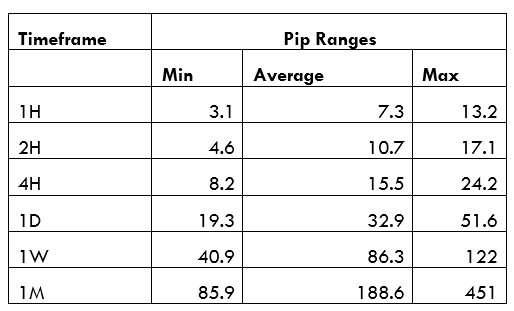
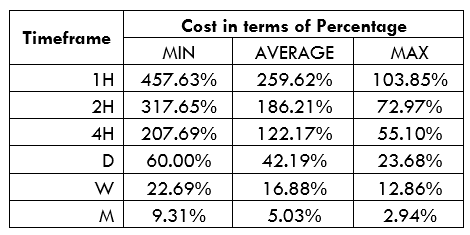
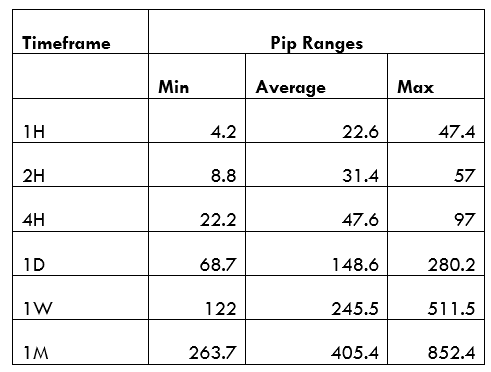
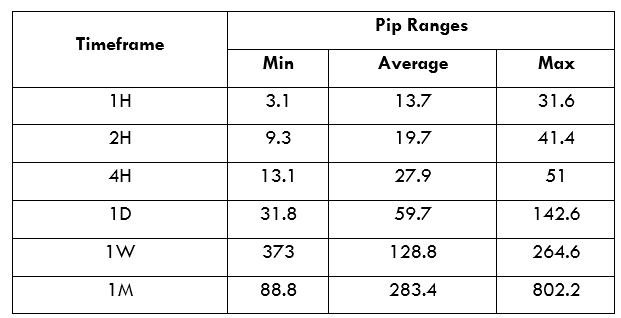
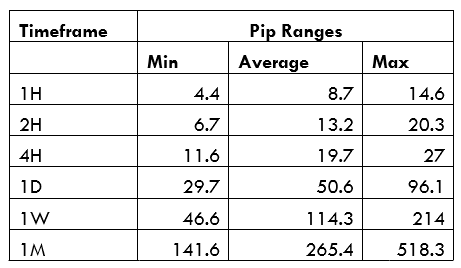
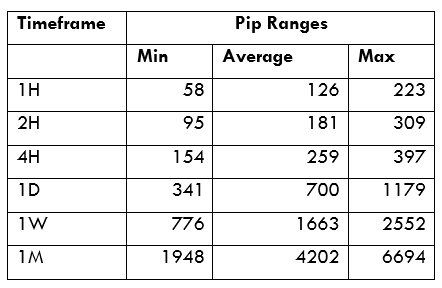
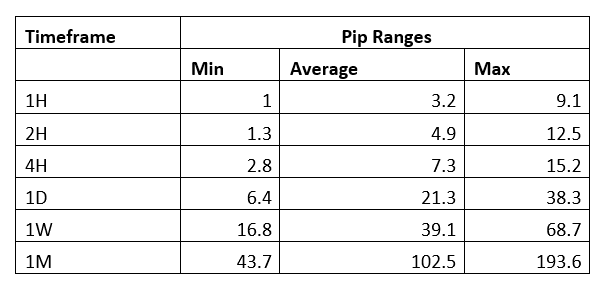
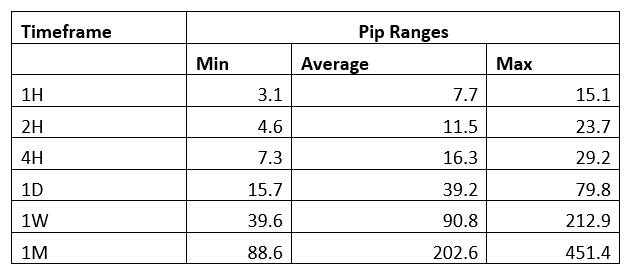
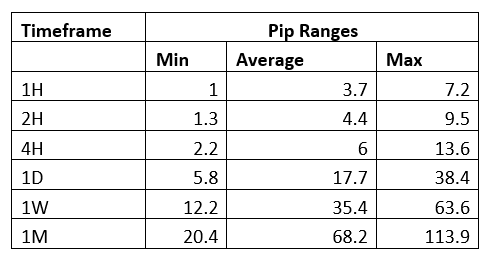
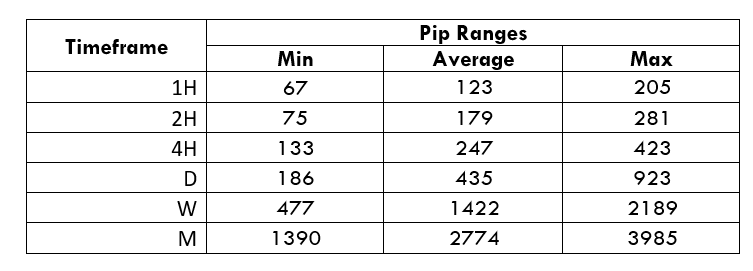
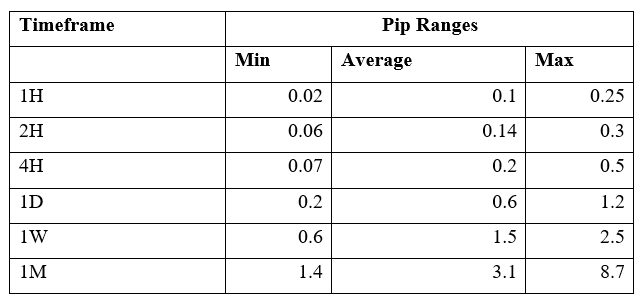
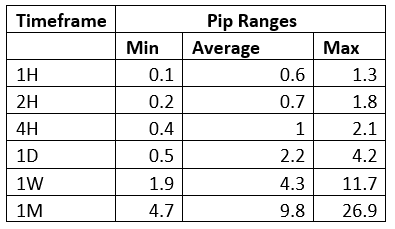
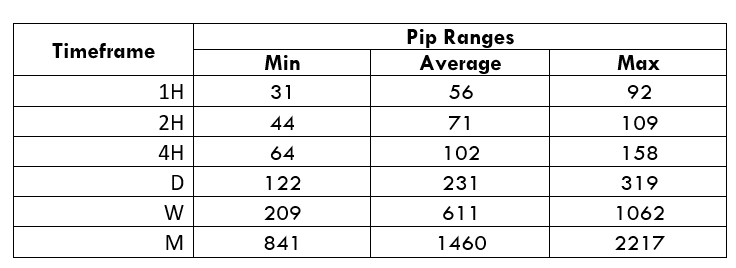
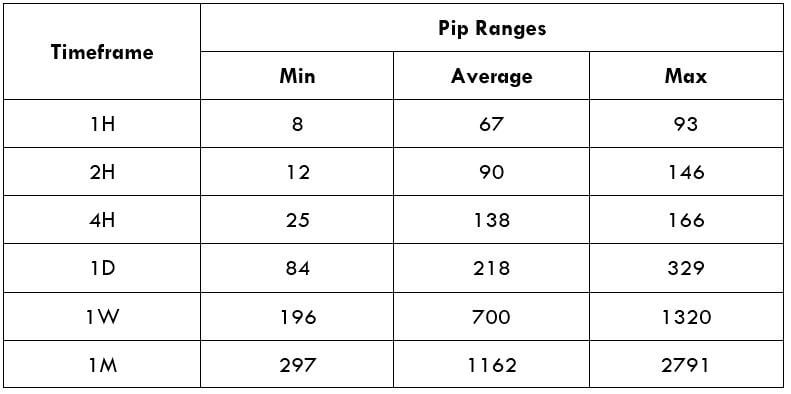
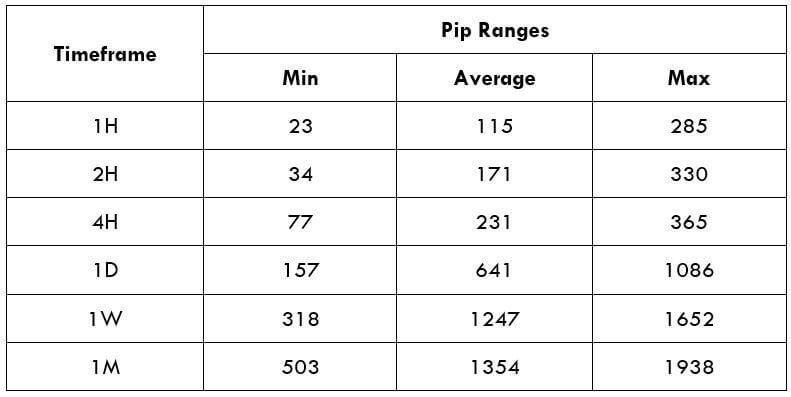
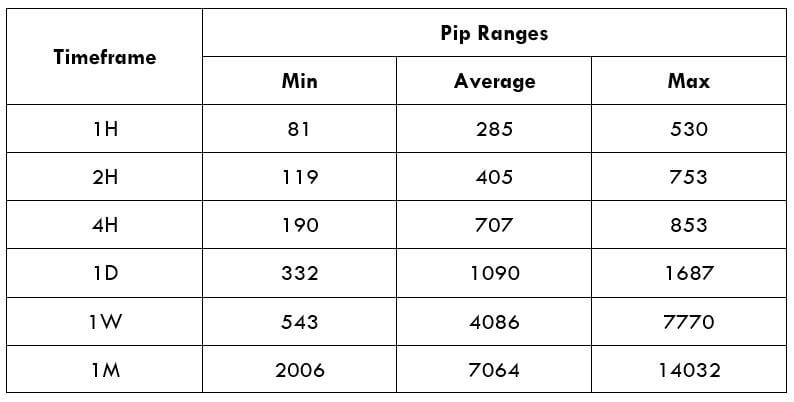
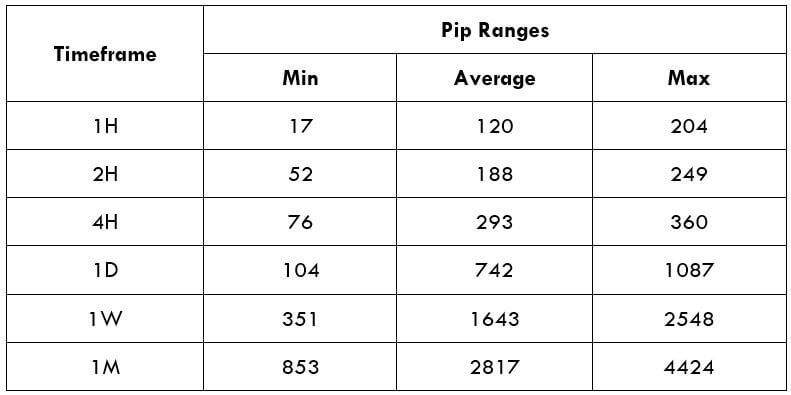
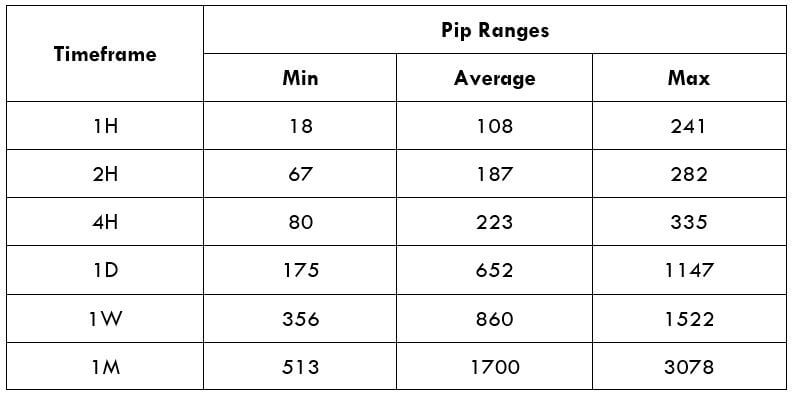
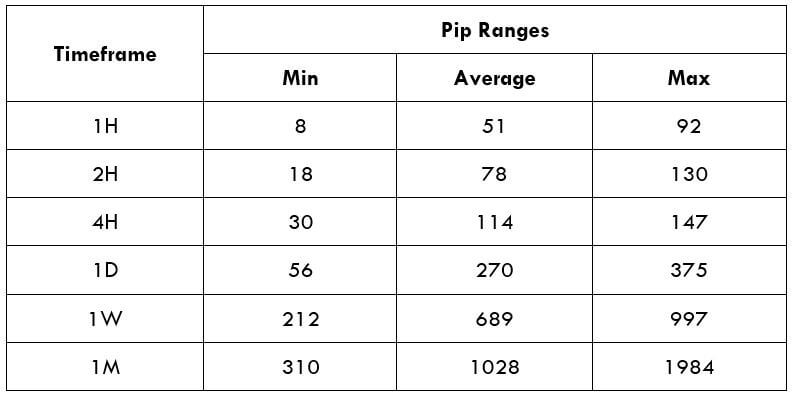
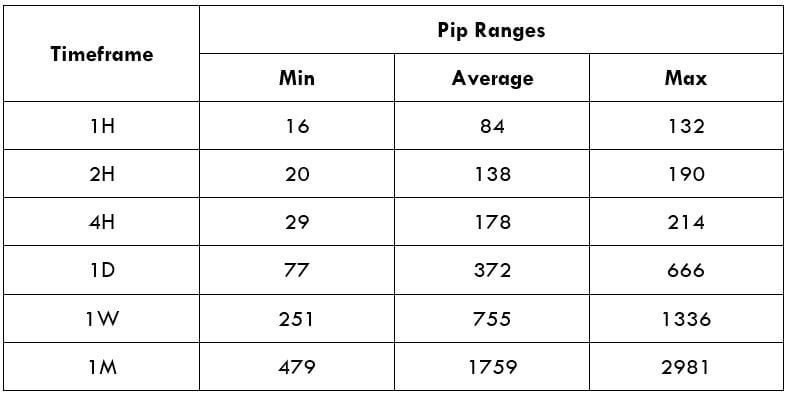
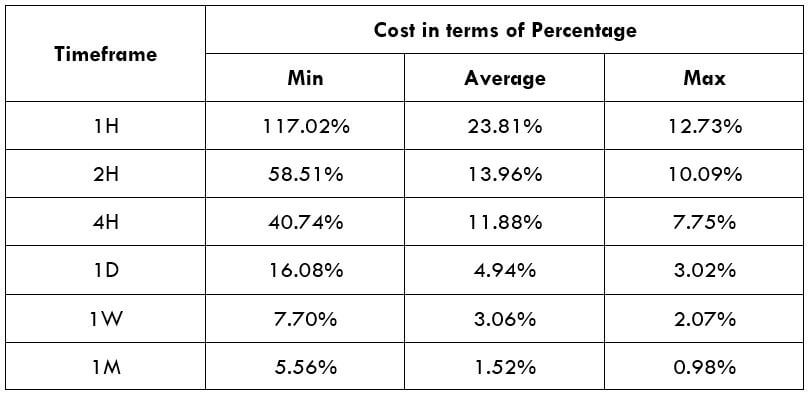
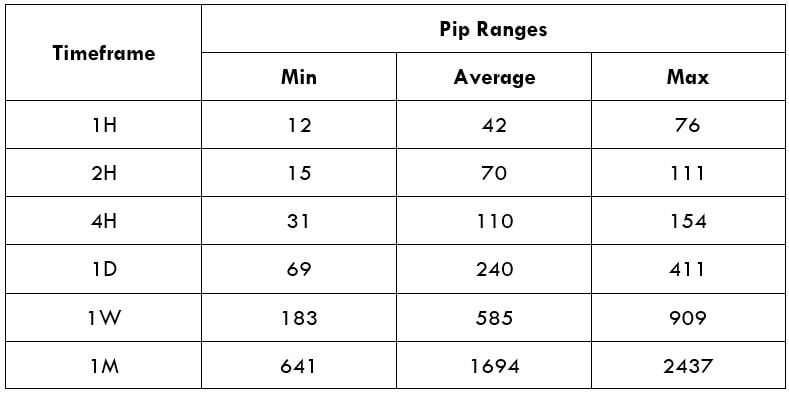
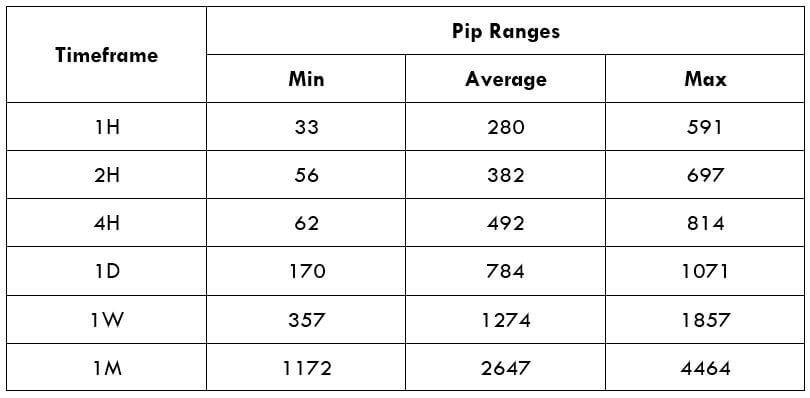
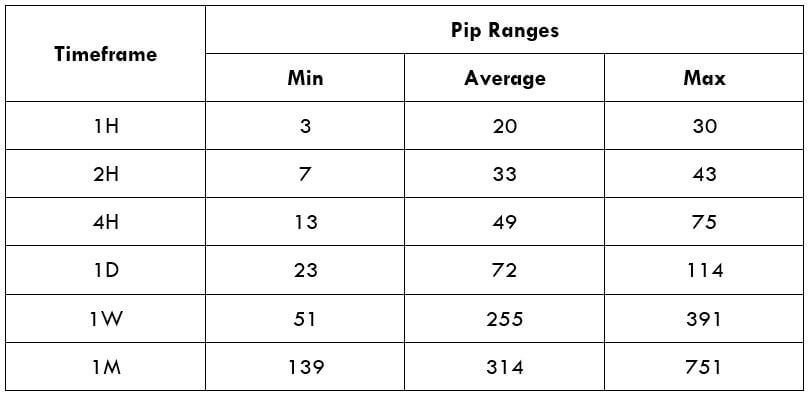
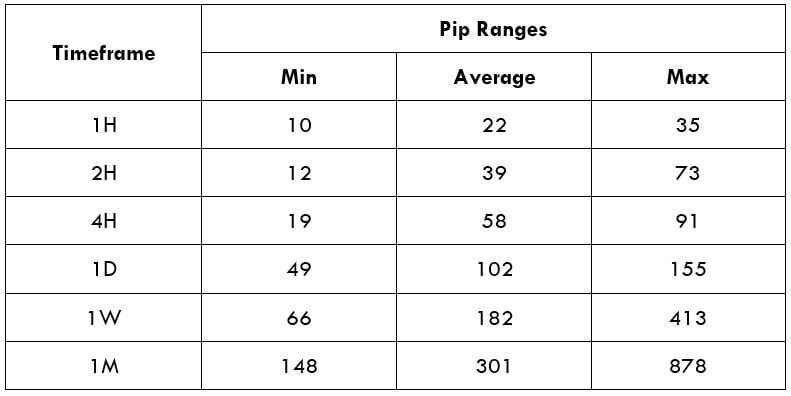
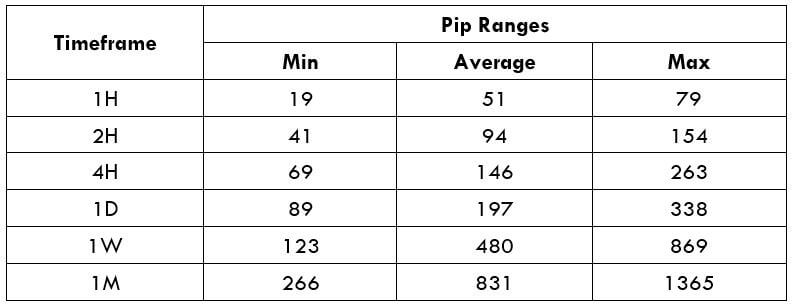
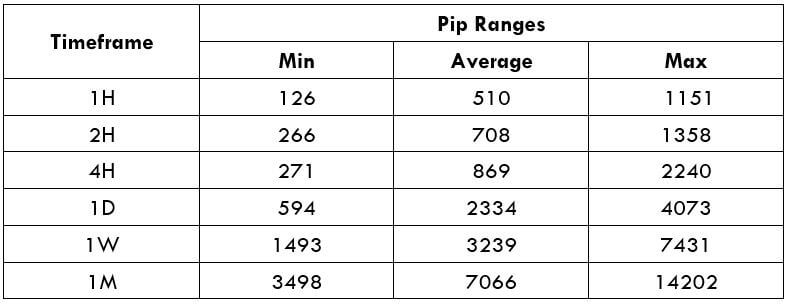
The trading range is the representation of the minimum, average, and maximum volatility of this pair on the 1H, 4H, 1D, 1W, and 1M timeframe. Using these values, we can assess our profit/loss margin of trade. Hence, this proves to be a helpful risk management tool for all types of traders.

Procedure to assess Pip Ranges

  1. Add the ATR indicator to your chart
  2. Set the period to 1
  3. Add a 200-period SMA to this indicator
  4. Shrink the chart so you can assess a large time period
  5. Select your desired timeframe
  6. Measure the floor level and set this value as the min
  7. Measure the level of the 200-period SMA and set this as the average
  8. Measure the peak levels and set this as Max.

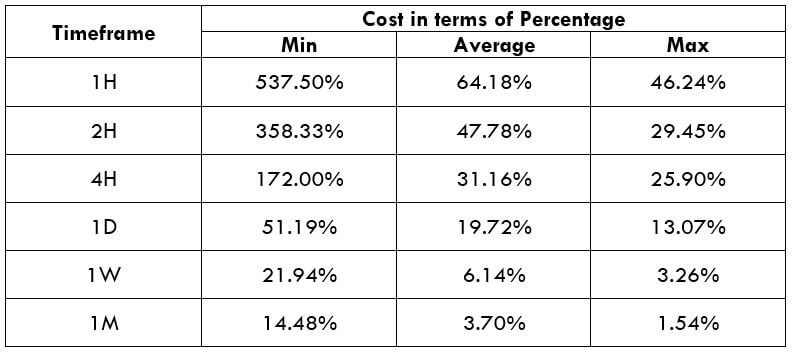
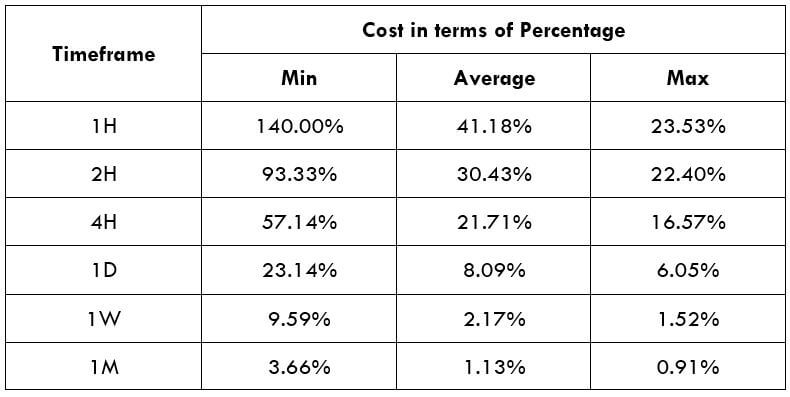
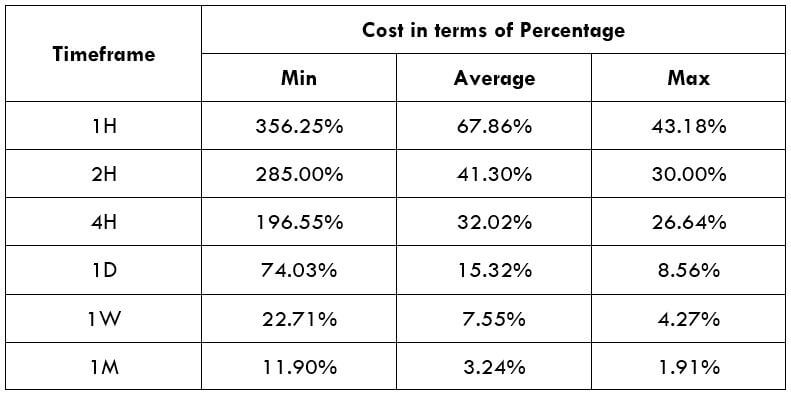
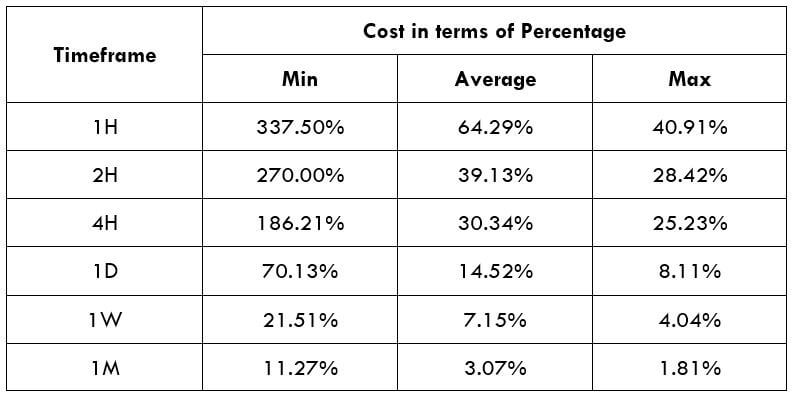
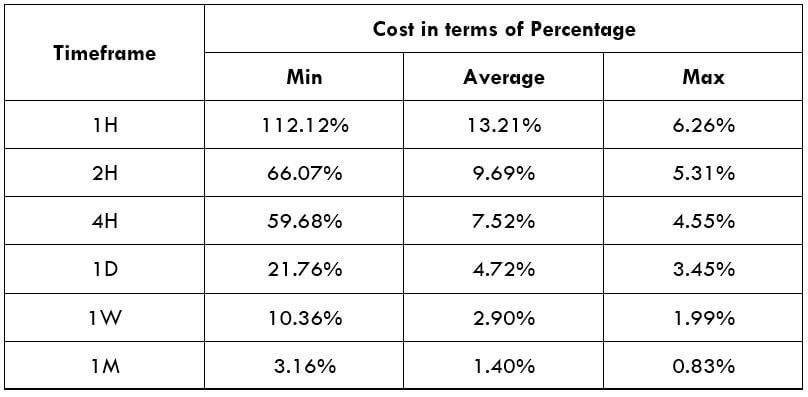
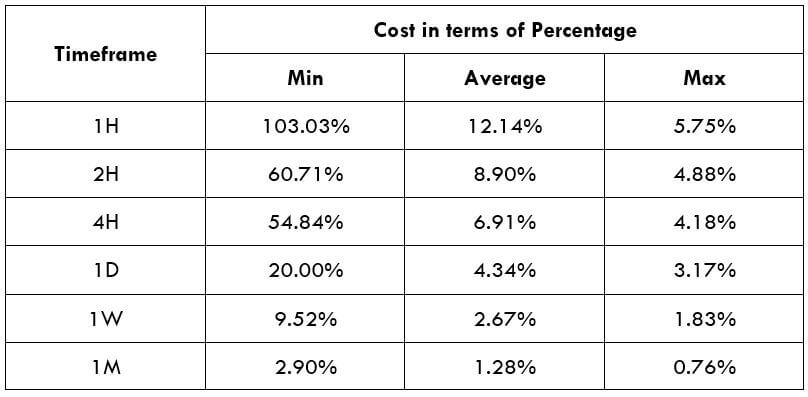
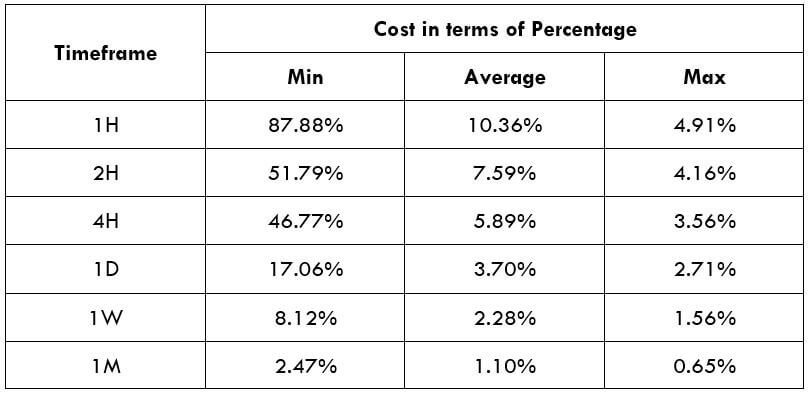
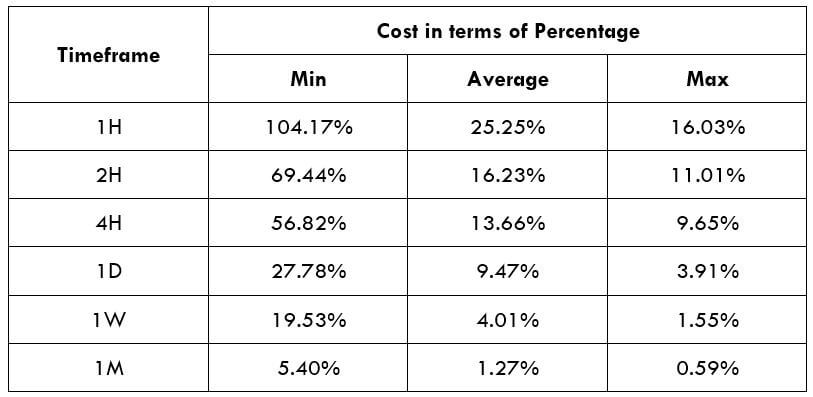
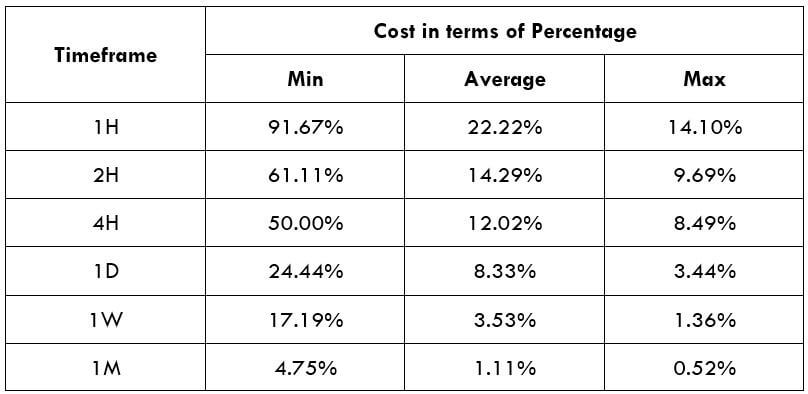
JPYHUF Cost as a Percent of the Trading Range

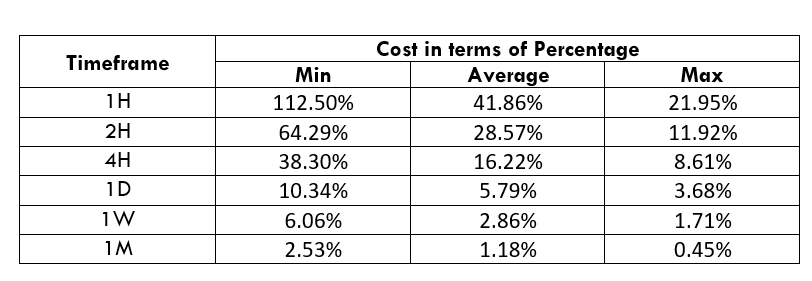
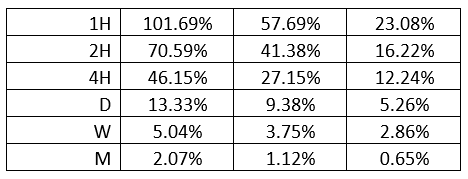
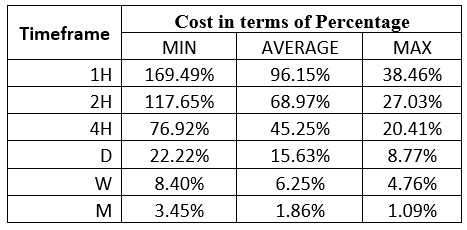
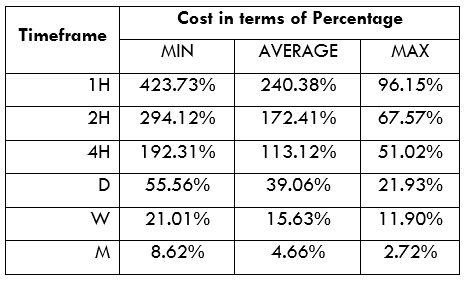
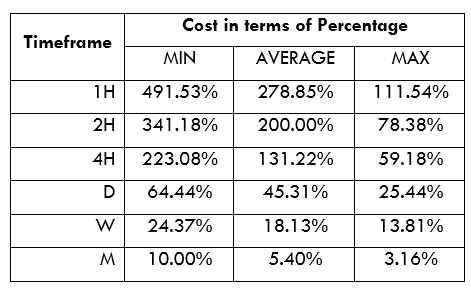
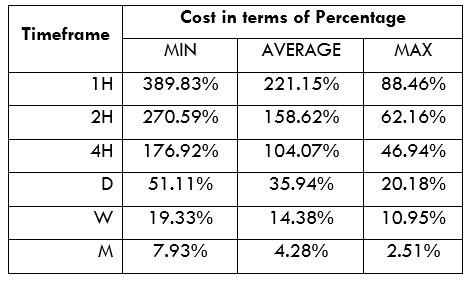
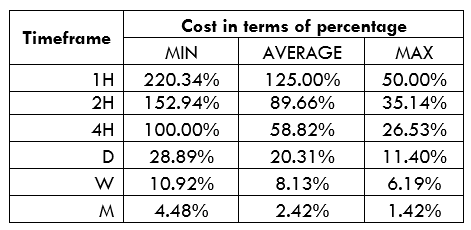
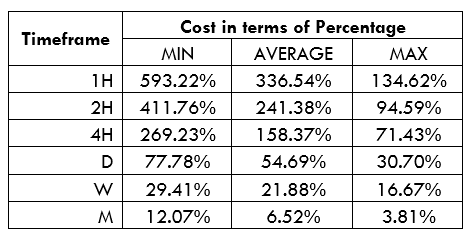
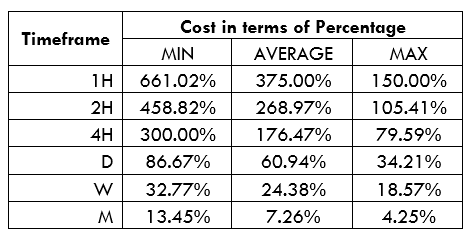
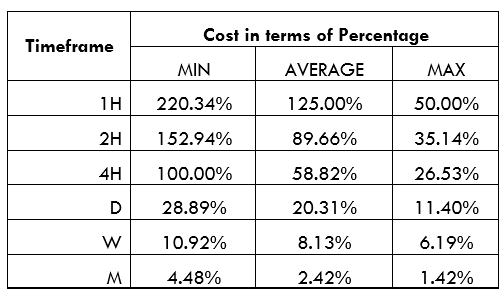
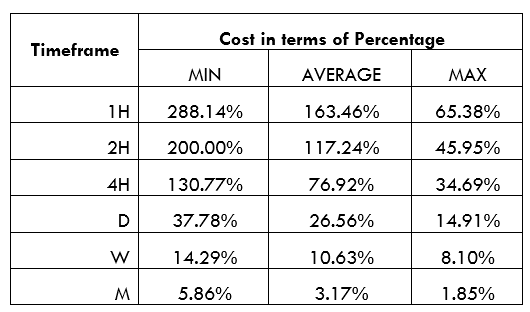
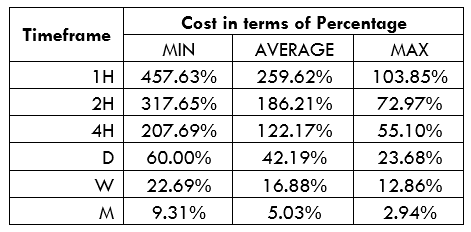
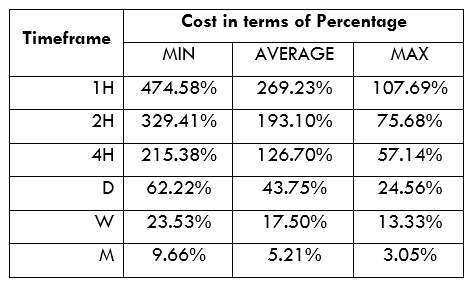
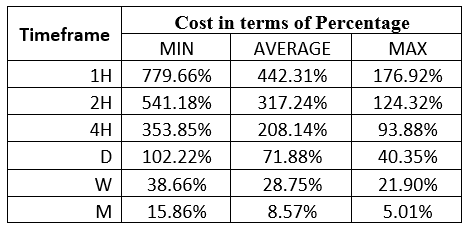
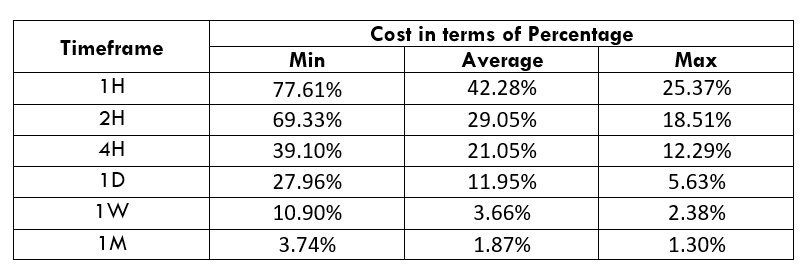
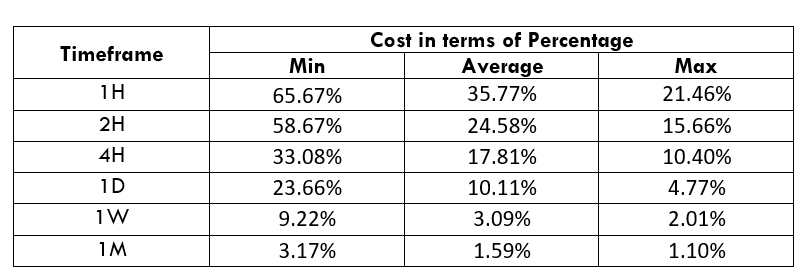
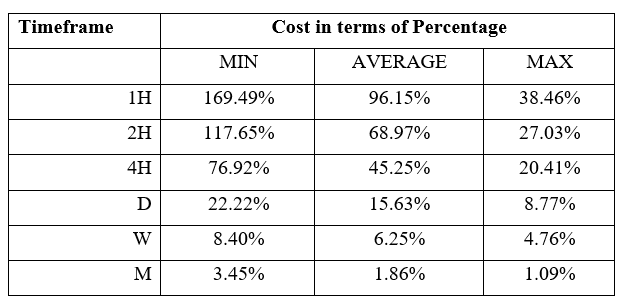
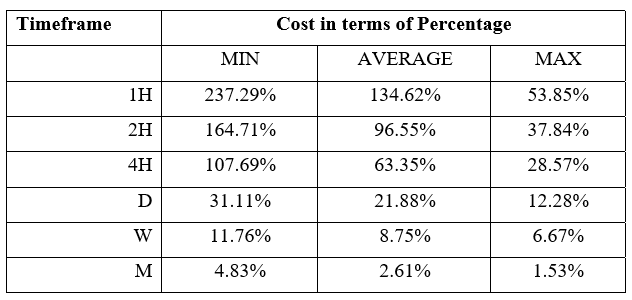
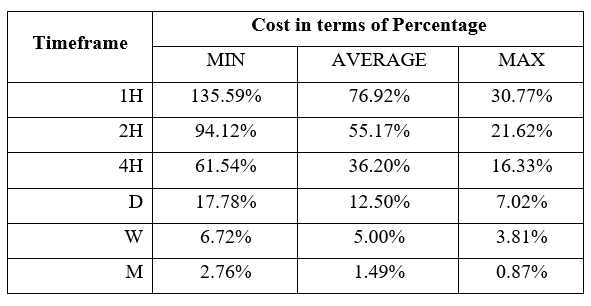
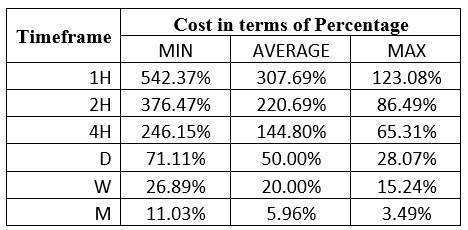
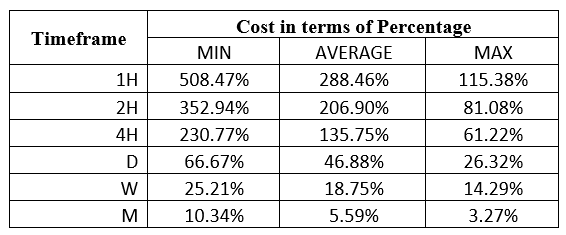
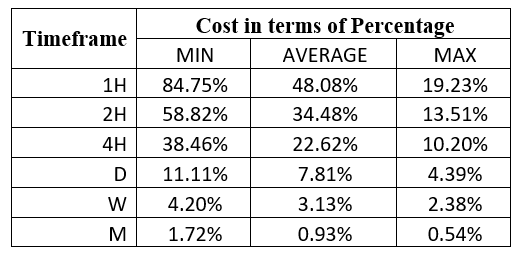
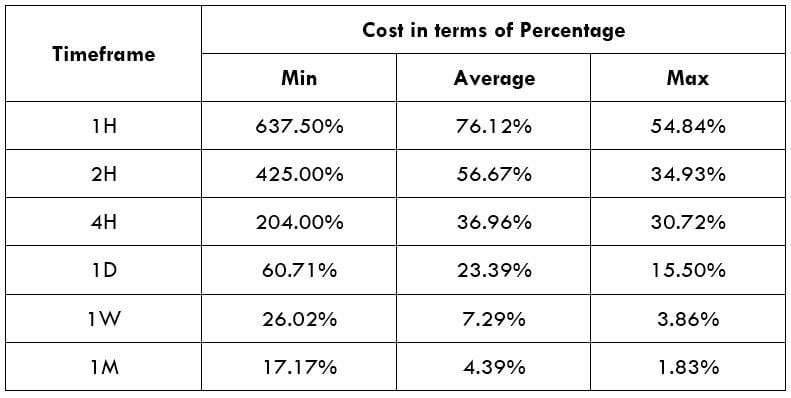
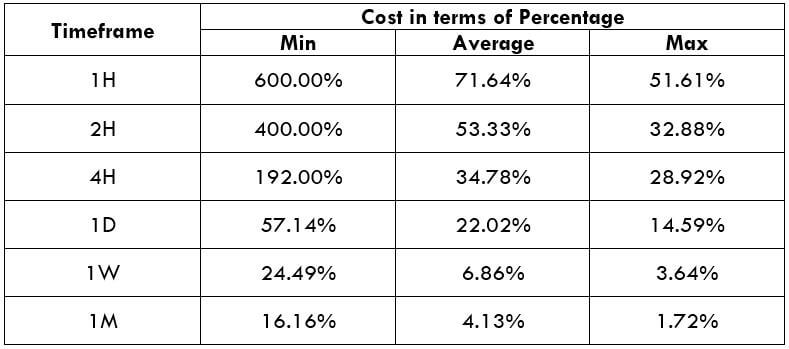
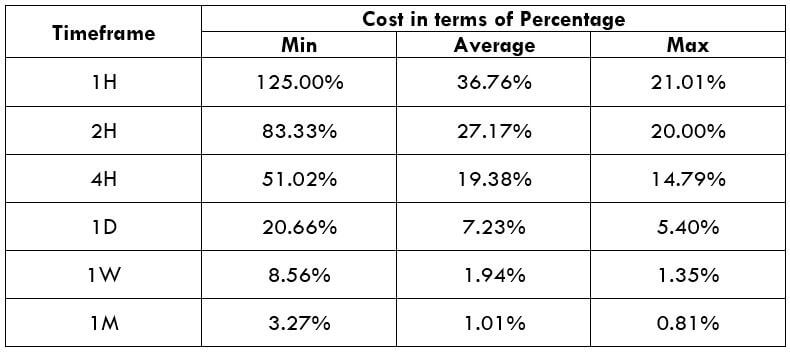
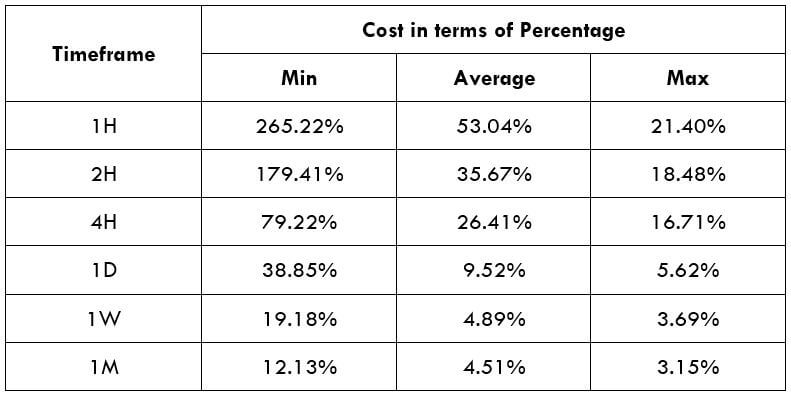
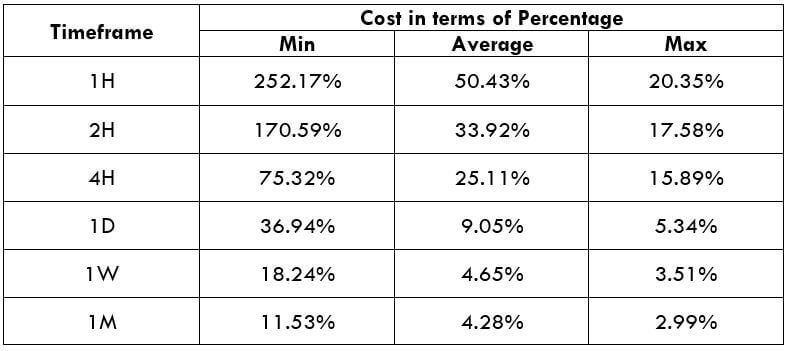
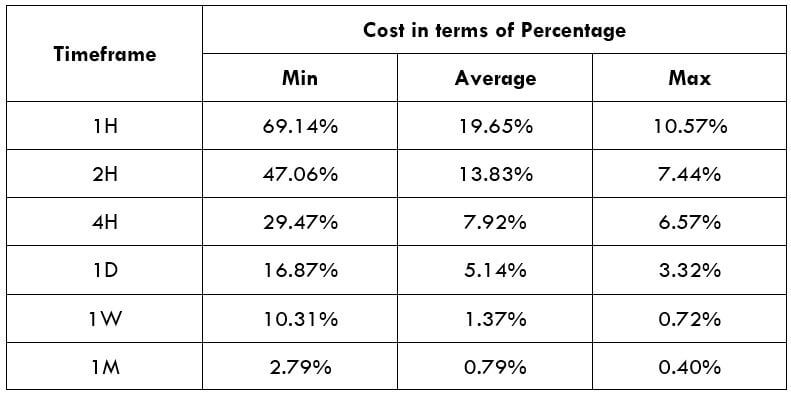
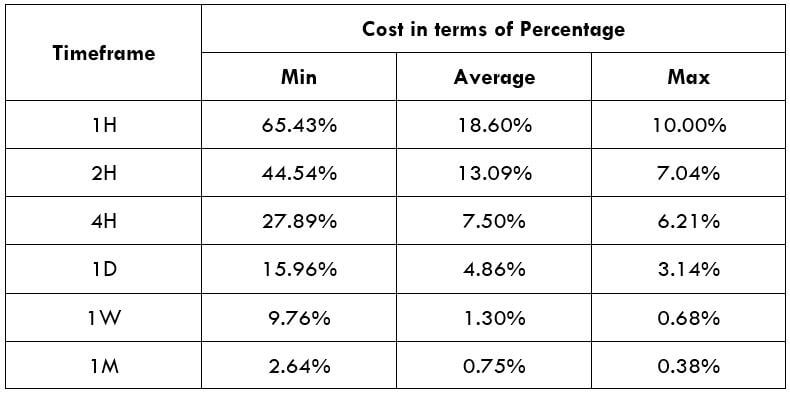
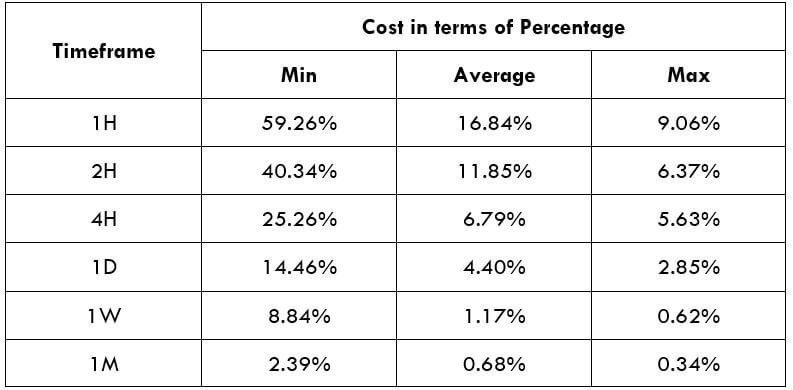
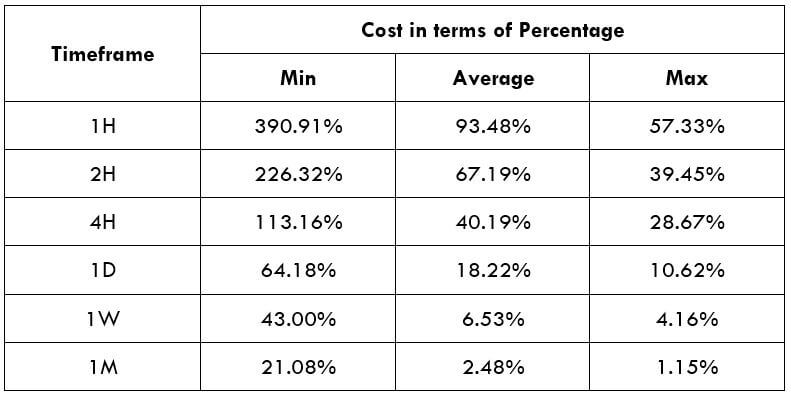
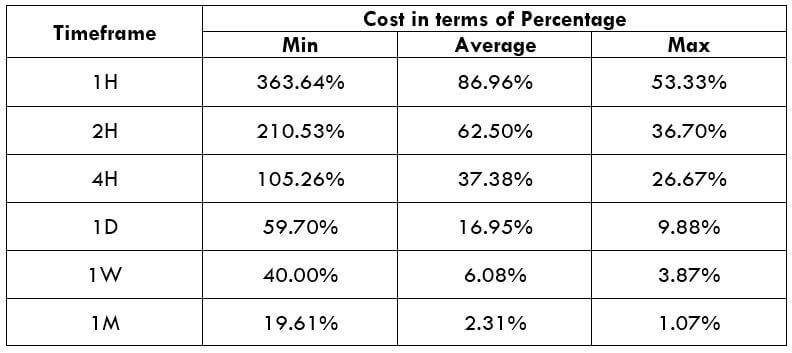
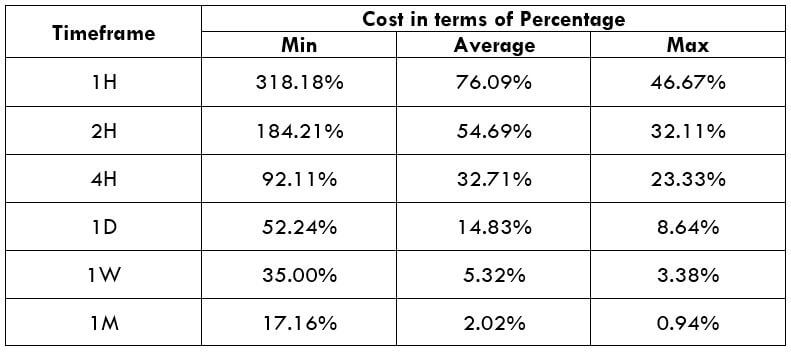
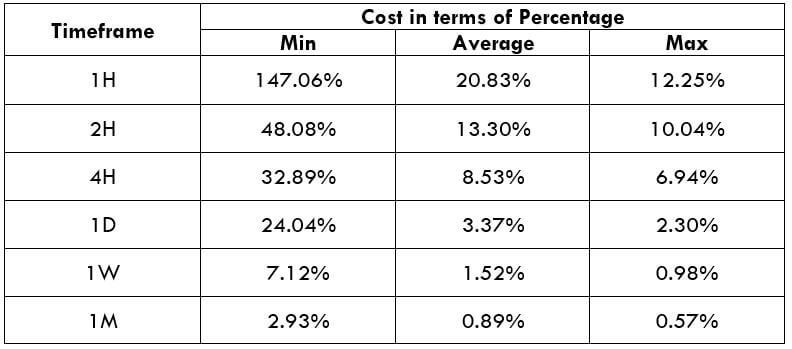
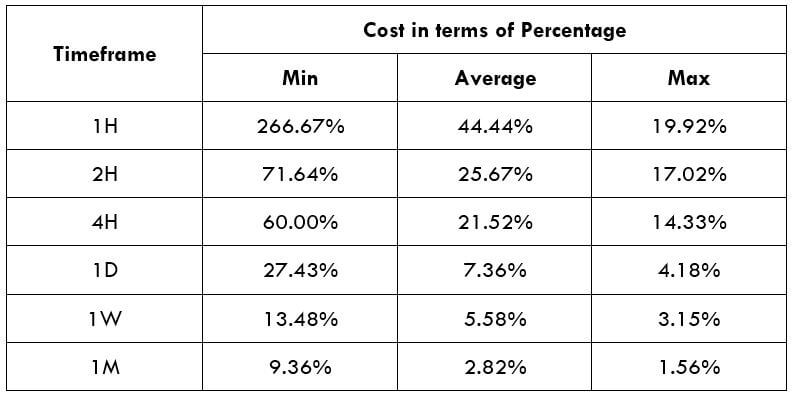
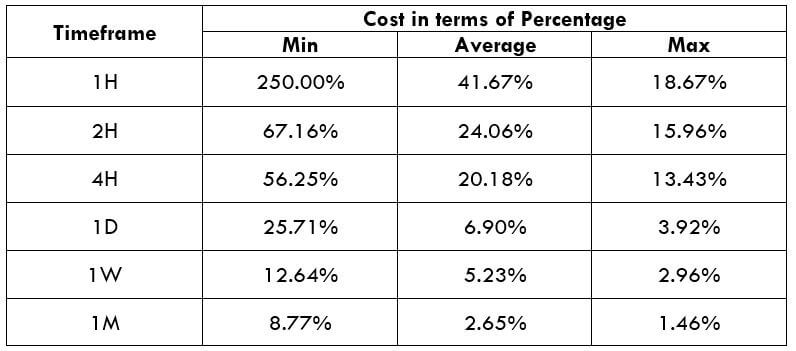
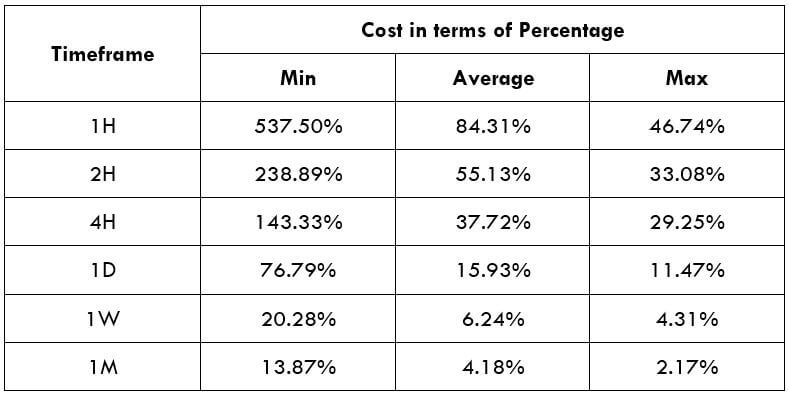
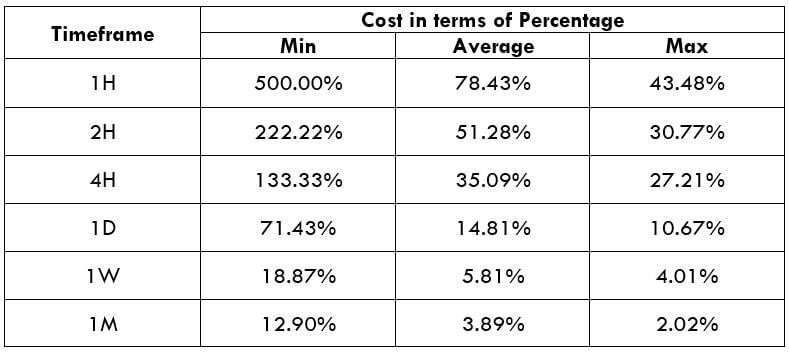
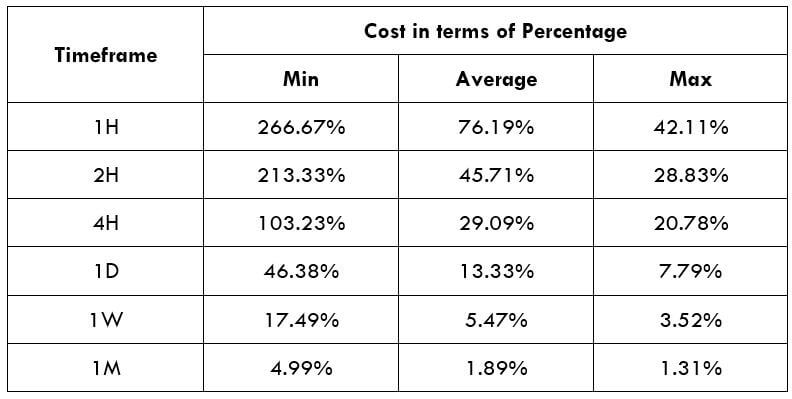
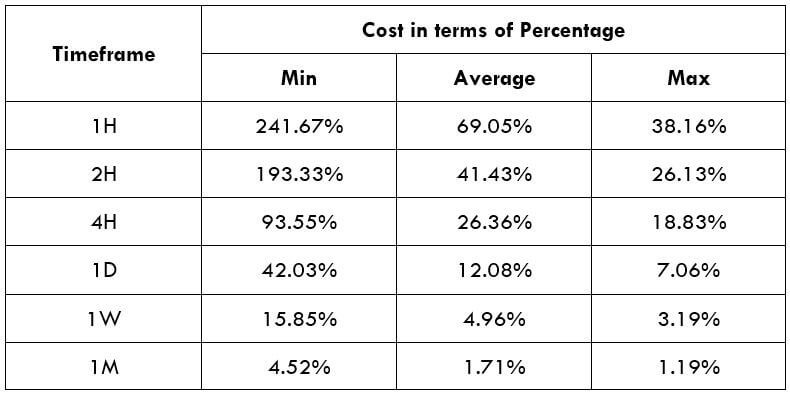
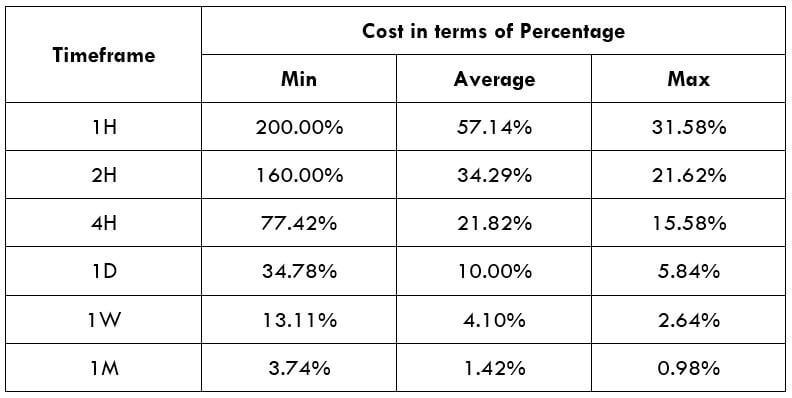
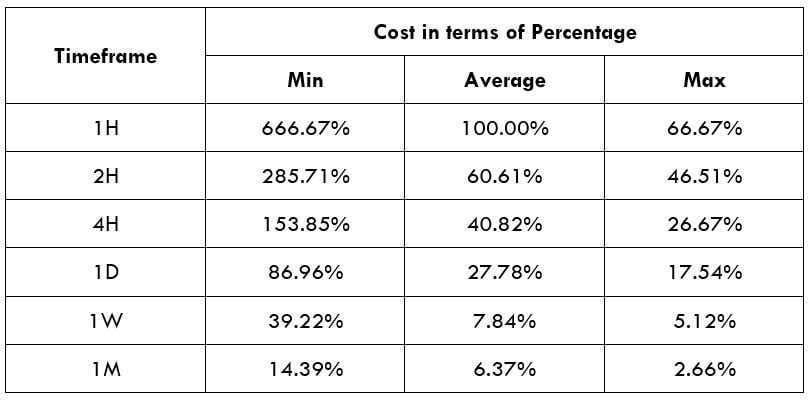
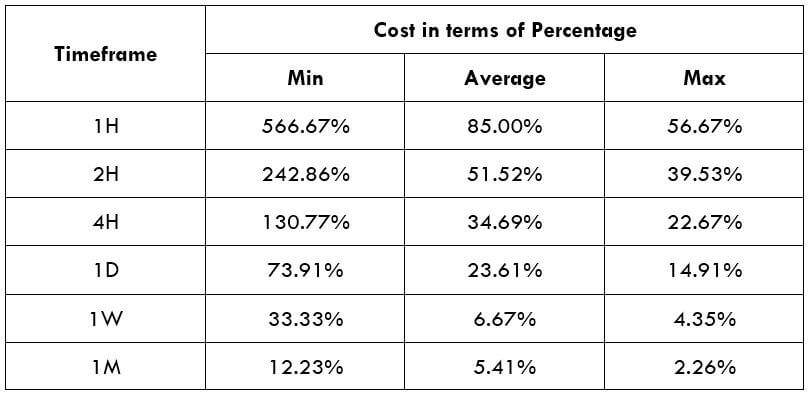
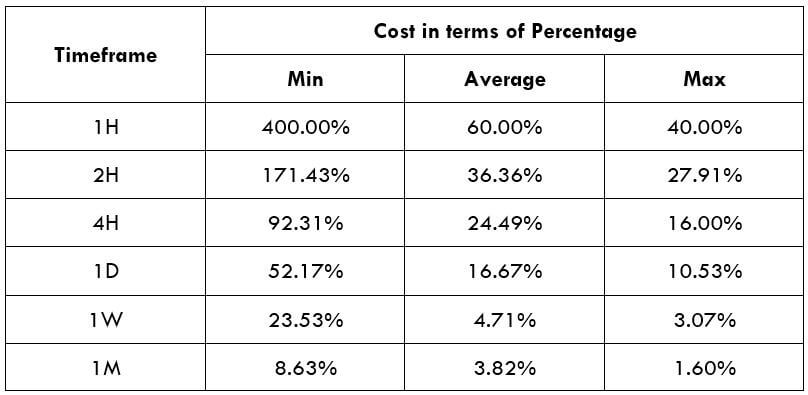
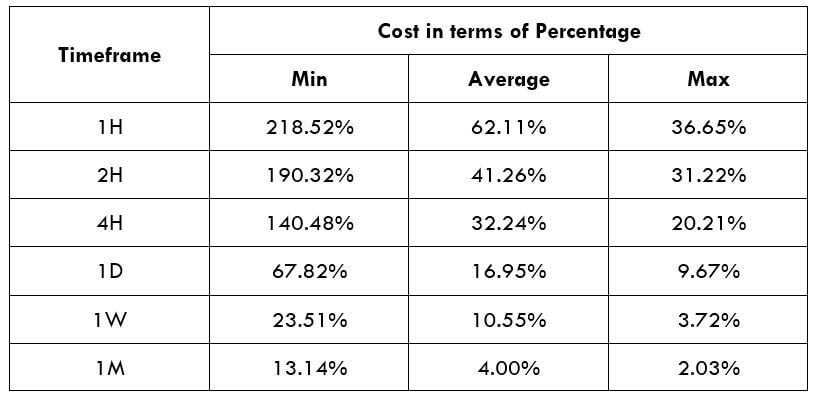
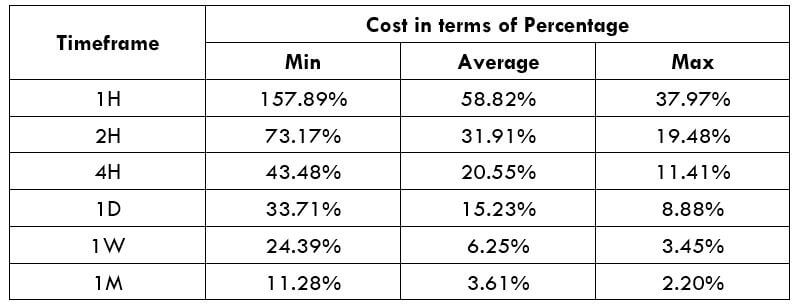
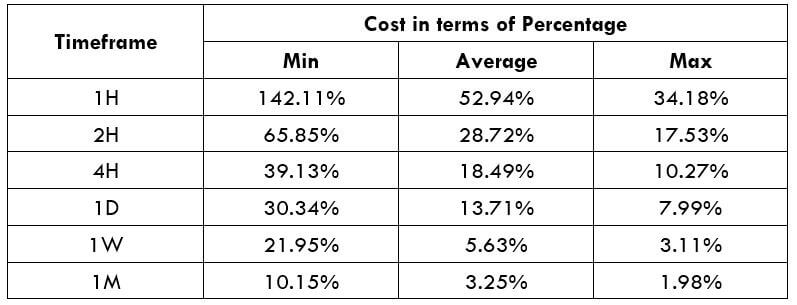
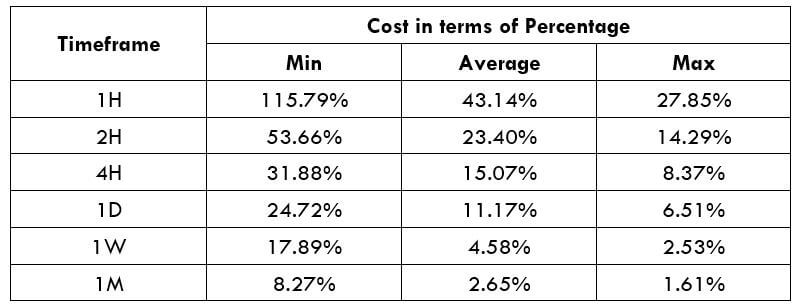
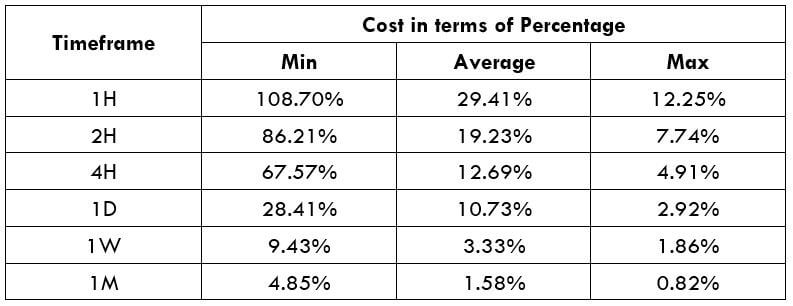
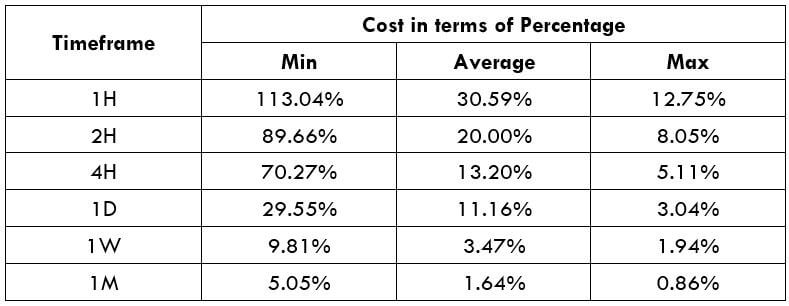
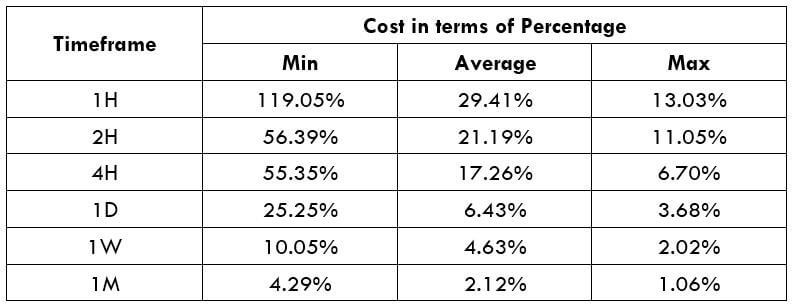
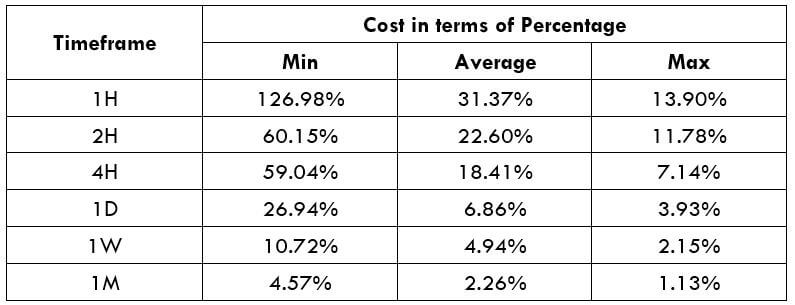
With the volatility values from the above table, we can determine the chance of cost with the change of volatility. We have got the ratio between total cost and the volatility values and converted them into percentages.

ECN Model Account 

Spread = 13 | Slippage = 5 | Trading fee = 8

Total cost = Spread + Slippage + Trading Fee

= 13 + 5 + 8

Total cost = 26

STP Model Account

Spread = 18 | Slippage = 5 | Trading fee = 0

Total cost = Spread + Slippage + Trading Fee

= 18 + 5 + 0

Total cost = 23 

The Ideal way to trade the JPYHUF

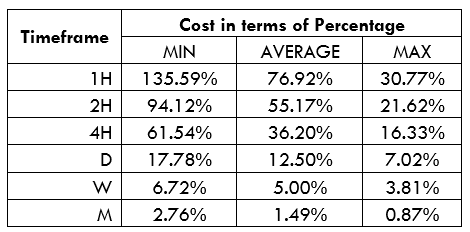
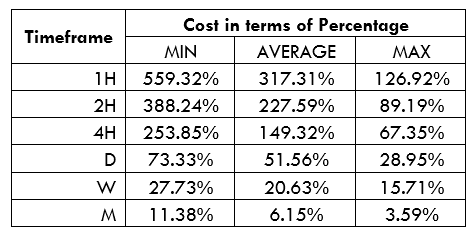
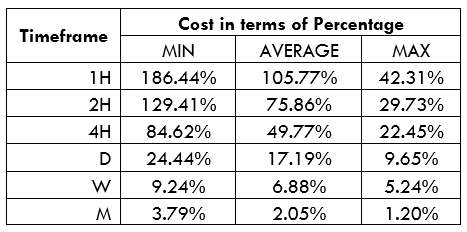
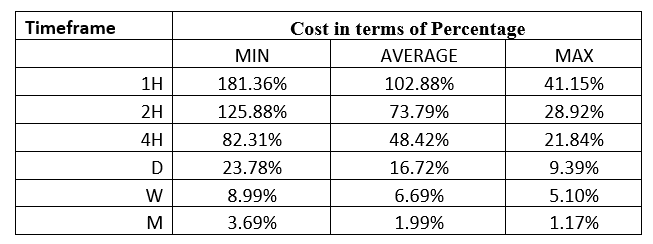
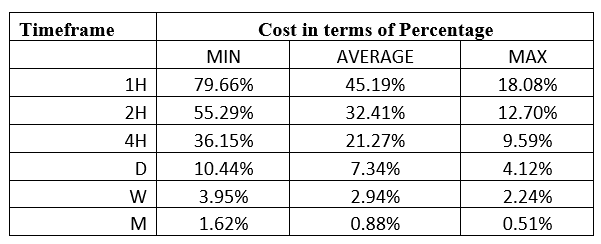
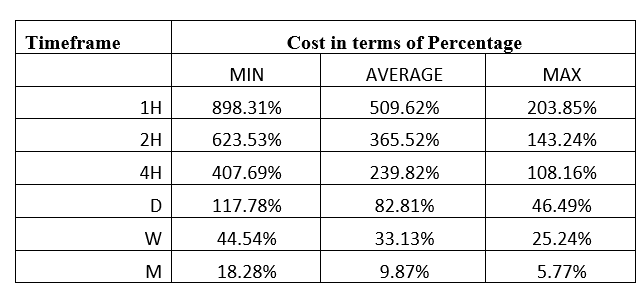
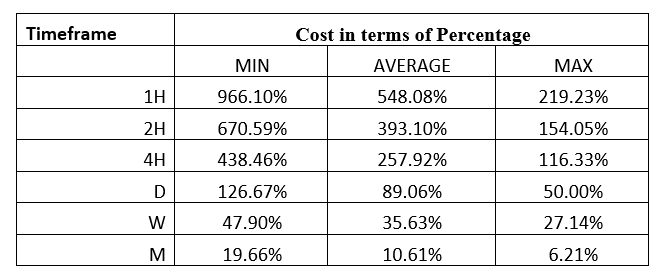
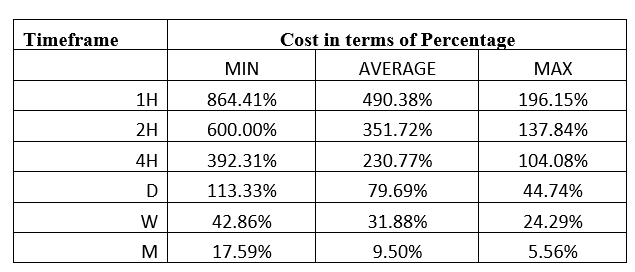
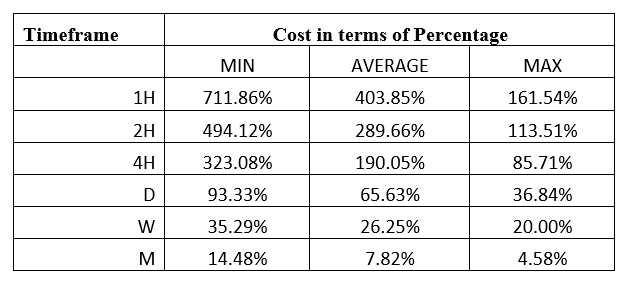
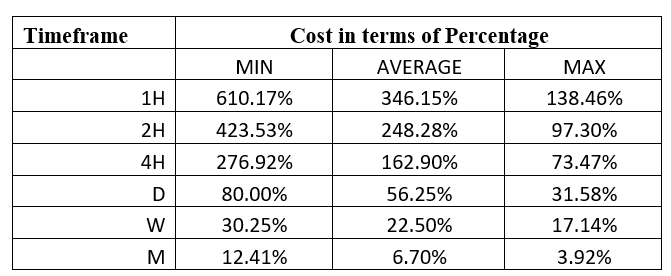
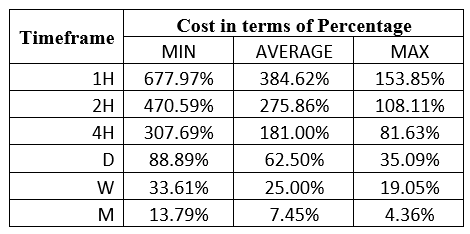
As per the above data, we can say that JPYHUF is not an extremely volatile pair. Therefore, traders from every level can trade with it and make money. The average cost per trade in the H1 timeframe is at 41.86%, which decreases to almost 1% in a monthly timeframe. As a trader, it is often hard to trade in a timeframe like weekly or monthly, as it is very time-consuming. Therefore, sticking to the hourly to daily timeframe is recommended for traders to minimize the trading cost.

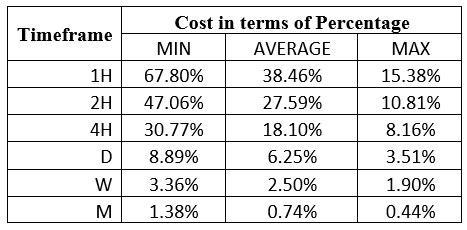
Another way to reduce the cost is to place orders as ‘limit’ and ‘stop’ instead of ‘market’ orders. In limit orders, slippage will not be in the calculation of the total costs. Therefore, in the below example, the total cost will be reduced by five pips.

Limit Model Account (STP Model Account)

Spread = 18 | Slippage = 0 | Trading fee = 0

Total cost = Spread + Slippage + Trading Fee

= 18 + 0 + 0

Total cost = 18

Categories
Forex Assets

Analysing The Costs Involved While Trading The AUD/MXN Exotic Pair

Introduction

In this exotic forex pair, the AUD represents the Australian dollar, while the MXN – the Mexican Peso. Exotic currency pairs have higher volatility in the forex market when compared to the other major pairs. Here, AUD is the base currency, where MXN is the quote currency. It means that the AUD/MXN exchange rate shows the amount that 1 AUD can buy in terms of MXN. Let’s say that the exchange rate for the AUD/MXN is 15.0346; it means that 1 AUD can be exchanged for 15.0346 MXN.

AUD/HUF Specification

Spread

When you go long in the forex market, you buy the currency pair from your broker at a higher price than when you sell it. The spread in forex is the difference between these two. The spread for the AUD/MXN pair is – ECN: 2 pips | STP: 7 pips

Fees

Some forex brokers charge a commission for every trade on ECN type accounts, depending on the value of the trade. STP accounts do not incur any trading fees.

Slippage

Sometimes when you place a market order, your broker will fill it in with a different price. This is slippage in forex trading; it is caused by increased volatility and the speed at which your broker executes the trade.

Trading Range in the AUD/MXN Pair

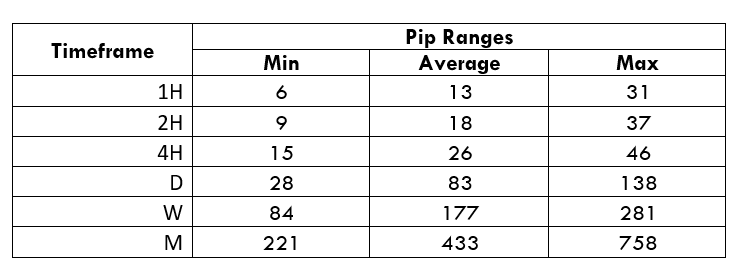
The trading range analyzes the spread between the highest and the lowest price movements across multiple timeframes. The trading range analysis ranges from the minimum, average, to the maximum volatility across all timeframes. It is used to assess the potential profitability of a currency pair across all timeframes.

The Procedure to assess Pip Ranges

  1. Add the ATR indicator to your chart
  2. Set the period to 1
  3. Add a 200-period SMA to this indicator
  4. Shrink the chart so you can determine a larger period
  5. Select your desired timeframe
  6. Measure the floor level and set this value as the min
  7. Measure the level of the 200-period SMA and set this as the average
  8. Measure the peak levels and set this as Max.

AUD/MXN Cost as a Percentage of the Trading Range

Further analysis of profitability can be aided by analyzing the percentage of the total cost to the volatility. These costs are put in terms of percentages of the volatility on all timeframes.

ECN Model Account costs

Spread = 2 | Slippage = 2 | Trading fee = 1 | Total cost = 5

STP Model Account

Spread = 7 | Slippage = 2 | Trading fee = 0 | Total cost = 9

The Ideal Timeframe to Trade  AUD/MXN Pair

For the AUD/MXN pair, the ideal trading timeframe appears to be the longer timeframes since trading costs are at their lowest here. We notice that the trading costs for the AUD/MXN pair decrease as the timeframes become longer. Also, note that at longer timeframes, the volatility is higher.

For traders wishing to trade the AUD/MXN pair for the shorter-term, timing their trades with when the volatility increases towards the maximum can help. More so, adopting the use of forex limit orders will lower the trading costs by ensuring there are no slippages.

ECN Account Using Limit Model Account

Total cost = Slippage + Spread + Trading fee = 0 + 2 + 1 = 3

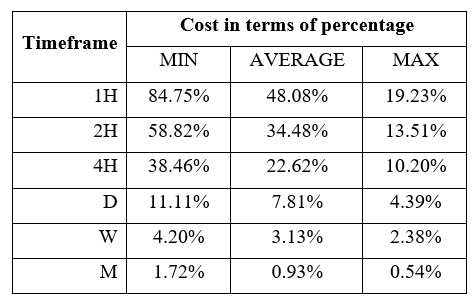
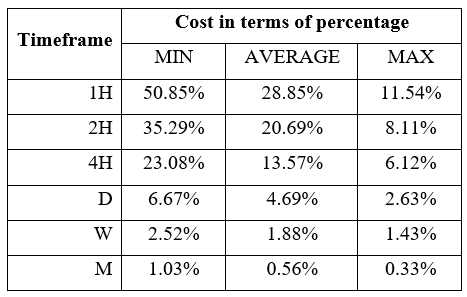
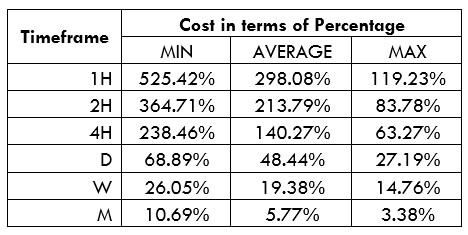
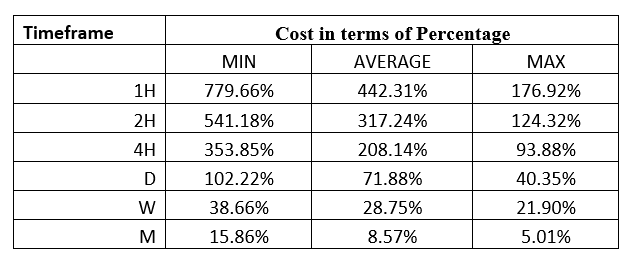
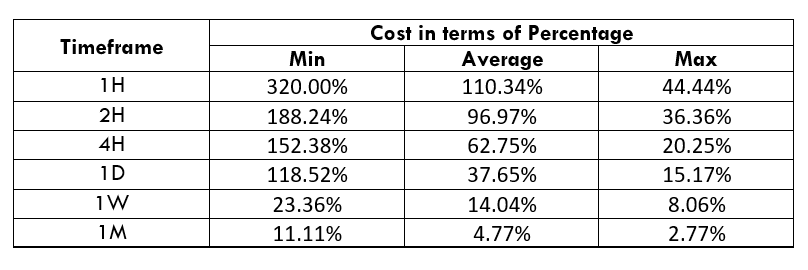
Notice how using the forex limit order types reduces the overall trading costs across all timeframes. The maximum trading cost of the AUD/MXN pair, for instance, decreased from 84.75% of the trading range to 50.85%.

Categories
Forex Assets

Trading The AUD/TRY Forex Exotic Currency Pair and Analysing The Costs Involved

Introduction

AUD/TRY is an exotic currency pair in the forex market. The AUD is the short form of the Australian Dollar and the TRY for Turkish Lira. Forex traders interested in such exotic pairs should be aware that trading them comes with high volatility compared to trading major forex pairs. In this exotic currency pair, the AUD is the base currency, while the TRY is the quote currency. Thus, the AUD/TRY price represents the amount of TRY that 1 AUD can buy. For instance, if the AUD/TRY pair’s price is 5.8362, it means that 1 AUD can buy 5.8362 TRY.

AUD/TRY Specification

Spread

In the forex market, your broker sells a currency pair to you at a higher price and buys it from you at a lower price. The value difference between these two prices is the spread. It is the primary way in which forex brokers earn their revenue.

The spread for the AUD/TRY pair is – ECN: 3 pips | STP: 8 pips

Fees

Forex traders with ECN account normally pay a trading fee to their broker whenever they open a position. This commission depends on the size of the trade, and not all forex brokers levy it. STP accounts do not have commissions.

Slippage

In forex trading, slippage refers to the price you expect your market order to be filled at and the price at which it is executed. The difference is a result of delays by your forex broker or high volatility.

Trading Range in the AUD/TRY Pair

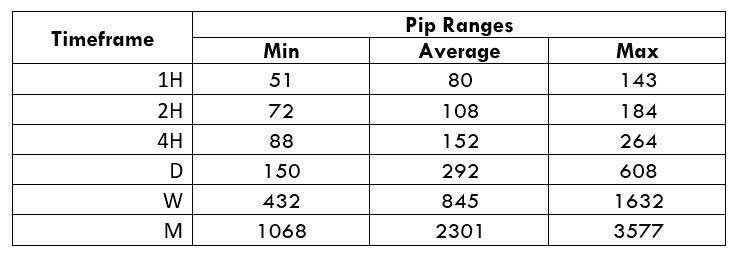
The trading range refers to the analysis of the price fluctuation of a currency pair across various timeframes. The trading range shows the volatility in pips for a currency pair throughout the trading period ranging from minimum to maximum.

The Procedure to assess Pip Ranges

  1. Add the ATR indicator to your chart
  2. Set the period to 1
  3. Add a 200-period SMA to this indicator
  4. Shrink the chart so you can determine a larger period
  5. Select your desired timeframe
  6. Measure the floor level and set this value as the min
  7. Measure the level of the 200-period SMA and set this as the average
  8. Measure the peak levels and set this as Max.

AUD/TRY Cost as a Percentage of the Trading Range

After determining the trading range, we can then determine the trading costs associated with these trading ranges. The total trading cost is expressed as a percentage of the pip volatility. Here are the trading costs for the AUD/TRY pair on both ECN and STP accounts.

ECN Model Account costs

Spread = 3 | Slippage = 2 | Trading fee = 1

Total cost = 6

STP Model Account

Spread = 8 | Slippage = 2 | Trading fee = 0

Total cost = 10

The Ideal Timeframe to Trade  AUD/TRY Pair

From these analyses, we have established that longer timeframes have lower trading costs while the shorter timeframes attract higher trading costs. Note that the highest trading costs coincide with periods of lower volatility.

Therefore, the ideal timeframe to trade the AUD/TRY pair would be on longer timeframes when volatility is the highest. For shorter-term traders, opening positions when volatility is above the average can potentially lower the trading costs. Furthermore, traders across all timeframes can lower their trading costs by using the forex limit order types. With these types of orders, the cost of slippage is removed.

Below is an example using the ECN account.

ECN Account Using Limit Model Account

Total cost = Slippage + Spread + Trading fee

= 0 + 3 + 1 = 4

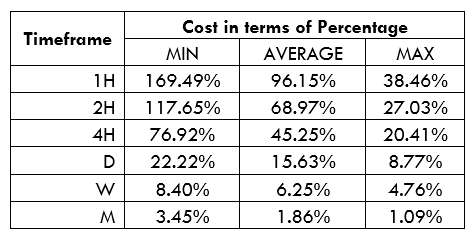
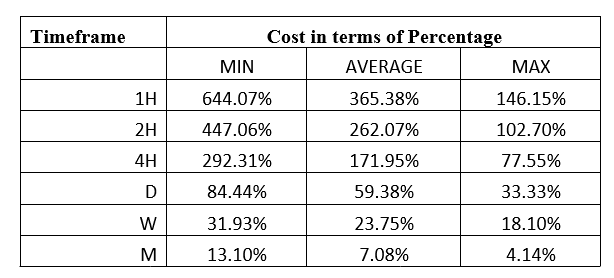
Using the forex limit order types has lowered the trading costs across all timeframes. You can notice that the highest cost has reduced from 101.69% to 67.8%.

Categories
Forex Assets

Exploring The Costs Involved While Trading The AUD/HUF Forex Exotic Pair

Introduction

The AUD/HUF pair is an exotic forex pair with the AUD representing the Australian Dollar and the HUF representing the Hungarian Forint. When trading in such an exotic currency pair, forex traders should anticipate higher volatility. The base currency in this pair is the AUD, while the HUF is the quote currency. Hence, the exchange rate of the AUD/HUF represents the amount of HUF that a single AUD can purchase. If the exchange rate of AUD/HUF is 221.51, it means that you can buy 221.51 HUF using 1 AUD.

AUD/HUF Specification

Spread

One of the ways forex brokers earn their revenue is through the spread. This is the difference in value between the price they sell a currency pair to you and the price at which they buy the same pair from you.

The spread for the AUD/HUF pair is – ECN: 22 pips | STP: 27 pips

Fees

For traders with the ECN account, they get charged a fee for opening positions. Note that not all brokers charge this commission. Forex brokers do not charge a fee on STP accounts.

Slippage

Every forex broker has different execution speeds. In times of high volatility, your order may be executed at a price other than the one you requested. This difference is slippage.

Trading Range in the AUD/HUF Pair

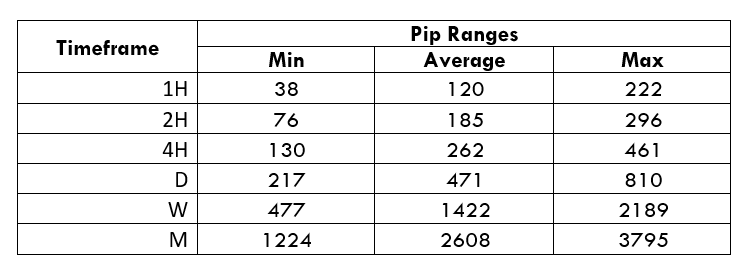
The trading range in forex trading is used to analyse the fluctuation in the price of a currency pair across multiple timeframes. The volatility, as measured with the trading range, is pips from the minimum, average, to the maximum for all timeframes. With this information, you can deduce the most profitable timeframes to trade.

The Procedure to assess Pip Ranges

  1. Add the ATR indicator to your chart
  2. Set the period to 1
  3. Add a 200-period SMA to this indicator
  4. Shrink the chart so you can determine a larger period
  5. Select your desired timeframe
  6. Measure the floor level and set this value as the min
  7. Measure the level of the 200-period SMA and set this as the average
  8. Measure the peak levels and set this as Max.

AUD/HUF Cost as a Percentage of the Trading Range

Now that we’ve established the volatility,  we can proceed to calculate the trading costs incurred when trading these timeframes. The trading cost is expressed as a percentage of total costs to the volatility.

Below are the trading costs of the AUD/HUF pair for both ECN and STP accounts.

ECN Model Account costs

Spread = 22 | Slippage = 2 | Trading fee = 1

Total cost = 25

STP Model Account

Spread = 27 | Slippage = 2 | Trading fee = 0

Total cost = 29

The Ideal Timeframe to Trade  AUD/HUF Pair

From the above analyses, we can see that the trading cost of the AUD/HUF pair decreases with an increase in volatility. Since the volatility also increases with the timeframe, trading the AUD/HUF over longer timeframes incurs lower costs.

Although the lower timeframes have higher trading costs, these costs can be reduced by timing trades when volatility approaches the maximum. Furthermore, slippage costs can be avoided if traders use forex limit order types. With the forex limit orders, trades are executed at precise price points, avoiding the impact of slippage. Let’s look at an example of this using the ECN account.

ECN Account Using Limit Model Account

Total cost = Slippage + Spread + Trading fee

= 0 + 22 + 1 = 23

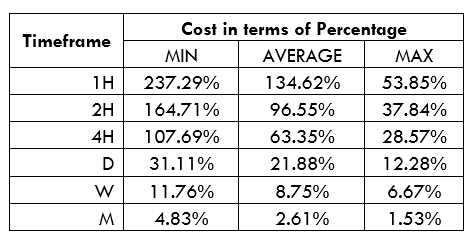
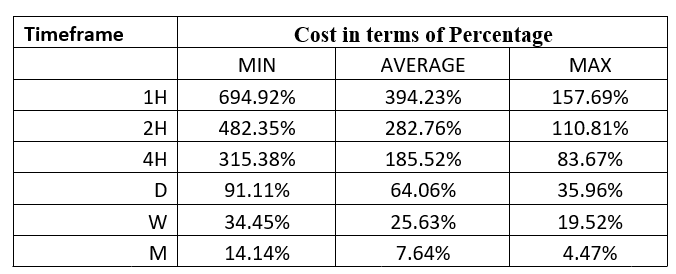
Notice that the trading costs have been reduced in all timeframes. For example, the highest cost has been lowered from 423.73% to 389.83%.

Categories
Forex Assets

Costs Involved While Trading The AUD/PHP Forex Exotic Pair

Introduction

In this exotic forex pair, the AUD is the Australian Dollar, and the PHP is the Philippine Peso. Note that trading with such exotic pairs is accompanied by periods of high volatility compared to major forex pairs. The AUD is the base currency, while the PHP is the quote currency. Therefore, in forex trading, the price of the AUD/PHP represents the amount of PHP you can purchase using 1AUD. Say that the price of AUD/PHP is 34.057. It means that with 1 AUD, you can buy 34.057 PHP.

AUD/PHP Specification

Spread

In the forex market, when going long, you buy a currency pair from the broker at a “bid” price. When you go short, you sell the currency pair to the broker at the “ask” price. The difference between the two prices is the spread.

The spread for the AUD/PHP pair is – ECN: 10 pips | STP: 15 pips

Fees

Forex traders using ECN type accounts get charged a trading fee by their brokers depending on the size of their position. STP type accounts rarely attract any trading fees from the brokers.

Slippage

If you have ever opened a trade during periods of increased volatility, you will notice that your order price differs from the execution price. This difference is slippage. It can also be caused when your broker is slow to execute your order.

Trading Range in the AUD/PHP Pair

The trading range refers to the analysis of the fluctuation of a currency pair over various timeframes. With the trading range, we can determine volatilities from minimum to the maximum across all timeframes. This information will be useful in deciding profitability across these timeframes.

The Procedure to assess Pip Ranges

  1. Add the ATR indicator to your chart
  2. Set the period to 1
  3. Add a 200-period SMA to this indicator
  4. Shrink the chart so you can determine a larger period
  5. Select your desired timeframe
  6. Measure the floor level and set this value as the min
  7. Measure the level of the 200-period SMA and set this as the average
  8. Measure the peak levels and set this as Max.

AUD/PHP Cost as a Percentage of the Trading Range

The percentage of the trading range is when we take the total costs associated with trading a particular pair and express it as a percentage of the volatility. Below are the percentage of the trading range for ECN and STP accounts.

ECN Model Account costs

Spread = 10 | Slippage = 2 | Trading fee = 1

Total cost = 13

STP Model Account

Spread = 15 | Slippage = 2 | Trading fee = 0

Total cost = 17

The Ideal Timeframe to Trade  AUD/PHP Pair

We can observe from the above analyses that longer timeframes produce higher volatilities. More so, as the volatility increases, the trading costs decrease. Therefore, shorter-term traders of the AUD/PHP pair experience higher trading costs than longer-term traders.

However, trading costs can be reduced if traders were to open their positions when the volatility is approaching the maximum. Notice that across all timeframes, the trading costs are lower when volatility changes towards the maximum. Furthermore, using forex limit order types can be used to lower trading costs. Such order types eliminate the slippage costs. Here’s a demonstration.

ECN Account Using Limit Model Account

Total cost = Slippage + Spread + Trading fee

= 0 + 10 + 1 = 11

By getting rid of the slippage costs, we have effectively lowered trading costs across all timeframes.

Categories
Forex Assets

AUD/TWD – What Should You Know Before Trading This Exotic Pair

Introduction

The AUD/TWD is an exotic currency pair with the AUD representing the Australian Dollar, and the TWD is the Taiwan Dollar. Such exotic pairs experience high volatility in the forex market. In this pair, the AUD is the base currency, while the TWD is the quote currency. That means that the exchange rate of the AUD/TWD is the amount of TWD that can be bought by 1 AUD. If the exchange rate of the AUD/TWD pair is 20.091, it means that you can exchange 20.091 TWD for 1 AUD.

AUD/TWD Specification

Spread

The spread in forex trading represents the difference between the price at which you can buy a currency pair when going long and the price at which you can sell the pair when going short. The spread for the AUD/TWD pair is – ECN: 24 pips | STP: 29 pips

Fees

Holders of ECN type accounts are typically charged a fee for every position they open. This fee depends on the size of the positions and the broker. Traders with STP accounts usually don’t get charged trading fees.

Slippage

If your broker delays executing your trade or if the market is highly volatile, you will notice a difference between the price you placed on your order and the execution price. This difference is slippage.

Trading Range in the AUD/TWD Pair

When trading forex, you will notice that a currency pair fluctuates over time. The trading range shows the minimum, average, and maximum variation in pips over different timeframes. By analysis of the trading range, we can determine the potential profit from trading a particular pair across various timeframes.

The Procedure to assess Pip Ranges

  1. Add the ATR indicator to your chart
  2. Set the period to 1
  3. Add a 200-period SMA to this indicator
  4. Shrink the chart so you can determine a larger period
  5. Select your desired timeframe
  6. Measure the floor level and set this value as the min
  7. Measure the level of the 200-period SMA and set this as the average
  8. Measure the peak levels and set this as Max.

AUD/TWD Cost as a Percentage of the Trading Range

To establish the Percentage of the trading range for CAD/TWD, we will express the total trading costs for both ECN and STP accounts as a percentage of the trading range above. This analysis will show us the true costs of trading the AUD/TWD pair across different timeframes, which will aid in determining the best timeframe to trade.

ECN Model Account costs

Spread = 24 | Slippage = 2 | Trading fee = 1 | Total cost = 27

STP Model Account

Spread = 29 | Slippage = 2 | Trading fee = 0 | Total cost = 31

The Ideal Timeframe to Trade  AUD/TWD Pair

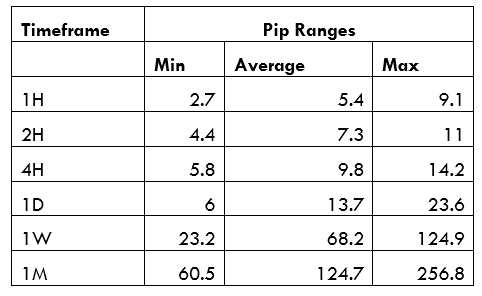
From this analysis, we can tell that as the timeframe becomes longer, the trading costs become lower. For both accounts, the highest trading costs are at the 1H timeframe, which coincides with the lowest volatility of 2.7 pips. The lowest trading costs are at the 1-month timeframe coinciding with when volatility is highest at 256.8 pips.

Overall, we can also notice that the trading costs reduce when volatility changes from minimum to maximum across all timeframes. Therefore, traders of the AUD/TWD pair can reduce their trading costs by trading longer timeframes or trading when volatility approaches maximum. Furthermore, using forex limit order types can remove slippage costs.

Here’s an example.

ECN Account Using Limit Model Account

Total cost = Slippage + Spread + Trading fee

= 0 + 24 + 1 = 25

When the slippage costs are eliminated, the trading costs for the AUD/TWD pair drop. In this case, the highest cost dropped from 457.63% to 423.73%.

Categories
Forex Assets

AUD/ZAR – Analysing The Costs Involved While Trading This Forex Exotic Pair

Introduction

The AUD/ZAR is an exotic currency pair in the forex market. AUD is the Australian Dollar while ZAR is the South African Rand. Trading the AUD/ZAR pair is expected to attract higher volatility than trading major forex currency pairs.

The AUD is the base currency in this exotic pair, while the ZAR is the quote currency. It means that the price associated with the AUD/ZAR pair represents the amount of ZAR that you can buy with 1 AUD. Let’s say that the price of AUD/ZAR is 11.5077; it means that with 1 AUD, you can buy 11.5077 ZAR.

AUD/ZAR Specification

Spread

At any given moment, forex brokers display the “bid” and “ask” price, which represents the price at which you can buy or sell a currency pair. The spread is the difference between these two. The spread for the AUD/ZAR pair is – ECN: 7 pips | STP: 12 pips

Fees

Forex traders with ECN type accounts can sometimes be charged commissions by their forex brokers whenever they open a position. The fees vary with the broker and the size of the position. STP accounts are typically not charged commissions.

Slippage

The price at which we place our trades isn’t always the price at which the broker executes these trades. The difference between the two prices is called slippage in forex trading. It can be because of extreme market volatility or broker inefficiency.

Trading Range in the AUD/ZAR Pair

The trading range refers to the pip movement of a currency pair throughout a trading day. The pip movement can be analyzed across different timeframes to determine the volatility of the pair.

The Procedure to assess Pip Ranges

  1. Add the ATR indicator to your chart
  2. Set the period to 1
  3. Add a 200-period SMA to this indicator
  4. Shrink the chart so you can determine a larger period
  5. Select your desired timeframe
  6. Measure the floor level and set this value as the min
  7. Measure the level of the 200-period SMA and set this as the average
  8. Measure the peak levels and set this as Max.

AUD/ZAR Cost as a Percentage of the Trading Range

We can compare the total cost of trading a particular currency pair alongside the volatility of that pair. This will help us determine the total trading costs of the pair across different timeframes and find out the optimal trading periods.

ECN Model Account Cost

Spread = 7 | Slippage = 2 | Trading fee = 1 | Total = 10

STP Model Account Cost

Spread = 12 | Slippage = 2 | Trading fee = 0 | Total cost = 14

The Ideal Timeframe to Trade the AUD/ZAR

From the analysis of the trading range and the costs in terms of Percentage, we notice that low volatilities attract the highest costs. Since lower timeframes have the least volatilities, it means that trading costs are higher in lower timeframes.

We can say that the ideal timeframe to trade the AUD/ZAR pair is when the volatility is approaching the ‘Maximum”. Traders interested in this pair can also choose to use forex pending orders instead of market orders. With pending orders, you get to eliminate the costs associated with slippage.

Here’s an example with the ECN account when slippage is 0.

Total cost = Slippage + Spread + Trading fee = 0 + 7 + 1 = 8

Eliminating the slippage cost has helped reduce the trading costs of the AUD/ZAR pair across all timeframes. The highest cost in the ECN type account has been reduced from 169.49% to 135.59%.

Categories
Forex Assets

Trading Costs Involved While Trading The AUD/PKR Forex Exotic Pair

Introduction

In this exotic, AUD is the Australian Dollar, and PKR is the Pakistani Rupee. Trading exotic currency pairs can be highly volatile compared to major currency pairs. The AUD is the base currency, and the PKR is the quote currency. That implies that the exchange rate of the AUD/PKR is the number of Pakistani Rupees that a single Australian Dollar can buy. Thus, if the exchange of AUD/PKR is 112.584, it means that with 1 AUD, you can buy 112.584 PKR.

AUD/PKR Specification

Spread

The spread in forex trading represents the value difference between the buying price of a currency pair and its selling price. These prices are referred to as “bid” and “ask.” The spread for the AUD/PKR pair is – ECN: 32 pips | STP: 37 pips

Fees

Some forex brokers charge a fee whenever a trader opens a position. The fee is not standardized and depends on the broker and the size of the trade. Note that STP accounts normally don’t attract broker fees.

Slippage

Whether long or short, when you open a position, it can be executed at a different price than what you requested. This price difference is called slippage in the forex market and is a direct result of extreme volatility or broker delays.

Trading Range in the AUD/PKR Pair

If you observed a currency pair’s price movement, you’d notice the difference in price changes across different timeframes. That is the trading range and is used to determine the volatility of a pair.

The Procedure to assess Pip Ranges

  1. Add the ATR indicator to your chart
  2. Set the period to 1
  3. Add a 200-period SMA to this indicator
  4. Shrink the chart so you can determine a larger period
  5. Select your desired timeframe
  6. Measure the floor level and set this value as the min
  7. Measure the level of the 200-period SMA and set this as the average
  8. Measure the peak levels and set this as Max.

AUD/PKR Cost as a Percentage of the Trading Range

When you combine the total trading costs of a currency pair, you can analyze the percentage costs across different timeframes. This analysis can help you determine the best time to trade a currency pair.

ECN Model Account Cost

Spread = 32 | Slippage = 2 | Trading fee = 1 | Total = 35

STP Model Account Cost

Spread = 37 | Slippage = 2 | Trading fee = 0 | Total cost = 39

The Ideal Timeframe to Trade the AUD/PKR

As seen above, trading the AUD/PKR pair on shorter timeframes is costlier. In both the ECN and the STP accounts, it is cheaper trading the pair over longer timeframes since the trading costs are lower. Note that the trading costs decrease with an increase in volatility. The lowest trading cost for the AUD/PKR pair is when volatility is at the highest 852.4 pips.

The ideal trading time is evidently on the longer timeframes. But shorter-term traders can open positions when volatility is maximum across 1H, 2H, 4H. and 1D timeframes. Traders can also employ the use of forex pending order types, which eliminate the cost of slippage. Here’s an example with the ECN account.

Total cost = Slippage + Spread + Trading fee = 0 + 32+ 1 = 33

Notice how the trading costs have been reduced across all timeframes when forex pending orders are used. The maximum cost, for example, has reduced from 593.22% to 559.32%.

Categories
Forex Assets

Costs Involved While Trading The AUD/RUB Forex Exotic Pair

Introduction

AUD is the Australian Dollar, and RUB is the Russian Ruble; AUD/RUB is thus an exotic currency pair. When trading this pair, forex traders should expect relatively high volatility due to its exotic nature.

In this pair, the AUD is the base currency, and the RUB is the quote currency. It means that the AUD/RUB pair’s price represents the amount of Russian Ruble that one Australian Dollar. If the AUD/RUB price is 55.813, it means that you can buy 55.813 Russian Rubles using 1 Australian Dollar.

AUD/RUB Specification

Spread

For the AUD/RUB pair, the spread is the difference between the price at which you can buy the pair from a broker and the price at which you can sell it to the broker.

The spread for the AUD/RUB pair is:

ECN: 10 pips | STP: 15 pips

Fees

If you have an ECN account, different brokers will charge you varying fees per trade, depending on the size of your position. For most STP accounts, however, there are no fees levied whenever you open a position.

Slippage

In the forex market, slippage occurs when you open a position, but it is executed at a price different than the one you requested. The primary determinants of slippage are market volatility and your broker’s speed of execution.

Trading Range in the AUD/RUB Pair

Throughout the day, the price of a currency pair fluctuates. This fluctuation, as observed from different timeframes, is known as the trading range. In forex, the trading range can help a trader determine the volatility of a currency pair, hence assess the risks it carries.

The Procedure to assess Pip Ranges

  1. Add the ATR indicator to your chart
  2. Set the period to 1
  3. Add a 200-period SMA to this indicator
  4. Shrink the chart so you can determine a larger period
  5. Select your desired timeframe
  6. Measure the floor level and set this value as the min
  7. Measure the level of the 200-period SMA and set this as the average
  8. Measure the peak levels and set this as Max.

AUD/RUB Cost as a Percentage of the Trading Range

We can combine volatility, slippage, and trading fees to determine the cost of trading a currency pair across different timeframes.

Below are cost percentages for both the ECN and the STP forex accounts. These percentages are in terms of pips.

ECN Model Account

Spread = 10 | Slippage = 2 | Trading fee = 1

Total cost = 13

STP Model Account

Spread = 15 | Slippage = 2 | Trading fee = 0

Total cost = 17

The Ideal Timeframe to Trade the AUD/RUB

In the analyses above, we notice that lower timeframes have low volatility, accompanied by higher trading costs for the AUD/RUB pair. With either the ECN or the STP account, costs are highest when volatility is at the lowest, 3.1 pips. The lowest costs are incurred when volatility is the highest at 802.2 pips.

We can observe that longer-term traders generally enjoy lower trading costs. However, shorter-term traders can reduce their trading costs by trading the AUD/RUB pair when volatility is above average; since costs are lower.

If traders use pending orders, they can eliminate slippage, which lowers the trading costs. Here’s an example with the ECN account.

Total cost = Slippage + Spread + Trading fee

= 0 + 10 + 1 = 11

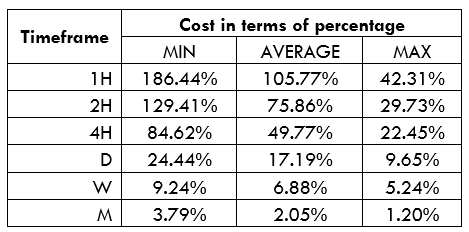
You can notice that there is a significant reduction in trading costs. For example, the highest trading cost for the ECN account has reduced from 220.34% to 186.44%.

Categories
Forex Assets

Trading The AUD/INR Forex Exotic Pair & Analysing The Costs Involved

Introduction

AUD/INR is an exotic currency pair in the forex market, with the AUD representing the Australian Dollar and the INR representing the Indian Rupee. Here, the AUD is the base currency, and the INR is the quote currency. That means that the AUD/INR price represents the amount of INR which 1AUD can buy. For example, let’s say that the price of the AUD/INR is 52.2654. It means that 1 AUD can buy 52.2654 INR.

AUD/INR Specification

Spread

When you go long in forex trading, you have to buy the currency pair from your forex broker. Now, if you decide to sell back the pair to the broker, they will buy it at a lower price than they sold to you. The difference between these two prices – also known as “bid” and “ask” – is the spread.

The spread for the AUD/INR pair is:

ECN: 20 pips | STP: 25 pips

Fees

Some brokers charge a commission for positions opened using ECN accounts. They vary depending on the size of the trade. STP accounts are rarely charged any trading fees.

Slippage

Slippage in Forex is the difference between the execution price of a market order and the price at which that order was placed. The slippage comes about due to increased market volatility or inefficiency on the part of your broker.

Trading Range in the AUD/INR Pair

When a currency pair fluctuates, its volatility varies across different timeframes. The analysis of this volatility in different timeframes is done using the trading range. It can help the trader identify the most suitable timeframes for a particular currency pair.

The trading range is expressed in pips. It shows the value of pips you stand to gain or lose on various timeframes.

The Procedure to assess Pip Ranges

  1. Add the ATR indicator to your chart.
  2. Set the period to 1
  3. Add a 200-period SMA to this indicator
  4. Shrink the chart so you can determine a larger period
  5. Select your desired timeframe
  6. Measure the floor level and set this value as the min
  7. Measure the level of the 200-period SMA and set this as the average
  8. Measure the peak levels and set this as Max.

AUD/INR Cost as a Percentage of the Trading Range

Expressing the total trading costs of a currency pair as a percentage of the trading range helps to understand the trading costs that pair on multiple timeframes. It shows how the trading costs change with volatility.

Below are the trading costs for the AUD/INR  pair on ECN and STP accounts.

ECN Model Account Costs

Spread = 20 | Slippage = 2 | Trading fee = 1

Total cost = 23

STP Model Account

Spread = 25 | Slippage = 2 | Trading fee = 0

Total cost = 27

The Ideal Timeframe to Trade AUD/INR Pair

From the above analyses, we can observe that the lowest trading costs of the AUD/INR pair are on longer timeframes. The lowest trading costs for both the ECN and the STP accounts are when the AUD/INR volatility is at the highest – 518.3 pips. While the shorter timeframes have higher trading costs, intraday traders can take advantage of the maximum volatility periods during these timeframes.

Furthermore, traders can reduce the trading costs by implementing forex limit orders instead of market orders, which are prone to slippages. Here is an example of how the limit orders remove the slippage costs.

ECN Account Using Limit Model Account

Total cost = Slippage + Spread + Trading fee

= 0 + 20 + 1 = 21

You can notice that the forex limit orders lowers the overall costs by making the slippage cost 0. In this scenario, the highest trading cost has been reduced from 389.83% to 355.93%.

Categories
Forex Assets

Exploring The Costs Involved While Trading The AUD/KRW Exotic Pair

Introduction

The AUD/KRW is an exotic currency pair where AUD is the Australian Dollar, and KRW is the South Korean Won. This article will cover some of the essential elements of the AUD/KRW pair that you should know before you start trading this exotic pair.

The AUD is the base currency, and the KRW is the quote currency in this pair. Hence, the pair’s price represents the amount of KRW that can be bought using 1 AUD. For example, say the price of AUD/KRW is 795.89, it means that for every 1 AUD, you can buy 795.89 KRW.

AUD/KRW Specification

Spread

In forex trading, your broker will sell a currency pair to you at a higher price than the one they will buy from you if you sold it back to them. These prices are “bid” and “ask,” and the difference between them is the spread. The spread for the AUD/KRW pair is:

ECN: 21 pips | STP: 26 pips

Fees

STP type accounts incur no trade commissions. For the ECN accounts, the fees charged depend on your broker and the size of your position.

Slippage

When placing a forex market order with your broker, that order might be executed at a different price. The difference is slippage and is due to higher volatilities or execution delays by the broker.

Trading Range in the AUD/KRW Pair

The trading in forex aims to show the trader how a currency pair fluctuates across multiple timeframes. This analysis is used to determine volatility associated with the pair.

If. For example, the trading range of the AUD/KRW across the 4H timeframe is ten pips; it means that a trader can expect to gain or lose  AUD 12.6; since the value of 1 pip is AUD 1.26.

Here’s the trading range of the AUD/KRW  across multiple timeframes.

The Procedure to assess Pip Ranges

  1. Add the ATR indicator to your chart.
  2. Set the period to 1
  3. Add a 200-period SMA to this indicator.
  4. Shrink the chart so you can determine a larger period
  5. Select your desired timeframe
  6. Measure the floor level and set this value as the min
  7. Measure the level of the 200-period SMA and set this as the average
  8. Measure the peak levels and set this as Max.

AUD/KRW Cost as a Percentage of the Trading Range

Here, we calculate the total trading costs that a trader can incur trading the AUD/KRW across different timeframes under different volatility.

The trading cost is expressed as a percentage of the volatility, which is in pips.

ECN Model Account Costs

Spread = 21 | Slippage = 2 | Trading fee = 1

Total cost = 24

STP Model Account

Spread = 26 | Slippage = 2 | Trading fee = 0

Total cost = 28

The Ideal Timeframe to Trade AUD/KRW Pair

From the above analyses, we can observe that the highest costs in both the ECN and the STP accounts are incurred at the 1H timeframe when volatility is at the minimum 58 pips. Although the trading costs decline as the timeframe becomes longer, you can notice that the costs are lower when volatility is at the maximum across all timeframes. Therefore, for intraday traders trading the AUD/KRW pair when volatility approaches, the maximum will help lower the costs.

Using the forex limit order types can also help to reduce the overall costs since it eliminates the risks of slippage encountered in market orders. Here’s an example.

ECN Account Using Limit Model Account

Total cost = Slippage + Spread + Trading fee

= 0 + 21 + 1 = 22

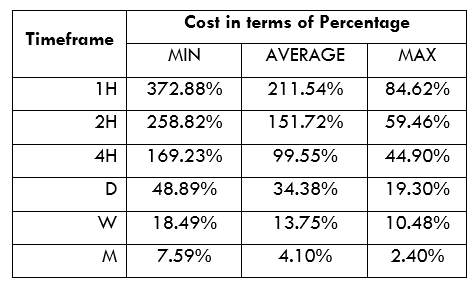
Notice how the overall trading costs have been lowered in all timeframes. When volatility is at the minimum at the 1H timeframe, the highest trading cost has declined from 406.78% to 372.88%.

Categories
Forex Assets

What Should You Know Before Trading The CAD/EGP Forex Exotic Pair

Introduction

The CAD/EGP is an exotic currency pair with the CAD representing the Canadian Dollar, and EGP – the Egyptian Pound. Forex trading in such an exotic currency pair is accompanied by higher volatility. The CAD is the base currency, while the EGP is the quote currency in this pair. Therefore, the price attached to this pair shows the amount of EGP that 1 CAD can buy. Let’s say that the price of CAD/EGP is 11.7692. This price means that for every 1 CAD, you can buy 11.7692 EGP.

Spread

In the forex market, the difference between the buying and selling prices of a currency pair is called the spread. The spread for CAD/EGP is: ECN: 3.7 pips | STP: 8.7 pips

Fees

There are no broker fees associated with the STP accounts. For the ECN account, however, the trading fee is determined by your broker.

Slippage

Slippage in forex is the difference between the price that a trader requests the broker to complete a trade and the price that the broker executes the trade. This difference is determined by the brokers’ speed of execution and market volatility.

Trading Range in the CAD/EGP Pair

Forex traders endeavor to know the average number of pips that a particular currency pair moves within a given timeframe. The trading range represents the volatility of a currency pair within a particular timeframe. The knowledge of a pair’s trading range makes for a useful risk management tool.

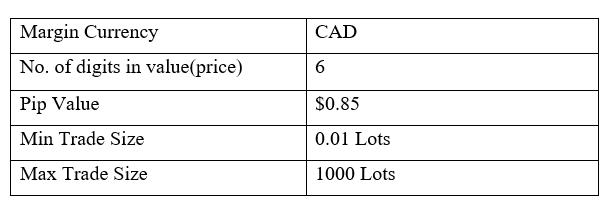
If, for example, during the 1-hour timeframe, the CAD/EGP pair has a trading range of 10 pips, then someone trading this pair can expect to gain or lose $8.5 within this period. Below is a table showing the minimum, average, and maximum volatility of CAD/EGP across different timeframes.

The Procedure to assess Pip Ranges

  1. Add the ATR indicator to your chart
  2. Set the period to 1
  3. Add a 200-period SMA to this indicator
  4. Shrink the chart so you can determine a larger period
  5. Select your desired timeframe
  6. Measure the floor level and set this value as the min
  7. Measure the level of the 200-period SMA and set this as the average
  8. Measure the peak levels and set this as Max.

CAD/EGP Cost as a Percentage of the Trading Range

In the forex market, trading costs include brokers’ fees, slippage, and spread. i.e.

Total cost = Slippage + Spread + Trading Fee

Below are analyses of percentage costs (in pips) to be expected when trading the CAD/EGP pair using either the ECN or the STP account.

ECN Model Account

Spread = 3.7 | Slippage = 2 | Trading fee = 1

Total cost = 6.7

STP Model Account

Spread = 8.7 | Slippage = 2 | Trading fee = 0

Total cost = 10.7

The Ideal Timeframe to Trade CAD/EGP

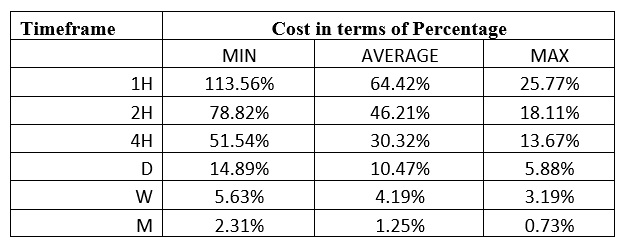
As can be seen from the tables above, trading the 1-hour timeframe with either the ECN or the STP account carries the highest trading costs. We can deduce that during times of low volatility, the trading costs are higher. However, for short term traders, timing their trades when volatility is above average during the 1H, 2H, 4H, and the 1D timeframes ensure they incur lower trading costs with the CAD/EGP pair.

The higher timeframes provide the longer-term traders of the CAD/EGP pair lower trading costs. Forex traders can reduce the trading costs by using limit order types, which removes the risks of slippage. Here’s a demonstration of how this works in the ECN account.

Total cost = Slippage + Spread + Trading fee

= 0 + 3.7 + 1 =4.7

Notice that when the slippage cost is eliminated by using limit orders, the total costs are significantly reduced. The highest cost, for example, reduces from 113.56% to 79.66%.

Categories
Forex Assets

Analysing The CAD/HUF Forex Currency Pair & Determining The Costs Involved

Introduction

The CAD/HUF is an exotic currency pair where CAD represents the Canadian Dollar, and HUF – the Hungarian Forint. In this article, let’s understand some of the basic concepts you should familiarise with before trading the CAD/HUF pair.

For this currency pair, the CAD is the base currency and the HUF the quote currency. In this case, the price associated with the CAD/HUF pair shows the amount of HUF that 1 CAD can buy. For example, if the price of CAD/HUF is 232.97, it means that 1 CAD can buy 232.97 HUF.

Spread

Spread in the forex market is the difference between buying price, i.e. ‘bid’ and the selling price, i.e. ‘ask.’ The spread for the CAD/HUF is – ECN: 50 pips | STP: 55 pips

Fees

The trading fees you are charged depends on the type of forex account you have. STP accounts carry no trading fee, while for the ECN accounts, the trading fees are determined by your forex broker.

Slippage

In highly volatile trading sessions, sometimes the price at which you trade is different than the price at which that trade will be executed. This difference is called slippage and is usually determined by your broker’s speed of execution.

Trading Range in the CAD/HUF Pair

In the forex market, a currency pair will fluctuate differently across different timeframes. Trading range helps a forex trader analyze how a given pair moves (in terms of pips) over a given timeframe, which is an important risk management tool.

For example, let’s say that during a 1-hour timeframe, the CAD/HUF pair has a trading range of 10 pips. A forex trader trading this pair can expect to gain or lose $43 since the value of 1 pip is $4.3

The table below shows the minimum, average, and maximum volatility of CAD/HUF across different timeframes.

The Procedure to assess Pip Ranges

  1. Add the ATR indicator to your chart.
  2. Set the period to 1
  3. Add a 200-period SMA to this indicator.
  4. Shrink the chart so you can determine a larger period
  5. Select your desired timeframe
  6. Measure the floor level and set this value as the min
  7. Measure the level of the 200-period SMA and set this as the average
  8. Measure the peak levels and set this as Max.

CAD/HUF Cost as a Percentage of the Trading Range

Trading costs that can be expected in forex include slippage, spread, and brokers’ fees. Thus, Total cost = Slippage + Spread + Trading Fee.

Forex traders should learn how these costs change across different timeframes as the currency pair price fluctuates. The tables below show the percentage costs (in pips) that can be expected when trading the CAD/HUF pair.

ECN Model Account

Spread = 50 | Slippage = 2 | Trading fee = 1

Total cost = 53

STP Model Account

Spread = 55 | Slippage = 2 | Trading fee = 0

Total cost = 57

The Ideal Timeframe to Trade CAD/HUF

With both the ECN and the STP forex trading accounts, the 1-hour timeframes have the highest costs. Therefore, for short-term traders, using the timeframes with minimum volatilities increases the trading costs they will incur. For the 1H, 2H, 4H, and the 1D timeframes, you will incur lower trading costs by trading the CAD/HUF pair when the volatility is above average.

For both types of trading accounts, longer time frames, i.e., the weekly and the 1-month, offer lesser trading costs for the pair. It is worth noting that forex traders can minimize their costs by using limit order types, which eradicate the risks of slippage. Here’s an example with the ECN account.

Total cost = Slippage + Spread + Trading fee

= 0 + 50 + 1 =51

You can notice that when the cost associated with slippage is removed, the overall costs for trading the CAD/HUF pair significantly drops. The highest cost reduces from 898.31% to 864.41%.

Categories
Forex Assets

Analysing The Costs Involved While Trading The CAD/INR Exotic Currency Pair

Introduction

The CAD/INR pair is considered an exotic currency pair where CAD is the Canadian Dollar, while the INR is the Indian Rupee. This article will cover the basic elements of the CAD/INR pair that you should know before you start trading the pair.

In this pair, the CAD is the base currency, while the INR is the quote currency. Therefore, the price attached to the CAD/INR pair is the amount of INR that can be bought by 1 CAD. For example, if the price of CAD/INR is 55.059, it means that for every 1 CAD, you can get 55.059 INR.

CAD/INR Specification

Spread

The price at which you can buy a currency pair is different from the price at which you can sell the same pair. This difference is the spread. The spread is considered a source of revenue for brokers and a trading cost for forex traders. The spread for the CAD/INR pair is as follows.

ECN: 39 pips | STP: 44 pips

Fees

The trading fee is the commission you pay your forex broker for every trade you make. STP accounts usually have no trading fees, while the fees charged on ECN accounts vary from broker to broker.

Slippage

Slippage represents the difference between the price at which you place a trade and the price at which your broker will execute the trade. Market volatility and the broker’s efficiency determine the amount of slippage.

Trading Range in the CAD/INR Pair

The trading range in forex helps a trader analyze the extent of a currency pair’s fluctuation during a specific timeframe. As measured in pips, this fluctuation can help determine the volatility of the pair and the expected gains or losses. For example, if in the 4-hour timeframe the CAD/INR pair has a volatility of 30 pips, a trader can expect to either gain or lose $54 since the value of 1 pip is $1.8

The table below shows the minimum, average, and maximum volatility of CAD/INR across different timeframes.

The Procedure to assess Pip Ranges

  1. Add the ATR indicator to your chart
  2. Set the period to 1
  3. Add a 200-period SMA to this indicator
  4. Shrink the chart so you can determine a larger period
  5. Select your desired timeframe
  6. Measure the floor level and set this value as the min
  7. Measure the level of the 200-period SMA and set this as the average
  8. Measure the peak levels and set this as Max.

CAD/INR Cost as a Percentage of the Trading Range

The knowledge of the potential costs when trading helps determine the trading strategies to be used. Cost as a percentage of the trading range will help us understand how trading costs vary with volatility under different timeframes.

Total cost = Slippage + Spread + Trading Fee

The tables below show the analyses of percentage costs in both ECN and STP accounts.

ECN Model Account

Spread = 39 | Slippage = 2 | Trading fee = 1

Total cost = 42

STP Model Account

Spread = 44 | Slippage = 2 | Trading fee = 0

Total cost = 46

The Ideal Timeframe to Trade CAD/INR

Depending on your forex trading style, you can use the above analysis to coincide with your trade of the CAD/INR pair with moments of lower trading costs. The 1-hour timeframe for the STP and the ECN accounts has the highest trading costs of 779.66% and 711.86% of the trading range, respectively. Also, notice that the highest costs coincide with the lowest volatility of 3.1 pips.

Trading longer timeframes like the 1-week and the 1-month timeframes are associated with lower costs. However, trading when the CAD/INR pair’s volatility is above average has a lower cost. Another way of reducing trading costs is by using the limit order types, which eliminates the slippage costs. Here’s how it works.

Total cost = Slippage + Spread + Trading fee

= 0 + 39 + 1 = 40

When limit orders are used, the slippage cost becomes zero. Consequently, the trading costs are significantly reduced, with the highest trading cost dropping from 711.86% to 677.97% of the trading range.

Categories
Forex Assets

Costs Involved While Trading The CAD/RON Forex Exotic Pair

Introduction

The CAD/RON is an exotic currency pair where CAD is the Canadian Dollar, and RON is the Romanian Leu. This article will explain some basic elements about the CAD/RON you ought to know before you start trading this pair. The CAD is the base currency, and RON is the quote currency in the CAD/RON exotic pair.

Thus, the CAD/RON pair’s price represents the amount of RON that you can buy using 1 CAD. If the pair’s current price is 3.1292, it means that you can use 1CAD to purchase 3.1292 RON.

CAD/RON Specification 

Spread

When trading forex, the spread represents the difference between the price at which a currency pair can be bought (bid price) and the price it can be sold at (ask price).

The spread for the CAD/RON pair is: ECN: 35 pips | STP: 39 pips

Fees

The STP accounts have no trading fees attached. Trading fees for the ECN accounts vary depending on your choice of forex broker.

Slippage

When trading in the forex market, sometimes the price you request on an order tends to be different from the price your broker executes the trade. This difference is known as slippage, and it depends on the broker’s speed of execution and market volatility.

Trading Range in the CAD/RON Pair

To ensure that proper risk management measures are taken, forex traders should know how much a currency pair fluctuates within a given timeframe. Trading range analysis can help forex traders to determine the volatility associated with trading a particular currency pair. This volatility is measured in terms of pips. If the CAD/RON pair has a volatility of 10 pips within the 1-hour timeframe, then a forex trader can be expected to gain or lose $32 since the value of 1 pip of CAD/RON is $3.2

Below is a table showing the minimum, average, and maximum volatility of CAD/RON across different timeframes.

The Procedure to assess Pip Ranges

  1. Add the ATR indicator to your chart
  2. Set the period to 1
  3. Add a 200-period SMA to this indicator
  4. Shrink the chart so you can determine a larger period
  5. Select your desired timeframe
  6. Measure the floor level and set this value as the min
  7. Measure the level of the 200-period SMA and set this as the average
  8. Measure the peak levels and set this as Max.

CAD/RON Cost as a Percentage of the Trading Range

When trading forex, the costs you can expect to incur include; brokers’ fees, slippage, and spread.

Total cost = Slippage + Spread + Trading Fee

The tables below show the analyses of percentage costs in both ECN and STP accounts.

ECN Model Account

Spread = 35 | Slippage = 2 | Trading fee = 1

Total cost = 38

STP Model Account

Spread = 39 | Slippage = 2 | Trading fee = 0

Total cost = 41

The Ideal Timeframe to Trade CAD/RON

From the above cost analysis, we can observe that the cost of trading the CAD/RON pair varies across different timeframes depending on the volatility. For both the STP and the ECN accounts, the 1-hour timeframe carries the highest costs at 694.92% and 644.07%, respectively. These higher costs are associated with the low volatility of 0.1 pips observed during the 1-hour timeframe.

We can also notice that the trading costs drop significantly when the volatility across all timeframes is above average. Therefore, for intraday forex traders, placing trades when the volatility is above average might be a better way of reducing the trading costs associated with the CAD/RON pair. On the other hand, longer-term traders of the pair enjoy lesser trading costs.

One way for traders to reduce their trading costs is to use limit order types. These forex order types eliminate the effects of slippage, thus make the associated slippage costs zero. Below are costs for a trader using limit orders.

ECN Model Account (Using Limit Orders)

Total cost = Slippage + Spread + Trading fee

= 0 + 35 + 1 = 36

As you can see, the trading costs are significantly reduced when limit orders are employed. The highest trading costs dropped from 644.07% to 610.17% of the trading range.

Categories
Crypto Daily Topic

Introducing the Standard Tokenization Protocol (STP)

Security issuance in the traditional world is faced with so many challenges. And many of these challenges stem from the centralized nature of the system – from costly intermediaries to inaccurate records to fraud-prone processes.

Blockchain technology provides an opportunity for the industry to rectify these shortcomings. It facilitates the decentralized and peer-to-peer exchange of assets as it does trustless and fraud-free transactions. 

The Standard Tokenization Protocol is a blockchain effort that wants to make this possible. And it has the bonus of making sure these assets are legally compliant, eliminating any potential friction with authorities. 

How does it achieve that? This article is an attempt to answering that question. 

Breaking Down STP

The Standard Tokenization Protocol is a blockchain effort aimed at cross-chain assets tokenization. It wants to differentiate itself from similar protocols by supporting assets in a way that makes them compliant with various jurisdictions. The end goal for STP is to popularize the knowledge and usage of digital assets around the world.

The STP whitepaper describes itself as “a decentralized platform for digital asset issuance powered by the STP token, a new smart contract protocol framework for compliance offerings.” It also states that it aims to “enable the movement of digital assets in a globally compliant manner.” 

STP wants to address the issues of traditional security-issuing platforms. 

The Problems with Traditional Options

  • Security issuance in the traditional system involves intermediaries who add to the bloat and expenses of the process
  • Often, there’s a limit on the scale of participants that can be involved in security issuance and trading at any time, in an attempt to minimize the manual process 
  • The restrictions lead to the securities being less liquid in the market

Benefits of Digital Assets

#1. Digital assets are programmable

Blockchain enables programmability for digital assets. Blockchain-enabled smart contracts can automatically move value in a peer-to-peer manner from one party to another when certain thresholds are met. This massively reduces costs.

#2. Fractional ownership

Fractional ownership enables investors to purchase part of traditionally valuable assets such as rare art and antique cars, and even assets that were previously a preserve of the wealthy such as real estate. This enables such assets to be liquid as opposed to if the process involved looking for one single buyer. 

#3. Increased liquidity

Liquidity is how fast a product is sold once it’s listed on the market. It’s the opposite of illiquidity, which is when a product takes too long to find an exit position once it’s listed. Fractionalization of assets increases liquidity since it increases the number of buyers interested in purchasing a product. 

#4. Peer-to-peer transactions 

At its core, decentralization stands for the transfer of assets between parties without the involvement of overseeing authorities or intermediaries. The STP protocol ensures the peer-to-peer transfer of assets executed via smart contracts. 

#5. Automated compliance

Traditional compliance procedures involve lengthy Know Your Customer (KYC) and Anti-Money Laundering (AML) procedures to ensure trust. On the other hand, blockchain-powered transactions are inherently transparent, making them trustless and legally compliant. 

The STP Standard 

The STP Standard is a protocol that oversees the generation, issuance, and transfer of tokenized assets. The protocol has a Compliance Validator that checks whether token issuance meets all the requirements -whether it’s accreditation, AML, and so on. There’s a validator committee whose work is to ensure this compliance is met. The STP network enables assets to move across geographical borders in a compliant manner. 

Use Cases of the STP Protocol

The STP standard can be applied to several use cases across different industries. Let’s take a look at three of them: 

#.1. Compliant asset tokenization 

Asset owners from anywhere can use the STP protocol to tokenize their assets on the blockchain, increasing their liquidity. 

#2. Mobile platform 

Various users, such as retail investors, can access the STP platform conveniently via their mobile app. Not only will they be able to access wealth management tools, but they can also find projects to invest in, and if they’re the owners of a project, they can find the right audience in the platform. 

#3. Blockchain-based crowdfunding

With the native cryptocurrency, STP, investors will be able to access new financial tools such as blockchain-based crowdfunding via smart contracts. Such onchain crowdfunding is safer, more secure, and more transparent than traditional crowdfunding. 

STP Protocol’s Community Growth Strategies

The STP team plans to implement several strategies in the near future in a bid to build a bigger community. These strategies are as follows: 

  • Team up with various industry players so as to expand its ecosystem
  • Hold airdrops and similar marketing campaigns to build community engagement
  • Engage with the community on various social media platforms
  • Keep the community updated on quarterly initiatives
  • Launch Ambassador Programs to promote the idea of decentralization everywhere

The STP Token

The native cryptocurrency of the STP network is known as STPT. The token will serve several crucial roles in the network, including the following: 

  • Enable users to fractionalize assets or features of those assets
  • As ‘gas’ for powering verification processes and transactions
  • As staking so as to take part in the proof of stake consensus mechanism
  • As a governance mechanism through which to contribute to major decisions of the network
  • As a reward for good behavior 

STP’s token distribution was as follows:

  • Bittrex IEO token sale – 3.75%
  • First private sale – 25%
  • Second private sale – 5%
  • Team tokens – 18.75%
  • Token treasury tokens – 7.5%
  • Token reserve tokens – 40%

Key Metrics of STP Token

If you’re interested in buying the STP token, then you need to know its current standing in the market. As of Sep 22, the token is trading at $0.019297 while ranking at #396. It has a market cap of $15,793,071, with a 24-hour volume of $2,738,104, a circulating supply of 818,409,893, and a total supply of 1,942,420,283. The token’s all-time high was $0.094944 (June 27, 2019), while its all-time low was $0.005800 (Sep 30, 2019). 

Where to Buy STP Tokens

You can purchase STP tokens at any of several crypto exchanges, including Coinone Upbit, Coinone, VCC Exchange, Bithumb Global, BitMax, Huobi Global, Bittrex Poloniex, Bitsonic, Gate.io, and CoinDCX. 

Closing Thoughts

STP is leading from the front to set a new standard for assets issuance. Issuers no longer have to deal with the burden of complying with regulations. All in all, users can expect a more accessible, inclusive, and efficient token issuance platform. 

Categories
Forex Assets

Costs Involved While Trading The JPY/LKR Forex Exotic Pair

Introduction

JPYLKR is a forex exotic currency pair, where JPY is Japan’s currency, and LKR is the currency of Sri Lanka. In this currency pair, JPY is the first currency, and the LKR is the second currency. The JPYLKR shows how much LKR is needed to have one JPY. It is quoted as 1 JPY per X LKR. For example, if the value of this currency pair is at 1.7686, then almost 1.7686 LKR is required to purchase one JPY.

JPYLKR Specification

Spread

The spread comes from the difference between the Ask and Bid price that a broker take as a charge. This value is set by the broker. However, it varies on the type of execution model used for executing the trades. Below are the ECN and STP values of JPY/LKR forex exotic pair.

Spread on ECN: 19 pips | Spread on STP: 24 pips

Fees

Every broker takes fees from trading, which is similar to the stock market. However, there is no fee on STP accounts, but a few pips on ECN accounts.

Slippage

Sometimes the entry price and execution price does not match, which is known as Slippage. The reason for slippage is the market volatility and the broker’s execution speed.

Trading Range in JPY/LKR

Procedure to assess Pip Ranges

  1. Add the ATR indicator to your chart
  2. Set the period to 1
  3. Add a 200-period SMA to this indicator
  4. Shrink the chart so you can assess a large time period
  5. Select your desired timeframe
  6. Measure the floor level and set this value as the min
  7. Measure the level of the 200-period SMA and set this as the average
  8. Measure the peak levels and set this as Max.

JPYLKR Cost as a Percent of the Trading Range

With the volatility values from the above table, we can determine the chance of cost with volatility changes. We have got the ratio between total cost and volatility and converted into percentages.

ECN Model Account 

Spread = 19 | Slippage = 5 | Trading fee = 8

Total cost = Spread + Slippage + Trading Fee

= 19 + 5 + 8

Total cost = 32

STP Model Account

Spread = 24 | Slippage = 3 | Trading fee = 0

Total cost = Spread + Slippage + Trading Fee

= 19 + 5 + 0

Total cost = 27 

The Ideal way to trade the JPYLKR

The JPYLKR has enough volatility and liquidity. Hence, trading in this currency pair is straightforward and profitable. The above table’s percentage values are within 300%, which is an indication of stable volatility. Therefore, the costs are low irrespective of the timeframe and volatility you trade.

Digging it a little deeper, there is an inverse relationship between the cost and volatility. In a lower timeframe, the volatility is higher, and the cost is lower. However, in a higher timeframe, the volatility is lower, but the cost is higher. In this situation, traders should focus on trading when the volatility is on the average value. Therefore, it will be cost-efficient for all traders.

Furthermore, traders can quickly reduce costs by placing ‘limit’ and ‘stop’ orders. Because by using limit orders, the Slippage can be totally avoided, and the total costs get reduced. In our example, the total cost will be reduced by five pips, as shown below.

Using Limit Orders

Spread = 19 | Slippage = 0 | Trading fee = 0

Total cost = Spread + Slippage + Trading Fee

= 19 + 0 + 0

Total cost = 19

Categories
Forex Assets

Trading The CAD/ZAR Forex Cross Currency Pair & Analyzing The Costs Involved

Introduction

The CAD/ZAR is an Exotic forex currency cross. CAD represents the Canadian Dollar, and the ZAR corresponds to the South African Rand. CAD is the base currency in this pair, while the ZAR is the quote currency. This pair’s exchange rate shows the value of the ZAR, which is equivalent to 1 CAD. If the pair’s exchange rate is 12.7969, it means that 12.7969 ZAR is equivalent to 1 CAD.

CAD/ZAR Specification

Spread

The spread in forex is calculated by subtracting the bid price from the asking price. Brokers determine the spread since it’s their primary source of revenue. Below is the spread charges for ECN and STP brokers for CAD/ZAR pair.

ECN: 39 pips | STP: 44 pips

Fees

Forex traders with the ECN type accounts have to pay a commission to their brokers for every position they open. Brokers do not charge any trading fees on STP accounts.

Slippage

The difference between the trade price preferred by a trader and the broker’s execution price is the slippage. In forex, slippage depends on market volatility and the speed at which the broker executes the trade.

Trading Range in the CAD/ZAR Pair

The trading range is best described as the analysis of how the exchange rate of a currency fluctuates across different timeframes. This analysis will help to estimate the expected returns from trading a particular currency pair. If, for example, on the 1-hour timeframe, the volatility of the CAD/ZAR is ten pips, a trader can expect to gain or lose $78. The trading range for the CAD/ZAR pair is shown below.

The Procedure to assess Pip Ranges

  1. Add the ATR indicator to your chart
  2. Set the period to 1
  3. Add a 200-period SMA to this indicator
  4. Shrink the chart so you can determine a larger period
  5. Select your desired timeframe
  6. Measure the floor level and set this value as the min
  7. Measure the level of the 200-period SMA and set this as the average
  8. Measure the peak levels and set this as Max.

CAD/ZAR Cost as a Percentage of the Trading Range

To make an informed risk management decision when trading the CAD/ZAR pair, we can analyze how the trading costs vary across different timeframes with different volatilities. Here are the cost analyses for the CAD/ZAR pair for both ECN and STP accounts.

ECN Model Account

Spread = 39 | Slippage = 2 | Trading fee = 1

Total cost = 42

STP Model Account

Spread = 44 | Slippage = 2 | Trading fee = 0

Total cost = 46

The Ideal Timeframe to Trade CAD/ZAR

We can notice that shorter timeframes have higher trading costs than the longer timeframes for both the ECN and the STP accounts. Also, across all timeframes, the trading costs reduce as the trading range of the CADZAR pair increases from minimum to maximum.

Although longer-term traders enjoy lesser trading costs, intraday traders can reduce their trading costs by trading when the volatility ranges between medium to the maximum. We can also further reduce the trading costs by implementing forex limit orders, which ensures that slippage does not affect your prices. Here is how trading costs can be reduced using forex limit orders.

ECN Account Using Limit Model Account

Total cost = Slippage + Spread + Trading fee

= 0 + 39 + 1 = 40

Using limit orders has significantly reduced trading costs. For the CAD/ZAR pair, the highest cost has been reduced from 711.86% of the trading range to 677.97%.

Categories
Forex Assets

Trading The CAD/SEK Forex Exotic Currency Pair & Analyzing The Costs Involved

Introduction

CAD/SEK is a Forex exotic currency pair, where CAD is the primary currency of Canada, and SEK (Swedish Krona) is the currency of Sweden. In this exotic currency pair, CAD is considered the base currency, and SEK as the quote currency. This pair’s price determines the value of SEK, which is equivalent to one CAD. We can quote it as 1 CAD per X numbers of SEK. For example, if the CADSEK pair’s value is at 6.5877, we would need almost 6.5877 SEK to buy one CAD.

CAD/SEK Specification

Spread

In all the financial markets, the spread represents the difference between the Bid and Ask prices. It is typically a charge that is deducted by the Forex broker. These spread values vary on the type of execution model used for trade execution.

The spread of the CAD/SEK pair on ECN is 39 pips, and on the STP model account is 44 pips.

Fees

The trading fees that forex brokers are similar to the stock market. It is deducted from the traders’ accounts as soon as they open a new position. There is no fee charged on STP accounts, but a few pips are charged on ECN accounts.

Slippage

Slippage occurs when a trader opens a trade at a price, but it opens at another price by expanding the spread. The main reason for the slippage to occur is the market volatility and the broker’s execution speed.

Trading Range in CAD/SEK

Procedure to assess Pip Ranges

  1. Add the ATR indicator to your chart
  2. Set the period to 1
  3. Add a 200-period SMA to this indicator
  4. Shrink the chart so you can assess a large time period
  5. Select your desired timeframe
  6. Measure the floor level and set this value as the min
  7. Measure the level of the 200-period SMA and set this as the average
  8. Measure the peak levels and set this as Max.

CAD/SEK Cost as a Percent of the Trading Range

The below tables represent the percentage values of trading costs involved while trading this particular Forex asset in various time frames. Please note that these values must be used for directional purposes only. So, for instance, if the percentage of costs involved is high in the one-hour time frame, it implies that this pair is expensive to trade in that particular time frame.

ECN Model Account 

Spread = 39 | Slippage = 5 | Trading fee = 8

Total cost = Spread + Slippage + Trading Fee

= 39 + 5 + 8 = 52

STP Model Account

Spread = 44 | Slippage = 5 | Trading fee = 0

Total cost = Spread + Slippage + Trading Fee

= 39 + 5 + 0 = 49

The Ideal way to trade the CADSEK

The CAD/SEK is an exotic cross currency pair with sufficient liquidity. As a result, traders may find it easy to trade in this pair. If we look at the table, we would see that the percentage values did not move above 65%, representing a lower trading fee even in the lower timeframe. Therefore, trading in this currency pair is suitable for intraday, swing, and even scalping. However, the best decision is to trade when the cost of trading is at the average value.

There is another way to reduce the cost while trading this pair, and it is to place a pending order. We can either place a limit or stop order instead of the market order. In that case, the slippage won’t be considered while calculating the total costs. Therefore, in our example, the overall cost will be reduced by five pips, as shown below.

STP Model Account (Using Limit Orders)

Spread = 44 | Slippage = 0 | Trading fee = 0

Total cost = Spread + Slippage + Trading Fee

= 44 + 0 + 0 = 44

Categories
Forex Assets

Everything About Trading The CAD/SGD Forex Currency Pair

Introduction

CAD/SGD is a Forex exotic currency pair where CAD represents the Canadian Dollar and the SGD, – the Singapore Dollar. For this pair, the CAD is the base currency, and the SGD is the quote currency. Therefore, the price attached to the pair is the quantity of the SGD that can be bought by 1 CAD. If the price of the CAD/SGD pair is 1.0289, it means that 1 CAD dollar buys for 1.0289 SGD.

CAD/SGD Specification

Spread

In forex trading, the difference in pips between the buying price (bid) and selling price (ask) is the spread. Forex brokers primarily generate their revenues through the spread. The spread varies depending on the type of trading account. The spread for the CAD/SGD pair is:

ECN: 7 pips | STP: 12 pips

Fees

For every individual trade made on an ECN account, one has to pay a commission. This fee varies with the broker and depends on the type of trade executed and the currency being traded. STP accounts do not have fees.

Slippage

In forex trading, slippage is the difference in the price in which a trader initiates a trade and the price at which it is executed. Slippage is a direct result of the brokers’ speed of execution and market volatility.

Trading Range in the CAD/SGD Pair

In forex, the trading range shows the fluctuation of a currency pair within s specific timeframe. The trading range is useful to estimate potential profit or loss from trading different timeframes. For example, if the CAD/SGD pair fluctuates ten pips in the 2-hour timeframe, it means that a trader can expect to either gain or lose $97 by trading one standard lot.

Below is a table showing the minimum, average, and maximum volatility of CAD/SGD across different timeframes.

The Procedure to assess Pip Ranges

  1. Add the ATR indicator to your chart
  2. Set the period to 1
  3. Add a 200-period SMA to this indicator
  4. Shrink the chart so you can determine a larger period
  5. Select your desired timeframe
  6. Measure the floor level and set this value as the min
  7. Measure the level of the 200-period SMA and set this as the average
  8. Measure the peak levels and set this as Max.

CAD/SGD Cost as a Percentage of the Trading Range

Cost expressed as the Percentage of the trading range helps a forex trader establish the anticipated trading costs under different market volatility across different timeframes.

Total cost = Slippage + Spread + Trading Fee

The tables below show the percentage costs to be expected when trading the CAD/SGD pair. The costs are expressed as a percentage of pips.

ECN Model Account

Spread = 7 | Slippage = 2 | Trading fee = 1

Total cost = 10

STP Model Account

Spread = 12 | Slippage = 2 | Trading fee = 0

Total cost = 14

The Ideal Timeframe to Trade CAD/SGD

We can see that in both the ECN and the STP accounts, costs are higher when volatility is at a minimum across all timeframes. Furthermore, we can observe that these costs tend to reduce when the volatility increases to the maximum.

For the CAD/SGD pair, costs are highest when volatility is at the lowest at 0.02 pips during the 1-hour timeframe. Conversely, the trading costs are lowest at the 1-month timeframe when volatility is at a maximum of 8.7 pips. Since high volatility can be risky and low volatility less profitable, forex traders should consider trading during times of average volatility.

More so, traders can increase their profitability by eliminating the costs associated with slippage. By using limit instead of market orders, forex traders can avoid experiencing slippage when entering and exiting positions.

Let’s have a look at how zero slippage cost affects the total costs.

ECN Account Using Limit Model Account

Total cost = Slippage + Spread + Trading fee

= 0 + 7 + 1 = 8

Notice that using the limit order type reduces the overall costs. The highest cost, for example, has reduced from 169.49% to 135.59%.

Categories
Forex Assets

Costs Involved While Trading The ‘CAD/TWD’ Forex Exotic Currency Pair

Introduction

The CAD/TWD is an exotic currency pair where CAD is the Canadian Dollar, and the TWD is referred to as the Taiwan New Dollar. In this pair, CAD is the base currency, and the TWD is the quote currency, which means that the exchange rate for the pair shows the quantity of TWD that can be bought by 1 CAD. In this case, if the exchange rate for the pair is 21.864, then 1 CAD buys 21.864 TWD.

CAD/TWD Specification

Spread

In the forex market, the spread is considered a cost to the trader. It is the difference between the ‘bid’ and the ‘ask’ price. Here are the spread charges for ECN and STP brokers for CAD/TWD pair.

ECN: 29 pips | STP: 34 pips

Slippage

When trading forex, slippage occurs when the execution price is below or above the price at opening the trade. The primary causes of slippage are the brokers’ speed of execution and market volatility.

Trading Range in the CAD/TWD Pair

The trading range in forex is used to analyze the volatility of a currency pair across different timeframes. This analysis gives the trader a rough estimate of how much they stand to gain or lose by trading that pair over a given timeframe. For example, say the volatility of the CAD/TWD pair at the 1-hour timeframe is 20 pips. Then, a trader can anticipate to either profit or lose $91.4

The trading range for the CAD/TWD pair is shown below.

The Procedure to assess Pip Ranges

  1. Add the ATR indicator to your chart
  2. Set the period to 1
  3. Add a 200-period SMA to this indicator
  4. Shrink the chart so you can determine a larger period
  5. Select your desired timeframe
  6. Measure the floor level and set this value as the min
  7. Measure the level of the 200-period SMA and set this as the average
  8. Measure the peak levels and set this as Max.

CAD/TWD Cost as a Percentage of the Trading Range

For us to understand the trading costs associated with the volatility, we will determine the total cost for both ECN and STP accounts as a ratio of the above volatility.

ECN Model Account

Spread = 29 | Slippage = 2 | Trading fee = 1

Total cost = 32

STP Model Account

Spread = 34 | Slippage = 2 | Trading fee = 0

Total cost = 36

The Ideal Timeframe to Trade CAD/TWD

From the above analyses, we can conclude that it is costlier trading the CAD/TWD pair on shorter timeframes when volatility is low. Longer timeframes, i.e., the weekly and the monthly timeframes, have lesser trading costs. Therefore, it would be more profitable trading the CAD/TWD pair over longer timeframes.

However, for intraday traders, opening positions when the volatility is above the average will reduce the trading costs. More so, using forex limit orders instead of market orders will reduce the trading costs by eliminating the costs associated with slippage. Here’s an example.

ECN Account Using Limit Model Account

Total cost = Slippage + Spread + Trading fee

= 0 + 29 + 1 = 30

You can notice that using the limit orders significantly reduces the cost as a percentage of the trading range.

Categories
Forex Assets

Trading The ‘CAD/MYR’ Forex Exotic Currency Pair

Introduction

The CAD/MYR is an exotic Forex currency pair where CAD is the Canadian Dollar, and the MYR is the Malaysian Ringgit. In this pair, CAD is the base currency, while the MYR is the quote currency. The price associated with this pair represents the amount of MYR that can be traded for 1 CAD. For example, if the price of the CAD/MYR is 3.1163, it means that 1 CAD can purchase 3.1163 MYR.

CAD/MYR Specification

Spread

When trading a currency pair, the ‘bid’ price and the ‘ask’ price are different. This difference constitutes the revenues that brokers earn, and is called the spread. Below is the spread charges for ECN and STP brokers for CAD/MYR pair.

ECN: 4 pips | STP: 9 pips

Fees

Fees represent the charges that brokers impose on forex traders when opening a position. These charges vary on the ECN account, depending on your forex broker. STP accounts usually do not charge fees for trading.

Slippage

Sometimes we intend to complete a trade with a prevailing price, but instead, the trade is executed at a different price. The difference between the two prices is slippage, and it is a result of market volatility and your broker’s speed of execution.

Trading Range in the CAD/MYR Pair

The trading range shows the volatility of a currency pair across different timeframes from minimum to the maximum expected volatility. The knowledge of market volatility can help a trader estimate possible gains or losses for different timeframes. Let’s say that the maximum volatility for the CAD/MYR pair at the 1-hour timeframe is 20 pips. A forex trader trading one standard lot of this pair can expect to gain or lose $64.2

Below is the trading range for the CAD/MYR pair.

The Procedure to assess Pip Ranges

  1. Add the ATR indicator to your chart
  2. Set the period to 1
  3. Add a 200-period SMA to this indicator
  4. Shrink the chart so you can determine a larger period
  5. Select your desired timeframe
  6. Measure the floor level and set this value as the min
  7. Measure the level of the 200-period SMA and set this as the average
  8. Measure the peak levels and set this as Max.

CAD/MYR Cost as a Percentage of the Trading Range

When the cost of trading is expressed as a percentage of the trading range, it can help a forex trader implement proper risk management measures. Below are cost analyses of the CAD/MYR pair for both the ECN and the STP accounts.

ECN Model Account

Spread = 4 | Slippage = 2 | Trading fee = 1

Total cost = 7

STP Model Account

Spread = 9 | Slippage = 2 | Trading fee = 0

Total cost = 11

The Ideal Timeframe to Trade CAD/MYR

In both the ECN and STP accounts, the 1-hour timeframe during minimum volatility of 0.1 pips has the highest trading cost. Generally, the 1H, 2H, 4H, and daily timeframes have higher trading costs compared to the weekly and the monthly timeframes. Therefore, longer-term traders of the CAD/MYR pair enjoy lesser trading costs.

However, the intraday traders can reduce their trading costs by initiating trades when the volatility for the 1H, 2H, 4H, and daily timeframes is above average. They can further lower these costs by using the forex limit orders, which eliminates the slippage costs. Here’s an example with the ECN account.

ECN Account Using Limit Model Account

Total cost = Slippage + Spread + Trading fee

= 0 + 4 + 1 = 5

You can notice that the overall trading costs have reduced when the limit orders are used. For example, the highest trading cost has been lowered from 118.64% to 84.75% of the trading range. Cheers.

Categories
Forex Assets

Trading The NZD/HKD Forex Exotic Currency Pair

Introduction

NZD represents the official currency of New Zealand, while HKD is the official currency of Hong Kong. It is an exotic-cross currency pair where NZD is the base currency, and HKD the quote currency. The price of NZDHKD determines the value of HKD, which is equivalent to one NZD. In other words, this pair represents 1 NZD per X HKD. For example, if the pair is trading at 5.14452, we would need about 5.1 HKD to purchase one NZD.

NZD/HKD Specification

Spread

To get the Spread value, we just have to subtract the Bid price from the Ask price. The value of the spread is set by a broker. However, the amount in pips depends on the type of execution model used for executing the trades.

Spread on ECN: 31 pips | Spread on STP: 35 pips

Fees

Like other financial markets, Forex has some fees that a trader needs to pay while they take a trade. Note that the broker does not take any fee on STP accounts, but a few fees are charged on ECN model accounts.

Slippage

The slippage is a set of pips formed by the difference between the demanded price by the trader and the execution price by the broker. The main reason for the occurrence of slippage is market volatility or the broker’s execution speed.

Trading Range in NZD/HKD

Procedure to assess Pip Ranges

  1. Add the ATR indicator to your chart
  2. Set the period to 1
  3. Add a 200-period SMA to this indicator
  4. Shrink the chart so you can assess a large time period
  5. Select your desired timeframe
  6. Measure the floor level and set this value as the min
  7. Measure the level of the 200-period SMA and set this as the average
  8. Measure the peak levels and set this as Max.

NZD/HKD Cost as a Percent of the Trading Range

The volatility values from the above table show how the cost varies with the change in volatility. The ratio between total cost and the volatility values reconverted into percentages to have a better outlook.

ECN Model Account 

Spread = 31 | Slippage = 5 | Trading fee = 8

Total cost = Spread + Slippage + Trading Fee

= 31 + 5 + 8

Total cost = 44

STP Model Account

Spread = 35 | Slippage = 1 | Trading fee = 0

Total cost = Spread + Slippage + Trading Fee

= 35 + 1 + 0 = 36

The Ideal way to trade the NZD/HKD

The NZDHKD is a pair with high liquidity. Therefore, trading this exotic currency pair seems to be feasible. We can see from the above table that the highest Percentage of values are barely above 100%. It means this currency pair is relatively less expensive to trade.

The most significant costs are in the hourly timeframe only, as the costs in 2H, 4H, and daily timeframes are also low. However, every trader should avoid the volatile market condition. Therefore, the best way to trade this pair is to look out for the possibilities to be on lower timeframes also while sticking to the average volatile level.

Also, traders can reduce the trading costs further by eliminating market orders and placing orders as ‘limit’ and ‘stop.’ In this case, slippage can completely be avoided. Please go through the below table to further understand this.

STP Model Account (Using Limit Orders)

Spread = 31 | Slippage = 0 | Trading fee = 0

Total cost = Spread + Slippage + Trading Fee

= 31 + 0 + 0 = 31 

Categories
Forex Assets

Asset Analysis – Trading The NZD/QAR Forex Exotic Pair

Introduction

NZD is the authorized currency of New Zealand, while the QAR (Qatari Rial) is the official currency of Qatar. The combination of these two currencies forms the NZDQAR exotic pair. As a trader, we aim to identify the possible movement in this pair by an appropriate analysis method and make money from the differential.

Understanding NZD/QAR

In every currency pair, the first currency is known as the base currency, and the second currency is known as the quote currency. We can quote it as 1 NZD per X numbers of QAR. For example, if the NZDQAR pair’s value is at 2.4460; therefore, we need almost 2.4460 QAR to buy one NZD.

NZD/QAR Specification

Spread

The bid price is the price level that buyers are willing to pay when they buy an instrument. Similarly, ask price is the lowest price that a seller is willing to pay when they sell a currency pair. The difference between these prices is known as Spread. This value changes with the change of the execution model.

Spread on ECN: 12 pips | Spread on STP: 17 pips

Fees

The fee or commission in Forex is similar to the one that is pair to stockbrokers where it is automatically deducted from traders’ accounts when they take a trade. However, an STP account does not take any fees but a few pips on ECN accounts.

Slippage

There is some market condition when we enter a buy or sell trade, but the trade opens some pips higher or lower, known as Slippage. The Slippage might happen when the market is volatile.

Trading Range in NZD/QAR

Procedure to assess Pip Ranges

  1. Add the ATR indicator to your chart
  2. Set the period to 1
  3. Add a 200-period SMA to this indicator
  4. Shrink the chart so you can assess a large time period
  5. Select your desired timeframe
  6. Measure the floor level and set this value as the min
  7. Measure the level of the 200-period SMA and set this as the average
  8. Measure the peak levels and set this as Max.

NZDQAR Cost as a Percent of the Trading Range

With the volatility values obtained from the above table, we can see how the cost varies as the volatility of the market varies. All we did is, got the ratio between the total cost and the volatility values and converted into percentages.

ECN Model Account 

Spread = 12 | Slippage = 5 | Trading fee = 8

Total cost = Spread + Slippage + Trading Fee

= 12 + 5 + 8 = 25

STP Model Account

Spread = 17 | Slippage = 5 | Trading fee = 0

Total cost = Spread + Slippage + Trading Fee

= 17 + 5 + 0 = 22

The Ideal way to trade the NZD/QAR

The NZD/QAR is a currency pair that has a lot of volatility and liquidity. Therefore, it is easier for a trader to trade this exotic-cross currency. If we analyze the table mentioned above, we can say that the H1 timeframe has the highest cost as a percentage of the trading range at an average of 44.64%, where the average movement is almost 56 pips. The increase in volatility provides higher price fluctuation, but it is often risky for a trader as there is a possibility of unwanted stop loss hit and reverse back.

Moreover, in the monthly timeframe, the price of the NZD/QAR provides an excellent movement with a low cost of an average of 0.77% only. Therefore, if we trade this pair in a higher timeframe, we might reduce the risk of market volatility. We can also use limit orders in the place of market orders to further reduce the costs, as shown below.

STP Model Account (Using Limit Orders)

Spread = 12 | Slippage = 0 | Trading fee = 0

Total cost = Spread + Slippage + Trading Fee

= 12 + 0 + 0 = 12

Categories
Forex Assets

Analyzing The Costs Involved While Trading The NZD/SGD Exotic Forex Pair

Introduction

NZD/SGD is the abbreviation for the native currencies of New Zealand and Singapore. It is considered an exotic pair, where NZD is the first (base) currency, and SGD is the second (quote) currency.

Understanding NZDSGD

This pair’s price determines the value of SGD, which is equivalent to one New Zealand Dollar, NZD. We can quote it as 1 NZD per X number of SGD. For example, if the NZDSGD pair’s value is at 0.90759, we need almost 0.90759 SGD to buy one NZD.

NZDSGD Specification

Spread

The spread comes from the difference between the bid and the ask prices offered by the broker. This value is controlled by the brokers; therefore, traders don’t have a say in this. This value varies on the type of execution used for performing the trades. Below are the ECN and STP values for NZD/SGD currency pair.

Spread on ECN: 26 pips | Spread on STP: 31 pips

Fees

The fee or commission in Forex is similar to the one that is paid to stockbrokers, where it is automatically deducted from traders’ accounts when they take a trade. Note that there are no fees on STP trading accounts, but a few pips are charged on ECN accounts.

Slippage

Slippage happens when a trader tries to open a trade in a price, but it opens at another price. The main reason to occur slippage is the market volatility and the broker’s execution speed.

Trading Range in NZDSGD

Procedure to assess Pip Ranges

  1. Add the ATR indicator to your chart
  2. Set the period to 1
  3. Add a 200-period SMA to this indicator
  4. Shrink the chart so you can assess a large time period
  5. Select your desired timeframe
  6. Measure the floor level and set this value as the min
  7. Measure the level of the 200-period SMA and set this as the average
  8. Measure the peak levels and set this as Max.

NZDSGD Cost as a Percent of the Trading Range

If we look at the volatility values at the above table, we can see how the cost changes with the change in volatility of the market. We just have got that ratio and converted into percentages.

ECN Model Account 

Spread = 26 | Slippage = 5 | Trading fee = 8

Total cost = Spread + Slippage + Trading Fee

= 26 + 5 + 8

Total cost = 39

STP Model Account

Spread = 26 | Slippage = 5 | Trading fee = 0

Total cost = Spread + Slippage + Trading Fee

= 26 + 5 + 0

Total cost = 31

The Ideal way to trade the NZDSGD

The NZDSGD is a currency pair that has a lot of volatility and liquidity. Therefore, it is easier for a trader to trade this currency pair. The above-mentioned percentage values are all within almost 500%. It is an indication that the cost is higher in the lower timeframe and lowers in the higher timeframe.

In other words, the cost rises with an increase in volatility. Therefore, the risk of this pair is that it is highly volatile. However, the best time to trade in this pair is when the volatility is at the average value. A decrease in volatility is ineffective, while the increase in volatility is risky. Therefore, sticking to the average value is suitable for this pair.

Furthermore, there’s an additional way to lessen the cost of the trades you execute. This is by placing a pending order as a ‘limit’ order instead of a ‘market’ order. In this case, there will be no slippage. So, in this example, the total cost will be reduced by five pips.

STP Model Account (Using Limit Orders)

Spread = 26 | Slippage = 0 | Trading fee = 0

Total cost = Spread + Slippage + Trading Fee

= 26 + 0 + 0

Total cost = 26

Categories
Forex Assets

Asset Analysis – Trading Costs Involved While Trading The CAD/AED Currency Pair

Introduction

CAD/AED is a Forex exotic currency pair, where CAD represents the currency of Canada, an AED is the currency of the UAE. In this exotic currency pair, CAD is the base first, and AED is the second currency.

Understanding CADAED

This pair’s price determines the value of AED, which is equivalent to one CAD. We can term it as 1 CAD per X numbers of AED. For example, if the CAD/AED pair’s value is at 2.8007; therefore, we need almost 2.8007 AED to buy one CAD.

CADAED Specification

Spread

In every financial market, Spread represents the difference between the Bid and Ask. It is usually a charge that is deducted by the forex broker. This value changes with the type of execution model.

Spread on ECN: 10 pips | Spread on STP: 15 pips

Fees

The trading fees in the forex market and stock market are the same. It is deducted from the traders’ accounts as soon as they open a new position. Note that STP accounts do not charge anything, but a few pips charges on ECN accounts.

Slippage

Slippage happens when price opens above or below the execution level. Slippage occurs because of two important reasons – market volatility and broker’s execution speed.

Trading Range in CADAED

Procedure to assess Pip Ranges

  1. Add the ATR indicator to your chart
  2. Set the period to 1
  3. Add a 200-period SMA to this indicator
  4. Shrink the chart so you can assess a large time period
  5. Select your desired timeframe
  6. Measure the floor level and set this value as the min
  7. Measure the level of the 200-period SMA and set this as the average
  8. Measure the peak levels and set this as Max.

CADAED Cost as a Percent of the Trading Range

The volatility values on the above table indicate how the cost varies with the change in market volatility. All we did is to get the ratio between the total cost and the volatility values and converted them into percentages.

ECN Model Account 

Spread = 10 | Slippage = 5 | Trading fee = 8

Total cost = Spread + Slippage + Trading Fee

= 10 + 5 + 8 = 23

STP Model Account

Spread = 10 | Slippage = 5 | Trading fee = 0

Total cost = Spread + Slippage + Trading Fee

= 10 + 5 + 0 = 15

The Ideal way to trade the CADAED

The CADAED is an exotic cross currency pair with higher volatility and liquidity. Because of this, traders may find it easy to trade in this pair. We can see that the percentage values above where the value did not move above 230% that represents a higher trading cost in the lower timeframe. However, when we move to the monthly timeframe, the average cost came to below 2%.

Therefore, trading intraday in this currency pair is risky due to the high trading cost. On the other hand, trading in a higher timeframe has less cost, but it requires a lot of patience and time. Overall, for every trader, it is recommended to stick on trading where the trading cost is at the average value.

Another way to reduce the cost is to place a pending order as ‘limit’ and ‘stop’ instead of ‘market.’ In that case, there will be no slippage in the calculation of the total costs. So, in our example, the overall cost will be reduced by five pips.

STP Model Account (Using limit orders) 

Spread = 10 | Slippage = 0 | Trading fee = 0

Total cost = Spread + Slippage + Trading Fee

= 10 + 0 + 0 = 10

Categories
Forex Assets

Analyzing The CAD/DKK Forex Exotic Currency Pair

Understanding CADDKK

CADDKK is an exotic currency pair where CAD is the major currency Canada and DKK is the currency of Denmark. In this currency pair, CAD is the first currency, and DKK is the quote currency.

The price of CADDKK determines the value of DKK that is equivalent to one CAD. We can term it as 1 CAD per X amount of DKK. For example, if the CADDKK pair’s value is at 4.7712, we need almost 4.7712 DKK to buy one CAD.

CADDKK Specification

Spread

When we subtract the Bid price and the Ask price, we will find the Spread. Spread is a trading cost that is controlled by the broker. Therefore, traders don’t have to do anything with this. This value changes with the change in execution.

Spread on ECN: 19 pips | Spread on STP: 24 pips

Fees

Trading fees in the forex market is the cost that the broker takes from traders. It is automatically deducted from traders’ trading account. Note that a few pips charges on ECN accounts but there is no fee on STP.

Slippage

Spread is the difference between the execution level and the open price level when it is an excessive level of volatility in the price. Market volatility and execution speed of your broker mainly contributes to the degree of slippage.

Trading Range in CADDKK

Procedure to assess Pip Ranges

  1. Add the ATR indicator to your chart
  2. Set the period to 1
  3. Add a 200-period SMA to this indicator
  4. Shrink the chart so you can assess a large time period
  5. Select your desired timeframe
  6. Measure the floor level and set this value as the min
  7. Measure the level of the 200-period SMA and set this as the average
  8. Measure the peak levels and set this as Max.

CADDKK Cost as a Percent of the Trading Range

With the volatility, values provide an indication of how the cost varies with the change of volatility. We got the ratio between the cost and volatility and converted into percentages.

ECN Model Account 

Spread = 19 | Slippage = 5 | Trading fee = 8

Total cost = Spread + Slippage + Trading Fee

= 19 + 5 + 8

Total cost = 32

STP Model Account

Spread = 19 | Slippage = 5 | Trading fee = 0

Total cost = Spread + Slippage + Trading Fee

= 19 + 5 + 0

Total cost = 24

The Ideal way to trade the CADDKK

The CADDK is an exotic currency pair with stable volatility in the price. Therefore, it may provide a decent movement even in intraday trading. The percentage of values did not move above 64%. Therefore, we can say that that CADDKK is nicely tradeable even if in the lower timeframe. However, the trading risk is an essential factor that most of the traders should consider while making a trading decision.

Overall all traders should trade when the cost is at an average value. The increase in volatility is risky for the possibility of unwanted stop loss hit, while the decrease in volatility might make trading worthless. To reduce the cost, furthermore, you can place either a ‘limit’ or ‘stop’ order. In this case, there will be no slippage, and in this example, our total cost will be reduced by five pips.

STP Model Account (Using Limit Orders)

Spread = 19 | Slippage = 0 | Trading fee = 0

Total cost = Spread + Slippage + Trading Fee

= 19 + 0 + 0

Total cost = 19

Categories
Forex Assets

Analyzing The Costs Involved While Trading The CAD/NOK Exotic Pair

Introduction

CADNOK is a Forex currency pair, where CAD is the official currency of Canada, and NOK is the native currency of Norway. In this exotic pair, CAD is the base currency, and NOK is the quote currency.

Understanding CADNOK

This pair’s price determines the value of NOK, which is equivalent to one CAD. We can quote it as 1 CAD per X numbers of NOK. For example, if the CADNOK pair’s value is at 6.7135, it means we need almost 6.7135 NOK to buy one CAD.

CADNOK Specification

Spread

In forex trading, Spread indicates the difference between the Bid price and the Ask prices. Traders don’t have to do anything with this as it is deducted by the broker. This value changes with the type of execution model used for executing the trades. Below are the ECN and STP spread values of this currency pair.

Spread on ECN: 39 pips | Spread on STP: 44 pips

Fees

The trading fees that forex brokers take are similar to other financial markets. It is deducted from the traders’ accounts when they take a trade. Note that STP accounts do not take any charge, but a few pips are charged in ECN accounts.

Slippage

Slippage happens when a trader opens a trade at a price, but it opens at another price by expanding the Spread. The main reason to occur slippage is the market volatility and the broker’s execution speed.

Trading Range in CADNOK

The trading range is the representation of the minimum, average, and the maximum volatility of this pair on the 1H, 4H, 1D, 1W, and 1M timeframe. Using these values, we can assess our profit/loss margin of trade. Hence, this proves to be a helpful risk management tool for all types of traders.

Procedure to assess Pip Ranges

  1. Add the ATR indicator to your chart
  2. Set the period to 1
  3. Add a 200-period SMA to this indicator
  4. Shrink the chart so you can assess a large time period
  5. Select your desired timeframe
  6. Measure the floor level and set this value as the min
  7. Measure the level of the 200-period SMA and set this as the average
  8. Measure the peak levels and set this as Max.

CADNOK Cost as a Percent of the Trading Range

If we look at the volatility values from the above table, we can see how the cost changes with the change in volatility. We have provided the ratio between the cost and the volatility values into percentages.

ECN Model Account 

Spread = 39 | Slippage = 5 | Trading fee = 8

Total cost = Spread + Slippage + Trading Fee

= 39 + 5 + 8

Total cost = 52

STP Model Account

Spread = 39 | Slippage = 5 | Trading fee = 0

Total cost = Spread + Slippage + Trading Fee

= 39 + 5 + 0

Total cost = 44

The Ideal way to trade the CADNOK

The CADNOK is an exotic currency pair that has enough liquidity. As a result, traders may find it easy to trade in this exotic currency pair. The percentage values from the above table did not move above 138%, which is an indication of less volatility. However, the Percentage of trading cost is lower in the higher timeframe.

Therefore, traders should be cautious to determine the price where trading is suitable. An increase in volatility is risky, while the decrease in volatility is less profitable. Therefore, the best time to trade in this pair is when the volatility remains at the average value.

Furthermore, another way to reduce the cost is to place a pending order as ‘limit’ and ‘stop’ instead of ‘market.’ In that case, the slippage will not be considered in the calculation of the total costs. So, the total cost will be reduced by five pips.

STP Account Using Limit Model Account

Spread = 39 | Slippage = 0 | Trading fee = 0

Total cost = Spread + Slippage + Trading Fee

= 39 + 0 + 0

Total cost = 39

Categories
Forex Assets

Costs Involved While Trading The NZD/INR Forex Currency Pair

Introduction

The abbreviation of NZD/INR is the New Zealand Dollar paired with the Indian Rupee. Here, NZD is the official currency of New Zealand, and Indian Rupee is India’s currency. Like other currency pairs, NZD/INR provides some decent movement that allows traders to make money from the forex market.

Understanding NZD/INR

In NZD/INR currency pairs, NZD is the base currency (First Currency), and the INR is the quote currency (Second Currency). In a currency pair’s sell trade, we trade the base currency to buy the quote currency and vice versa. Therefore, if the NZD/INR pair is trading at 49.02, it means we should have 49.02 INR to buy 1 NZD.

Spread

As price and bid price is a common term in the forex market, most of the traders should know. The price represents the price in which we sell a currency pair. On the other hand, the bid price is the price at which we take a buy trade.

The difference between the asking price and the bid price is called the spread, usually a charge that the broker takes from a trader. Below are the spread values for the NZD/INR Forex pair.

ECN: 36 pips | STP: 41 pips

Fees

A Fee is a cost that traders pay to the broker as a charge to take a trade. This fee differs on the type of broker (ECN/STP) we use.

Slippage

In some cases, when we take a trade at a particular price, it might ignore the level and open the trade at another price, which is usually known as Slippage. The Slippage can occur at any price level and at any time, usually when the market remains volatile.

Trading Range in NZD/INR

Our aim as a trader is to eliminate losses and minimize trading risks. The trading range here will indicate how much we will make as a profit or loss within a timeframe. To calculate the exact value, we will use ATR is a technical indicator that suggests the price movement in a currency pair. In the lower table, we interpret the minimum, average, and maximum pip movement in a currency pair. We will assess it merely by using the ATR indicator merged with 200-period SMA.

Procedure to assess Pip Ranges

  1. Add the ATR indicator to your chart
  2. Set the period to 1
  3. Add a 200-period SMA to this indicator
  4. Shrink the chart so you can assess a considerable time period
  5. Select your desired timeframe
  6. Measure the floor level and set this value as the min
  7. Measure the level of the 200-period SMA and set this as the average
  8. Measure the peak levels and set this as Max.
  9. NZD/INR Cost as a Percent of the Trading Range

The price of trade differs on the type of brokers and varies based on the volatility of the market. The full cost of trade involves fees, spread, and sometimes Slippage if the volatility is higher.

ECN Model Account

Spread = 36 | Slippage = 5 |Trading fee = 8

Total cost = Slippage + Spread + Trading Fee = 5 + 36 + 8 = 49

STP Model Account

Spread = 41 | Slippage = 5 | Trading fee = 0

Total cost = Slippage + Spread + Trading Fee = 5 + 41 + 0 = 46

The Ideal way to trade the NZD/INR

Considering the table, we should evaluate these two factors to make trading decisions in the NZD/INR pair. The trading cost and volatility are two critical factors that trade should contemplate when trading in the currency market.

In timeframes, we can see the price movement fluctuates from the minimum volatility and the average volatility. As a trader, we aim to make a profit from this pip movement and variation. However, it often becomes challenging to make a profit if there is no sufficient variant in the pip value. As per the price mentioned above, the NZD/INR pair is profitable in swing trading and day trading.

Categories
Forex Assets

How Expensive Is It To Trade The NZD/MYR Currency Pair

Introduction

The abbreviation of NZD/MYR is the New Zealand Dollar paired with the Malaysian Ringgit. Here, NZD is the official currency of New Zealand and many others like the Pitcairn Islands and the Cook Islands. It is also to be the tenth most traded currency in the Foreign exchange market. MYR stands for the Malaysian Ringgit, and it is the official currency of Malaysia, which is further divided into 100 sens.

Understanding NZD/MYR

In NZD/MYR currency pairs, NZD is the base currency (First Currency), and the MYR is the quote currency (Second Currency). In the foreign exchange market, while we sell the currency pair, we always trade the base currency and simultaneously purchase the quote currency and vice versa. The market value of NZD/MYR helps us to understand the intensity of MYR against the NZD. So if the exchange value for the pair NZD/MYR is 2.7977, it means we need 2.7977 MYR to buy 1 NZD.

Spread

Foreign brokers hold two different prices for currency pairs: the ask and bid price. The ask (offer) price is the price in which we sell an asset, and bid(purchase) is the cost at which we buy it. The difference between the ask-bid price is called the spread. Below are the spread values for the NZD/MYR Forex pair.

ECN: 38 pips | STP: 43 pips

Fees

A Fee is the costs that we tradesmen pay to the broker for initiating a trade. This fee differs on the type of broker (ECN/STP) we use.

Slippage

When we want to achieve a trade at an appropriate price, but instead, if the trade gets fulfilled at a distinctive price, we call that distinction as Slippage. The Slippage can occur at any point in time, but often we can counter a volatile market.

Trading Range in NZD/MYR

As a trader, our main interest should be to prevent losses and minimize risks. The trading range here will ascertain the amount of income we will make or lose within a timeframe. ATR is a technical indicator that suggests the price movement in a currency pair. In the lower table, we have the interpretation of the minimum, average, and maximum pip movement in a currency pair. We will assess it merely by using the ATR indicator merged with 200-period SMA.

Procedure to assess Pip Ranges

  1. Add the ATR indicator to your chart
  2. Set the period to 1
  3. Add a 200-period SMA to this indicator
  4. Shrink the chart so you can assess a large time period
  5. Select your desired timeframe
  6. Measure the floor level and set this value as the min
  7. Measure the level of the 200-period SMA and set this as the average
  8. Measure the peak levels and set this as Max.

NZD/MYR Cost as a Percent of the Trading Range

The price of trade differs on the type of brokers and varies based on the volatility of the market. The full cost of trade involves fees, spread, and sometimes Slippage if the volatility is higher.

ECN Model Account

Spread = 38 | Slippage = 5 |Trading fee = 8

Total cost = Slippage + Spread + Trading Fee = 5 + 38 + 8 = 51 

STP Model Account

Spread = 43 | Slippage = 5 | Trading fee = 0

Total cost = Slippage + Spread + Trading Fee = 5 + 43 + 0 = 48

The Ideal way to trade the NZD/MYR

With the assistance of the above tables, let us estimate these two factors to the trade the NZD/MYR pair. Volatility and cost are two aspects a trader must contemplate for trading any currency pair in the foreign exchange market.

In several timeframes, we can see the pip movement is tremendously elevated between the min volatility and the avg volatility. As a day trader, the objective is to attain profits from the pip variation of the market. It becomes challenging to make profits from the market if there is no variation in the pip value. Hence, trading this pair can be considered both profitable and risky. The answer to the question if trading this pair is expensive, is yes.

Trading using Limit Orders (STP Account Model)

To decline our expenses of trade, we can place the trades using limit orders as a substitute for market orders. In doing so, we can avoid the Slippage that will help lower the total cost of the trade. An instance of a Limit order is given below using the STP model.

Spread = 43 | Slippage = 0 | Trading fee = 0

Total cost = Slippage + Spread + Trading Fee = 0 + 43 + 0 = 43

Categories
Forex Assets

How Expensive Is It To Trade The NZD/DKK Forex pair?

Introduction

NZD is the symbol of the New Zealand dollar, and it is the 10th most traded currency in the Foreign Exchange market. It is the official currency of New Zealand and some other countries like Cook Islands, Niue, the Ross Dependency. Whereas DKK stands for Danish Krone, and it is the official currency of Denmark, Greenland, and the Faroe Islands.

The currencies in the Foreign exchange market are traded in pairs. NZD/DKK is the acronym for the New Zealand dollar against the Danish Krone. In this case, the first currency (NZD) is the base currency, and the second (DKK) is the quote currency.

Understanding NZD/DKK

To find the comparative value of one currency in the Forex market, we need another currency to evaluate. If the value of the first(base) currency goes down, the value of the second (quote) currency moves up and vice versa. The market value of NZD/DKK determines the strength of DKK against the NZD. It can be clearly understood as 1 NZD is equal to how much of DKK. So if the exchange price for the pair NZD/DKK is 4.1943, it means we need 4.1943 DKK to buy 1 NZD.

Spread

Forex brokers have two different rates for currency pairs: the bid & ask price. Here the “bid” price at which we can OFFER the base currency, and The “ask” price is at which we can ACQUIRE the base currency. Therefore, the difference between the ask and the bid price is called the spread. Some brokers, instead of charging a split fee for trading, they already have the fees inherent in the spread. Below are the ECN and STP for the pair:

ECN: 15 pips | STP: 20 pips

Fees

When we place any trade, there is some payment/commission we need to pay to the broker. A Fee is simply that payment that we pay to the broker each time we open a position. The fee also fluctuates from the type of broker we use; for instance, there are no charges on STP account models, but a few pips on ECN accounts.

Slippage

The difference between the anticipated and executed price at which the trade is implemented can be termed as Slippage. It can appear at any time but mostly happens when the market is fast-phased and volatile.

Trading Range in NZD/DKK

The trading range is a tabular interpretation of the pip movement in a currency pair for separate timeframes. Using this, we can gauge the risk on a trade for each timeframe. A trading range effectively represents the minimum, average, and maximum pip movement in a currency pair. This can be assessed quickly by using the ATR indicator combined with 200-period SMA.

Procedure to assess Pip Ranges

  1. Add the ATR indicator to your chart
  2. Set the period to 1
  3. Add a 200-period SMA to this indicator
  4. Shrink the chart so you can assess a large time period
  5. Select your desired timeframe
  6. Measure the floor level and set this value as the min
  7. Measure the level of the 200-period SMA and set this as the average
  8. Measure the peak levels and set this as Max.

NZD/DKK Cost as a Percent of the Trading Range

The cost of trade primarily varies on the broker and fluctuates based on the volatility of the market. This is for the reason that the total cost includes Slippage and spreads apart after the trading fee. Following is the description of the cost variation in terms of percentages. The knowledge of it is discussed in the subsequent sections for ECN and STP accounts.

ECN Model Account

Spread = 15 | Slippage = 5 |Trading fee = 8

Total cost = Slippage + Spread + Trading Fee = 5 + 15 + 8 = 28

STP Model Account

Spread = 20 | Slippage = 5 | Trading fee = 0

Total cost = Slippage + Spread + Trading Fee = 5 + 20 + 0 = 25

The Ideal way to trade the NZD/DKK

The NZD/DKK is an exotic currency pair, and the volatility in this pair is moderate. As seen in the range table above, the average pip movement on the 1hour time frame is 68. We must know that the cost of trade declines as the volatility of the pair increases. But this should not be held as an advantage because it is unsafe to trade high volatile markets as the prices rise and fall swiftly.

For instance, in the 1-hour timeframe, the maximum pip range value in this pair is 119 pips, and the minimum pip range value is 20 pips. When we compare the fees for both the pip movements, we find that for 20 pip movement fees is 140.00%, and for a 119 pip movement, the fess is only 23.53%.

So, we can substantiate that the prices are more significant for low volatile markets and high for extremely volatile markets. Hence, we must constantly try to make our entries and exits when the volatility is minimum or average than to that of maximum values. But if your preference is certainly towards decreasing your trading costs, you can trade when the market’s volatility is near the maximum values with optimal risk management.

Categories
Forex Assets

Asset Analysis – Trading The NZD/SEK Exotic Cross Currency Pair

Introduction

NZD/SEK is the acronym for the currency pair New Zealand dollar versus the Swedish Krona. It is marked under the exotic cross-currency pair category. In this pair, NZD will be the base currency, and SEK will be the quote currency. In this article, we shall understand everything about trading this currency pair.

Understanding NZD/SEK

The price of this pair in the foreign exchange market determines the value of SEK comparable to one NZD. It is quoted as 1 NZD per X SEK. So, if the value of this pair is 5.8296, these many Swedish Kronor (SEK) are required to purchase one NZD.

Spread

Trading the Forex market usually does not involve spending a lot of fees like the Stock market. Here, Forex brokers make profits through spreads. It is nothing but the difference between Bid – Ask prices of an asset. Some broker has the cost inherent into the buy and sell prices of the currency pair; instead of charging a separate fee. Below are the spread values of ECN and STP brokers for the NZD/SEK pair.

ECN: 48 pips | STP: 53 pips

Fees

A Fee is the charges we pay to the stockbroker for executing a particular trade. The fee fluctuates from the type of broker we choose. For example, the fee on the STP accounts is zero, but we can expect a few additional pips on ECN accounts.

Slippage

Slippage is the contrast between the price expected by the trader for execution and the price at which the agent executed the price. There is this variation due to the high market volatility and more passive execution speed.

Trading Range in NZD/SEK

The trading range is used at this point; to measure the volatility of the NZD/SEK pair. The amount of money we will gain or lose in an allotted timeframe can be evaluated using the trading range table. The minimum, average, and maximum pip movement of the currency pair is exemplified in the trading range. This can be evaluated simply by using the ATR indicator combined with 200-period SMA.

Procedure to assess Pip Ranges

  1. Add the ATR indicator to your chart
  2. Set the period to 1
  3. Add a 200-period SMA to this indicator
  4. Shrink the chart so you can assess a large time period
  5. Select your desired timeframe
  6. Measure the floor level and set this value as the min
  7. Measure the level of the 200-period SMA and set this as the average
  8. Measure the peak levels and set this as Max.

NZD/SEK Cost as a Percent of the Trading Range

The rate of trade varies on the stockbroker and fluctuates according to the volatility of the market. This is because the trading cost includes fees, slippage, and the spread. The rate of variation in terms of percentage is given below.

ECN Model Account

Spread = 48 | Slippage = 5 |Trading fee = 8

Total cost = Slippage + Spread + Trading Fee = 5 + 48 + 8 = 61

STP Model Account

Spread = 53 | Slippage = 5 | Trading fee = 0

Total cost = Slippage + Spread + Trading Fee = 5 + 53 + 0 = 58

The Ideal way to trade the NZD/SEK

The NZD/SEK is termed as an exotic-cross currency pair and has a low volatile market. Looking at the pip range table, the average pip movement on the 1H timeframe is 115 pips, which implies high volatility. As we know, the higher the volatility, the smaller will be the cost to implement the trade. Nonetheless, this is not a benefit to trading in a volatile market; it involves higher risk.

For instance, in the 1M time frame, the Maximum pip range value is 1938, and the minimum is 503. When we evaluate the trading fees for both the pip movements, we notice that for 503 pip movement fees is 12.13%, and for the 1938 pip movement, fess is only 3.15%. Therefore, from the above instance, we can determine that trading the NZD/SEK currency pair will be on the expensive side.

Categories
Forex Assets

Analyzing the Trading Costs on ‘NZD/CZK’

Introduction

NZD/CZK is the abbreviation for the Euro Area’s Euro against the Czech Koruna. This pair is considered an exotic-cross currency pair. Here, the NZD is the base (first) currency, and the CZK is the quote (second) currency. NDZ is the official currency used in New Zealand, while CZK is the native currency of the Czech Republic.

Understanding NZD/CZK

The price of this pair in the foreign exchange market defines the value of CZK equivalent to one NZD. It is quoted as 1 NZD per X CZK. So, if the value of this pair is 14.8124, these many Korunas are required to purchase one NZD.

Spread

Spread is the mathematical difference between the bid and the asking price offered by the broker. This value is distinct in the ECN account model and STP account model. An approximate value for NZD/CZK pair is given below.
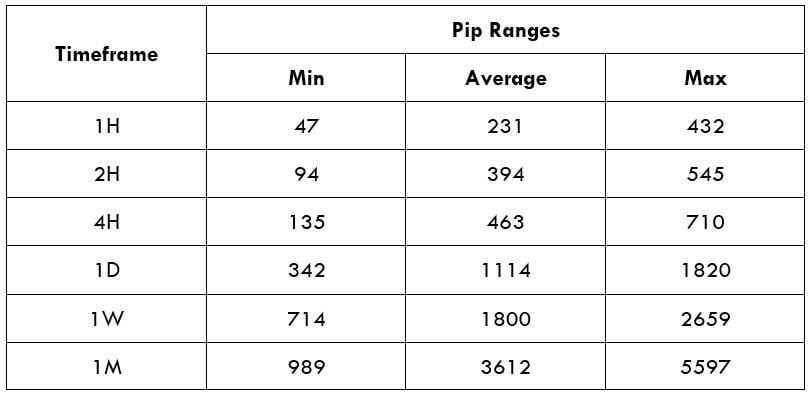
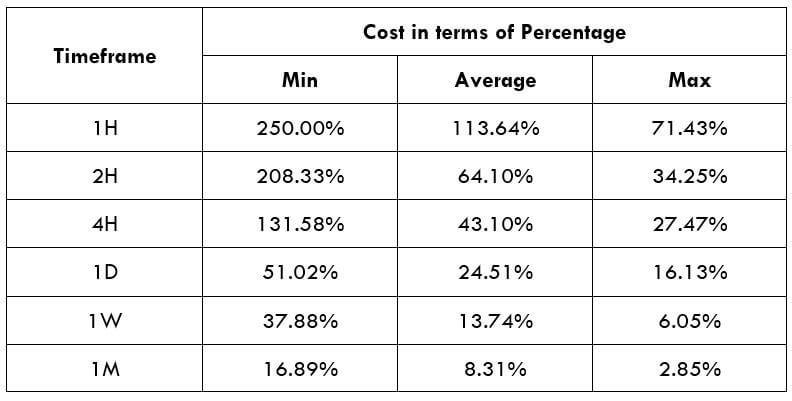
ECN: 43 pips | STP: 48 pips

Fees

The fee is the price/compensation that one pays for the trade. There are no charges on STP accounts, but a few additional pips are levied on ECN accounts.

Slippage

Slippage is a variation between the value proposed by the trader, and the trader indeed received from the broker.

Trading Range in NZD/CZK

The tabular interpretation of the pip movement of a currency pair in separate timeframes is called as the trading range is the. These values are helpful in influencing the profit that can be produced from a trade before-hand. To uncover the value, you must multiply the below volatility price with the pip value of this pair.

Procedure to assess Pip Ranges

  1. Add the ATR indicator to your chart
  2. Set the period to 1
  3. Add a 200-period SMA to this indicator
  4. Shrink the chart so you can assess a large time period
  5. Select your desired timeframe
  6. Measure the floor level and set this value as the min
  7. Measure the level of the 200-period SMA and set this as the average
  8. Measure the peak levels and set this as Max.

NZD/CZK Cost as a Percent of the Trading Range

Trading Range is the interpretation of the total price variation of trades for distinct timeframes and volatilities. The values are achieved by discovering the ratio amongst the total price and the volatility value; it is expressed as a percentage.

ECN Model Account

Spread = 43 | Slippage = 5 |Trading fee = 8

Total cost = Slippage + Spread + Trading Fee = 3 + 43 + 8 = 56 


STP Model Account

Spread = 48 | Slippage = 5 | Trading fee = 0

Total cost = Slippage + Spread + Trading Fee = 5 + 48 + 0 = 53

Trading the NZD/CZK

The bigger the percentage values, the higher is the price on the trade. From the preceding tables, we can see that the values are sizeable in the min column and relatively less significant in the maximum column. This means that the prices are high when the volatility of the market is low.

It is neither suitable to trade when the market’s volatility is elevated nor when the costs are high. To balance out between both these aspects, it is perfect to trade when the volatility of the pair is in the array of the average values.

Additionally, to decrease your costs even beyond, you may place trades using limit orders as a substitute for market orders. In executing so, the slippage will not be involved in the computation of the total costs. And this will put down the cost of the trades by a sizeable number. An example of the same is given below.

STP Model Account (Using Limit Orders)

Spread = 48 | Slippage = 0 |Trading fee = 0

Total cost = Slippage + Spread + Trading Fee = 0 + 48 + 0 = 48

Categories
Forex Assets

NZD/PLN – Analyzing This Exotic Forex Currency Pair

Introduction

NZD/PLN is the short form of the currency pair New Zealand dollar vs. Polish Zloty. Here, the New Zealand dollar (NZD) is the base currency, and the Polish Zloty (PLN) is the quote currency. In this article, we intend to comprehend everything you need to know about trading this currency.

Understanding NZD/PLN

The price of NZD/PLN signifies the value of the Polish Zloty corresponding to one New Zealand Dollar. It is estimated as 1 NZD (New Zealand Dollar) per X PLN (Polish Zloty). So, if the market value of NZD/PLN is 2.4940, these many Polish Zloty are required to buy one NZ dollar.

Spread

The distinction between the ask & bid costs is recognized as the spread. It changes with the implementation model used by the stockbrokers. Further down are the spreads for NZD/PLN currency pairs in both ECN account models & STP account models:

ECN: 30 pips | STP: 35 pips

Fees

There are certain charges levied by the broker to open every spot in the trade. These charges can be referred to as the commission or fees applicable to the trade. Note that these charges are only applicable to the ECN accounts and not on STP accounts. However, a few additional pips are changed on STP account models.

Slippage

Due to high market volatility and the broker’s slow implementation speed, slippage is common. It is a variance in price intended by the trader and price implemented by the broker.

Trading Range in NZD/PLN

The trading range is essentially a tabular interpretation of the pip movement in the NZD/PLN currency pair for distinct timeframes. These figures can be used to ascertain the trader’s risk as it helps us determines the approx. gain/loss that can be incurred on a trade.

Procedure to assess Pip Ranges

  1. Add the ATR indicator to your chart
  2. Set the period to 1
  3. Add a 200-period SMA to this indicator
  4. Shrink the chart so you can assess a large time period
  5. Select your desired timeframe
  6. Measure the floor level and set this value as the min
  7. Measure the level of the 200-period SMA and set this as the average
  8. Measure the peak levels and set this as Max.

NZD/PLN Cost as a Percent of the Trading Range

The total cost consists of slippage, trading fee, and the spread. This fluctuates with the volatility of the market. Therefore, traders need to place themselves to avoid paying high costs. Below is a table demonstrating the variation in the costs for various values of volatility.

ECN Model Account

Spread = 30 | Slippage = 5 |Trading fee = 8

Total cost = Slippage + Spread + Trading Fee = 5 + 30 + 8 = 43 


STP Model Account

Spread = 35 | Slippage = 5 | Trading fee = 0

Total cost = Slippage + Spread + Trading Fee = 5 + 35 + 0 = 40

The Ideal way to trade the NZD/NOK

NZD/PLN is an exotic-cross currency pair. In this case, we can see, the average pip movement in 1hr timeframe is 46, which signifies higher volatility. The smaller the volatility, the higher is the risk, and lesser is the cost of the trade and the other way around. For example, we can see from the trading range that when the pip movement is lesser, the charge is higher, and when the pip movement is higher, the charge is smaller.

To further decrease our costs of trade, the costs can be reduced even more by placing orders as a limit or stop as an alternative to the market orders. In executing so, the slippage will become zero and will lower the total cost of the trade further. In doing so, the slippage will be eliminated from the computation from the total costs. And this will assist us in decreasing the trading cost by a significant margin. An instance of the same is given below using the STP model account.

STP Model Account (Using Limit Orders)

Spread = 35 | Slippage = 0 | Trading fee = 0

Total cost = Slippage + Spread + Trading Fee = 0 + 35 + 0 = 35

Categories
Forex Assets

Asset Analysis – Comprehending The NZD/NOK Exotic Forex Pair

Introduction

NZD/NOK is the abbreviation for the currency pair New Zealand dollar versus the Norwegian Krone. It is referred to as an exotic cross-currency pair. In this case, NZD is the base currency, and NOK is the quote currency. In this article, we shall learn about everything you need to know about this currency.

Comprehending NZD/NOK

Understanding the value of a currency pair is simple. The value of NZD/NOK verifies the Norwegian Krone that must be paid to buy one New Zealand dollar. It quoted as 1 NZD per X NOK. For instance, if the current value of NZD/NOK is 6.0549, then 6.0549 NOK is required to buy one NZD.

Spread

Spread is the keyway through which stockbrokers make income. The selling price and buying price are different; the distinction between these prices is termed as the spread. It ranges from broker to broker and their implementation type. Below are the spreads for NZD/NOK currency pairs in both ECN & STP account models:
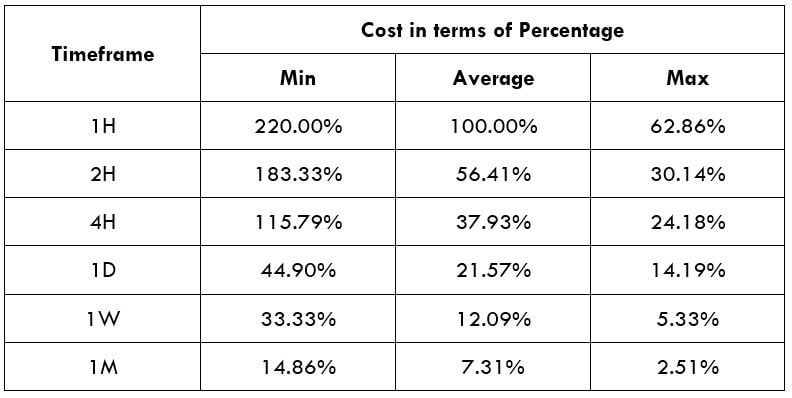
ECN: 20 pips | STP: 25 pips

Fees

For every execution, there is a cost levied by the broker. This cost is also indicated as the commission/fee on a trade. This fee/commission does not apply to STP accounts; however, a few additional pips are charged.

Slippage

Slippage is the difference in the price executed by you and the price you indeed received. It occurs on market orders. Slippage varies on two factors:

  • Market’s volatility
  • Broker’s execution speed

Trading Range in NZD/NOK

The trading range is a tabular description of the pip movement in a currency pair in a variety of timeframes. These values help in evaluating the risk-on trade as it defines the minimum, average, and maximum profit that can be made on a trade.

Procedure to assess Pip Ranges

  1. Add the ATR indicator to your chart
  2. Set the period to 1
  3. Add a 200-period SMA to this indicator
  4. Shrink the chart so you can assess a large time period
  5. Select your desired timeframe
  6. Measure the floor level and set this value as the min
  7. Measure the level of the 200-period SMA and set this as the average
  8. Measure the peak levels and set this as Max.

NZD/NOK Cost as a Percent of the Trading Range

The total cost of the trade shifts/changes based on the volatility of the market; hence we must figure out the instances when the costs are less to place ourselves in the market. The table below exhibits the variation in the costs based on the change in the market’s volatility.

Note: The ratio signifies the relative scale of costs and not the stable costs on the trade.

ECN Model Account

Spread = 20 | Slippage = 5 |Trading fee = 8

Total cost = Slippage + Spread + Trading Fee = 5 + 20 + 8 = 33 

STP Model Account

Spread = 25 | Slippage = 5 | Trading fee = 0

Total cost = Slippage + Spread + Trading Fee = 5 + 25 + 0 = 30

The Ideal way to trade the NZD/NOK

NZD/NOK is an exotic currency pair, and hence we can see, the average pip movement in 1hr timeframe is 120, which indicates higher volatility. The greater the volatility, the higher is the risk, and smaller is the cost of the trade and the other way around. Taking an instance, we can see from the trading range that when the pip movement is smaller, the charge is elevated, and when the pip movement is higher, the charge is lower.

To further decrease our costs of trade, we may place trades using limit orders as an alternative to the market orders. In the below table, we will see the interpretation of the cost percentages when limit orders are applied. As we can see, the slippage is zero. In doing so, the slippage will be excluded from the calculation from the total costs. And this will help us in lowering the trading cost by a sizeable margin. An example of the same is given below.

STP Model Account (Using Limit Orders)

Spread = 25 | Slippage = 0 | Trading fee = 0

Total cost = Slippage + Spread + Trading Fee = 0 + 25 + 0 = 25

Categories
Forex Assets

Everything About Trading The NZD/RON Forex Exotic Pair

Introduction

NZD/RON is the acronym for the New Zealand Dollar against the Romanian Leu. It is categorized as an exotic-cross currency pair that usually has a low trading volume. Here, the New Zealand Dollar is the base currency, and the Romanian Leu (on the right) is the quote currency. The RON (Romanian Leu) is the formal currency of Romania, and one RON is further divided into 100 bani.

Understanding NZD/RON

To identify the relative value of one currency, we require another currency to compare. If the base currency’s value comes down, the value of the quote currency goes up and contrariwise. If the market cost of this pair is 2.7393, then this amount of RON is required to buy one unit of NZD.


Spread

Foreign exchange brokers have two separate prices for currency pairs, which are categorized as the ask and bid price. The offering price is the bid price, and the buying price is the asking price. The difference between the bid/ask price is recognized as the spread. The spread is how stockbrokers make their revenue. Below are the spreads for NZD/RON currency pairs in both ECN & STP brokers.

ECN: 35 pips | STP: 40 pips

Fees

A Fee is a payment we pay to the broker each time we open a spot. There is no additional payment charged on STP accounts, but a few extra pips are charged on ECN accounts.

Slippage

Slippage is the difference between the trader’s predicted price and the actual price at which the trade is implemented. It can appear at any given time but often arises when the market is moving fast and is volatile.

Trading Range in NZD/RON

The amount of money we earn or lose in a timeframe can be estimated using the trading range table. It is an example of the minimum, average, and maximum pip movement in a currency pair. This can be measured simply by using the ART indicator with 200-period SMA.

Procedure to assess Pip Ranges

  1. Add the ATR indicator to your chart
  2. Set the period to 1
  3. Add a 200-period SMA to this indicator
  4. Shrink the chart so you can assess a large time period
  5. Select your desired timeframe
  6. Measure the floor level and set this value as the min
  7. Measure the level of the 200-period SMA and set this as the average
  8. Measure the peak levels and set this as Max.

NZD/RON Cost as a Percent of the Trading Range

The cost of trade generally differs on the broker and differs based on the volatility of the market. This is because the total cost also comprises slippage and spreads, excluding the trading fee. Below is the understanding of the cost variation in terms of percentages. The insights of it are discussed in the subsequent sections.

ECN Model Account

Spread = 35 | Slippage = 5 |Trading fee = 8

Total cost = Slippage + Spread + Trading Fee = 5 + 35 + 8 = 48  


STP Model Account

Spread = 40 | Slippage = 5 | Trading fee = 0

Total cost = Slippage + Spread + Trading Fee = 5 + 40 + 0 = 45

The Ideal way to trade the NZD/RON

Understanding the above tables is pretty simple. The percentage values are directly relative to the total cost of the trade. It is seen that the percentages are relatively high on the minimum column and vice versa. Now, coming to the best time to enter the market, it is when the volatility of NZD/RON is somewhere near the avg pip movement. Trading in such minutes will guarantee low costs as well as lower liquidity.

Speaking about timeframes, trading in 4H and Daily timeframe would be great, as the cost is manageable, and the trade is also not very time-consuming.

Another simple hack to cut down the cost is by trading using limit/pending orders instead of market orders. This will considerably lower costs on a trade because the slippage on the trade becomes 0. It many cases, the cost lowers by about 50% of the original value when we use limit orders.

Categories
Forex Assets

Everything About Trading The CHF/THB Forex Exotic Pair

Introduction

CHF/THB is the abbreviation for the Swiss Franc against the Thai Baht. It is classified as an exotic-cross currency pair as it usually has a low trading volume. In this case, the Swiss Franc (on the left) is the base currency, and the Thai Baht (on the right) is the quote currency. The THB is the official currency of Thailand, and it is further split up into 100 satangs.

Understanding CHF/THB

The market price of CHF represents the value of THB that is required to purchase one CHF(Swiss Franc). It is quoted as 1 CHF per X THB. If the market cost of this pair is 34.350, then this amount of THB is required to buy one unit of CHF.

Spread

The distinction between the asking price and the offering price is labeled as the spread. ECN and STP account model will have various spread values; The approximate spread values of CHF/THB pair in both the accounts are mentioned below:

ECN: 30 pips | STP: 35 pips

Fees

The fee is the commission that one pays while entering a trade. A few extra pips are charged on ECN accounts, but there is no fee charged on STP accounts.

Slippage

The mathematical difference between the price expected by the trader and the given price by the broker can be termed slippage. Its cost varies on two factors, i.e., the market’s high volatility and broker’s implementation speed.

Trading Range in CHF/THB

The trading range helps us understand the minimum, average, and maximum pip movement in various time frames. These values assist us in determining the risk, which could be caused by trade. The same is in shown in the below table:

Procedure to assess Pip Ranges

  1. Add the ATR indicator to your chart
  2. Set the period to 1
  3. Add a 200-period SMA to this indicator
  4. Shrink the chart so you can assess a large time period
  5. Select your desired timeframe
  6. Measure the floor level and set this value as the min
  7. Measure the level of the 200-period SMA and set this as the average
  8. Measure the peak levels and set this as Max.

CHF/THB Cost as a Percent of the Trading Range

The cost variations in trade can be determined by applying the total cost to the table mentioned below. The cost percentage of the trading range represents the difference in fees on the trade and various time frames for differing volatility.

ECN Model Account

Spread = 30 | Slippage = 5 |Trading fee = 8

Total cost = Slippage + Spread + Trading Fee = 5 + 30 + 8 = 43 

STP Model Account

Spread = 35 | Slippage = 5 | Trading fee = 0

Total cost = Slippage + Spread + Trading Fee = 5 + 35 + 0 = 40

The Ideal way to trade the CHF/THB

The CHF/THB is an exotic-cross currency pair, and this market’s volatility is moderate. For instance, the average pip movement on the 1H timeframe is 51 pips. We should understand the higher the volatility, the lower will be the cost to implement the trade. However, this is not an added advantage as trading in a volatile market means more risk.

For example, in the 1M time frame, the Maximum pip range value is 1984, and the minimum is 310. When we evaluate the trading fees for both the pip movements, we can see that for 310pip movement fess is 13.87%, and for the 1984 pip movement, the fee is only 2.17%. With the mentioned example, we can conclude that trading the CHF/THB currency pair will be comparatively expensive.

Categories
Forex Assets

Trading The CHF/MYR Exotic Forex Pair & Comprehending The Costs Involved

Introduction

CHF/MYR is the abbreviation for the Swiss Franc against the Malaysian Ringgit, and it is considered an exotic currency pair. In this case, the CHF is the base currency, and the MYR is the quote currency. The franc is the official currency of Switzerland and Liechtenstein, while MYR is the official currency of Malaysia.

Understanding CHF/MYR

The market value of CHF/MYR defines MYR’s value that is obliged to buy one franc. It is priced as 1 CHF per X MYR. If the price of the pair is 4.5465 in the market, then these many Malaysian ringgit units are required to buy one CHF.

Spread

The distinction in price between the bid and ask price is determined as Spread. Bid and ask prices are set by the broker. This pip difference is where most of the brokers generate their revenue. Below are the Spread values of CHF/MYR Forex pair in both ECN & STP accounts.

ECN: 44 pips | STP: 49 pips

Fees

The fee is the price you spend on each spot you open with the broker. There is no fee imposed on STP account models, but a few extra pips are charged on ECN accounts.

Slippage

The difference between the price at which, trader implements the trade, and the price he receives from the broker is termed Slippage. This fluctuates based on the broker’s execution speed and the market’s volatility.

Trading Range in CHF/MYR

The total money you will gain or lose in a particular timeframe can be measured utilizing the trading range table. This represents the maximum, average, and minimum pip movement in a currency pair.

Procedure to assess Pip Ranges

  1. Add the ATR indicator to your chart
  2. Set the period to 1
  3. Add a 200-period SMA to this indicator
  4. Shrink the chart so you can assess a large time period
  5. Select your desired timeframe
  6. Measure the floor level and set this value as the min
  7. Measure the level of the 200-period SMA and set this as the average
  8. Measure the peak levels and set this as Max.

CHF/MYR Cost as a Percent of the Trading Range

The cost of trade alters based on the volatility of the market. This is for the reason that the total cost involves Slippage and spreads apart from the trading fee. Below is the interpretation of the cost variant in terms of percentages. The understanding of it is reviewed in the following sections.

ECN Model Account

Spread = 44 | Slippage = 5 |Trading fee = 8

Total cost = Slippage + Spread + Trading Fee = 5 + 44 +8 = 57

STP Model Account

Spread = 49 | Slippage = 5 | Trading fee = 0

Total cost = Slippage + Spread + Trading Fee = 5 + 49 + 0 = 54

Trading the CHF/MYR

The CHF/MYR is not an extremely volatile currency pair. For instance, the average pip movement on the 1H timeframe is only 84 pips. Note that the elevated the volatility, the smaller is the cost of the trade. However, this cannot be considered a benefit as it is risky to trade extremely volatile markets.

Also, the higher or lesser the percentages, the higher or lower are the costs on the trade. We can conclude that the costs are elevated for low volatile markets and high for extremely volatile markets.

To reduce your risk, it is proposed to trade when the volatility is near the average standards. In this case, the volatility is low, and the costs are slightly high related to the average and the maximum values. But, if your primary concern is on lowering costs, you may trade when the market volatility is near the maximum values.

Categories
Forex Assets

Trading Costs Involved While Trading The ‘CHF/SEK’ Forex Exotic Pair

Introduction

The acronym of CHF/SEK is Swiss Franc, paired with the Swedish Krona. In this exotic Forex pair, CHF is the official currency of Switzerland and is also the fifth highly traded currency in the Forex market. In contrast, SEK stands for the Swedish Krona, and it is the official currency of Sweden.

Understanding CHF/SEK

In the Forex market, to ascertain the relative value of one currency, we need an alternate currency to assess. The market value of CHF/SEK helps us to understand the power of SEK versus the CHF. So, if the trade rate for the pair CHF/SEK is 9.8418, it means to buy 1 CHF, we need 9.8418 SEK.

CHF/SEK Specification

Spread

Spread is the variable between the ask-bit price that is set at the exchanges. Below are the spread values of the CHF/SEK currency pair in both ECN & STP accounts. The spread charges for ECN and STP brokers for CHF/SEK are given below.

ECN: 45 | STP: 50

Fees

For every place, a trader enters the broker charges some fee for it. A trader must know that this fee is applicable on ECN accounts only and not on STP accounts.

Slippage

Slippage is the price variation between the trader’s execution and at which the broker implemented the price. The variance is due to high market volatility and slow execution speed.

Trading Range in CHF/SEK

A trading range is the interpretation of the volatility in CHF/SEK in numerous timeframes. The values are attained from the Average True Range indicator. One can use the table as a risk management tool to distinguish the profit/loss that a trader is possessed.

Below is a table explaining the minimum, average, and max volatility (pip movement) on a variety of timeframes.  

 Procedure to assess Pip Ranges

  1. Add the ATR indicator to your chart
  2. Set the period to 1
  3. Add a 200-period SMA to this indicator
  4. Shrink the chart so you can assess a large time period
  5. Select your desired timeframe
  6. Measure the floor level and set this value as the min
  7. Measure the level of the 200-period SMA and set this as the average
  8. Measure the peak levels and set this as Max.

CHF/SEK Cost as a Percent of the Trading Range

The entire cost of the trade varies based on the volatility of the market. So, we must find out the instances when the costs are less to place ourselves in the market. Below is a table explaining variation in the costs based on the change in the market volatility.

Note: The percentage costs represent the comparative scale of costs and not the fixed costs on the trade.

ECN Model Account

Spread = 45 | Slippage = 5 | Trading fee = 8

Total cost = Slippage + Spread + Trading Fee = 5 + 45 + 8= 58

STP Model Account

Spread = 50 | Slippage = 5 | Trading fee = 0

Total cost = Slippage + Spread + Trading Fee = 5 + 50 + 0 = 55

The Ideal way to trade the CHF/SEK

The two components a trader should consider while trading any security in the markets are – Volatility & Cost. With the help of the above tables, let us evaluate these two factors to trade the CHF/SEK ideally.

We can see that the pip difference is substantially high among the minimum volatility and the average volatility in every timeframe. For a day trader, the objective is to make revenue from the pip movement of the market. But, if there is barely any pip movement in the price, it becomes difficult to make profits out of the market. Therefore, it is perfect to trade when the volatility is at the average value.

The cost increases as the volatility decline, and they are inversely proportional to each other. In other words, highly volatile markets have the lowest costs. However, it is relatively risky to trade markets with higher volatility though the costs are low. Therefore, to maintain stability among the cost and volatility, traders may discover instances when the volatility is close to the average values or a little above it.

Categories
Forex Assets

Analyzing The ‘CHF/AED’ Forex Exotic Pair

Introduction

CHF/AED is the short form for the Swiss Franc against the United Arab Emirates Dirham. It is considered an exotic currency pair. Currencies are always traded in pairs in the Forex market. The main currency in the pair is considered the base currency, while the sequential one is the quote currency.

Understanding CHF/AED

The market value of CHF/AED determines the value of AED required to buy one Swiss Franc. It is priced as 1 CHF per X AED. Hence, if the market price of this pair is 3.8835, these many United Arab Emirates Dirham units are necessary to buy one CHF.

Spread

The spread is the distinction between the ask-bid price. Mostly, these two prices are set by the stockbrokers. The gap between the pip values is through which brokers generate revenue. Below are the ECN & STP Spread values of CHF/AED pair.

ECN: 19 pips | STP: 24 pips

Fees

The fee is the minimum commission you pay to the broker on every single spot you open. There is no fee to be paid on STP accounts, but a few additional pips on ECN accounts.

Slippage

Slippage is the distinction between the price at which the trader implemented the trade and the original price he got from the broker – this changes based on the volatility of the market and the broker’s implementation speed.

Trading Range in CHF/AED

The trading range table will help you determine the amount of money that you will win or lose in every timeframe. This table signifies the minimum, average, and maximum pip movement in a currency pair.

Procedure to assess Pip Ranges

  1. Add the ATR indicator to your chart
  2. Set the period to 1
  3. Add a 200-period SMA to this indicator
  4. Shrink the chart so you can assess a large time period
  5. Select your desired timeframe
  6. Measure the floor level and set this value as the min
  7. Measure the level of the 200-period SMA and set this as the average
  8. Measure the peak levels and set this as Max.

CHF/AED Cost as a Percent of the Trading Range

The price of the trade alters based on the volatility of the market. Hence, the total cost comprises slippage and spreads, excluding from the trading fee. Below is the analysis of the cost difference in terms of percentages.

ECN Model Account

Spread = 19 | Slippage = 5 |Trading fee = 8

Total cost = Slippage + Spread + Trading Fee = 5 + 19 + 8 = 32 

STP Model Account

Spread = 24 | Slippage = 5 | Trading fee = 0

Total cost = Slippage + Spread + Trading Fee = 5 + 24 + 0 = 29

Trading the CHF/AED

The CHF/AED is not a very volatile pair. For example, the average pip movement on the 1H timeframe is only 42 pips. If the volatility is more significant, then the cost of the trade is low. Nevertheless, it involves a higher risk to trade highly volatile markets.

Also, the higher/lesser the proportions, the greater/smaller are the costs on the trade. We can then determine that the costs are higher for low volatile markets and high for highly volatile markets.

To reduce your risk, it is recommended to trade when the volatility is around the minimum values. The volatility here is low, and the costs are slightly high, corresponding to the average and the maximum values. But, if the priority is towards reducing costs, you could trade when the volatility of the market is near the maximum values.

Benefits on Limit orders

For orders that are implemented as market orders, there is slippage applied to the trade. But, with limit orders, there is no slippage valid. Only the spread and the trading fees will be accounted for estimating the total costs. Therefore, this will bring down the cost noticeably.

STP Model Account (Limit Orders)

Spread = 24 | Slippage = 0 | Trading fee = 0

Total cost = Slippage + Spread + Trading Fee = 0 + 24 + 0 = 24

Categories
Forex Assets

Asset Analysis – Trading The CHF/BRL Exotic Forex Pair

Introduction

The abbreviation of CHF/BLR is Swiss Franc, paired with the Brazilian Real. In this pair, CHF is the native currency of Switzerland and is also the fifth vastly traded currency in the Forex market. Likewise, BRL stands for the Brazilian Real, and it is the official currency of Brazil. This is classified as an exotic Forex pair.

Understanding CHF/BRL

In the Forex market, to ascertain the relative value of one currency, we need another currency for comparison. When we buy a currency (recognized as the base currency), we are indirectly selling another currency (known as the quote currency). The market value of CHF/BRL helps us to comprehend the power of BRL against the CHF. So, if the trade rate for the pair CHF/BRL is 5.7715, it means to buy 1 CHF, we need 5.7715 BRL.

CHF/BRL Specification

Spread

Spread is the difference among the bid-ask price that is set at the exchanges. Below are the spread values of the CHF/BRL currency pair in both ECN & STP accounts. The spread charges for ECN and STP brokers for CHF/BRL pair are as follows:

ECN: 24 | STP: 29

Fees

For every spot, a trader enters the stockbroker charges a specific fee for it. Traders must know that this fee is charged only on ECN accounts and does not apply to STP accounts.

Slippage

Slippage is the price distinction between the broker executed price and the trader execution price. The difference is caused due to the market’s high volatility and slow execution speed.

Trading Range in CHF/BRL

A trading range is the explanation of the volatility in CHF/BRL in numerous timeframes. The values are attained from the Average True Range indicator. One can use the table as a risk management tool to distinguish the profit/loss that a trader is possessed.

Below is a table indicating the minimum, average, and max pip movement in several timeframes.

Procedure to assess Pip Ranges

  1. Add the ATR indicator to your chart
  2. Set the period to 1
  3. Add a 200-period SMA to this indicator
  4. Shrink the chart so you can assess a large time period
  5. Select your desired timeframe
  6. Measure the floor level and set this value as the min
  7. Measure the level of the 200-period SMA and set this as the average
  8. Measure the peak levels and set this as Max.

CHF/BRL Cost as a Percent of the Trading Range

The total cost of the trade changes based on the volatility of the market, hence we must number out the occasions when the costs are less to place ourselves in the market. The table below displays the variation in the costs based on the change in the market’s volatility.

Note: The ratio represents the relative scale of costs and not the fixed costs on the trade.

ECN Model Account

Spread = 24 | Slippage = 5 | Trading fee = 8

Total cost = Slippage + Spread + Trading Fee = 5 + 24 + 8= 37

STP Model Account

Spread = 29 | Slippage = 5 | Trading fee = 0

Total cost = Slippage + Spread + Trading Fee = 5 + 29 + 0 = 34


The Ideal way to trade the CHF/BRL

With the help of the above tables, let us assess these two factors to the trade the CHF/BRL. Volatility and cost are two elements a trader must consider for trading any security in the Forex market.

In various timeframes, we can see the pip movement being very high between the minimum volatility and the average volatility. As a day trader, the aim is to make profits from the pip variation in the market. It becomes tricky to extract some profits from the market if there are no variations in the pip value.

When the cost goes higher, the volatility of the market decreases. In other words, the market with high volatility have minimal costs. To strike a balance between the volatility and the cost, traders should find an appropriate time when the volatility is close to the average values or slightly about it.

Additionally, traders can also reduce their total costs by placing ‘limit orders’ instead of ‘market orders.’ This will ultimately cut the slippage on the trade and consequently lower the total cost. In the below example, the total cost would decrease by five pips, which is a modest reduction for just altering the type of order execution.

STP Model Account (With Limit Orders)

Total cost = Slippage + Spread + Trading Fee = 0 + 29 + 0 = 29

Categories
Forex Assets

Analyzing The Costs Involved While Trading The ‘CHF/BGN’ Exotic Pair

Introduction

CHF/BGN is the abbreviation for the Swiss Franc and the Bulgarian Lev exotic pair. Here, CHF is the base currency, while BGN is the quote currency. The pair as a whole explains the number of units of the quote currency (BGN) that is required to buy a single unit of the base currency (CHF). BGN stands for The Bulgarian Lev, and it is the official currency of Bulgaria.

Understanding CHF/BGN

In the Forex market, we always purchase the base currency while selling the quote currency and vice versa. Here, the market value of CHF/BGN helps us to comprehend the potential of BGN against the CHF. So if the exchange rate of the pair CHF/BGN is 1.8384, it means to buy1 CHF we need 1.8391 BGN.

CHF/BGN Specification

Spread

Spread in exchange is the distinction between the bid-ask price proposed by the broker. It is quantified in terms of pips and fluctuates on the type of account and kind of broker. Below is the spread for the CHF/BGN pair in both ECN & STP accounts.
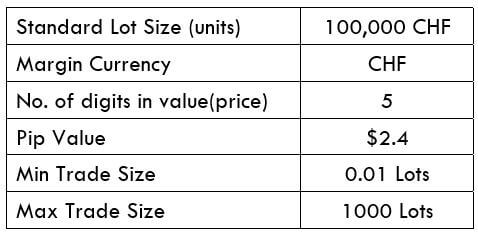
Spread on ECN: 7 | STP: 12

Fees

Fees are the commission charged by the broker for each trade a trader takes. The fee varies on both types of accounts and brokers. For our analysis, we have maintained the fee flat at five pips.

Slippage

A trader will not get the price that he demands, due to the volatility in the market. The original price varies from the asked price. The difference is termed as slippage. For instance, if a trader performs a trade at 1.8384, the actual price received would be 1.8391. The difference between the two pips is called slippage.

Trading Range in CHF/BGN

The trading range is a tabular interpretation of the min, average, and maximum pip movement in a specific timeframe. Obtaining understanding about this is essential because it helps manage risk and determine the appropriate times of the day to enter-exit a trade with minor costs.

Below is a table representing the minimum, average, and maximum pip movement (volatility) in various timeframes.

Procedure to assess Pip Ranges

  1. Add the ATR indicator to your chart
  2. Set the period to 1
  3. Add a 200-period SMA to this indicator
  4. Shrink the chart so you can assess a large time period
  5. Select your desired timeframe
  6. Measure the floor level and set this value as the min
  7. Measure the level of the 200-period SMA and set this as the average
  8. Measure the peak levels and set this as Max.

CHFBGN Cost as a Percent of the Trading Range

The above table illustrates the number of pips the currency pair move in the various timeframe. We will apply these values to identify the cost ratio when the volatility is minimum, average, and maximum. The cost percentage will then help us sort the ideal time of the day to enter the trades.

The understanding of the cost percentage is straightforward. If the percentage is elevated, then the cost is high in that specific timeframe and range. If the percentage is low, then the cost is comparatively low for that timeframe and range. The total cost on every trade is calculated by adding up the spread, slippage, and trading fee.

ECN Model Account

Spread = 7 | Slippage = 5 | Trading fee = 8

Total cost = Slippage + Spread + Trading Fee  = 5 + 7 + 8 = 20

STP Model Account

Spread = 12 | Slippage = 5 | Trading fee = 0

Total cost = Slippage + Spread + Trading Fee  = 5 + 12 + 0 = 17

The Ideal way to trade the CHF/BGN

It is not recommended to enter and exit the trade at any time of the day. To manage their trade, a trader must consider various timeframes during the day to reduce both risk and cost of the trade. This is made possible by understanding the above two tables.

In the minimum column, the percentages are generally high. This means the cost is very high when the volatility of the market is low. For example, on the 1H timeframe, when the volatility is three pips, the cost percentage is 666%. This means that one must accept high costs if they enter or exit trades when the volatility is around three pips. Preferably, it is advised to trade when the market’s volatility is above the average.

Additionally, it is considerably better if one trades placing the limit orders instead of market orders, as it invalidates the slippage on the trade. In doing so, the costs of each trade will reduce by approximately 40%.

STP Model Account (Using Limit Orders)

Spread = 12 | Slippage = 0 | Trading fee = 0

Total cost = Slippage + Spread + Trading Fee = 0 + 12 + 0 = 12

Categories
Forex Assets

Everything About Trading The CHF/DKK Forex Asset Class

Introduction

The abbreviation of CHF/DKK is Swiss Franc, paired with the Danish Krone. Here CHF is the official currency of Switzerland and is also the fifth highly traded currency in the Forex market. In contrast, DKK stands for the Danish Krone, and it is the official currency of Denmark and the provinces of Greenland and the Faroe Islands.

Understanding CHF/DKK

In the Foreign exchange market, to ascertain the comparative value of one currency, we need an alternative currency to evaluate. Once when we buy a currency, which is identified as the base currency and simultaneously sell the quote currency. The market value of CHF/DKK helps us to comprehend the power of DKK against the CHF. So if the trade rate for the pair CHF/DKK is 6.9915, it means to buy 1 CHF, we need 6.9915 DKK.

CHF/DKK Specification

Spread

A spread is described as a distinction between the buying & offering price of a Forex pair. In other words, it is a distinction between the ask-bid price of an asset. Below is the spread charges for ECN and STP stock brokers for CHF/DKK pair.

ECN: 12 | STP: 17

Fees

A Fee is a cost that we traders pay to the broker for achieving a trade. The Fees differ on the type of broker (STP/ECN) we use.

Slippage

When we want to implement a trade at a specific market rate, but as a replacement for it, the trade gets implemented at a different rate, and that is because of the slippage. Slippage occurs when we deal with a volatile market, and when we execute a large order at the same time.

Trading Range in CHF/DKK

The trading range in the table below will ascertain the amount of money we will gain or lose in each timeframe. We have the interpretation of the minimum, average, and maximum pip movement in a currency pair in the below table. Now we will use the ATR indicator that demonstrates the price movement in a currency pair.

Below is a table demonstrating the minimum, average, and max volatility (pip movement) on numerous timeframes.

Procedure to assess Pip Ranges

  1. Add the ATR indicator to your chart
  2. Set the period to 1
  3. Add a 200-period SMA to this indicator
  4. Shrink the chart so you can assess a large time period
  5. Select your desired timeframe
  6. Measure the floor level and set this value as the min
  7. Measure the level of the 200-period SMA and set this as the average
  8. Measure the peak levels and set this as Max.

CHF/DKK Cost as a Percent of the Trading Range

The price of trade differs on the type of broker and fluctuates based on the volatility of the market. The aggregated cost of trade involves spread, fees, and occasionally slippage if the volatility is high. To reduce the cost of the trade, we can use limit orders as an alternative for market execution.

ECN Model Account

Spread = 12 | Slippage = 5 | Trading fee = 8

Total cost = Slippage + Spread + Trading Fee = 5 + 12 + 8= 25

STP Model Account

Spread = 17 | Slippage = 5 | Trading fee = 0

Total cost = Slippage + Spread + Trading Fee = 5 + 17 + 0 = 22

The Ideal way to trade the CHF/DKK

CHF/DKK is an exotic currency pair. Here, the average pip movement in 1hr timeframe is 99, which implies higher volatility. The greater the volatility, the greater is the risk and low cost of the trade and the other way around. Considering the above tables, we can see from the trading range that when the pip movement is lower, the proportion is high, and when the pip movement is elevated, the proportion is low.

The ratios are higher in the minimum column. This indicates the cost is high when the volatility of the market is lower. For example, on the 1H timeframe, when the volatility is 24 pips, the cost percentage is 104.17%. Meaning, one must accept high costs if they enter or exit trades when the volatility is around 24 pips. So, preferably, it is suggested to trade when the market volatility is higher than the average.

Categories
Forex Assets

CHF/SGD – Trading Costs Involved While Trading This Forex Exotic Pair

Introduction

CHF/SGD is the short form for the Swiss Franc against the Singapore Dollar. It is classified as an exotic Forex currency pair. Currencies in the Forex market are always traded in pairs. The key currency in the pair (CHF) is the base currency, while the subsequent one (SGD) is the quote currency.

Understanding CHF/SGD

The market value of CHF/SGD determines the value of SGD required to buy one Swiss Franc. It is quoted as 1 CHF per X SGD. Therefore, if the market price of this pair is 1.4699, then these many Singapore Dollar units are necessary to buy one CHF.

Spread

The spread is the distinction between the bid-ask price. Generally, these two prices are set by the stockbrokers. The pip contrast is through which brokers generate revenue.

ECN: 12 pips | STP: 17 pips

Fees

The fee is the commission you pay to the broker on each spot you open. There is no fee charged on STP account models, but a few extra pips on ECN accounts.

Slippage

Slippage is the distinction between the price at which the trader implemented the trade and the actual price he got from the broker – this change based on the volatility of the market and the broker’s implementation speed.

Trading Range in CHF/SGD

The trading range table will help you ascertain the amount of money that you will win or lose in each timeframe. This table represents the minimum, average, and maximum pip movement in a currency pair.

Procedure to assess Pip Ranges

  1. Add the ATR indicator to your chart
  2. Set the period to 1
  3. Add a 200-period SMA to this indicator
  4. Shrink the chart so you can assess a large time period
  5. Select your desired timeframe
  6. Measure the floor level and set this value as the min
  7. Measure the level of the 200-period SMA and set this as the average
  8. Measure the peak levels and set this as Max.

CHF/SGD Cost as a Percent of the Trading Range

The price of the trade fluctuates based on the volatility of the market. Therefore, the total cost involves slippage and spreads, excluding from the trading fee. Below is the interpretation of the cost difference in terms of percentages.

ECN Model Account

Spread = 12 | Slippage = 5 |Trading fee = 8

Total cost = Slippage + Spread + Trading Fee = 5 + 12 + 8 = 25

STP Model Account

Spread = 17 | Slippage = 5 | Trading fee = 0

Total cost = Slippage + Spread + Trading Fee = 5 + 17 + 0 = 22

Trading the CHF/SGD

The CHF/SGD is not a volatile pair. For example, the average pip movement on the 1H timeframe is only 22 pips. If the volatility is higher, then the cost of the trade is low. However, it involves an elevated risk to trade highly volatile markets. Also, the higher/lesser the percentages, the greater/smaller are the costs on the trade. So, we can conclude that the costs are higher for low volatile markets and high for highly volatile markets.

To diminish your risk, it is advised to trade when the volatility is around the average values. The volatility here is low, and the costs are a slightly high matched to the average and the maximum values. But, if the priority is towards lowering costs, you could trade when the volatility of the market is near the maximum values with optimal risk management.

Advantage on Limit orders (STP Model Account)

For orders that are executed as market orders, there is slippage applicable to the trade. But, with limit orders, there is certainly no slippage applicable. Only the spread and the trading fees will be accounted for by calculating the total costs. Hence, this will bring down the cost considerably.

Spread = 17 | Slippage = 0 | Trading fee = 0

Total cost = Slippage + Spread + Trading Fee = 0 + 17 + 0 = 17

Categories
Forex Assets

Asset Analysis – Trading The ‘CHF/PLN’ Forex Exotic Pair

Introduction

CHF/PLN is the abbreviation for the Swiss Franc alongside the Poland złoty. It is categorized as an exotic currency pair that usually has high volatility and low trading volume. Here, the CHF is the base currency, and the PLN is the quote currency. CHF is the official currency of Switzerland, whereas PLN is the national currency of Poland.

Understanding CHF/PLN

The current value of the pair represents the value of PLN that is corresponding to one CHF. It is quoted as 1 CHF per X PLN. For example, if the value of this pair is 4.1627, these many units of PLN are required to buy one Swiss Franc.

CHF/PLN Specification

Spread

In trading, the difference between the bid-ask price is described as the spread. Spread normally fluctuates from broker to broker. The estimated spread on ECN and STP accounts is given below.

ECN: 49 | STP: 54

Fees

There is a small fee or payment charged by the broker for each trade a trader does. This varies on both types of accounts and broker. There are zero fees charged on STP accounts, but a few extra pips are charged on ECN accounts.

Slippage

The difference between the cost at which the trader executed the trade and the cost he received from the broker is termed as Slippage. Fundamentally, Slippage hangs on two factors – Broker’s execution & market’s volatility

Trading Range in CHF/PLN

The trading range is a tabular interpretation of the minimum, average, and maximum pip movement in a different timeframe. Having expertise about this is necessary because it helps in handling risk as well as determine the appropriate times of the day to enter and exit a trade with marginal costs. Below is a table that illustrates the minimum, average, and maximum volatility (pip movement) on several timeframes.

Procedure to assess Pip Ranges

  1. Add the ATR indicator to your chart
  2. Set the period to 1
  3. Add a 200-period SMA to this indicator
  4. Shrink the chart so you can assess a large time period
  5. Select your desired timeframe
  6. Measure the floor level and set this value as the min
  7. Measure the level of the 200-period SMA and set this as the average
  8. Measure the peak levels and set this as Max.

CHF/PLN Cost as a Percent of the Trading Range

The number of pips the currency pair change in various timeframes is demonstrated in the table above. With this, we apply these values to get the cost percentage when the volatility is minimum, average, and maximum. This cost percentage will help us sort out an ideal time of the day to enter trades.

The understanding of the cost percentage is easy. If the percentage is above average, then the cost is higher for that specific timeframe and range. If the percentage is at a low level, then the cost is comparatively low for that timeframe and range. Note that, the total cost on a particular trade is calculated by combining the spread, Slippage, and trading fee.

ECN Model Account

Spread = 49 | Slippage = 5 | Trading fee = 8

Total cost = Slippage + Spread + Trading Fee = 5 + 49 + 8= 62 

STP Model Account

Spread = 54 | Slippage = 5 | Trading fee = 0

Total cost = Slippage + Spread + Trading Fee = 5 + 54 + 0 = 59

The Ideal way to trade the CHF/PLN

There are specific times a trader must deal with their trade to decrease both hazard and cost on the trade. This can be made feasible by understanding the above tables. Entering and exiting trades during any time of the day is highly not advised.

The percentages are most elevated in the min column. This means the cost is fairly high when the volatility of the market is low. For instance, on the 1H timeframe, when the volatility is 27 pips, the cost percentage is 218.5%. Meaning, one must bear high costs if they open or close trades when the volatility is around 27 pips. So, ideally, it is proposed to trade when the market volatility is above the average mark.

Categories
Forex Assets

How Best To Trade The ‘CHF/AUD’ Forex Currency Pair?

Introduction

CHF/AUD is the acronym for the Swiss Franc against the Australian Dollar, and it is an exotic Forex currency pair. Here, the CHF is the base currency, and the AUD is the quote currency. Both CHF and AUD are major currencies and are vastly traded in the foreign exchange market. CHF is the official currency of Switzerland, while AUD is the national currency of Australia.

Understanding CHF/AUD

The price of this pair in the trade market defines the value of AUD equivalent to one Swiss Franc. It is quoted as 1 CHF per X AUD. For instance, if the value of this pair is 1.5318, these many Australian Dollars are required to acquire one CHF. 

Spread

The difference between the ask-bid price is referred to as Spread, which is charged by the broker. This value is different in the ECN and STP accounts. The estimated Spreads for CHF/AUD pair is given below.

ECN: 17 pips | STP: 22 pips

Fees & Slippage

A fee is a price that one pays for the trade. There are zero fees charged on STP accounts, but a few pips are charged on ECN accounts. Slippage is the difference calculated between the price by the trader and the price the trader received from the broker.

Trading Range in CHF/AUD

The trading range is represented in the tabular format to showcase the pip movement of a currency pair in various timeframes. These values are useful in ascertaining the profit that can be generated from trade in advance. To discover the trading costs, we must multiply the below volatility value with the pip value of this pair.

Procedure to assess Pip Ranges

  1. Add the ATR indicator to your chart
  2. Set the period to 1
  3. Add a 200-period SMA to this indicator
  4. Shrink the chart so you can assess a large time period
  5. Select your desired timeframe
  6. Measure the floor level and set this value as the min
  7. Measure the level of the 200-period SMA and set this as the average
  8. Measure the peak levels and set this as Max.

CHF/AUD Cost as a Percent of the Trading Range

The trading range is obtained by identifying the ratio between total cost and volatility; it expressed in terms of percentage. Below is the representation of the cost differences of traders in various timeframes and volatilities.

ECN Model Account

Spread = 17 | Slippage = 5 |Trading fee = 8

Total cost = Slippage + Spread + Trading Fee = 5 + 17 + 8 = 30

STP Model Account

Spread = 22 | Slippage = 5 | Trading fee = 0

Total cost = Slippage + Spread + Trading Fee = 5 + 22 + 0 = 27

Trading the CHF/AUD

When the percentage value is higher, the cost of the trade gets more expensive. From the above tables, we can conclude the values are significant in the min column and relatively less significant in the max column. It means that the costs are high when the market’s volatility is low. It is not advisable to trade when both the volatility and cost of trading is high. Balancing both these factors is ideal to trade when the pair’s volatility is in the range of the average values.

Additionally, to lower your costs even further, you can place trades using limit orders instead of market orders. By executing limit orders, the slippage will not be involved in the calculation of the total costs. And this will set the cost of the trades low by a decent number. An example of the same is given below.

STP Model Account (Using Limit Orders)

Spread = 22 | Slippage = 0 |Trading fee = 0

Total cost = Slippage + Spread + Trading Fee = 0 + 22 + 0 = 22

Categories
Forex Assets

Asset Analytics – Trading The CHF/HKD Foreign Exchange Pair

Introduction

CHF/HKD is the abbreviation for the Swiss Franc against the Hong Kong Dollar. It is categorized as an exotic currency pair that usually has high volatility and low trading volume. Here, the CHF (on the left) is the base currency, and the HKD (on the right) is the quote currency.

Understanding CHF/HKD

The market price of CHF/HKD represents the value of HKD that are obliged to purchase to one CHF. It is quoted as 1 CHF per X HKD. If at all the market price of this pair is 8.1718, then this amount of HKD is required to buy one CHF.  


Spread

The difference between the bid-ask price is described as the spread. Its value differs from the ECN account model and STP account model. The approximate value for the two is specified below:

ECN: 35 pips | STP: 40 pips

Fees

A fee is a price that one pays to the broker for executing a trade. There is no fee charged on STP accounts, but a few pips are charged on ECN accounts.

Slippage

The difference between price called for by the client and price that was offered by the broker is described as the slippage. Its value varies on the volatility of the market and the broker’s execution.

Trading Range in CHF/HKD

The trading range is that the tabular representation of the pip movement of a currency pair in several timeframes. These values are useful in determining the profit, which will be generated from trade in advance. To seek out the worth, you need to multiply the below volatility value with the pip value of this pair.

Procedure to assess Pip Ranges

  1. Add the ATR indicator to your chart
  2. Set the period to 1
  3. Add a 200-period SMA to this indicator
  4. Shrink the chart so you can assess a large time period
  5. Select your desired timeframe
  6. Measure the floor level and set this value as the min
  7. Measure the level of the 200-period SMA and set this as the average
  8. Measure the peak levels and set this as Max.

CHFHKD Cost as a Percent of the Trading Range

By implementing the total cost to the mentioned table, we can ascertain the cost differences in a trade. The values are attained by finding a proportion between total cost and volatility value and are indicated as a percentage.

ECN Model Account

Spread = 35 | Slippage = 5 |Trading fee = 8

Total cost = Slippage + Spread + Trading Fee = 5 + 35 + 8 = 48 

STP Model Account 

Spread = 40 | Slippage = 5 | Trading fee = 0

Total cost = Slippage + Spread + Trading Fee = 5 + 40 + 0 = 45

The Ideal way to trade the CHF/HKD

Comprehending the above tables is important. The ratio to the total cost of trade is directly proportional to the value. It is seen that the rates are nearly high on the min section (less volatility) and the other way around. Now, the perfect chance to enter the market would be the point at which the volatility of CHF/HKD is somewhere between the average pip movement. Trading this pair during such minutes will guarantee low trading costs just as lower liquidity.

You can reduce the trading costs by placing orders using limit/pending orders instead of market orders. This will considerably reduce the total cost with slippage being zero. I hope this article will assist you in trading this pair in a much efficient way. Cheers!

Categories
Forex Assets

Asset Analysis – Analyzing The XAG/USD Asset Class

Introduction

Silver is a precious metal standing after Gold. It is a vital asset to understand and forecast the potential movements in the commodity market. This is because buyers and sellers trade the silver market based on global macro trends. Moreover, Silver highly correlates with the Gold Spot prices. XAG/USD is the ticker for Silver against the US Dollar. XAG can be traded against other fiat currencies as well.

Understanding XAG/USD

Silver is a commodity that is traded in troy ounces (Oz), just like any other precious metal. The market price of XAG/USD represents the value of the US Dollar for 1 ounce (Oz) of Silver. It is quoted as 1 XAG per X USD. For example, if the market price of XAG/USD is 17.432, it signifies that each ounce of Gold is worth $17.432.

XAG/USD Specification

Spread

Spread is essentially the difference between the buying price and the selling price. The spread varies on the based account-model used.
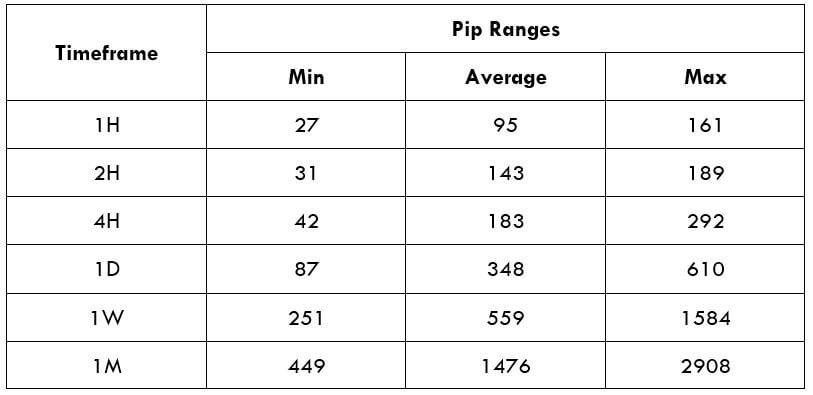
ECN: 15 | STP: 21

Fee

A fee is basically the commission on the trade. It applies only to ECN accounts, not STP accounts.

Slippage

The arithmetic difference between the price asked by the trader and the price given by the Broker is referred to as slippage. It occurs due to two reasons: High market volatility & Broker’s execution speed

Trading Range in XAG/USD

The minimum, average, and maximum pip movement in different time frames is represented in the following table. It can be used to assess your risk on the trade.

Procedure to assess Pip Ranges

  1. Add the ATR indicator to your chart
  2. Set the period to 1
  3. Add a 200-period SMA to this indicator
  4. Shrink the chart so you can assess a large time period
  5. Select your desired timeframe
  6. Measure the floor level and set this value as the min
  7. Measure the level of the 200-period SMA and set this as the average
  8. Measure the peak levels and set this as Max.

XAG/USD Cost as a Percent of the Trading Range

Cost a percent of the trading range is the representation of the variation in fees on the trade-in different time frames for varying volatility.

ECN Model Account

Spread = 15 | Slippage = 5 | Trading fee = 5

Total fee = Spread + Slippage + Trading fee

Total fee = 15 + 5 + 5 = 25 (pips)

STP Model Account

Spread = 21 | Slippage = 5 | Trading fee = 0

Total fee = Spread + Slippage + Trading fee

Total fee = 21 + 5 + 0 = 26 (pips)

Trading the XAG/USD

Silver Spot is extensively traded in the commodity market, after Gold Spot. It offers enough volatility and liquidity for traders to participate in the market. Silver highly correlates to Gold. Traders can use it as a proxy to place their bets on Silver prices. The technical analysis can be used on Silver as applied to any other market. Even though there is enough volatility in this pair, it is not ideal for entering any time into the market. The reason for it can be accounted for through the cost percentage table.

The cost percentage table represents how expensive a trade is going to be based on the time frame and volatility. Note that, the absolute total cost will remain the same irrespective of the two factors but will vary relatively. For instance, a 1H trader must pay the same fee a 4H trader pays for their trade. But, there a catch; the 4H trader generates more P/L than a 1H trader.

Thus, to have a balance between the P/L and fee on the trade, one must trade when the market volatility at or above the average values. Trading in low volatility markets will cause hurdles in the market to reach your target. Hence, we will have to pay the same costs, even for a small P/L.

Categories
Forex Assets

Analyzing The ‘XAU/USD’ Financial Instrument & Determining The Trading Costs Involved

Introduction

Gold is a precious metal and one of the most valuable assets in the market. It is considered to be a safe haven instrument and a popular asset class for hedging positions during market uncertainty. XAU/USD is the abbreviation for the pair Gold Spot against the US Dollar. XAU is the ticker for Gold Spot. It can be traded against other fiat currencies like EUR and GBP as well.

Understanding XAU/USD

Gold Spot is an asset that is traded in troy ounces (Oz). The XAU/USD market price represents the value of the US Dollar for 1 ounce (Oz) of Gold. It is quoted as 1 XAU per X USD. For example, if the current market price of XAU/USD is 1730.50, it signifies that each ounce of Gold is worth the US $1730.5.

XAU/USD Specification

Spread

Spread is the difference between the bid price and the ask price. The spread usually varies based on the account type used for execution. The approximate spread on the gold spot on ECN account and STP account is as follows:
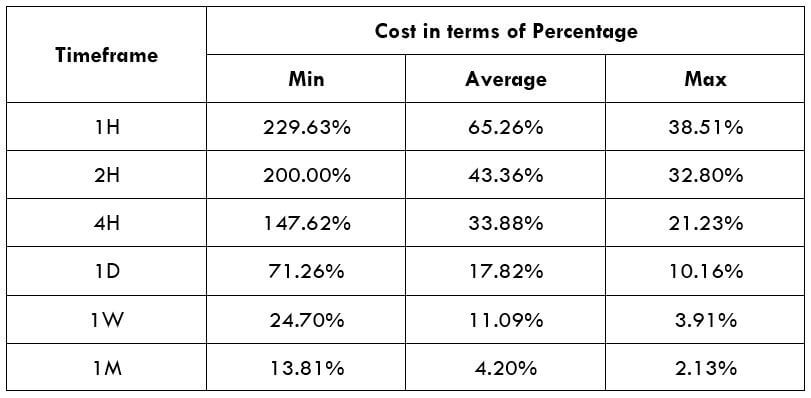
ECN: 100 | STP: 130

Fee

Typically, brokers do not charge any type of fee. But, on ECN accounts, there is some commission you must pay the broker for opening and closing a position. However, the fee is not significantly high.

Slippage

Due to the high market liquidity and slower broker’s execution speed, slippage occurs. It is the difference between the trader’s demanded price and the price at which the broker executed the trade. Slippage can occur both in favor and against the trader.

Trading Range in XAU/USD

The trading range is a tabular representation of the volatility in the market for several different time frames. It gives the minimum, average, and maximum volatility in the pair for different time frames.

Procedure to assess Pip Ranges

  1. Add the ATR indicator to your chart
  2. Set the period to 1
  3. Add a 200-period SMA to this indicator
  4. Shrink the chart so you can assess a large time period
  5. Select your desired timeframe
  6. Measure the floor level and set this value as the min
  7. Measure the level of the 200-period SMA and set this as the average
  8. Measure the peak levels and set this as Max.

XAU/USD Cost as a Percent of the Trading Range

Cost as a percent of the trading range represents variation in the trade cost by considering the market’s time frame and volatility. Mathematically, it is the ratio of the volatility value and the total cost of the trade.

ECN Model Account

Spread = 100 | Slippage = 30 | Trading fee = 20
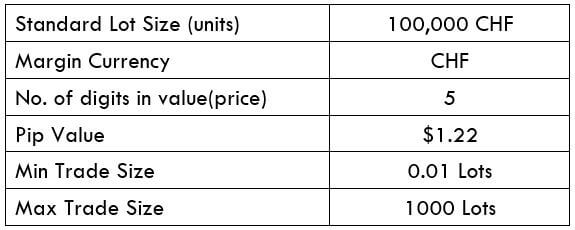
Total fee = Spread + Slippage + Trading fee
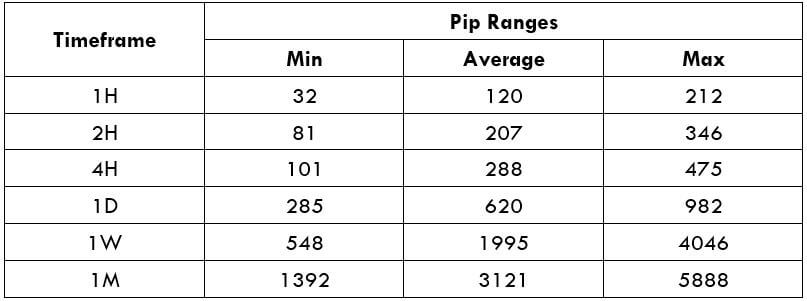
Total fee = 100 + 30 + 20 = 150 (pips)

STP Model Account

Spread = 130 | Slippage = 30 | Trading fee = 0
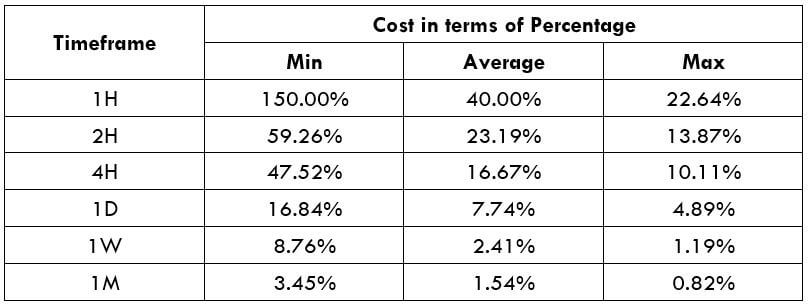
Total fee = Spread + Slippage + Trading fee
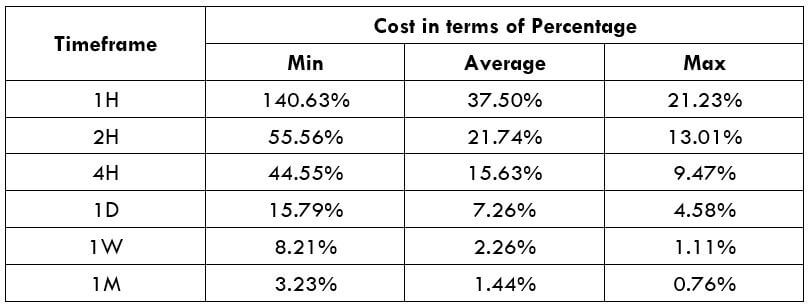
Total fee = 130 + 30 + 0 = 160 (pips)

The Ideal Timeframe to Trade XAU/USD

Gold is one of the oldest asset classes and one of the most reliable instruments as well. It is extensively traded in the market as most forex broker has XAU/USD available for trading. Its volatility and liquidity are no less than major currency pairs.

XAU/USD can be traded like any other foreign exchange pair. It, in fact, correlates with commodity currencies like AUD and NZD. Thus, traders use these two currencies in addition to USD, in order to analyze the pair. The same technical analysis applied to other markets can be used on the gold spot as well. However, the fundamentals do differ a little.

Coming to the costs, it technically remains the same for any time frame you trade. However, it relatively changes based on volatility and time frame. For example, a 1D trader who makes 2000 pips P/L on an average pays the same a 1H trader who makes 500 pips P/L on a trade. This is the reason the percentage values are higher in the 1H time frame than the 1D time frame.

Irrespective of the time frame you trade, you need to make sure that the market’s current volatility is above the average volatility. If you end trading when the volatility is at the minimum values, then you will have to pay the same costs for a trade that could not reach the target in your expected time.

Categories
Forex Assets

AUD/HRK – Analyzing The Costs Involved While Trading This Exotic Pair

Introduction

The abbreviation of AUD/HRK is Australian Dollar, paired with the Croatian Kuna. Here AUD is the official currency of Australia and is also the fifth most traded currency in the Foreign Exchange market. In contrast, HRK stands for the Kuna, and it is the official currency of Croatia. The Croatian National Bank issues this currency.

Understanding AUD/HRK

In the Forex market, to determine the relative value of one currency, we need another currency to compare. Here, when we buy a currency, which is known as the base currency and simultaneously sell the quote currency. The market value of AUD/HRK helps us to understand the strength of HRK against the AUD. So if the exchange rate for the pair AUD/HRK is 4.5571, it means to buy 1 AUD, we need 4.5571 HRK.

Spread
A spread is defined as the difference between the purchasing & selling price of a Forex pair. In simple words, it is the difference between the bid price and the ask price of an asset. Below is the spread charges for ECN and STP brokers for AUD/HRK pair.
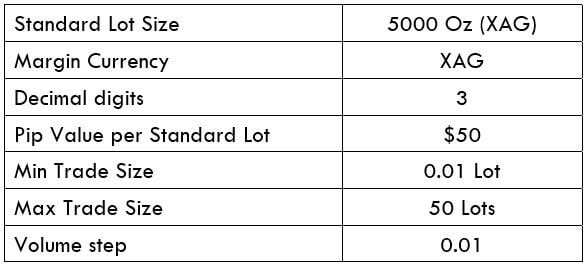
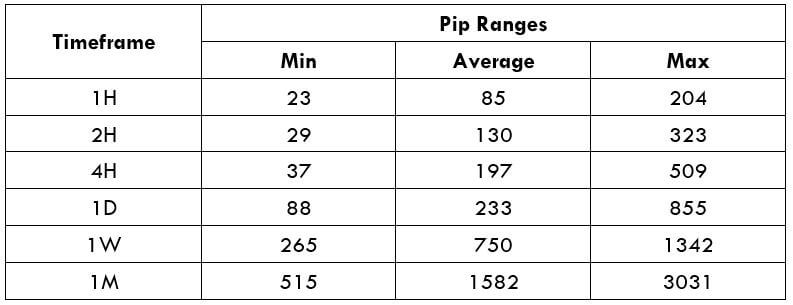
ECN: 40 pips | STP: 43 pips

Fees

A Fee is the charges that we traders pay to the broker for executing a trade. Fees to a much depend on the type of broker(STP/ECN) we use.

Slippage

When we want to execute a trade at a particular market rate, but instead, the trade gets executed at a different rate, and that is because of the slippage. Slippage occurs when we counter a volatile market, and when we execute a large order at the same time.

Trading Range in AUD/HRK

The trading range here will determine the amount of money we will win or lose in a given amount of time. In the below table, we have the representation of the minimum, average, and maximum pip movement in a currency pair. Here we will use the ATR indicator that indicates the price movement in a currency pair. We will evaluate it merely by using it with 200-period SMA.

Procedure to assess Pip Ranges

  1. Add the ATR indicator to your chart
  2. Set the period to 1
  3. Add a 200-period SMA to this indicator
  4. Shrink the chart so you can assess a significant period
  5. Select your desired timeframe
  6. Measure the floor level and set this value as the min
  7. Measure the level of the 200-period SMA and set this as the average
  8. Measure the peak levels and set this as Max.

AUD/HRK Cost as a Percent of the Trading Range

The cost of trade depends on the broker type and varies based on the volatility of the market. The overall cost of trade includes spread, fees, and sometimes slippage if the volatility is more. To decrease the cost of the trade, we can use limit orders instead of market execution.

ECN Model Account

Spread = 40 | Slippage = 3 |Trading fee = 5

Total cost = Slippage + Spread + Trading Fee = 3 + 40 + 5 = 48

STP Model Account

Spread = 43| Slippage = 3 | Trading fee = 0

Total cost = Slippage + Spread + Trading Fee = 3 + 43 + 0 = 46

Trading the AUD/HRK

AUD/HRK is an exotic currency pair. As we can see, the average pip movement in 1hr is 133, which implies higher volatility. The higher the volatility, the higher is the risk and lower is the cost of the trade and vice versa. Taking an example, we can see from the trading range that when the pip movement is lower, the charge is high, and when the pip movement is high, the charge is low.

To reduce our costs of trade, we may place trades using limit orders instead of market orders. In the below table, we will see the representation of the cost percentages when limit orders are used. As we can see, the cost of slippage is zero. In doing so, the slippage will not be included in the calculation of the total costs. And this will help us in reducing the trading cost by a considerable margin. An example of the same is given below.

ECN Model Account (Using Limit Orders)

Spread = 40 | Slippage = 0 |Trading fee = 5

Total cost = Slippage + Spread + Trading Fee = 0 + 40 + 5 = 45