Categories
Forex Assets

Analyzing the Trading Costs on ‘NZD/CZK’

Introduction

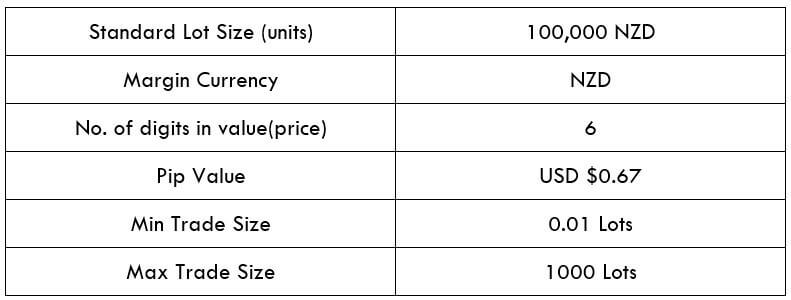
NZD/CZK is the abbreviation for the Euro Area’s Euro against the Czech Koruna. This pair is considered an exotic-cross currency pair. Here, the NZD is the base (first) currency, and the CZK is the quote (second) currency. NDZ is the official currency used in New Zealand, while CZK is the native currency of the Czech Republic.

Understanding NZD/CZK

The price of this pair in the foreign exchange market defines the value of CZK equivalent to one NZD. It is quoted as 1 NZD per X CZK. So, if the value of this pair is 14.8124, these many Korunas are required to purchase one NZD.

Spread

Spread is the mathematical difference between the bid and the asking price offered by the broker. This value is distinct in the ECN account model and STP account model. An approximate value for NZD/CZK pair is given below.

ECN: 43 pips | STP: 48 pips

Fees

The fee is the price/compensation that one pays for the trade. There are no charges on STP accounts, but a few additional pips are levied on ECN accounts.

Slippage

Slippage is a variation between the value proposed by the trader, and the trader indeed received from the broker.

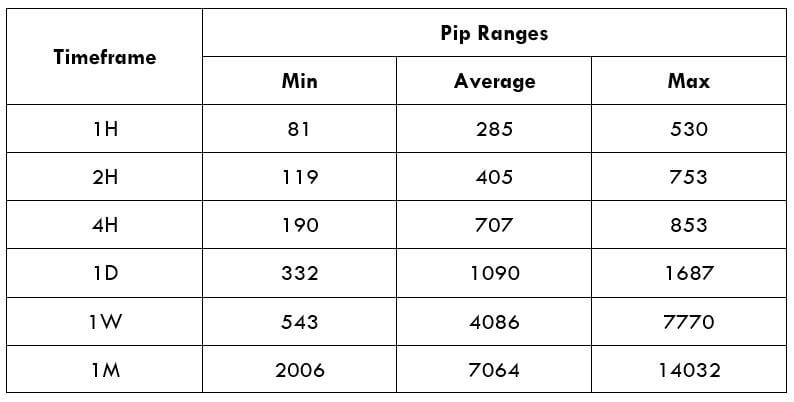
Trading Range in NZD/CZK

The tabular interpretation of the pip movement of a currency pair in separate timeframes is called as the trading range is the. These values are helpful in influencing the profit that can be produced from a trade before-hand. To uncover the value, you must multiply the below volatility price with the pip value of this pair.

Procedure to assess Pip Ranges

  1. Add the ATR indicator to your chart
  2. Set the period to 1
  3. Add a 200-period SMA to this indicator
  4. Shrink the chart so you can assess a large time period
  5. Select your desired timeframe
  6. Measure the floor level and set this value as the min
  7. Measure the level of the 200-period SMA and set this as the average
  8. Measure the peak levels and set this as Max.

NZD/CZK Cost as a Percent of the Trading Range

Trading Range is the interpretation of the total price variation of trades for distinct timeframes and volatilities. The values are achieved by discovering the ratio amongst the total price and the volatility value; it is expressed as a percentage.
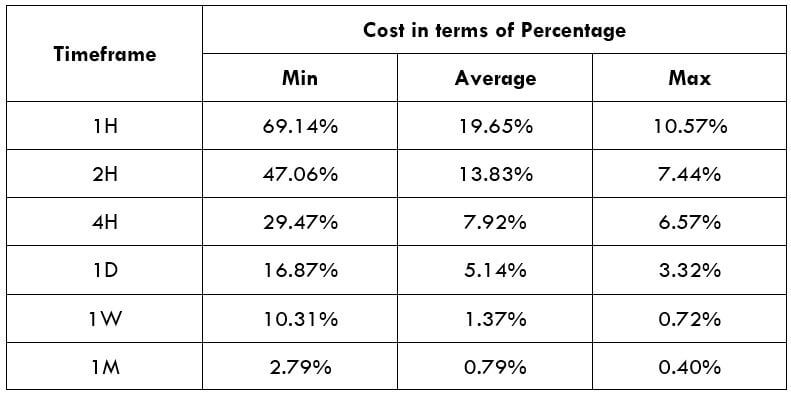
ECN Model Account

Spread = 43 | Slippage = 5 |Trading fee = 8

Total cost = Slippage + Spread + Trading Fee = 3 + 43 + 8 = 56 
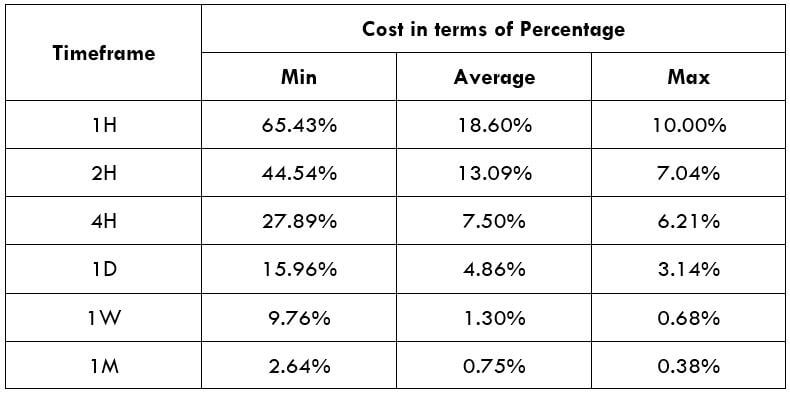
 

STP Model Account

Spread = 48 | Slippage = 5 | Trading fee = 0

Total cost = Slippage + Spread + Trading Fee = 5 + 48 + 0 = 53

Trading the NZD/CZK

The bigger the percentage values, the higher is the price on the trade. From the preceding tables, we can see that the values are sizeable in the min column and relatively less significant in the maximum column. This means that the prices are high when the volatility of the market is low.

It is neither suitable to trade when the market’s volatility is elevated nor when the costs are high. To balance out between both these aspects, it is perfect to trade when the volatility of the pair is in the array of the average values.

Additionally, to decrease your costs even beyond, you may place trades using limit orders as a substitute for market orders. In executing so, the slippage will not be involved in the computation of the total costs. And this will put down the cost of the trades by a sizeable number. An example of the same is given below.

STP Model Account (Using Limit Orders)

Spread = 48 | Slippage = 0 |Trading fee = 0

Total cost = Slippage + Spread + Trading Fee = 0 + 48 + 0 = 48

Categories
Forex Videos

Master Forex Spreads Quickly To Increase Profits – Forex Tips & Tricks

Master Forex Spreads Quickly to Increase Profits

Today we are going to be looking at spreads in reference to the forex market and some of the points to remember when choosing a broker having carefully considered the trading spreads they offer and eventually helping you to decide which trades you make according to the tightest spreads available.

Example A


So, what is the spread? All foreign exchange currency trading is done in pairs are the prices for each pair and are quoted as currency exchange rates.

Example B

Prices are quoted in quote boxes similar to this one, where the relative value of one currency unit is termed in the units of the other currency in its pair. In this example, the British Pound is being quoted against the United States Dollar and is where each currency has a three-letter quote, so here it would be GBP USD.
To simplify this, the spread always reflects the price for buying the first currency of the pair, in this case, the Pound, with the second currency, in this case, the USD.

The exchange rate that is supplied to a trader willing to purchase a quote currency is called a BID, and it is the highest price that the currency pair could be bought at. The selling price of the quote currency is called the ASK, and it is the lowest price that a currency pair will be allowed for sale. The difference between the Ask and the Bid is termed as spread. Essentially, the reason for the existence of the spread is so that brokers can take a cut. It can be applied instead of charging fees on your close trade positions, although some brokers may charge a small commission separately after the trade is closed.

Spreads are typically measured in pips and measured using the fourth decimal place in a currency quotation. There different types of spreads available in forex trading with different brokers provide let’s take a look at these two examples to May better understand your options.

Example C

When choosing a broker, you will want to consider the types of spreads they offer typically. This will be a fixed spread, or it might be a variable spread. With the fixed spread, the difference between the Ask and the bid price remains constant during normal periods of activity in the trading day. This can, however, widen slightly at times of extreme volatility. Fixed spreads are phenomenal in terms of knowing where you are at all times. With this option, you can determine your costs before entering your trade. Therefore it allows you to have better foresight in terms of your finances. This type of spread is preferred by professional traders because it means that brokers cannot manipulate the spread in their own favor throughout the trading day.

Next, we have variable spreads. This type of spread does not remain constant. Spreads fluctuate in line with market conditions during the day and especially during high levels of volatility and are also affected by liquidity in the market. The benefit of having variable spreads is that sometimes the spreads can be much tighter than fixed spreads and are better suited to frequent traders, for example, scalpers and intraday traders.

Some brokers will offer kept variable spreads, and these can often be considered to be the best of both options depending on how high the cap is.

Categories
Forex Assets

Analyzing The CAD/JPY Forex Asset Class

Introduction

CADJPY is the abbreviation for the currency pair, the Canadian dollar against the Japanese yen. This pair is one of the most extensively traded cross currency pairs. In CADJPY, CAD is referred to as the base currency and JPY as the quote currency.

Understanding CAD/JPY

The value of CADJPY is the value of JPY, which is required to purchase one CAD. It is quoted as 1 CAD per X JPY. For example, if the current market price of this pair is 82.651, then these many units of Japanese yen are needed to buy one Canadian dollar.

Spread

The bid price is the price used to sell a currency, and ask price is the price used to buy a currency. There is always a difference between the two prices. This difference is called the spread. It varies from broker to broker and also the type of their execution model.

ECN: 1.1 | STP: 2

Fees

Similar to stockbrokers, there are forex brokers who charge a few pips of fee on each position a trader opens and closes. This fee is no different from the commission brokers levy. On STP accounts, the fee is nil, while on ECN accounts, it is between 6-10 pips depending on the broker one is using.

Slippage

Slippage in trading is the difference between the price requested by the trader and the price he actually received. The two factors responsible for slippage are,

  • The volatility of the market
  • Broker’s execution speed

Trading Range in CAD/JPY

A trading range is a tabular representation of the number of pips a currency pair moved in a given timeframe. It represents the minimum, average as well as the maximum pip movement in six different timeframes. These values prove to be important for assessing one’s risk on a trade. For example, if the minimum pip movement in CADJPY on the 4H timeframe is ten pips, then a trader can expect to lose $917 in about 4H.

Procedure to assess Pip Ranges

  1. Add the ATR indicator to your chart
  2. Set the period to 1
  3. Add a 200-period SMA to this indicator
  4. Shrink the chart so you can determine a large period
  5. Select your desired timeframe
  6. Measure the floor level and set this value as the min
  7. Measure the level of the 200-period SMA and set this as the average
  8. Measure the peak levels and set this as Max.

CAD/JPY Cost as a Percent of the Trading Range

As already mentioned, there is a fee for every trade you take. And knowing the percent fee on the trades you are taking is important, as it depends on the volatility of the market and the timeframe you are trading.

Below is a representation of the total cost variation on trade in terms of percentages. Since costs on ECN accounts are different from STP accounts, we have two separate tables for this concept.

ECN Model Account

Spread = 1.1 | Slippage = 2 |Trading fee = 1

Total cost = Slippage + Spread + Trading Fee = 2 + 1.1 + 1 = 4.1

STP Model Account

Spread = 2 | Slippage = 2 | Trading fee = 0

Total cost = Slippage + Spread + Trading Fee = 2 + 2 + 0 = 4

The Ideal way to trade the CAD/JPY

Before getting right into it, let us comprehend the above tables. The higher the values of the percentages, the higher are the costs on the trade. It is pretty evident from the table that, percentage values are on the higher side in the min column and comparatively lower in the max column. This means that the costs are high when the volatility of the market is low and vice versa. Also, the trades that are taken based on a long term perspective, the costs are considerably low.

One may trade the high volatility markets to minimize your costs, or trade during low volatility by paying high costs. However, it is ideal to enter during those times of the day when the volatility is close to the average values. During these times, one can expect comparatively low costs with enough volatility as well.

On a further note, another simple and effective way to reduce costs is by trading using limit orders. This entry method will take slippage out of the total costs and bring down its value considerably. An example of the same is given below.

Spread = 2 | Slippage = 0 | Trading fee = 0

Total cost = Slippage + Spread + Trading Fee = 2 + 0 + 0 = 2

Categories
Forex Course

40. Two Different Types Of Spreads In The Forex Market

In the last lesson, we clearly talked about what Spread in forex is and also how it is calculated. In this lesson, we will dig up a little more on the concept of spreads and understand its types.

In Forex, the spread is of two types:

  • Fixed spread
  • Variable/Floating spread

Fixed spreads are typically offered by Dealing Desk brokers, whereas, Variable spreads are offered by No Dealing Desk brokers. Let’s understand both in detail.

Fixed Spreads in Forex

As the name pretty much suggests, Fixed spreads remain the same regardless of the condition of the market. Be it a volatile or non-volatile market, the spread always stays the same.

As mentioned, these spreads are usually offered by Market Makers type of brokers.

Dealing Desk brokers buy a large number of positions from their liquidity providers and then offer these positions to traders (clients). Since the brokers will own these positions, they can control and display the prices to their clients with a fixed spread.

Why choose Fixed Spreads?

  • Fixed spreads do not require a large capital to trade. So, fixed spread brokers offer an alternative for traders who don’t have much cash to begin with.
  • “Fixed” spread itself is an advantage. Fixed spreads make it easy to calculate the transaction costs. And since spreads always remain constant, you will exactly know how much amount you will be paying to the broker for each trade.

Variable Spreads in Forex

Again, as the name suggests, Variable spreads are the spreads that are constantly changing, just like the exchange rates. That is, as and when the bid and ask price changes, the difference between the two changes. This, therefore, changes the spread as well.

This type of spread is offered by Non-Dealing Desk brokers. These brokers obtain the prices from multiple liquidity providers and directly pass on these prices to the traders without the involvement of a dealing desk. This means that NDD brokers do not have control over the spreads. It all depends on the market’s supply and demand and its overall volatility.

As a typical tendency of the market, when there is an economic event, the spreads widen. And same is the case when the market volatility drops.

Advantages of Variable spreads

  • Variable spreads diminish the experience of requotes, where requote is the difference in the price you hit the buy/sell and the price when your order reached the broker. However, this doesn’t mean that you won’t experience slippage.
  • Variable spreads provide transparent pricing, as you will be getting the prices from multiple liquidity providers, which in turn means better prices due to high competition.

If you’re wondering which type of spread you must choose? Well, it completely depends on the type of trader you are. For example, traders with small accounts who trade occasionally can go with a broker that offers fixed spread, whereas, a trader who wants fast execution and also wants to avoid requotes, can look for brokers offering variable spreads.

[wp_quiz id=”54986″]
Categories
Forex Elliott Wave

How to Use ETFs to Create Spreads

Exchange-Traded Funds, or better known as ETFs, are investment instruments that are traded in a centralized market. In this educational article, we will see how we can use them to create negotiating opportunities.

Exploring Markets and Diversification

In financial markets, there are virtually unlimited possibilities for investment. Decisions such as what to buy? What to sell? As well as the geographical region, level of risk, liquidity of the market or assets, expected profitability, among other aspects, are factors that an investor can face when planning his future investment.

Use of Intermarket Spreads

In simple words, a spread is a strategy on which the investor buys one market and sells another market simultaneously. For example, in the currency market, an investor could buy a contract of €100,000 and simultaneously sell a 100,000 euro on pounds sterling. In other words, this trade is equivalent to go long in the EUR/GBP spread.

Creating a Spread with ETFs

We can create different spreads according to the market in which we are interested in investing. To this end, the decision criteria will be those ETFs with higher liquidity. The following tables represent ETFs that are associated with commodities, particularly Gold and Silver.

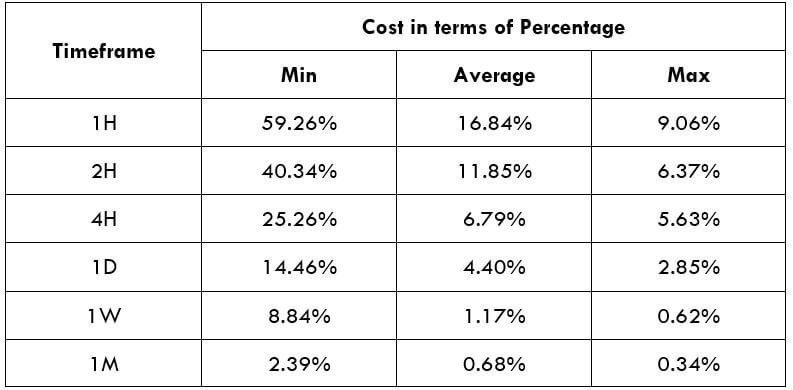
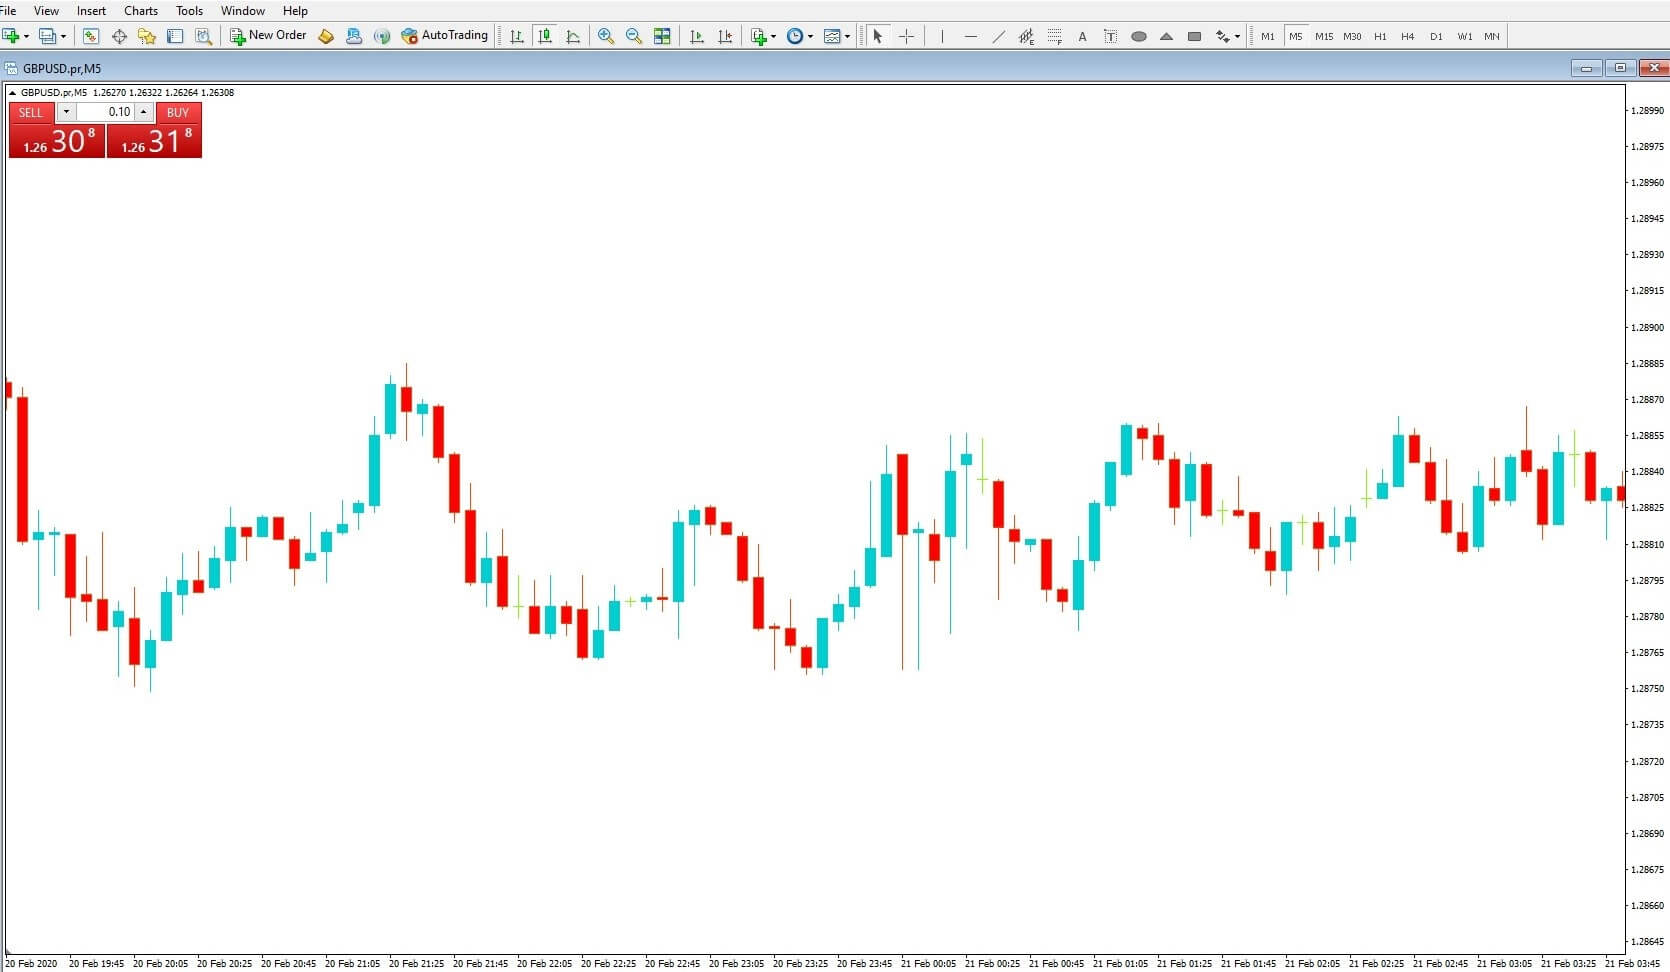
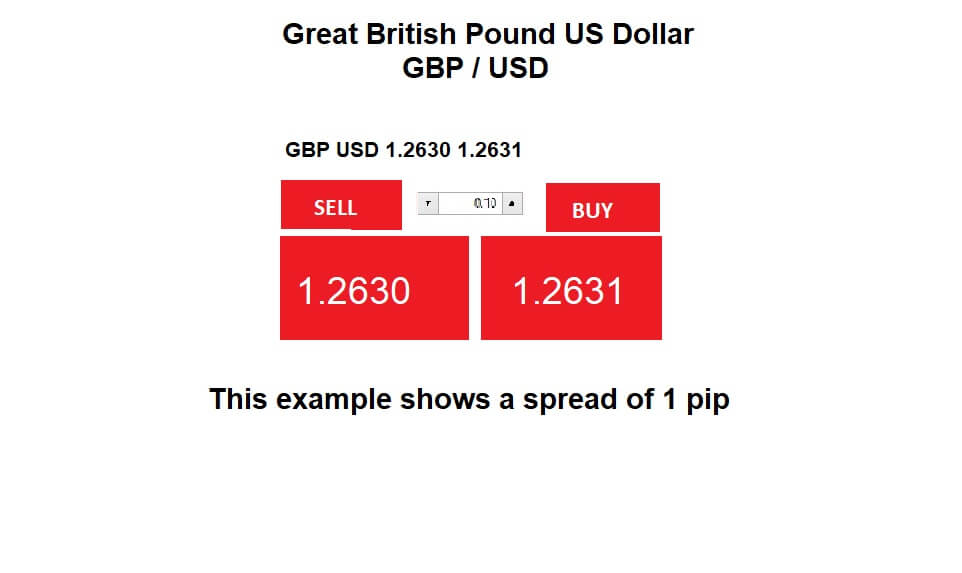
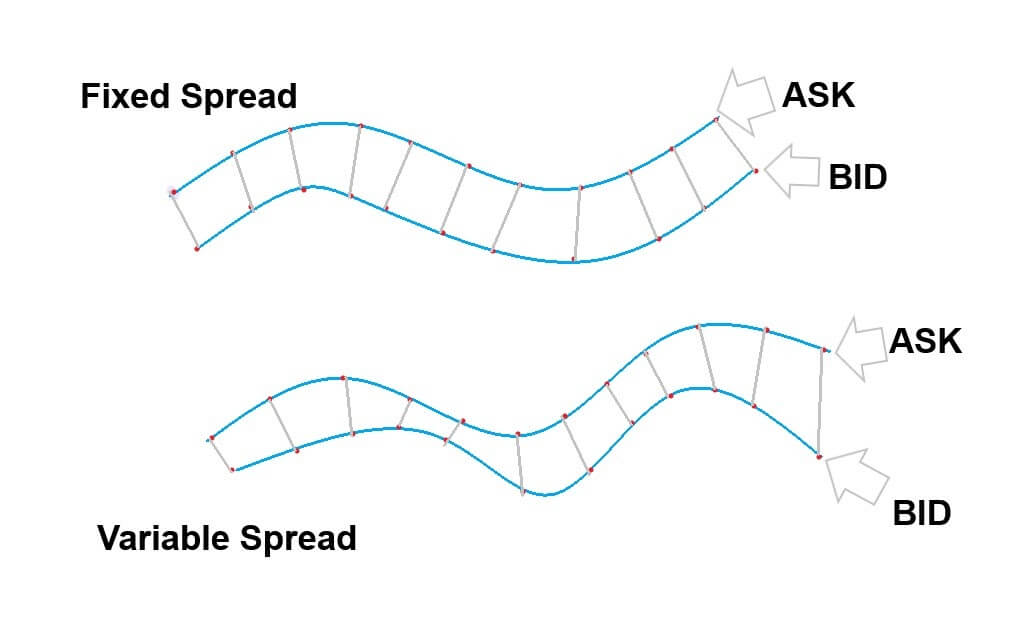
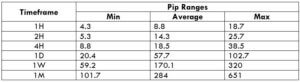
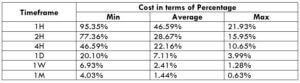
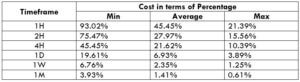
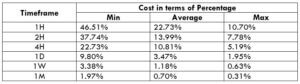
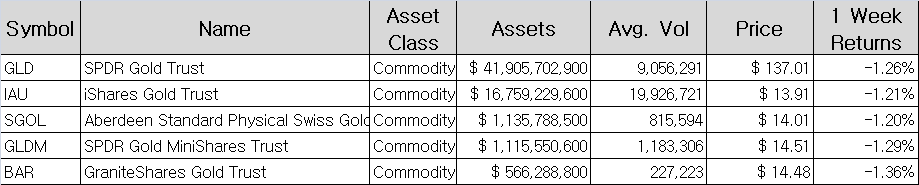
Table 1 – ETFs Based on Gold

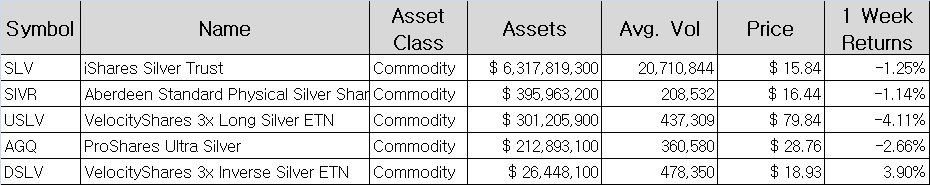
Table 2 – ETFs Based on Silver

From tables 1 and 2, we see that ETFs GLD and SLV record the largest size in each group. Consequently, they will be used for the construction of the GLD/SLV spread.

The GLD/SLV spread in its daily chart shows both precious metals developing a corrective structure as a B wave. Therefore, the Gold/Silver spread could see a new low. In other words, we expect a decline in GLD and an upside in SLV.

The following example shows the spread between SPY and QQQ in its daily chart. The ETF SPY is characterized by replicating the S&P 500 index, while QQQ replicates the NASDAQ 100 index.

In the spread graph SPY/QQQ, we detect that the price is developing an Ending Diagonal structure in a bearish cycle. Also, although QQQ continues to push downwards in front of the SPY, it should be noted that this pattern is an exhaustion formation. Thus, it is likely that these markets reverse soon. In this case, the positioning strategy would be a long position in SPY and another short position in QQQ.

Conclusion

After the analysis made here, you may see that everything traded, including pairs, can be considered as spread bets between an asset the underlying payment method. It is just that, considering the relative stability of fiat money it makes more sense to use the term spread when exchanging two volatile assets, as one of the main objectives of spread bets is to tame the overall market volatility since the investor is selling and buying volatility at the same time.

According to what here is exposed, the creation of spreads can help explore the strength/ weakness situation between markets. Likewise, the exercise could help to make decisions on which assets to choose. It should be emphasized that before entering a market, the  spread’s price action must confirm the movement that is predicted.

Finally, this type of analysis can be extended to the futures market between futures contracts with different or similar expirations. This kind of analysis can also be applied in the stocks market, bonds, etc.

Categories
Forex Market

The Basics of Spread & Slippage

Spread

Did you know that each time you place a trade, you pay a fee to the broker for providing the opportunity & platform to trade? Spreads act as a fee on zero-commission accounts (STP accounts). A spread is simply the price difference between the purchase price and selling price of an asset. The broker always shows two quotes of currency – one at which they sell the underlying asset to you and another at which they buy the underlying asset from you. The spread between these two prices makes the broker’s revenue from the foreign exchange transactions they perform for their clients.

Bid-Ask spread

There are two types of forex rates, the Bid and the Ask.

The price you pay to buy the forex pair is called Ask. It is always slightly higher than the market price.

The price at which you sell the forex pair is called Bid. It is always slightly lower than the market price.

The price that you see on the chart is always a Bid price. The ‘Ask’ price is always higher than the ‘Bid’ price by a few pips. Spread is essentially the difference between these two rates.

Spread = Ask – Bid

For example, when you see EUR/USD rates quoted as 1.1290/1.1291, you buy the pair at the highest Ask price of 1.1291 and sell it lower Bid price of 1.1290. This particular quote shows a spread of 1 pip.

Types of spreads

The kinds of spread depend on the rules of the broker. Spreads can either be fixed or floating.

Fixed spreads remain fixed no matter what the market conditions are at any given point of time. The advantage of this type of spread is that the broker will not be able to widen the spreads during volatility.

Floating, also known as variable spreads, are continually changing. They widen or tighten depending on the supply and demand of currencies and market volatility.

Slippage

Slippage is a phenomenon in the forex market where currency prices change while an order is being placed, thus causing traders to enter or exit trades at prices higher or lower than they desire. Slippage happens because of the imbalance of buyers, sellers, and trade volumes. It also occurs when the market is less active with lower liquidity.

For instance, a trader wants to buy a currency pair at $1.0015 (Current Market Price) with a broker of his choice. Once he submits the buy order, the best-offered price suddenly changes to $1.0020. It is considered as a negative slippage of 5 pips. In the same example, if the best-offered buy price suddenly changes to $1.0005, it is regarded as a positive slippage of 10 pips.

How to avoid slippage?

Slippage cannot be entirely avoided if you trade using market orders, but it can be reduced. One way a trader can minimize slippage is to ensure that their broker has many liquidity providers. Another way is to avoid trading during periods of high volatility as prices move faster and at wider intervals. To check volatility, traders can make use of technical indicators such as Bollinger bands or Average True Range.

The only way to entirely avoid slippage is by using strategies that employ limit orders on entries and exits.