Categories
Forex Money Management

How to Save Money on Broker-Related Fees

When it comes to trading forex, from the outside it looks like it is a fantastic and quite straightforward way to make money. In reality, there are a lot of hidden costs that your broker may be adding to our trades. We are talking about spreads, commissions, swap charges, deposit fees, withdrawal fees, and more. All of these fees will add up over time and if you are not careful they can really eat into your profits. We are going to be looking at a few of the things that you can do that could help you to reduce the fees that you are paying and to help you save some of your profits from going into the broker’s profits.

Find the Right Broker

There are a lot of brokers out there, with so many being available, there is also a lot of variety when it comes to the fees that are being charged. Some have high, some have low and some do not have any, but you will need to weigh up the benefits between the fees and the features that you will receive. A broker with very low fees may not be offering the same features as one that charges higher fees. However, if you are paying too much on all fronts, then it may be time to look for another broker. There are industry standards when it comes to the fees, so if you are with one that is far higher than the rest of the market, then you should probably think about changing brokers and going for one with slightly lower overall fees.

Swap Charges

A swap charge is a fee that your broker charges when you hold a trade overnight, these charges are applied directly to the trade that is being held. You won’t find many brokers that do not have swap fees, but there are some out there and some brokers also offer Islamic accounts which do not have swap fees, but the spreads on those accounts are often higher. For many brokers there isn’t much you can do when it comes to the swap fees, they are something that you may need to accept, but you can of course reduce the amount of money that you are paying by trying to close out your trades before the cut-off point in the evening. You will need to weigh up whether it would be worth closing our trade early to avoid the swap or to accept the swap if your trade will make more profit.

Spreads

Spreads are a big one, the spread is the difference between the buy price and the sell price, if a broker has a big spread then the markets will need to move a lot more in order for you to make the same profit than you would with a broker with a lower spread. Brokers often offer different account types, accounts like ECN accounts will have generally lower spreads, so these accounts are good ones to go for If you have a high spread account, there is no harm in getting in touch with your broker to ask if they can lower your spreads, most can do this on an individual account and if you are a good customer of theirs, many will b happy to give a little discount to your spreads.

Commissions

The average commission being charged these days seems to be around $6 per lot traded. Some accounts have commissions and some do not, those without commissions often have large spreads as the commission is often charged as a way of reducing h spreads on the account. If you are being charged anything more than $6 per lot traded then you are most likely being ripped off, either look for a new broker with a lower commission or get in touch with your broker in order to ask that your commission is reduced, if you have a high trade volume with the broker, they will most likely be happy to reduce your commissions a little bit.

Deposit Fees

A bit of a dinosaur this one, but some brokers actually still charge for depositing money into your account, that is right, they charge you to put your money into their accounts. If your broker does this, get out, that is the only advice, there is no place in the forex trading world for brokers that charge you for putting your money into their account.

Withdrawal Fees

Just like the deposit fees, some brokers will charge to withdraw your money. This can be a bit of a pain especially if it is not advertised on the site. There are a few things that you can do, you could look for a broker that does not offer withdrawal fees, there are a lot of them out there but this can be a bit of a hassle, moving all your money into another trading account. You could also check which withdrawal methods are available as some brokers will charge for one method but not for another, so it may be worth changing the method used in order to use one of the ones that do not have a charge. If you are a big player, with a high trade volume, get in touch with your broker, some may be willing to waive any fees that you would otherwise have to pay for your withdrawals.

Rebates

You may have heard of rebates, this is a way of getting back a bit of the money that you are paying through your commission or spreads. There are a number of reputable companies out there that offer you rebates for your trades through a number of different brokers. You will have to sign up for a new account through their introducing broker link, but apart from that, it is a completely automated process. There are also some brokers that will offer rebates directly from them. There will often be a trade volume requirement on these rebates, but if you manage to achieve them, it will save you money getting back a percentage of the commission that you are paying, well worth it if the commissions and spreads are already quite low or at least in line with the industry standards.

Interest

Some brokers will offer you interest for simply having money in your account, a fantastic way to make a little extra money and to help counter the effects of the fees that you are paying. Of course, you are not going to be making thousands a month through interest, but even a few extra dollars per week or month will help to offset some of the fees that you are paying. There aren’t as many brokers offering this sort of thing, but if you are able to find one with other decent features and fees, then it is a great way of making a little more.

Those are some of the things that you can do to help reduce or counteract the fees that your broker may be charging. For many, there may be nothing you can do about them, but for others, it may be worth at least getting in touch with your broker in order to ask whether or not they can reduce any of the fees that you are being charged. There is no harm in asking and many brokers will be happy to offer you something new if you are a good customer of them.

Categories
Forex Assets

Analyzing The Costs Involved While Trading The CAD/NOK Exotic Pair

Introduction

CADNOK is a Forex currency pair, where CAD is the official currency of Canada, and NOK is the native currency of Norway. In this exotic pair, CAD is the base currency, and NOK is the quote currency.

Understanding CADNOK

This pair’s price determines the value of NOK, which is equivalent to one CAD. We can quote it as 1 CAD per X numbers of NOK. For example, if the CADNOK pair’s value is at 6.7135, it means we need almost 6.7135 NOK to buy one CAD.

CADNOK Specification

Spread

In forex trading, Spread indicates the difference between the Bid price and the Ask prices. Traders don’t have to do anything with this as it is deducted by the broker. This value changes with the type of execution model used for executing the trades. Below are the ECN and STP spread values of this currency pair.

Spread on ECN: 39 pips | Spread on STP: 44 pips

Fees

The trading fees that forex brokers take are similar to other financial markets. It is deducted from the traders’ accounts when they take a trade. Note that STP accounts do not take any charge, but a few pips are charged in ECN accounts.

Slippage

Slippage happens when a trader opens a trade at a price, but it opens at another price by expanding the Spread. The main reason to occur slippage is the market volatility and the broker’s execution speed.

Trading Range in CADNOK

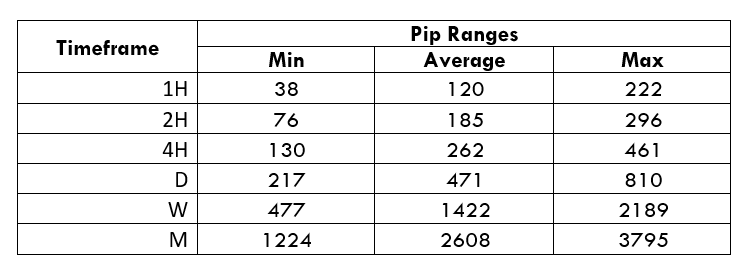
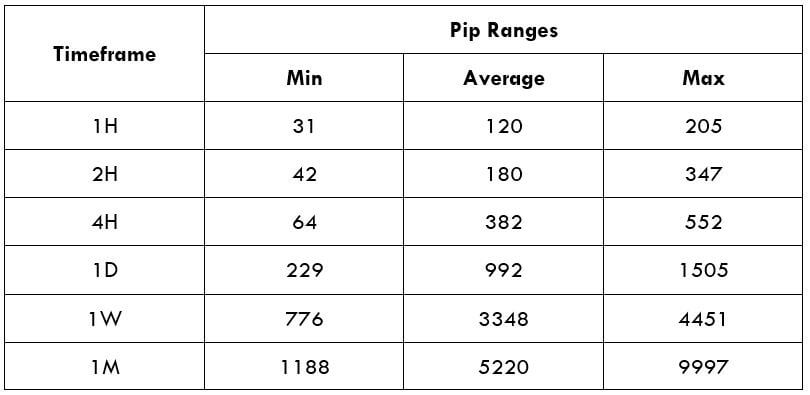
The trading range is the representation of the minimum, average, and the maximum volatility of this pair on the 1H, 4H, 1D, 1W, and 1M timeframe. Using these values, we can assess our profit/loss margin of trade. Hence, this proves to be a helpful risk management tool for all types of traders.

Procedure to assess Pip Ranges

  1. Add the ATR indicator to your chart
  2. Set the period to 1
  3. Add a 200-period SMA to this indicator
  4. Shrink the chart so you can assess a large time period
  5. Select your desired timeframe
  6. Measure the floor level and set this value as the min
  7. Measure the level of the 200-period SMA and set this as the average
  8. Measure the peak levels and set this as Max.

CADNOK Cost as a Percent of the Trading Range

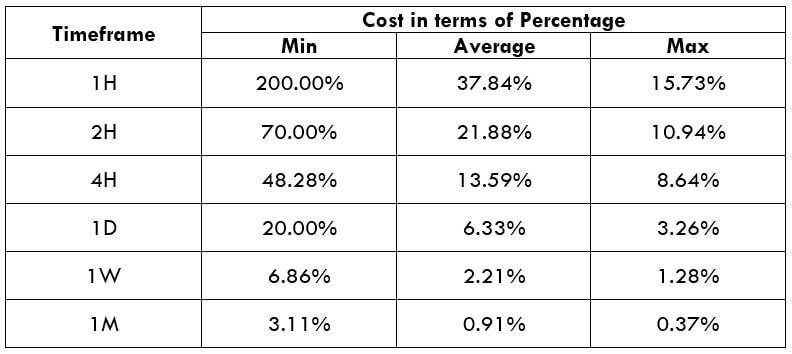
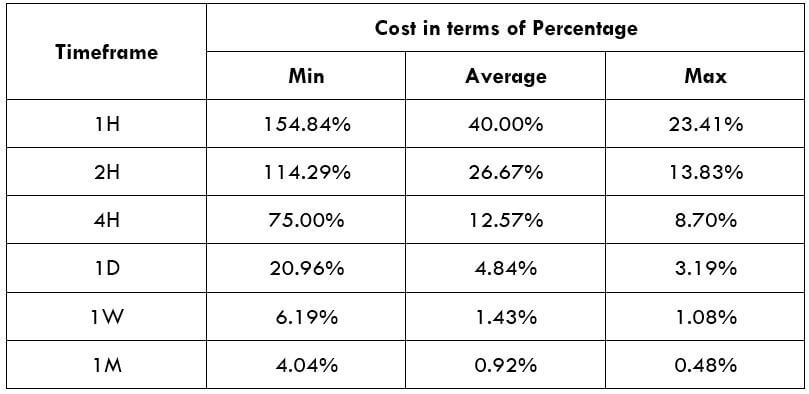
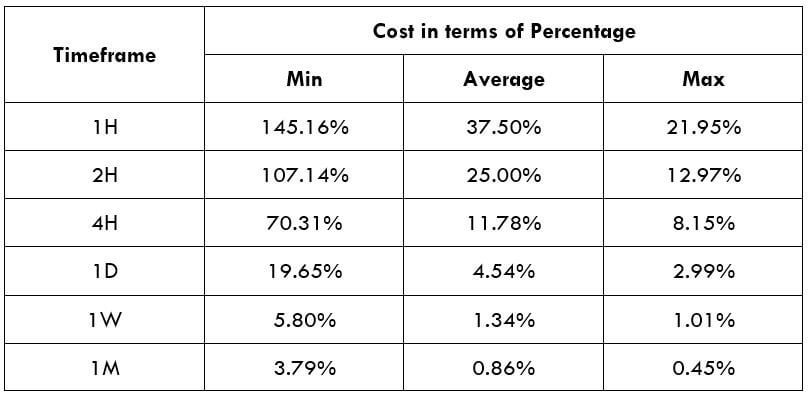
If we look at the volatility values from the above table, we can see how the cost changes with the change in volatility. We have provided the ratio between the cost and the volatility values into percentages.

ECN Model Account 

Spread = 39 | Slippage = 5 | Trading fee = 8

Total cost = Spread + Slippage + Trading Fee

= 39 + 5 + 8

Total cost = 52

STP Model Account

Spread = 39 | Slippage = 5 | Trading fee = 0

Total cost = Spread + Slippage + Trading Fee

= 39 + 5 + 0

Total cost = 44

The Ideal way to trade the CADNOK

The CADNOK is an exotic currency pair that has enough liquidity. As a result, traders may find it easy to trade in this exotic currency pair. The percentage values from the above table did not move above 138%, which is an indication of less volatility. However, the Percentage of trading cost is lower in the higher timeframe.

Therefore, traders should be cautious to determine the price where trading is suitable. An increase in volatility is risky, while the decrease in volatility is less profitable. Therefore, the best time to trade in this pair is when the volatility remains at the average value.

Furthermore, another way to reduce the cost is to place a pending order as ‘limit’ and ‘stop’ instead of ‘market.’ In that case, the slippage will not be considered in the calculation of the total costs. So, the total cost will be reduced by five pips.

STP Account Using Limit Model Account

Spread = 39 | Slippage = 0 | Trading fee = 0

Total cost = Spread + Slippage + Trading Fee

= 39 + 0 + 0

Total cost = 39

Categories
Forex Assets

How Expensive Is It To Trade The CHF/SAR Forex Exotic Pair?

Introduction

CHF/SAR is the acronym for the Swiss Franc against the Saudi Riyal. It is classed as an exotic currency pair as it usually has moderate trading volume. In this case, the Swiss Franc (on the left) is the base currency, and the Saudi Riyal (on the right) is the quote currency. The SAR (Saudi Riyal) is the official currency of Saudi Arabia, and one SAR is divided into 100 halalas.

Understanding CHF/SAR

To find out the comparative value of one currency, we require an additional currency to compare. If the base currency’s value goes down, the value of the quote currency moves up and contrariwise. If the market cost of this pair is 4.0742, then this amount of SAR is required to buy one unit of CHF.

Spread

Forex brokers have two distinct prices for currency pairs, which are classified as the bid and ask price. The bid price is the offering price, and ask is the buy price. The distinction between the ask and the bid price is known as the spread. The spread is how brokers make their income. Below are the spreads for CHF/SAR currency pairs in both ECN & STP brokers.

ECN: 9 pips | STP: 14 pips

Fees

A Fee is basically the compensation we pay to the broker each time we execute a spot. There is no compensation charged on STP account models, but a few additional pips are charged on ECN accounts.

Slippage

Slippage refers to the distinction between the trader’s anticipated price and the original price at which the trade is executed. It can occur at any time but often occurs when the market is fast-phased and volatile. Also, sometimes slippage occurs when we place a large number of orders at the same time.

Trading Range in CHF/SAR

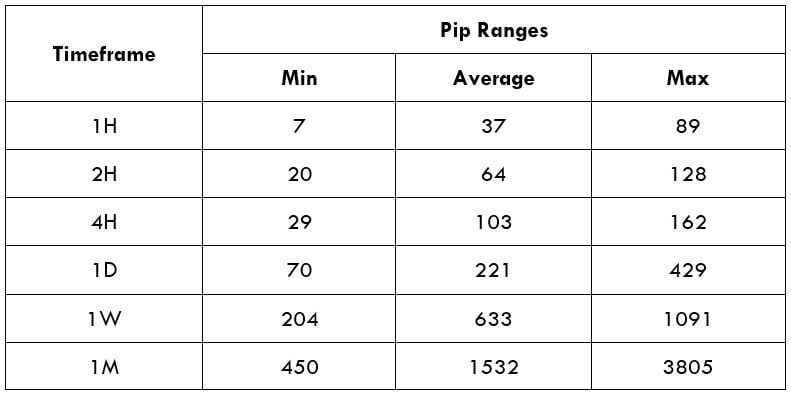
The amount of money we will earn or lose in a specific timeframe can be evaluated using the trading range table. It is an illustration of the minimum, average, and maximum pip movement in a currency pair. This can be assessed simply by using the ART indicator with 200-period SMA. 

Procedure to assess Pip Ranges

  1. Add the ATR indicator to your chart
  2. Set the period to 1
  3. Add a 200-period SMA to this indicator
  4. Shrink the chart so you can assess a large time period
  5. Select your desired timeframe
  6. Measure the floor level and set this value as the min
  7. Measure the level of the 200-period SMA and set this as the average
  8. Measure the peak levels and set this as Max.

CHF/SAR Cost as a Percent of the Trading Range

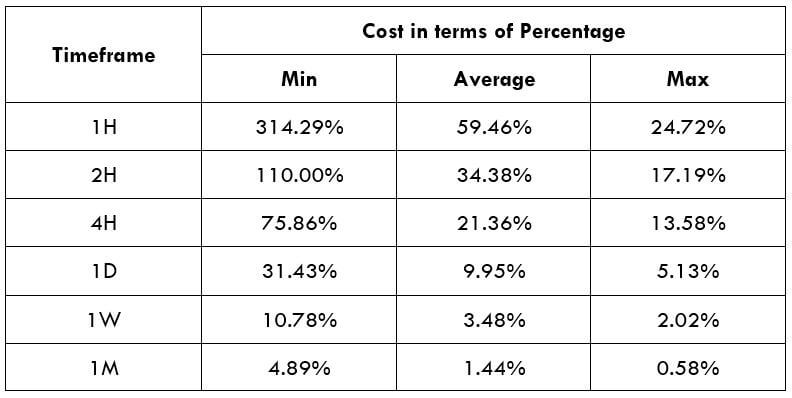
The cost of trade widely varies on the broker and differs based on the volatility of the market. This is because the total cost also includes slippage and spreads, excluding the trading fee. Below is the interpretation of the cost variation in terms of percentages. The understanding of it is discussed in the subsequent sections.

ECN Model Account

Spread = 9 | Slippage = 5 |Trading fee = 8

Total cost = Slippage + Spread + Trading Fee = 5 + 9 + 8 = 22

STP Model Account

Spread = 14 | Slippage = 5 | Trading fee = 0

Total cost = Slippage + Spread + Trading Fee = 5 + 14 + 0 = 19

The ideal way to trade the CHF/SAR

The CHF/SAR is an exotic-cross currency pair, and it is volatile. For example, the average pip movement on the 1H timeframe for this pair is ~37pips. From the earlier tables, it is clear that the higher the volatility, the lower is the cost of the trade. Nevertheless, this is not an added benefit, as it is risky to trade when the markets are incredibly volatile.

Trading in such timeframes will ensure low expenses just as reduced liquidity. It will also involve fewer costs by placing orders using limit/pending orders instead of market orders. This will substantially reduce the total cost with slippage being zero.

STP Model Account (Using Limit Orders)

Spread = 14 | Slippage = 0 | Trading fee = 0

Total cost = Slippage + Spread + Trading Fee = 0 + 14 + 0 = 14

While reading the above tables, if the ratios are larger, more significant are the trade costs. Likewise, if the proportions are small, lower are the costs. This can be inferred as the trading costs are more significant for low volatile markets and smaller for high volatile markets. I hope this article will support you to trade this pair in a much efficient way. Cheers!

Categories
Forex Assets

Examining The Volatility Of CHF/TRY Forex Exotic Pair

Introduction

The abbreviation of CHF/TRY is Swiss Franc, paired with the Turkish Lira. In this pair, CHF is the official currency of Switzerland and is also the fifth highly traded currency in the Forex Exchange market. In contrast, TRY stands for the Turkish Lira, and it is the official currency of Turkey. This pair is classified as an exotic pair.

Understanding CHF/TRY

In the Foreign exchange market, to determine the relative value of one currency, we need an alternative currency to evaluate. Hence, when we are buying a currency (base) we are simultaneously selling one (the quote currency). The market value of CHF/TRY helps us to understand the power of TRY against the CHF. So, if the trade rate for the pair CHF/TRY is 7.1972, it means to buy 1 CHF, we need 7.1972 TRY.

CHF/TRY Specification

Spread

Spread is the distinction between the ask-bit price that is set at the exchanges. Below are the spread values of the CHF/TRY currency pair in both ECN & STP accounts. The spread charges for ECN and STP brokers for the CHF/TRY pair can be found below.

ECN: 35 pips | STP: 40 pips

Fees

For every position, a trader enters the stockbroker charges some fee for it. Traders must know that this fee is charged only on ECN accounts and not on STP accounts.

Slippage

Slippage is the price difference between the trader’s execution and at which the broker executed the price. The difference is because of the high market volatility and slow execution speed.

Trading Range in CHF/TRY

A trading range is the interpretation of the volatility in CHF/TRY in several timeframes. The values are obtained from the Average True Range indicator. One can use the table as a risk management tool to identify the profit/loss that a trader is possessed.

Below is a table indicating the minimum, average, and max volatility (pip movement) on various timeframes.

Procedure to assess Pip Ranges

  1. Add the ATR indicator to your chart
  2. Set the period to 1
  3. Add a 200-period SMA to this indicator
  4. Shrink the chart so you can assess a large time period
  5. Select your desired timeframe
  6. Measure the floor level and set this value as the min
  7. Measure the level of the 200-period SMA and set this as the average
  8. Measure the peak levels and set this as Max.

CHF/TRY Cost as a Percent of the Trading Range

The total cost of the trade fluctuates based on the volatility of the market. So, we must figure out the occasions when the costs are less to place ourselves in the market. Below is a table demonstrating the variant in the costs based on the change in the volatility of the market.

Note: The percentage rates represent the relative scale of costs and not the fixed costs on the trade.

ECN Model Account

Spread = 35 | Slippage = 5 | Trading fee = 8

Total cost = Slippage + Spread + Trading Fee = 5 + 35 + 8= 48

STP Model Account

Spread = 40 | Slippage = 5 | Trading fee = 0

Total cost = Slippage + Spread + Trading Fee = 5 + 40 + 0 = 45

The Ideal way to trade the CHF/TRY

Volatility and cost are the two components traders take into consideration for trading any security in the market. With the assistance of the above tables, let us evaluate these two factors to trade the CHF/TRY Forex pair.

As we can see, the pip variation is significantly high between the minimum volatility and the average volatility in each timeframe. As a day trader, our aim is to make income from the market’s pip movement. But, if there is hardly any movement in the price, it becomes tricky to make profits from the market. Thus, it is ideal to trade when the volatility is at the average value.

The cost of trade rises as the volatility decrease. They are inversely proportional. In other words, highly volatile markets have minimum costs. Though it is quite risky to trade markets with higher volatility, it can be considered by aggressive traders with optimal money management techniques in place as the costs are low. Hence, to retain a balance among the cost and volatility, traders may find trading occasions when the volatility is near the average values or a little above it.

Categories
Forex Assets

GBP/INR Exotic Pair – Analyzing The Trading Costs Involved

Introduction

GBP Pound sterling, also known as the pound, is the official currency of the United Kingdom. It is very well known, and in fact, it is the fourth most-traded currency in the Forex market. INR (Indian rupee) is the official currency of India. This currency is controlled and managed by the Reserve Bank of India.

GBP/INR

In the Forex market, one currency is always quoted against the other as the currencies are trades in pairs. GBP/INR represents the trading of the Pound sterling against the Indian rupee. In this case, the first currency (GBP) is the base, and the second (INR) is the quote currency. The GBP/INR is classified as exotic-cross currency pair.

Understanding GBP/INR

To find out the relative value of one currency, we need another currency to compare. If the value of the base currency goes down, the value of the quote currency goes up and vice versa.

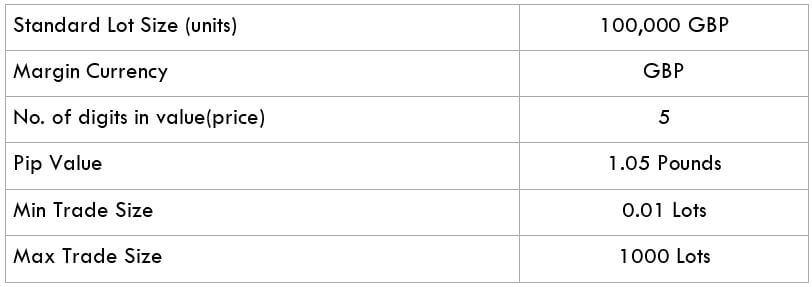
The market value of GBPINR determines the strength of INR against the GBP. This can be easily understood as 1GBP is equal to how much INR. So if the exchange rate for the pair GBP/INR is 94.034, it means 1GBP is equal to 94.034 INR.

Spread

Forex brokers have two different prices for currency pairs: the bid and ask price. The bid price is the selling price, and ask is the buy price. The difference between the ask and the bid price is called the spread. The spread is how brokers make their money. Below are the spreads for GBP/INR currency pair in both ECN & STP brokers.

ECN: 55 pips | STP: 57 pips

Fees

A Fee is simply the commission we pay to the broker each time we execute a position. There is no fee on STP account models, but a few pips on ECN accounts.

Slippage

Slippage refers to the difference between the trader’s expected price and the actual price at which the trade is executed. It can occur at any time but mostly happens when the market is fast-moving and volatile. Also, sometimes slippage occurs when we place a large number of orders at the same time.

Trading Range in GBP/INR

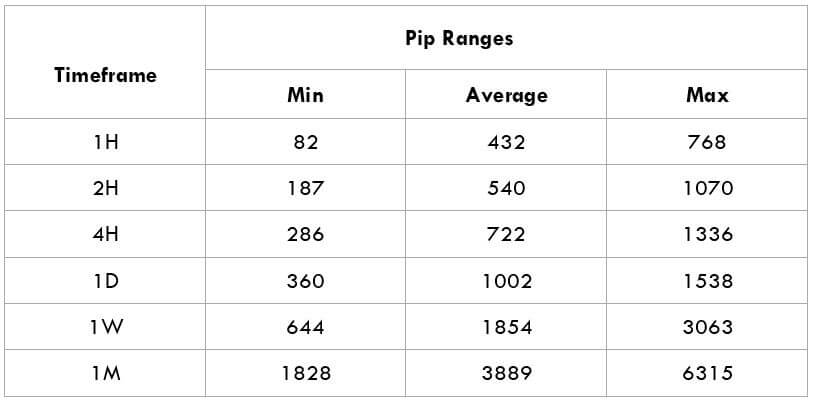
The amount of money we will win or lose in a given amount of time can be assessed using the trading range table. It is a representation of the minimum, average, and maximum pip movement in a currency pair. This can be evaluated simply by using the ART indicator combined with 200-period SMA.

Procedure to assess Pip Ranges

  1. Add the ATR indicator to your chart
  2. Set the period to 1
  3. Add a 200-period SMA to this indicator
  4. Shrink the chart so you can assess a significant period
  5. Select your desired timeframe
  6. Measure the floor level and set this value as the min
  7. Measure the level of the 200-period SMA and set this as the average
  8. Measure the peak levels and set this as Max.

GBP/INR Cost as a Percent of the Trading Range

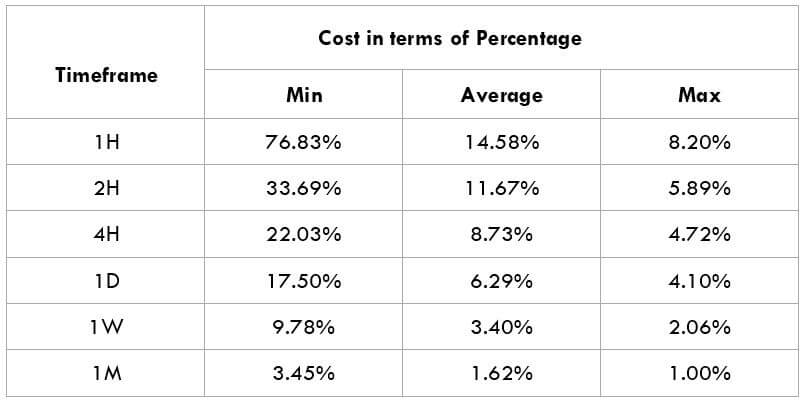
The cost of trade mostly depends on the broker and varies based on the volatility of the market. This is because the total cost involves slippage and spreads apart from the trading fee. Below is the representation of the cost variation in terms of percentages. The comprehension of it is discussed in the following sections.

ECN Model Account

Spread = 55 | Slippage = 3 |Trading fee = 5

Total cost = Slippage + Spread + Trading Fee = 3 + 55 + 5 = 63

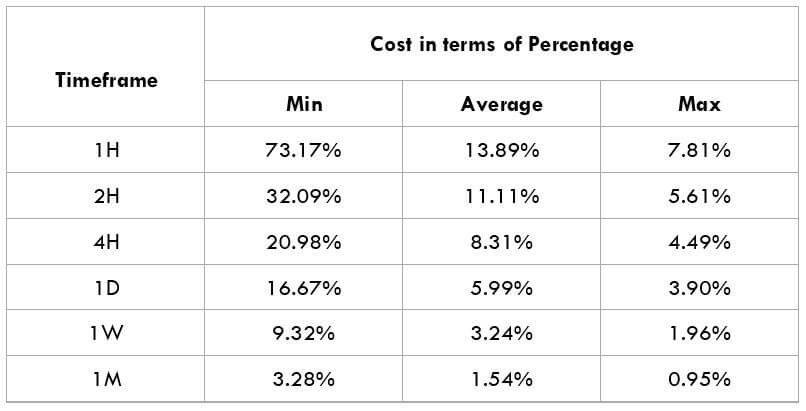
STP Model Account

Spread = 57 | Slippage = 3 | Trading fee = 0

Total cost = Slippage + Spread + Trading Fee = 3 + 57 + 0 = 60

Trading the GBP/INR Exotic pair

The GBP/INR is an exotic-cross currency pair and is volatile in nature. For instance, the average pip movement on the 1H timeframe of this pair is about 432 pips. From the above tables, it is clear that the higher the volatility, the lower is the cost of the trade. However, this is not an advantage as it is risky to trade when the markets are highly volatile.

While reading the above tables, if the percentages are larger, higher are the costs on the trade. Likewise, if the percentages are small, lower are the costs. So, this can be interpreted as the trading costs are higher for low volatile markets and lower for high volatile markets.

It is always recommended to trade when the volatility is around the minimum values. Because at min values, the volatility is low, and the costs are a little high compared to the average and maximum values. But, if your priority is towards reducing costs, you may trade when the volatility of the market is around the average values. Cheers!

Categories
Forex Assets

Trading Costs Involved While Trading The EUR/SGD Exotic pair

Introduction

EUR/SGD is the abbreviation for the Euro area’s euro against the Singapore Dollar. This is one of the most traded exotic currency pairs in the world. In this pair, EUR is the base currency, and SGD is the quote currency.

Understanding EUR/SGD

The price of this pair represents the value of SGD, which is equal to one EUR. It is quoted as 1 EUR per X SGD. For example, if the value of this pair is 1.5552, then about 1.5 Singapore Dollars are required to purchase one euro.

EUR/SGD Specification

Spread

The spread is the difference between the bid and the ask price in the market. These two prices are set by the brokers. And it depends on the type of execution model used by the brokers.

Spread on ECN: 10 pips | Spread on STP: 11 pips

Fees

On ECN accounts, for every position you open, there is some fee involved with it. This is different for different brokers. However, on STP accounts, there is no fee as such.

Slippage

To put it in simple words, slippage is the difference between the trader’s demanded price and price given by the broker. The trader does not get his intended price due to two reasons – Broker’s execution speed & Market volatility

Trading Range in EUR/SGD

With the trading range table, we can assess our gain/loss on a trade in a given timeframe even before we open positions for it. This is done by considering the past volatility of the market.

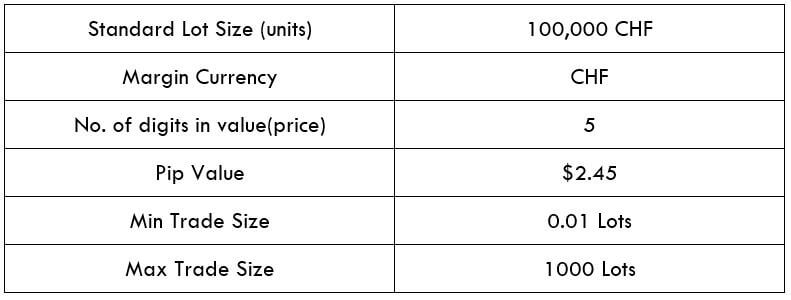
Now, to determine the profit/loss on a trade, all you must do is, multiply the volatility value with the pip value ($7.25).

Procedure to assess Pip Ranges

  1. Add the ATR indicator to your chart
  2. Set the period to 1
  3. Add a 200-period SMA to this indicator
  4. Shrink the chart so you can assess a large time period
  5. Select your desired timeframe
  6. Measure the floor level and set this value as the min
  7. Measure the level of the 200-period SMA and set this as the average
  8. Measure the peak levels and set this as Max.

EUR/SGD Cost as a Percent of the Trading Range

This is an excellent application to the above volatility table. By considering the pip movement values, we can determine the cost variation of a trade as well. To do so, we find the ratio between the total cost and volatility value and convert it into percentages. Below are the cost variations for ECN and STP accounts models.

ECN Model Account 

Spread = 10 | Slippage = 3 | Trading fee = 3

Total cost = Slippage + Spread + Trading Fee = 3 + 10 + 3

Total cost = 16

STP Model Account

Spread = 11 | Slippage = 3 | Trading fee = 0

Total cost = Slippage + Spread + Trading Fee = 3 + 11 + 0

Total cost = 14

The Ideal way to trade the EUR/SGD

Comprehending the costs : Large/Small percentage -> High/Low costs

From the above the tables and the implications, we can conclude that costs are high when the volatility of the low and high when the volatility is low. And when it comes to the ideal way to trade this pair, conservative traders may trade it during those times when the volatility values are at or above the average values. This will ensure enough volatility as well as affordable costs. And other aggressive traders may trade during any of the extremes.

Also, traders can reduce their total costs by trading using limit orders and stop orders. Unlike the market orders, limit and stop orders do not include slippage on the trade. Hence, this will reduce costs considerably.

Categories
Forex Assets

Analyzing The USD/MAD Forex Currency Pair

Introduction

USD/MAD is the abbreviation for the US dollar against the Moroccan Dirham. This pair is classified as an emerging currency pair in the forex market. In this pair, USD is the base currency, and MAD is the quote currency. Typically. It is seen that this pair has pretty low volatility and liquidity. However, it can still be traded under certain conditions.

Understanding USD/MAD

The market price of this currency pair determines the value of MAD that is equivalent to one USD. For instance, if the current market price of USD/MAD is 9.5867, then these many Moroccan Dirhams are required to purchase one USD.

Spread

The difference between the bid price and the ask price is referred to as the spread. This is the primary way through which brokers generate revenue. Spread is a variable and is different with different brokers. It also differs based on the execution model used by the broker.

ECN: 35 pips | STP: 40 pips

Fees

The commission paid on each trade is the fee on that trade. Note that, the concept of the fee is only ECN accounts and not STP accounts. The fee on ECN accounts is typically between 5-10 pips.

Slippage

Slippage is the difference between the price intended by the client and the price that is actually executed by the broker. There is this difference due to two reasons:

  • Market’s volatility
  • Broker’s execution speed

Trading Range in USD/MAD

The trading range is the tabular representation of the volatility of the market in different timeframes. These values help in assessing the minimum, average, and maximum profit/loss in six different timeframes.

Procedure to assess Pip Ranges

  1. Add the ATR indicator to your chart
  2. Set the period to 1
  3. Add a 200-period SMA to this indicator
  4. Shrink the chart so you can assess a large time period
  5. Select your desired timeframe
  6. Measure the floor level and set this value as the min
  7. Measure the level of the 200-period SMA and set this as the average
  8. Measure the peak levels and set this as Max.

USD/MAD Cost as a Percent of the Trading Range

The total cost of the trade is calculated by adding up the slippage, spread, and the trading fee. It is not constant but varies based on the volatility of the market. Below are tables that represent how costs vary for different timeframes and volatilities.

ECN Model Account

Spread = 35 | Slippage = 3 |Trading fee = 3

Total cost = Slippage + Spread + Trading Fee = 3 + 35 + 3 = 41

STP Model Account

Spread = 40 | Slippage = 3 | Trading fee = 0

Total cost = Slippage + Spread + Trading Fee = 3 + 40 + 0 = 43

The Ideal way to trade the USD/MAD

Starting off from the trading range table, we can see that the volatility of this pair is quite high. The spread, too, is higher than other emerging pairs. So, it is not really ideal to trade at any time in 24 hours.

When we have a look at the cost percentage tables, we can see that the percentages are high in the minimum column, and low in the max column. This implies that the costs are high during low volatilities, and costs are low during high volatilities. So, the best time to trade this pair is when the volatility is around the average values because this assures decent volatility as well as affordable costs.

Furthermore, the costs can be reduced by placing orders as ‘limit’ instead of ‘market’. In doing so, the slippage on the total costs will be made zero. So, spread and trading fee will be the only factors involved in calculating the total cost.