Categories
Forex Fundamental Analysis

GBP/CHF Global Macro Analysis – Part 1 & 2

Introduction

The global macro analysis of the GBP/CHF currency pair will involve analysing endogenous and exogenous factors. Endogenous factors drive the domestic GDP growth in the UK and Switzerland. Exogenous factors influence the exchange rate for the currency pair.

Ranking Scale

The analysis will rank the endogenous and exogenous factors on a scale from -10 to +10. The score for endogenous factors will be determined from a correlation analysis with the domestic GDP growth rate. If the score is negative, it means that the endogenous factor has led to the domestic currency depreciation. If positive, it has caused the appreciation of the domestic currency.

The exogenous analysis score is from a correlation analysis with the exchange rate for the GBP/CHF pair. When the score is negative, traders can expect the bearish trend for the pair. If positive, then the pair is expected to have a bullish trend.

Summary – GBP Endogenous Analysis

A -15 score implies that GBP has depreciated since the beginning of 2020.

Summary – CHF Endogenous Analysis

A score of 3 implies that CHF has partially appreciated since the beginning of this year.

Indicator Score Total State Comment
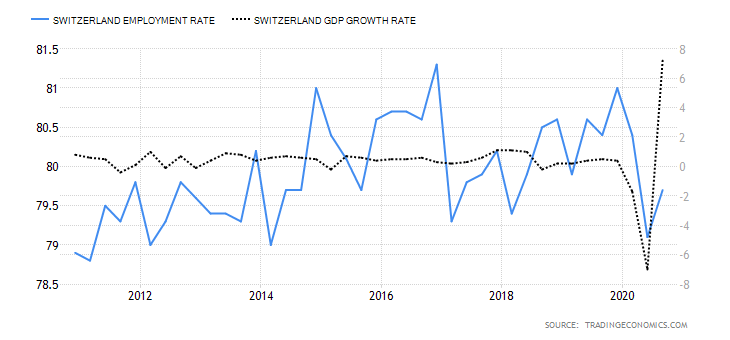
Switzerland Employment Rate -3 10 79.7% in Q3 2020 Slightly below the 80.4% recorded in Q1.
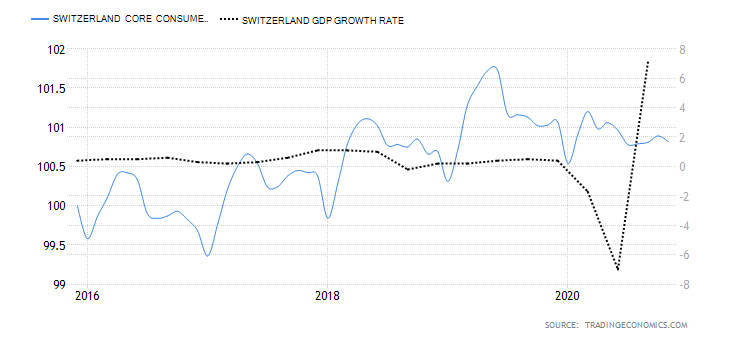
Switzerland Core Consumer Prices 4 10 100.82 points in November Inflation, as measured by the core consumer prices, rose by 0.28 points from January to November
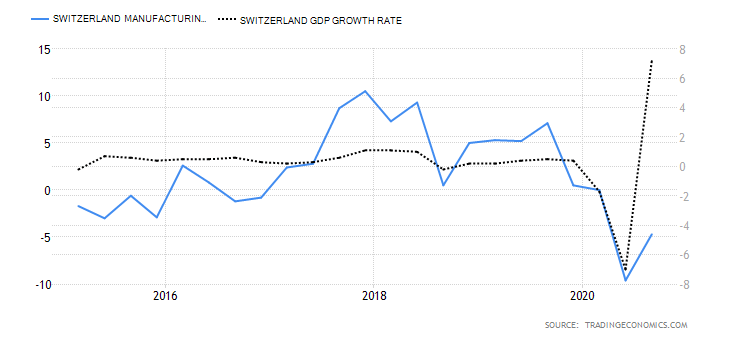
Switzerland Manufacturing Production -2 10 4.7% decrease in Q3 2020 The YoY swiss manufacturing production is recovering
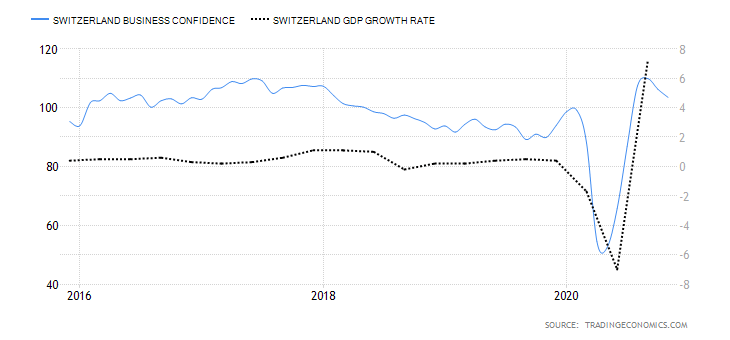
Switzerland Business Confidence 3 10 103.5 in November Swiss KOF Economic Barometer dropped in October and November. The majority of the consecutive drop was driven by private consumption
Switzerland Consumer Spending 5 10 Q3 spending was 91.929 billion CHF Q3 had the highest consumer spending compared to Q1 and Q2.
Switzerland Construction Output -2 10 A 0.4% drop in Q3 2020 Q3 output recovered from the 5% drop in Q2 but is still lower than the 3.1% growth in Q1
Switzerland Government Budget Value -2 10 An expected deficit of 2.2 billion CHF in 2020 Switzerland had a surplus of 8.1 billion CHF in 2019. The projected deficit is on account of aggressive government stimulus program and decreases in revenue due to COVID-19
TOTAL SCORE 3
  1. Switzerland Employment Rate

The Swiss employment rate measures the quarterly change in the percentage of the labour force that is employed. Changes in the number of people employed in the economy are a leading indicator of economic growth. When the economy is expanding, businesses create more job opportunities; hence, higher employment rate. Conversely, a shrinking economy leads to job cuts, which result in a lower employment rate.

In 2020 Q3, the Switzerland employment rate rose to 79.7% from the 6-year lows of 79.1%. Although the Q3 employment rate is lower than the 80.4% recorded in Q1, it shows that the Swiss economy is recovering from the economic shocks of COBID-19. The swiss employment rate scores -3.

  1. Switzerland Core Consumer Prices

Core consumer prices measure the rate of inflation by monitoring the price changes of only a select basket of goods and services. Consumer products with volatile prices are excluded. The rate of inflation is a leading indicator of economic growth. That’s because when inflation rises, it means domestic demand is on the rise, too, hence a higher GDP growth rate. Similarly, a decrease in the inflation rate means domestic demand is depressed, which may be followed by a contracting economy.

In November 2020, the swiss core consumer prices dropped to 100.82 points from 100.89 points in October. However, it is still higher than 100.54 points recorded in January. It has a score of 4.

  1. Switzerland Manufacturing Production

This measures the YoY change in the value of output from the swiss manufacturing sector. This sector plays a significant role in the Swiss economy. Therefore, growth in manufacturing production is accompanied by growth in the labour market and, consequently, the domestic economy’s expansion.

In Q3 of 2020, the YoY swiss manufacturing production dropped by 4.7%. That’s an improvement from the 9.6% drop in Q2. We assign a score of -2.

  1. Switzerland Business Confidence

The KOF Swiss Economic Institute compiles this index. It measures company managers’ optimism based on their perspective of the economy and the growth prospects of their businesses. The business that is surveyed are drawn from multiple sectors in the economy and contains 219 different variables.

In November 2020, the Swiss KOF Economic Barometer dropped to 103.5 from 106.3 in October. This marks the send consecutive month of a drop in the swiss business confidence. Notably, the drop in the index is primarily driven by the manufacturing sector and private consumption. Swiss business confidence has a score of 3.

  1. Switzerland Consumer Spending

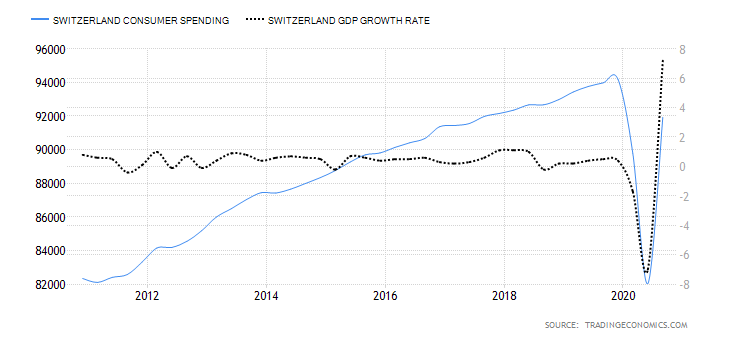
This is the value of the total consumption by Swiss households. Domestic consumption is a primary driver of GDP growth. More so, it also an indicator of the performance in the labour market. With a higher rate of employment, disposable income increases, which increases consumer spending.

Swiss consumer spending increased to CHF 91.929 billion in the third quarter of 2020, which is the highest recorded compared to CHF 89.79 billion in Q1 and CHF 82.03 billion in Q2. It has a score of 5.

  1. Switzerland Construction Output

This indicator measures the percentage change in the value paid for construction work in Switzerland. The construction work includes building and engineering works done by public and private companies. Typically, when construction work increases, it is expected to be accompanied by an increase in the employment rate and economic growth.

In the third quarter of 2020, the YoY swiss construction output dropped by 0.4%. That is an improvement compared to the 5% drop in Q2 but still less than the 3.1% growth recorded in Q1. It has a score of -2.

  1. Switzerland General Government Budget Value

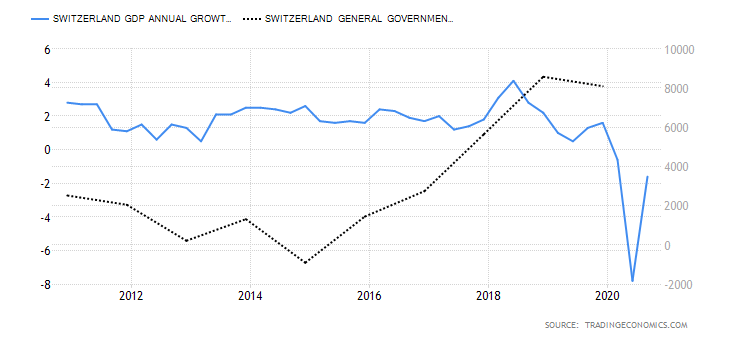
This represents the difference between the revenues received by the Swiss government and its expenditures. Government expenditure includes all transfer payments and purchases of goods and services. The general government budget value shows if the Swiss government has a surplus or a deficit. Too much deficit means that the economy is probably not responding to expansionary fiscal policies.

In 2019, the Swiss government had a budget surplus of CHF 8.097 billion. In 2020, the general government budget was expected to hit a deficit of CHF 2.2 billion. This deficit is primarily driven by a significant drop in revenue collection due to COVID-19. It has a score of -2.

In the very next article, you can find the Exogenous analysis of the GBP/CHF currency pair, so make sure to check that out. Cheers.

Categories
Forex Assets

Examining The Volatility Of CHF/TRY Forex Exotic Pair

Introduction

The abbreviation of CHF/TRY is Swiss Franc, paired with the Turkish Lira. In this pair, CHF is the official currency of Switzerland and is also the fifth highly traded currency in the Forex Exchange market. In contrast, TRY stands for the Turkish Lira, and it is the official currency of Turkey. This pair is classified as an exotic pair.

Understanding CHF/TRY

In the Foreign exchange market, to determine the relative value of one currency, we need an alternative currency to evaluate. Hence, when we are buying a currency (base) we are simultaneously selling one (the quote currency). The market value of CHF/TRY helps us to understand the power of TRY against the CHF. So, if the trade rate for the pair CHF/TRY is 7.1972, it means to buy 1 CHF, we need 7.1972 TRY.

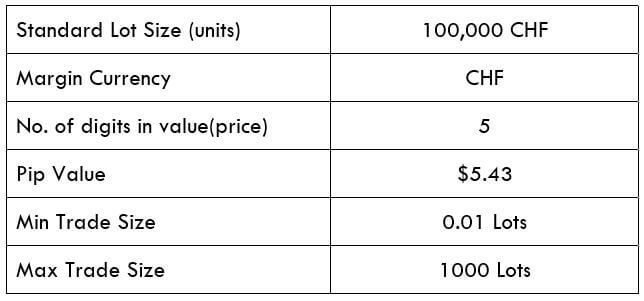
CHF/TRY Specification

Spread

Spread is the distinction between the ask-bit price that is set at the exchanges. Below are the spread values of the CHF/TRY currency pair in both ECN & STP accounts. The spread charges for ECN and STP brokers for the CHF/TRY pair can be found below.

ECN: 35 pips | STP: 40 pips

Fees

For every position, a trader enters the stockbroker charges some fee for it. Traders must know that this fee is charged only on ECN accounts and not on STP accounts.

Slippage

Slippage is the price difference between the trader’s execution and at which the broker executed the price. The difference is because of the high market volatility and slow execution speed.

Trading Range in CHF/TRY

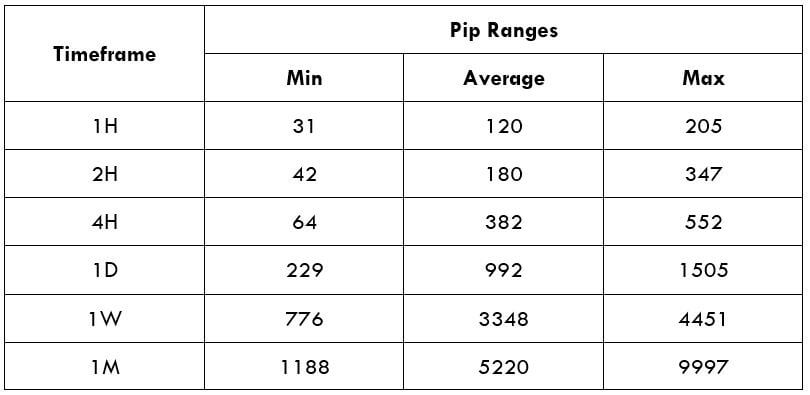
A trading range is the interpretation of the volatility in CHF/TRY in several timeframes. The values are obtained from the Average True Range indicator. One can use the table as a risk management tool to identify the profit/loss that a trader is possessed.

Below is a table indicating the minimum, average, and max volatility (pip movement) on various timeframes.

Procedure to assess Pip Ranges

  1. Add the ATR indicator to your chart
  2. Set the period to 1
  3. Add a 200-period SMA to this indicator
  4. Shrink the chart so you can assess a large time period
  5. Select your desired timeframe
  6. Measure the floor level and set this value as the min
  7. Measure the level of the 200-period SMA and set this as the average
  8. Measure the peak levels and set this as Max.

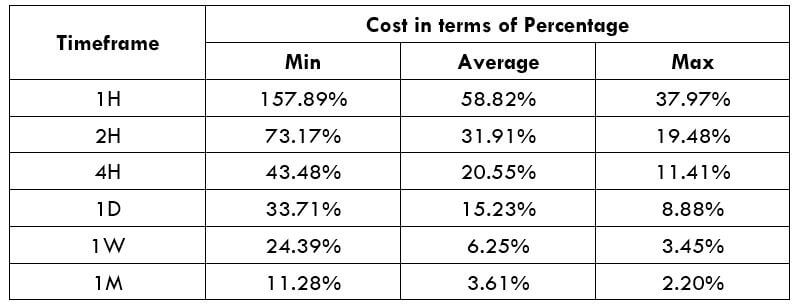
CHF/TRY Cost as a Percent of the Trading Range

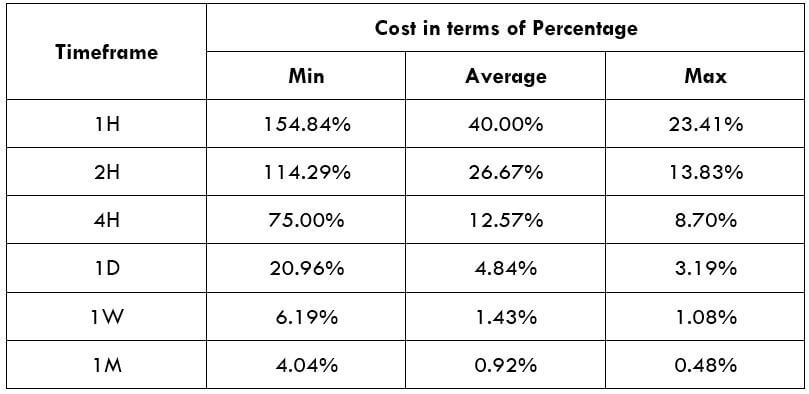
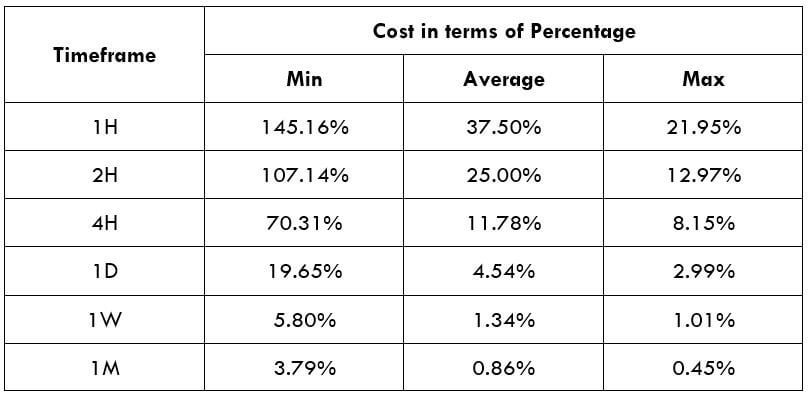
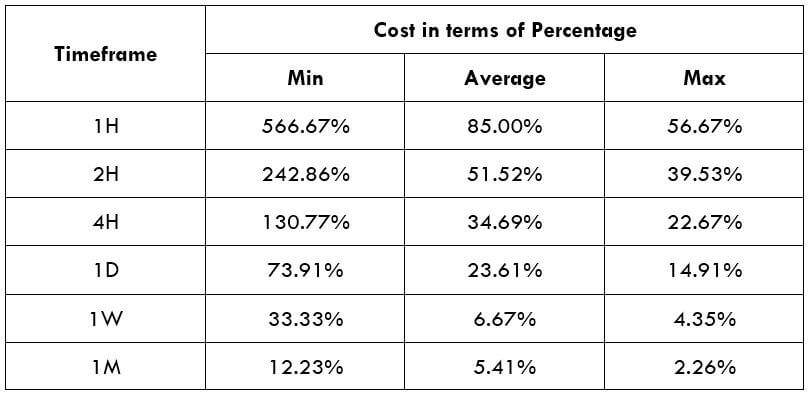
The total cost of the trade fluctuates based on the volatility of the market. So, we must figure out the occasions when the costs are less to place ourselves in the market. Below is a table demonstrating the variant in the costs based on the change in the volatility of the market.

Note: The percentage rates represent the relative scale of costs and not the fixed costs on the trade.

ECN Model Account

Spread = 35 | Slippage = 5 | Trading fee = 8

Total cost = Slippage + Spread + Trading Fee = 5 + 35 + 8= 48

STP Model Account

Spread = 40 | Slippage = 5 | Trading fee = 0

Total cost = Slippage + Spread + Trading Fee = 5 + 40 + 0 = 45

The Ideal way to trade the CHF/TRY

Volatility and cost are the two components traders take into consideration for trading any security in the market. With the assistance of the above tables, let us evaluate these two factors to trade the CHF/TRY Forex pair.

As we can see, the pip variation is significantly high between the minimum volatility and the average volatility in each timeframe. As a day trader, our aim is to make income from the market’s pip movement. But, if there is hardly any movement in the price, it becomes tricky to make profits from the market. Thus, it is ideal to trade when the volatility is at the average value.

The cost of trade rises as the volatility decrease. They are inversely proportional. In other words, highly volatile markets have minimum costs. Though it is quite risky to trade markets with higher volatility, it can be considered by aggressive traders with optimal money management techniques in place as the costs are low. Hence, to retain a balance among the cost and volatility, traders may find trading occasions when the volatility is near the average values or a little above it.

Categories
Forex Assets

Analyzing The Costs Involved While Trading The ‘CHF/BGN’ Exotic Pair

Introduction

CHF/BGN is the abbreviation for the Swiss Franc and the Bulgarian Lev exotic pair. Here, CHF is the base currency, while BGN is the quote currency. The pair as a whole explains the number of units of the quote currency (BGN) that is required to buy a single unit of the base currency (CHF). BGN stands for The Bulgarian Lev, and it is the official currency of Bulgaria.

Understanding CHF/BGN

In the Forex market, we always purchase the base currency while selling the quote currency and vice versa. Here, the market value of CHF/BGN helps us to comprehend the potential of BGN against the CHF. So if the exchange rate of the pair CHF/BGN is 1.8384, it means to buy1 CHF we need 1.8391 BGN.

CHF/BGN Specification

Spread

Spread in exchange is the distinction between the bid-ask price proposed by the broker. It is quantified in terms of pips and fluctuates on the type of account and kind of broker. Below is the spread for the CHF/BGN pair in both ECN & STP accounts.

Spread on ECN: 7 | STP: 12

Fees

Fees are the commission charged by the broker for each trade a trader takes. The fee varies on both types of accounts and brokers. For our analysis, we have maintained the fee flat at five pips.

Slippage

A trader will not get the price that he demands, due to the volatility in the market. The original price varies from the asked price. The difference is termed as slippage. For instance, if a trader performs a trade at 1.8384, the actual price received would be 1.8391. The difference between the two pips is called slippage.

Trading Range in CHF/BGN

The trading range is a tabular interpretation of the min, average, and maximum pip movement in a specific timeframe. Obtaining understanding about this is essential because it helps manage risk and determine the appropriate times of the day to enter-exit a trade with minor costs.

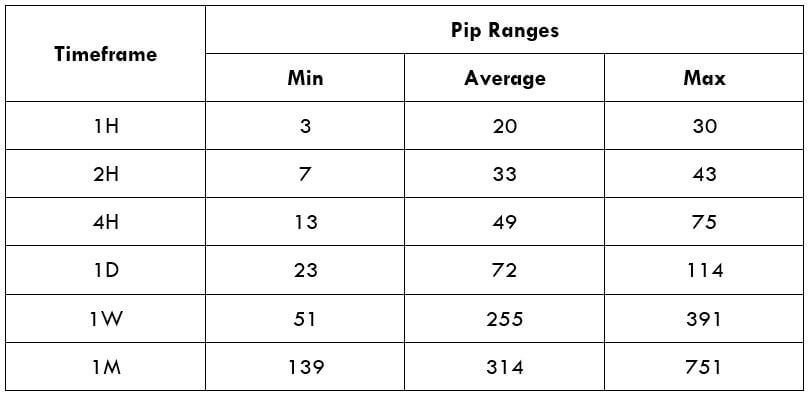
Below is a table representing the minimum, average, and maximum pip movement (volatility) in various timeframes.

Procedure to assess Pip Ranges

  1. Add the ATR indicator to your chart
  2. Set the period to 1
  3. Add a 200-period SMA to this indicator
  4. Shrink the chart so you can assess a large time period
  5. Select your desired timeframe
  6. Measure the floor level and set this value as the min
  7. Measure the level of the 200-period SMA and set this as the average
  8. Measure the peak levels and set this as Max.

CHFBGN Cost as a Percent of the Trading Range

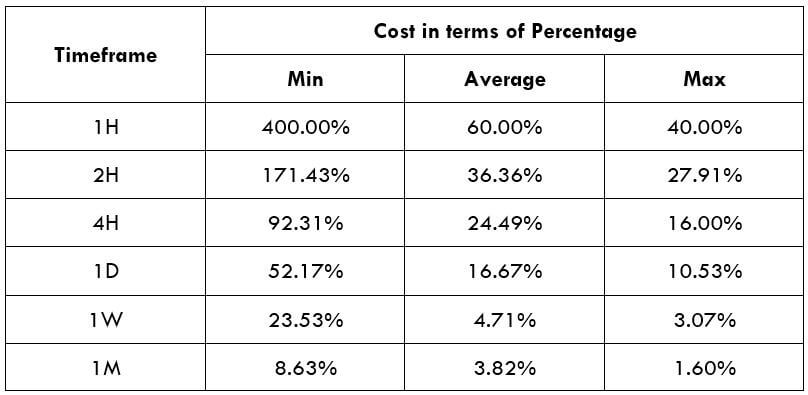
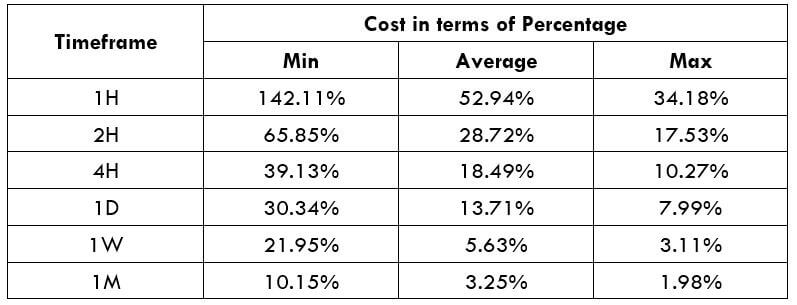
The above table illustrates the number of pips the currency pair move in the various timeframe. We will apply these values to identify the cost ratio when the volatility is minimum, average, and maximum. The cost percentage will then help us sort the ideal time of the day to enter the trades.

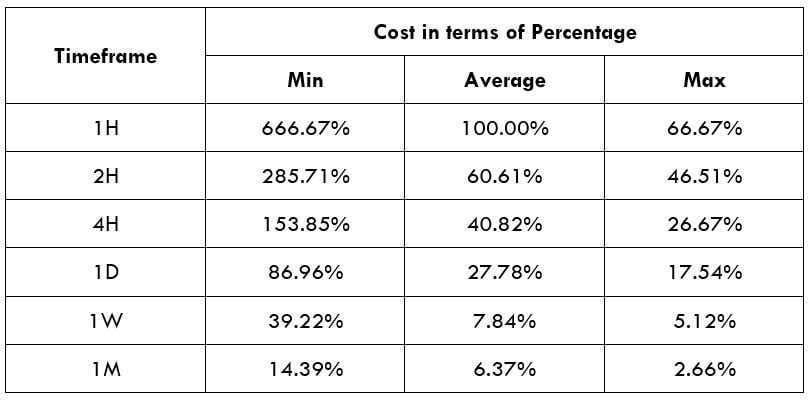
The understanding of the cost percentage is straightforward. If the percentage is elevated, then the cost is high in that specific timeframe and range. If the percentage is low, then the cost is comparatively low for that timeframe and range. The total cost on every trade is calculated by adding up the spread, slippage, and trading fee.

ECN Model Account

Spread = 7 | Slippage = 5 | Trading fee = 8

Total cost = Slippage + Spread + Trading Fee  = 5 + 7 + 8 = 20

STP Model Account

Spread = 12 | Slippage = 5 | Trading fee = 0

Total cost = Slippage + Spread + Trading Fee  = 5 + 12 + 0 = 17

The Ideal way to trade the CHF/BGN

It is not recommended to enter and exit the trade at any time of the day. To manage their trade, a trader must consider various timeframes during the day to reduce both risk and cost of the trade. This is made possible by understanding the above two tables.

In the minimum column, the percentages are generally high. This means the cost is very high when the volatility of the market is low. For example, on the 1H timeframe, when the volatility is three pips, the cost percentage is 666%. This means that one must accept high costs if they enter or exit trades when the volatility is around three pips. Preferably, it is advised to trade when the market’s volatility is above the average.

Additionally, it is considerably better if one trades placing the limit orders instead of market orders, as it invalidates the slippage on the trade. In doing so, the costs of each trade will reduce by approximately 40%.

STP Model Account (Using Limit Orders)

Spread = 12 | Slippage = 0 | Trading fee = 0

Total cost = Slippage + Spread + Trading Fee = 0 + 12 + 0 = 12

Categories
Forex Assets

How Best To Trade The ‘CHF/AUD’ Forex Currency Pair?

Introduction

CHF/AUD is the acronym for the Swiss Franc against the Australian Dollar, and it is an exotic Forex currency pair. Here, the CHF is the base currency, and the AUD is the quote currency. Both CHF and AUD are major currencies and are vastly traded in the foreign exchange market. CHF is the official currency of Switzerland, while AUD is the national currency of Australia.

Understanding CHF/AUD

The price of this pair in the trade market defines the value of AUD equivalent to one Swiss Franc. It is quoted as 1 CHF per X AUD. For instance, if the value of this pair is 1.5318, these many Australian Dollars are required to acquire one CHF. 

Spread

The difference between the ask-bid price is referred to as Spread, which is charged by the broker. This value is different in the ECN and STP accounts. The estimated Spreads for CHF/AUD pair is given below.

ECN: 17 pips | STP: 22 pips

Fees & Slippage

A fee is a price that one pays for the trade. There are zero fees charged on STP accounts, but a few pips are charged on ECN accounts. Slippage is the difference calculated between the price by the trader and the price the trader received from the broker.

Trading Range in CHF/AUD

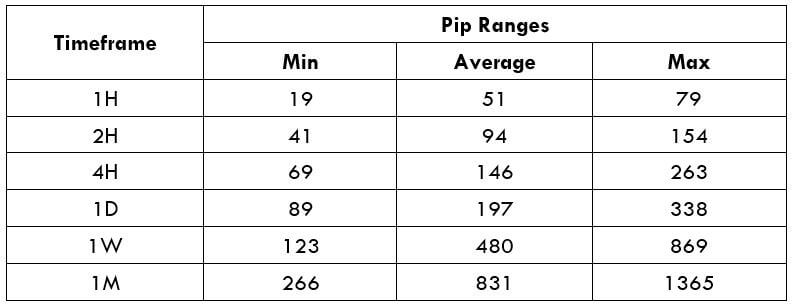
The trading range is represented in the tabular format to showcase the pip movement of a currency pair in various timeframes. These values are useful in ascertaining the profit that can be generated from trade in advance. To discover the trading costs, we must multiply the below volatility value with the pip value of this pair.

Procedure to assess Pip Ranges

  1. Add the ATR indicator to your chart
  2. Set the period to 1
  3. Add a 200-period SMA to this indicator
  4. Shrink the chart so you can assess a large time period
  5. Select your desired timeframe
  6. Measure the floor level and set this value as the min
  7. Measure the level of the 200-period SMA and set this as the average
  8. Measure the peak levels and set this as Max.

CHF/AUD Cost as a Percent of the Trading Range

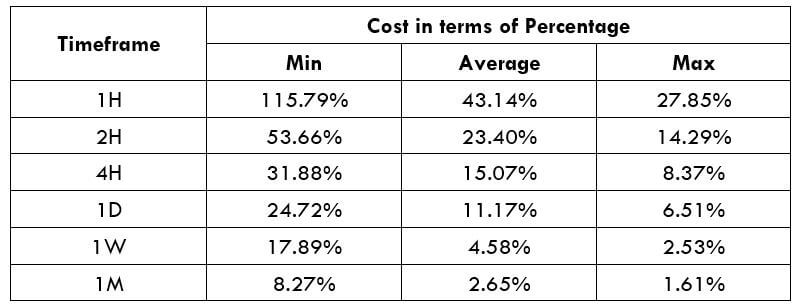
The trading range is obtained by identifying the ratio between total cost and volatility; it expressed in terms of percentage. Below is the representation of the cost differences of traders in various timeframes and volatilities.

ECN Model Account

Spread = 17 | Slippage = 5 |Trading fee = 8

Total cost = Slippage + Spread + Trading Fee = 5 + 17 + 8 = 30

STP Model Account

Spread = 22 | Slippage = 5 | Trading fee = 0

Total cost = Slippage + Spread + Trading Fee = 5 + 22 + 0 = 27

Trading the CHF/AUD

When the percentage value is higher, the cost of the trade gets more expensive. From the above tables, we can conclude the values are significant in the min column and relatively less significant in the max column. It means that the costs are high when the market’s volatility is low. It is not advisable to trade when both the volatility and cost of trading is high. Balancing both these factors is ideal to trade when the pair’s volatility is in the range of the average values.

Additionally, to lower your costs even further, you can place trades using limit orders instead of market orders. By executing limit orders, the slippage will not be involved in the calculation of the total costs. And this will set the cost of the trades low by a decent number. An example of the same is given below.

STP Model Account (Using Limit Orders)

Spread = 22 | Slippage = 0 |Trading fee = 0

Total cost = Slippage + Spread + Trading Fee = 0 + 22 + 0 = 22

Categories
Forex Assets

Exploring The GBP/XPF Exotic Forex Currency Pair

Introduction To GBP/XPF

The abbreviation of GBP/XPF is British Pound vs. the French Pacific Franc. Here GBP is the official currency of the United Kingdom, and many others, it is also proven to be the fourth most traded currency in the forex market after USD, EURO, and JPY. In contrast, The CFP franc is the currency used in French overseas.

Understanding GBP/XPF

We know that in currency pairs, the first currency is the base currency, and the second currency is the quote currency. Here, the market value of GBP/XPF helps us to understand the strength of XPF against the GBP. So let’s take if the exchange rate for the pair GBP/XPF is 135.984, it means we need 135.984 XPF to buy 1 GBP.

Spread

We have two different prices for currency pairs in forex, the bid and ask price. Here the “bid” price at which we can SELL the base currency, and The “ask” price is at which we BUY the base currency. The difference between the ask price and the bid price is called the spread. Below is the spread for ECN and STP broker for the GBP/XPF pair.

ECN: 52 pips | STP: 55 pips

Fees

A Fee in forex is simply the commission we need to pay to the broker for opening a particular position. The fees depend on the type of broker we use. Like for example, we don’t have any fees for ECN, but we have some for STP.

Slippage

Slippage is the difference between the trader’s anticipated price and the actual price at which the trade is executed. It mostly occurs when the volatility of the currency pair is high and also, sometimes, when a large number of orders are placed at the same time.

Trading Range in GBP/XPF

Volatility is an essential factor that every trader should take into consideration before entering the market. The amount of capital we will win or lose in a given amount of time can be evaluated using the trading range table. Here, the trading range is a representation of the minimum, average, and maximum pip movement in a currency pair. This can be evaluated simply by using the ATR indicator combined with 200-period SMA.

Procedure to assess Pip Ranges

  1. Add the ATR indicator to your chart
  2. Set the period to 1
  3. Add a 200-period SMA to this indicator
  4. Shrink the chart so you can assess a significant period
  5. Select your desired timeframe
  6. Measure the floor level and set this value as the min
  7. Measure the level of the 200-period SMA and set this as the average
  8. Measure the peak levels and set this as Max.

GBP/XPF Cost as a Percent of the Trading Range

The cost of trade depends mostly on the broker and also varies based on the volatility of the market. We have various costs involved in the overall trading cost that includes slippage, spreads, and sometimes the trading fee. Below is the calculation of the cost variation in terms of percentages. The conception of it is discussed in the following sections.

ECN Model Account

Spread = 52 | Slippage = 3 |Trading fee = 5

Total cost = Slippage + Spread + Trading Fee = 3 + 52 + 5 = 60

STP Model Account

Spread = 55| Slippage = 3 | Trading fee = 0

Total cost = Slippage + Spread + Trading Fee = 3 + 55 + 0 = 58

Trading the GBP/XPL

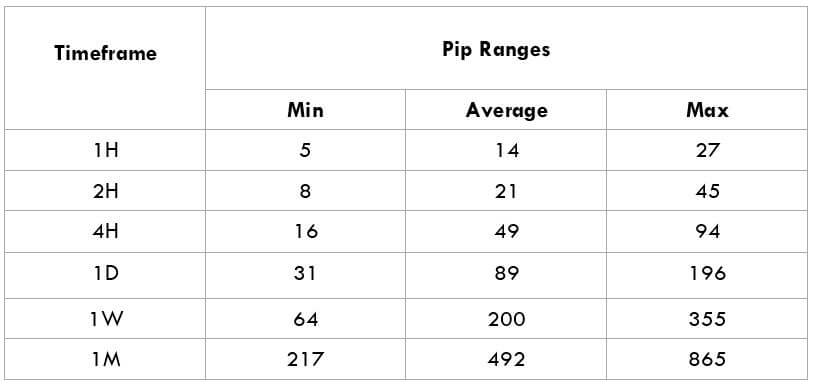
There are some currencies that are very less traded in the foreign exchange market. These currencies are called exotic-cross currency pairs. GBP/XPL is one such exotic currency pairs. Further, the average pip movement on the 1H timeframe is only 14 pips, which is considered to be very less volatile.

We also have to note that if we trade in a low volatile market, our trading will be very expensive. However, It is recommended to trade in a currency pair with medium volatility. To comprehend this better, we will try to understand this with the help of an example.

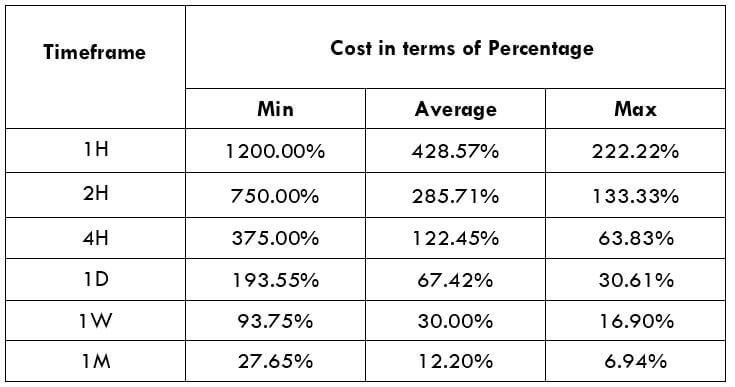
As we can see in the 1M time frame, the Maximum pip range value is 865, and the minimum is 217. Now when we compare the trading cost in accordance with the pip movement, we note that in 217pip movement fess is 26.73%, and for 865pip movement, fess is only 6.71%. So overall we can conclude that trading this pair will be very expensive.

Categories
Forex Assets

Fundamentals Of CAD/CHF Forex Currency Pair

Introduction

CAD/CHF is a currency pair where two currencies, namely, the Canadian dollar and the Swiss franc, are involved. It is a cross-currency pair. Here, CAD is called the based currency, and CHF is called the quote currency.

Understanding CAD/CHF

The current market price of CADCHF tells the value of CHF equivalent to one CAD. It is represented as 1 CAD per X CHF. For example, if the value of CADCHF in the market is 0.7372, then one must pay 0.7372 Swiss francs to buy one Canadian dollar.

Spread

In simple terms, the spread is the difference between the bid price and the ask price set by the brokers. It is not a fixed value and differs from time to time and broker to broker. It also varies based on the type of execution model.

ECN: 1 | STP: 2

Fees

The fee is the commission that is levied by the broker on each trade a trader takes. This, too, like the spread, differs from broker to broker and the type of their execution model. Fee on ECN accounts is 6-10 pips, while it is nil on STP accounts.

Slippage

Slippage is the difference between the trader’s executed price and the price he actually received from the broker. There is always this difference due to the volatility of the market and the broker’s trade execution speed. Note that slippage only happens on market orders.

Trading Range in CAD/CHF

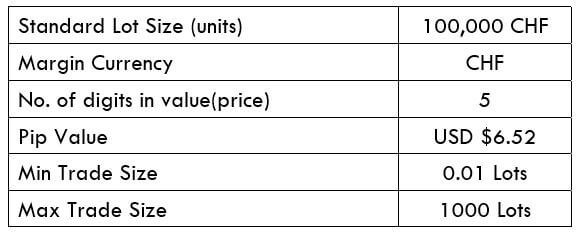
Apart from analyzing the direction of the market, one must predetermine their risk and reward based on the volatility and the timeframe. Knowing how much a trader will gain or lose in a given time frame is a vital trade management tool. And below is a table through which one can determine their profit/loss that can be made in a specified timeframe. For example, the average pip movement on the 1H timeframe is 6.8. So, a trader can expect to be in a profit of $68.34 or in a loss of the same amount.

Procedure to assess Pip Ranges

  1. Add the ATR indicator to your chart
  2. Set the period to 1
  3. Add a 200-period SMA to this indicator
  4. Shrink the chart so you can assess a large time period
  5. Select your desired timeframe
  6. Measure the floor level and set this value as the min
  7. Measure the level of the 200-period SMA and set this as the average
  8. Measure the peak levels and set this as Max.

CAD/CHF Cost as a Percent of the Trading Range

An application to the above volatility table is to find the cost differences on trades by considering the volatility and the total cost on a trade. Below is the table that illustrates the variation in cost on a trade, in terms of percentage. The comprehension of it is discussed in the subsequent topic.

ECN Model Account

Spread = 1 | Slippage = 2 |Trading fee = 1

Total cost = Slippage + Spread + Trading Fee = 2 + 1 + 1 = 4

STP Model Account

Spread = 2 | Slippage = 2 | Trading fee = 0

Total cost = Slippage + Spread + Trading Fee = 2 + 2 + 0 = 2

The Ideal way to trade the CAD/CHF

The higher the magnitude of the percentage, the higher is the cost of the trade.

The values in the table are least in the min column and highest in the max column. This simply means that the costs are high when the volatility of the market is low and vice versa.

In the average column, the values are not as low as in the max column, and not as high as in the max column. The volatility here is moderate too. Hence, this becomes our ideal time of the day to trade in the market.

To sum it up, one must trade during those times of the day when the volatility is more or less near the average values. This will ensure decent volatility as well as minimal costs.

There is another simple technique to reduce costs on trade. When trades are executed using limit order instead of market orders, the slippage becomes nil. So, this brings down the total cost of the trade by a significant value.