Categories
Forex Fundamental Analysis

GBP/CHF Global Macro Analysis – Part 1 & 2

Introduction

The global macro analysis of the GBP/CHF currency pair will involve analysing endogenous and exogenous factors. Endogenous factors drive the domestic GDP growth in the UK and Switzerland. Exogenous factors influence the exchange rate for the currency pair.

Ranking Scale

The analysis will rank the endogenous and exogenous factors on a scale from -10 to +10. The score for endogenous factors will be determined from a correlation analysis with the domestic GDP growth rate. If the score is negative, it means that the endogenous factor has led to the domestic currency depreciation. If positive, it has caused the appreciation of the domestic currency.

The exogenous analysis score is from a correlation analysis with the exchange rate for the GBP/CHF pair. When the score is negative, traders can expect the bearish trend for the pair. If positive, then the pair is expected to have a bullish trend.

Summary – GBP Endogenous Analysis

A -15 score implies that GBP has depreciated since the beginning of 2020.

Summary – CHF Endogenous Analysis

A score of 3 implies that CHF has partially appreciated since the beginning of this year.

Indicator Score Total State Comment
Switzerland Employment Rate -3 10 79.7% in Q3 2020 Slightly below the 80.4% recorded in Q1.
Switzerland Core Consumer Prices 4 10 100.82 points in November Inflation, as measured by the core consumer prices, rose by 0.28 points from January to November
Switzerland Manufacturing Production -2 10 4.7% decrease in Q3 2020 The YoY swiss manufacturing production is recovering
Switzerland Business Confidence 3 10 103.5 in November Swiss KOF Economic Barometer dropped in October and November. The majority of the consecutive drop was driven by private consumption
Switzerland Consumer Spending 5 10 Q3 spending was 91.929 billion CHF Q3 had the highest consumer spending compared to Q1 and Q2.
Switzerland Construction Output -2 10 A 0.4% drop in Q3 2020 Q3 output recovered from the 5% drop in Q2 but is still lower than the 3.1% growth in Q1
Switzerland Government Budget Value -2 10 An expected deficit of 2.2 billion CHF in 2020 Switzerland had a surplus of 8.1 billion CHF in 2019. The projected deficit is on account of aggressive government stimulus program and decreases in revenue due to COVID-19
TOTAL SCORE 3
  1. Switzerland Employment Rate

The Swiss employment rate measures the quarterly change in the percentage of the labour force that is employed. Changes in the number of people employed in the economy are a leading indicator of economic growth. When the economy is expanding, businesses create more job opportunities; hence, higher employment rate. Conversely, a shrinking economy leads to job cuts, which result in a lower employment rate.

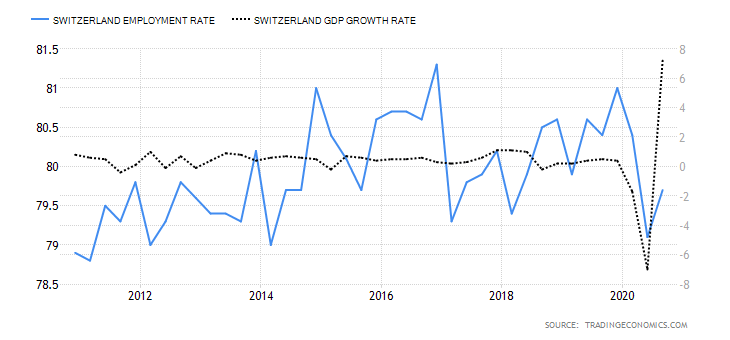
In 2020 Q3, the Switzerland employment rate rose to 79.7% from the 6-year lows of 79.1%. Although the Q3 employment rate is lower than the 80.4% recorded in Q1, it shows that the Swiss economy is recovering from the economic shocks of COBID-19. The swiss employment rate scores -3.

  1. Switzerland Core Consumer Prices

Core consumer prices measure the rate of inflation by monitoring the price changes of only a select basket of goods and services. Consumer products with volatile prices are excluded. The rate of inflation is a leading indicator of economic growth. That’s because when inflation rises, it means domestic demand is on the rise, too, hence a higher GDP growth rate. Similarly, a decrease in the inflation rate means domestic demand is depressed, which may be followed by a contracting economy.

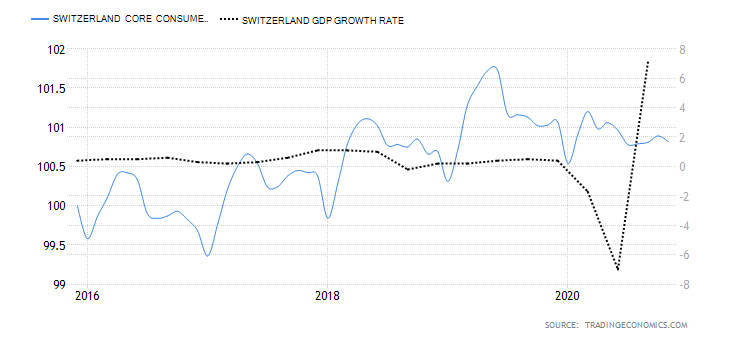
In November 2020, the swiss core consumer prices dropped to 100.82 points from 100.89 points in October. However, it is still higher than 100.54 points recorded in January. It has a score of 4.

  1. Switzerland Manufacturing Production

This measures the YoY change in the value of output from the swiss manufacturing sector. This sector plays a significant role in the Swiss economy. Therefore, growth in manufacturing production is accompanied by growth in the labour market and, consequently, the domestic economy’s expansion.

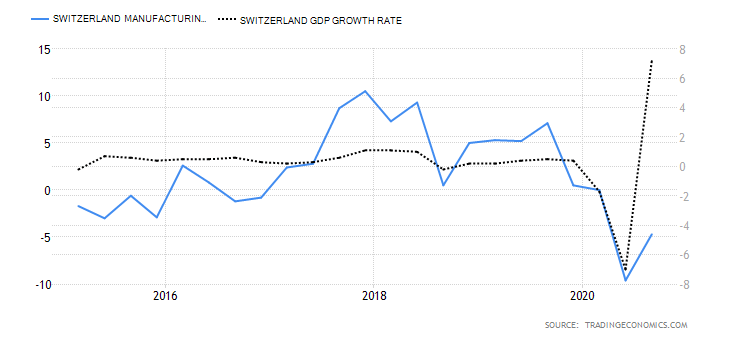
In Q3 of 2020, the YoY swiss manufacturing production dropped by 4.7%. That’s an improvement from the 9.6% drop in Q2. We assign a score of -2.

  1. Switzerland Business Confidence

The KOF Swiss Economic Institute compiles this index. It measures company managers’ optimism based on their perspective of the economy and the growth prospects of their businesses. The business that is surveyed are drawn from multiple sectors in the economy and contains 219 different variables.

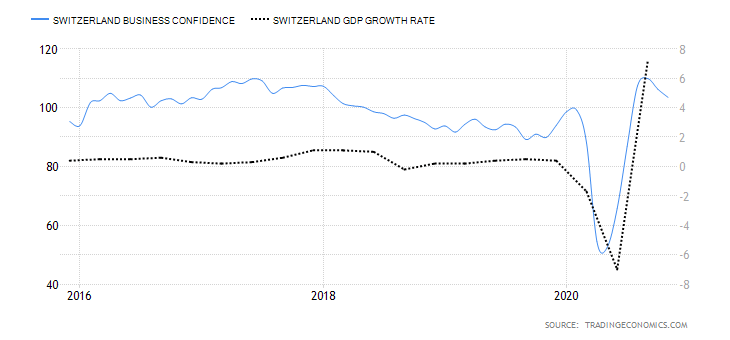
In November 2020, the Swiss KOF Economic Barometer dropped to 103.5 from 106.3 in October. This marks the send consecutive month of a drop in the swiss business confidence. Notably, the drop in the index is primarily driven by the manufacturing sector and private consumption. Swiss business confidence has a score of 3.

  1. Switzerland Consumer Spending

This is the value of the total consumption by Swiss households. Domestic consumption is a primary driver of GDP growth. More so, it also an indicator of the performance in the labour market. With a higher rate of employment, disposable income increases, which increases consumer spending.

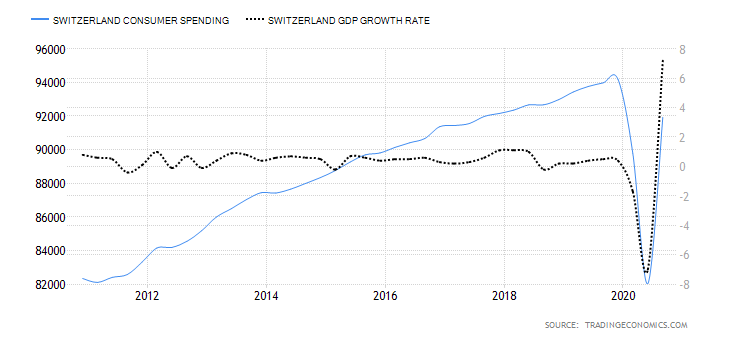
Swiss consumer spending increased to CHF 91.929 billion in the third quarter of 2020, which is the highest recorded compared to CHF 89.79 billion in Q1 and CHF 82.03 billion in Q2. It has a score of 5.

  1. Switzerland Construction Output

This indicator measures the percentage change in the value paid for construction work in Switzerland. The construction work includes building and engineering works done by public and private companies. Typically, when construction work increases, it is expected to be accompanied by an increase in the employment rate and economic growth.

In the third quarter of 2020, the YoY swiss construction output dropped by 0.4%. That is an improvement compared to the 5% drop in Q2 but still less than the 3.1% growth recorded in Q1. It has a score of -2.

  1. Switzerland General Government Budget Value

This represents the difference between the revenues received by the Swiss government and its expenditures. Government expenditure includes all transfer payments and purchases of goods and services. The general government budget value shows if the Swiss government has a surplus or a deficit. Too much deficit means that the economy is probably not responding to expansionary fiscal policies.

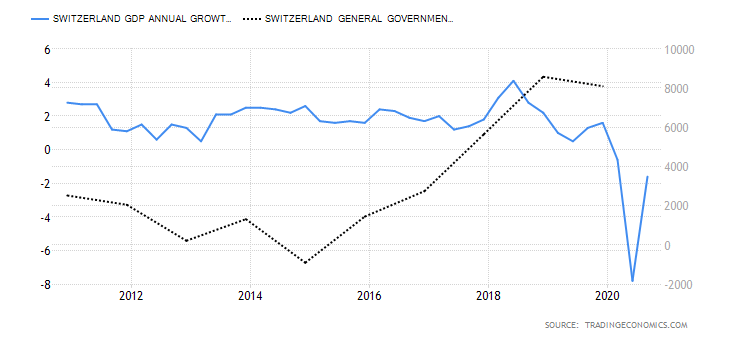
In 2019, the Swiss government had a budget surplus of CHF 8.097 billion. In 2020, the general government budget was expected to hit a deficit of CHF 2.2 billion. This deficit is primarily driven by a significant drop in revenue collection due to COVID-19. It has a score of -2.

In the very next article, you can find the Exogenous analysis of the GBP/CHF currency pair, so make sure to check that out. Cheers.

Categories
Forex Fundamental Analysis

EUR/GBP Global Macro Analysis – Part 2

GBP Endogenous Analysis – Summary

The GBP endogenous analysis has a score of -9. We can therefore understand that the GBP has depreciated in 2020.

  • United Kingdom Employment Change

The UK unemployment change measures the changes in the number of people who are above 16 years and employed. This data is a 3-month moving average of the change in employment, which measures a general trend in the labor industry changes, which typically corresponds to fluctuations in the economy.

In the three months to September 2020, the number of employed people in the UK dropped by 164,000. The YoY employment change shows a drop of 247,000 jobs, which is the worst in ten years. Based on correlation analysis, we assign a score of -7.

  • United Kingdom GDP Deflator

The UK GDP deflator is used as a measure of the comprehensive change in inflation. It filters out any nominal price changes in the entirety of the goods and services produced within the UK.

In Q3 of 2020, the UK GDP deflator dropped to 109.12 from 111.9 in Q2 – the highest ever recorded in UK history. The UK GDP deflator has increased by 6.41in 2020. We, therefore, assign a score of 4 based on its correlation with the GDP growth.

  • United Kingdom Industrial Production

This indicator tracks the changes in all the firms operating under the industrial sector in the UK. The manufacturing sector accounts for about 70% of the total industrial output. The major components of the manufacturing sector are food, tobacco, and drinks, which account for 11%. The manufacture of transport equipment and basic metals account for 17%, pharmaceuticals and non-metallic 6% each. Quarrying and mining activities account for 12% of the industrial production, with 10% for oil and gas extraction.

In September 2020, MoM industrial production in the UK rose by 0.5 while YoY dropped by 6.3%. Despite the growth and recovery of industrial activity from the coronavirus pandemic, the output is still 5.6% lower than the pre-pandemic levels. Thus, we assign a score of -3 based on correlation with GDP growth.

  • United Kingdom Manufacturing PMI

This index is a result of a survey of about 600 companies in the industrial sector. It is a composite of new orders, which accounts for 30%, output 25%, employment 20%, deliveries from suppliers 15%, and inventory 10%. When the index is above 50, it shows that the manufacturing sector is expanding. Below 50, the manufacturing sector is expected to contract, which impacts the GDP output.

In November 2020, the UK manufacturing PMI was 55.6 – the highest recorded in three years. This was mainly driven by increased inventories and increased new orders as a result of Brexit. We assign a score of 3 based on correlation with the GDP growth rate.

  • United Kingdom Consumer Spending

Consumer spending in the UK shows the amount of money that households spent on the purchase of goods and services in the retail sector. Note that expenditure by households is among the primary drivers of GDP growth.

In Q3 of 2020, the UK consumer spending rose to £304.5 billion from £258.32 billion in Q2. This increase is attributed to the restriction imposed at the onset of the coronavirus outbreak, resulting in the economic slowdown. It is, however, still lower than the pre-pandemic levels. Thus, we assign a score of -5 based on correlation with the GDP growth rate.

  • United Kingdom Consumer Confidence

In the UK, GfK surveys about 2000 households to establish their opinions about the past and future economic conditions, their financial situation, and prospects of saving. The survey period covers about 12 months into the future, which makes it a leading indicator of consumer spending, and by extension, the overall economy.

In November 2020, the UK consumer confidence dropped to -33 edging closer to yearly lows of -34 registered at the height of the pandemic. We assign a score of -5 based on its correlation with the GDP growth rate.

  • United Kingdom Public Sector Net Debt to GDP

This ratio tracks the indebtedness of the UK economy. Based on the economy out, both domestic and foreign investors use the ratio to determine whether the UK can be able to service its debt obligations in the future comfortably.

In the financial year 2018 – 2019, the UK’s public sector net debt to GDP was 80.8%, down from 82.4%. In 2020, it is expected to hit 100% with a longer-term average of 91%. We assign a score of 4 since the increased net pubic debt managed to avoid a deeper recession in 2020.

In the next article, we have performed the Exogenous analysis of the EUR/GBP pair and concluded what trend to expect in this currency pair in the near future. Cheers.

Categories
Forex Elliott Wave Forex Market Analysis

GBPUSD Ending Diagonal Completion a Warning Sign for a Trend Reversal?

In our last GBPUSD analysis, we discussed its upward advance in an incomplete ending diagonal pattern. We said that the terminal Elliott wave formation progressed in its fifth wave of Minuette degree identified in blue that belongs to a wave ((c)) of Minute degree labeled in black. Likewise, the wave ((c)) corresponds to the third internal segment of the wave B of Minor degree identified in green. 

Technical Overview

The big picture unveiled the sideways movement in an incomplete corrective formation, which could correspond to an expanding flat pattern. In this regard, after the completion of wave B, the Sterling should start developing wave C, which should lead to a decline of this major pair in a five-wave internal sequence.

On the other hand, the following 8-hour chart reveals the market participants’ sentiment unfolded by the 90-day high and low range, which looks advancing in the extreme bullish sentiment zone. 

The previous chart illustrates the bullish failure in the Wednesday trading session, which couldn’t strike the last high of 1.35394. This failure added to the breakdown of the previous upward trendline plotted in green leads us to expect further declines in the coming trading sessions, likely to the ascending primary trend-line identified in blue.

Short-term Technical Outlook

The intraday Elliott wave view for the GBPUSD pair displayed by the following 2-hour chart exposes the breakdown of the ending diagonal pattern formed on December 07th, confirming the completion of the terminal formation unveiled in the wave ((c)) identified in black. 

Once the Pound found the intraday support at 1.32238, the price action began to bounce in an internal corrective rally subdivided in a three-wave sequence corresponding to wave ((ii)) in black, founding resistance at 1.34779 on the Wednesday trading session.

In this regard, the breakdown of the intraday trend-line that connects the waves ((i)) and (b) should confirm the downward progress of its wave ((iii)) in black, which according to the Elliott wave theory, should be the largest wave of the downward sequence.

The third wave in black could find support in the demand zone between 1.31296 and 1.31064. If the price action continues deteriorating, the Cable could drop toward the next demand zone between 1.29843 and 1.29144.

Summarizing

After the GBPUSD pair made a breakdown of its ending diagonal pattern, is currently moving in a corrective rally corresponding to wave ((ii)), which should give way to a new decline corresponding to the third wave of Minute degree. According to the textbook, this movement should be the largest decline of the current downward sequence and could find support in the demand zone between 1.31296 and 1.31064. Finally, the invalidation level of the current bearish scenario can be found at 1.35394.

Categories
Forex Market Analysis

Daily F.X. Analysis, June 9 – Top Trade Setups In Forex – European GDP in Highlights! 

On the news front, the Eurozone is due to release series of high impact events that may drive movements in the Euro related currency pairs. The events like trade balance, GDP, and final employment change will be in the highlights.

Economic Events to Watch Today


EUR/USD – Daily Analysis

The EUR/US prices were closed at 1.12937 after placing a high of 1.3196 and a low of 1.12680. Overall the movement of the EUR/USD pair remained flat throughout the day.

On Monday, the President of the European Central Bank, Christine Lagarde, said that the central bank’s measure to fight the coronavirus crisis was proportionate to the severe risks facing its mandate.

Lagarde said during a hearing at the Committee on economic and monetary affairs of the European Parliament, which was conducted via video conference, that the crisis-related measures were temporary, targeted, and proportionate.

On Thursday in its monetary policy decision, ECB announced an additional 600 billion euros in its pandemic emergency purchase program (PEPP) and scaled up its previous 750 billion Euro, to extend the program till mid-2021.

According to Lagarde, ECB continuously monitors the proportionality of its instruments, and she said that the net effects to be gained by PEPP expansion were overwhelmingly positive. The need for expansion was to avoid any deeper recession and quickening the pathway towards normalization.

When asked about the German court ruling of the ECB’s massive public sector purchase program, she said she was confident that a solution could be found because it was addressed to the German federal government and the German Parliament.

On the data front, at 11:00 GMT, the German Industrial Production showed a decline of 17.9% in April against the expectations of 16% and weighed on shared currency euro. AT 13:30 GMT, the Sentix Investor Confidence from the Eurozone for June decline to 24.8 from the expected reduction of 22.0 and weighed on Euro.

The depressed Euro after inferior to expected German Industrial Production dragged the pair EUR/USD with itself to the low of 1.12680.

Meanwhile, Lagarde’s Speech explaining the benefits of ECB’s latest expansion in PEPP provided strength to Euro, which pushed the EUR/USD pair higher.

Lagarde’s Speech and economic data from Eurozone moved in the opposite direction, and hence, the pair EUR/USD remained flat throughout the day as it closed at the same level it was started with. No data was to be released from the American side, so the pair followed Euro’s directions.

Daily Support and Resistance

  • R3 1.1357
  • R2 1.1338
  • R1 1.1327

Pivot Point 1.1308

  • S1 1.1296
  • S2 1.1278
  • S3 1.1266

EUR/USD– Trading Tip

The EUR/USD is consolidating in a narrow trading range of 1.1370 – 1.1276 level, and right now, it seems to break out of this trading range. On the lower side, the next target level seems to be 1.1185. Currently, the pair is facing immediate support around 1.1274 level, and closing of candles below this level may lead the EUR/USD prices further lower towards 1.1185 level, which is extended by the 50 EMA level. On the higher side, resistance holds at 1.1315 level today. Odds of bearish bias remains solid today.


GBP/USD – Daily Analysis

The GBP/USD pair was closed at 1.27235 after placing a high of 1.27358 and a low of 1.26278. Overall the movement of GBP/USD remained bullish throughout the day. The broad-based U.S. dollar selling bias after the positive tone around greenback followed by Friday’s job report vanished pushed the pair GBP/USD higher on Monday. The currency pair GBP/USD raised for the 8th consecutive day on Monday and continued its bullish rally.

The weakness of the U.S. dollar was attributed to weak U.S. yields. The U.S. dollar index (DXY) turned negative on the day and fell back to below 97.00 level. The U.S. stock was high on the back of increased risk appetite.

On the other hand, the E.U. chief negotiator, Michel Barnier, was supposed to present a compromise proposal on access to British waters during the latest round of talks, but at the last minute, he was blocked to present the proposal by its member states with large fishing communities.

E.U. now expects the talks to drag into October, but the U.K. has ruled it out and said that it was unacceptable. E.U. wanted to intensify and accelerate its work to make progress with the negotiations, and the U.K. need to prepare its businesses for a new trading environment.

On the fishing issue, the E.U. wants the U.K. to follow the structures of standard fisheries policy (CFP) from the end of 2020. But British fishing communities claim that the policy left the U.K. with far too few fish to catch, so they want to be an independent coastal state from the end of 2020. On the data front, there was no macroeconomic data to be released from both sides so, the pair continued following its previous day’s trend and posted gains on the back of the risk-on market sentiment.

Daily Support and Resistance

  • R3 1.28
  • R2 1.2765
  • R1 1.2742

Pivot Point 1.2707

  • S1 1.2684
  • S2 1.2649
  • S3 1.2627

GBP/USD– Trading Tip

The GBP/USD’s overall trend is bullish as the pair continues to reach 1.2690 levels, having violated the triple top level on the 4-hour timeframe. The pair is retracing a bit; perhaps, investors are doing some profit-taking before taking any additional buying position in Sterling. Bullish trend continuation leads to GBP/USD prices towards the next resistance level of 1.2760 level. Above this, the next resistance holds around 1.2795 level. Conversely, the support is likely to be found around 1.2665 and 1.2601 level today. Let’s look for selling below 1.2707 and buying above this level today. 


USD/JPY – Daily Analysis

 The USD/JPY pair was closed at 108.426 after placing a high of 109.691 and a low of 108.232. Overall the movement of the USD/JPY pair remained strongly bearish throughout the day. The pair USD/JPY posted a steeper loss on Monday amid the broad-based U.S. dollar weakness and improved Japanese economic outlook. The pair dropped on Monday after posting gains for the previous four consecutive days.

On the data front, at 4:50 GMT, the Bank Lending for the year from Japan increased to 4.8% in May from 2.9% in April. The Final GDP for the quarter decreased by 0.6% against the expected decline of 0.5% and weighed on Yen. At 4:52 GMT, the Current Account Balance for April came short of expectations of 0.33T as 0.25T and weighed on Japanese Yen. The Final GDP Price Index for the year came in line with the expectations if 0.9%. At 10:02 GMT, the Economy Watchers Sentiment, however, came in favor of Japanese Yen as 15.5 against the expected 12.6.

The preliminary reading of Japan’s Q1 GDP moved from -0.9% to -0.6% and came in better, which indicated the readiness of Japanese policymakers with extra stimulus if needed to fight against the pandemic.

Moreover, the better outlook of Japan’s current economic condition supported the Japanese Yen on Monday and weighed on the USD/JPY pair.

On the other hand, despite upbeat economic data from the U.S., the greenback lost its demand due to the drop in risk barometer that day. The rush of traders’ return from riskier assets weighed on the U.S. dollar and made it weak. 

Daily Support and Resistance    

  • R3 110.81
  • R2 110.25
  • R1 109.34

Pivot Point 108.79

  • S1 107.88
  • S2 107.33
  • S3 106.42

USD/JPY – Trading Tips

The USD/JPY fell dramatically to violate the narrow trading range of 109.800 – 109.255, and now it’s trading somewhere around 107.900. On the 4 hour timeframe, the USD/JPY is likely to find support at 107.900, and below this, the upward trendline may extend support around 107.600 level. The Japanese currency pair has already crossed below 50 EMA, favoring selling bias in the pair today. Let’s consider taking selling trades below 108.50 today. Good luck! 

Categories
Forex Market Analysis

Daily F.X. Analysis, June 8 – Top Trade Setups In Forex – Dollar Strengthens Over NFP! 

On the news front, the eyes will remain on the German Industrial Production m/m and ECB President Lagarde Speaks. Both of these may have an impact on the Euro related currency pairs.

Economic Events to Watch Today


EUR/USD – Daily Analysis

The EUR/USD pair was closed at 1.12911 after placing a high of 1.13835 and a low of 1.12781. Overall the movement of EUR/USD remained bearish throughout the day. The EUR/USD pair rose to 1.13835 near 13-weeks highest level but failed to remain there and broke its nine days bullish streak and fell on Friday amid U.S. dollar strength across the board after the release of US Non-Farm Employment Change.

The pair EUR/USD was on bullish track after the announcement of an additional 600 billion euros in the emergency package from the European Central Bank on Thursday. The package was announced to cover up the losses faced after the coronavirus induced lockdowns across the globe and its impact on the global economy.

The additional 600 billion euros by ECB in its pandemic emergency purchase program (PEPP) made the total size of aid provided after the coronavirus crisis to 1.35 trillion euros. ECB also said that the updated forecast about GDP showed a contraction of 8.7% this year, and the inflation expectations were to rise by 0.3% this year and 0.8% in next year. EUR/USD moved in an upward direction after the ECB’s PEPP announcement and continued to follow the trend in early sessions on Friday and rose above 13-weeks higher level.

However, after the release of US Non-Farm Employment Change, the pair EUR/USD started to move in the opposite direction at the ending day of the week. At 17:30 GMT, the Non-Farm Employment Change from the United States showed that 2.509M people were hired in May against 7.750M of job loss expectations. A stronger than expected job report from the U.S. gave strength to the U.S. dollar across the board and weighed on EUR/SD pair.

Adding in the strength on the U.S. dollar was the Unemployment Rate, which came in as 13.3% against the expectations of 19.4% and further dragged down the pair EUR/USD pair.

On the other hand, from the Europe side, at 11:00 GMT, the German Factory Orders for April were also released which showed that factory orders were reduced by 25.8% in April against the expected drop of 20% and weighed on Euro which ultimately dragged the pair in a downward trend.

Daily Support and Resistance

  • R3 1.1357
  • R2 1.1338
  • R1 1.1327

Pivot Point 1.1308

  • S1 1.1296
  • S2 1.1278
  • S3 1.1266

EUR/USD– Trading Tip

The EUR/USD is also following a bearish trend on the back of a stronger dollar. Currently, the pair is facing immediate support around 1.1284 level, and closing of candles below this level may lead the EUR/USD prices further lower towards 1.1244 level, the support, which is extended by the 50 EMA level. On the higher side, resistance holds at 1.1315 level today. Odds of bearish bias remains solid today.


GBP/USD – Daily Analysis

The GBP/USD was closed at 1.26689 after placing a high of 1.26901 and a low of 1.25828. Overall the movement of GBP/USD pair remained bullish throughout the day. The pound rose for 7th consecutive day on Friday amid the rising hopes for a deal between E.U. & U.K. but lost some of its daily gains after the release of U.S. on-Farm Employment Change.

Matt Hancock, the Cabinet Minister of the U.K., said that a trade deal with the E.U. was still possible on very reasonable demands. In the latest rounds, both sides admitted that a little progress was made, and they were very hopeful that no-deal outcomes to the talks could be avoided.

The U.K. & E.U. differences have remained under four key points of fisheries: competition rules, governance, and police cooperation. UK PM Boris Johnson and President of European Commission, Ursula von der Leyen, are expected to meet later this month.

The U.K. has only until the end of June to apply for the extension of the transition period, but Johnson has ruled it out. However, the hopes that U.K. & E.U. will reach a deal after the described little progress in talks from both sides increased, and hence, the pair GBP/USD found traction in the market.

Whereas, the investors think that chances for no-deal Brexit were more than ever because the coronavirus pandemic will lead to one of the worst recessions in modern history, and investors think that hardcore Brexiteers will use the recession as a perfect distraction to get to a no-deal Brexit done.

On the data front, at 12:30 GMT, the Halifax Housing Price Index for May from the United Kingdom was declined by 0.2% against the expected decline of 0.7% and supported British Pound which ultimately pushed the GBP/USD pair on bullish track on Friday and added in the pair gains.

Meanwhile, the U.S. dollar strength after the release of US Non-Farm Employment Change exerted pressure on the rising prices of GBP/USD pair on Friday and made it lose some of its daily gains.

Daily Support and Resistance

  • R3 1.28
  • R2 1.2765
  • R1 1.2742

Pivot Point 1.2707

  • S1 1.2684
  • S2 1.2649
  • S3 1.2627

GBP/USD– Trading Tip

On Monday, the technical side of the GBP/USD seems bullish as the pair continues to reach 1.2690 levels, having violated the triple top level on the 4-hour timeframe. The GBP/USD pair has formed an upward regression trend channel, and it’s driving further buying trend in the Cable. Bullish Continuation of a bullish trend can lead to GBP/USD prices towards the next resistance level of 1.2760 level. Above this, the next resistance holds around 1.2795 level. Conversely, the support is likely to be found around 1.2665 and 1.2601 level today. Let’s look for selling below 1.2707 and buying above this level today


USD/JPY – Daily Analysis

The USD/JPY was closed at 109.573 after placing a high of 109.848 and a low of 109.042. Overall the movement of USD/JPY remained bullish throughout the day. The USD/JPY pair surged for the fourth consecutive day on Friday and gained some strong follow-through traction after the release of surprisingly stronger than expected U.S. monthly jobs data. The headline data of Friday, NFP, showed that 2.509M jobs were added in May, whereas the forecast was about 8M job loss.

Adding in the optimism was the unemployment rate, which beat the market expectations and was reported as 13.7% against 19.4% of expectations. Better than expected, data from the U.S. economy raised the bars for recent optimism over the sharp V-shaped recovery for global economic recovery. This increased the already stronger risk appetite In the market and hence, the USD/JPY pair gained for the 4th consecutive day on Friday.

At 4:30 GMT, the Household Spending for the year from Japan was declined by 11.1% against the expected decline of 12.8% and supported the Japanese Yen. At 10:00 GMT, the Leading Indicators from Japan remained flat with the expectations of 76.2%.

From the American side, the Average Hourly Earnings in May was declined by 1.0%, whereas it was expected to rise by 1.0%. The US Non-Farm Employment Change showed that 2.509M people were hired back in May, which were expected to show job loss of 7.750M people. The Unemployment Rate in April fell short of 19.4% expectations and came in as 13.3% and supported the U.S. dollar.

Daily Support and Resistance    

  • R3 109.79
  • R2 109.74
  • R1 109.67

Pivot Point 109.62

  • S1 109.56
  • S2 109.5
  • S3 109.44

USD/JPY – Trading Tips

The USD/JPY is consolidating in a narrow trading range of 109.800 – 109.255. The stronger than expected NFP figures drove buying in the USD/JPY pair on Friday, but now the traders seem to capture retracement in the market. A bearish breakout of 109.280 level can drive selling until the next support level of 109, which marks 38.2% Fibonacci retracement. The 50 EMA and MACD both are supporting the buying trend in the USD/JPY pair, and it can lead the USD/JPY prices further higher today. On the higher side, the resistance holds around 109.850. Let’s wait for a breakout of 109.800 – 109.255 to determine further trends in the USD/JPY pair. All the best for today! 


Categories
Forex Market Analysis

Daily F.X. Analysis, June 01 – Top Trade Setups In Forex – ISM Manufacturing PMI In Highlights

On Monday, the fundamentals side is likely to drive no major movement during the European session. Still, the U.S. session may offer some price action on the release of ISM manufacturing PMI figures today.

Economic Events to Watch Today


EUR/USD – Daily Analysis

The EUR/USD pair was closed at 1.11032 after placing a high of 1.11450 and a low of 1.10676. Overall the movement of the EUR/USD pair remained bullish throughout the day. The EUR/USD continued its previous trend and finally crossed above 1.11 level on Friday and rose for the 5th consecutive day this week. The pair showed the longest run since late March at the end of this week on the back of Euro’s strength.

At 11:00 GMT, the German Import Prices for April were released as -1.8% against the -1.5% forecasted and weighed on Euro. The German Retail Sales dropped less than expected 12% as5.3% in April and supported single currency Euro. At 11:45 GMT, the French Consumer Spending for April was declined by 20.2% against the forecasted 14.5% and weighed on Euro. The French Prelim CPI for May dropped by0.05 from the expected drop of 0.1% and weighed on Euro.

However, the French Prelim GDP for the quarter dropped less than the expectations of 5.8% decline and came in as 5.3% and supported shared currency Euro. At 13:00GMT, the M3 Money Supply for the whole bloc surged to 8.3% from the forecasted 8.1% and supported Euro.

The Private Loans from the whole bloc for the year dropped to 3.0%from the forecasted 3.5%. At 14:00 GMT, the CPI Flash estimate for the year for the whole Eurozone came in line with the expectations of 0.1%.  

However, the Core CLPI Flash estimate of the whole bloc for the year increased to 0.9% from the expected 08% and supported Euro. The Italian CPI for May came in line with the expectations of -0.1%.

Better than expected GDP and CPI data from Eurozone gave strength to the Euro against the U.S. dollar and supported the upward trend of EUR/USD pair on Friday.

On the other hand, the United States’ economic data was gloomy and weighed on the U.S. dollar, which added in the upward movement of EUR/USD pair. At 17:30 GMT, the Core PCE Price Index for April was dropped more than the expected -0.3% as -0.4% and weighed on the U.S. dollar. Personal Spending also declined more than expectations of 12.6% decline as 13.6% in April and weighed on the U.S. dollar. The Goods Trade Balance for April showed a deficit of 69.7B against the forecasted deficit of 64.8B and weighed on the U.S. dollar. The Prelim Wholesale Inventories for April surged to 0.4% from the expected -0.5% and added in U.S. dollar weakness.

The Chicago PMI at 18:45 GMT came in as 32.3 points against 40.1 of expectations and weighed the U.S. dollar. The Revised Consumer Sentiment from the University of Michigan for May dropped to 72.3 from the expected 73.7 and weighed on the U.S. dollar. The Revised Inflation Expectations from the University of Michigan for May were reported as 3.2% from the previous 3.0%.


Daily Support and Resistance

  • R3 1.1158
  • R2 1.1141
  • R1 1.1129

Pivot Point 1.1113

  • S1 1.1101
  • S2 1.1085
  • S3 1.1073

EUR/USD– Trading Tip

The bullish bias of the EUR/USD continues to prevail in the market as the EUR/USD is heading north towards the next target level of 1.1150 level. A bullish breakout of 1.1150 level may lead the pair towards 1.1220 level today while support holds around 1.1080 level. Bullish bias seems dominant today. Consider taking buying trades over 1.1140 level to target 1.1199. 


GBP/USD – Daily Analysis

The GBP/USD pair was closed at 1.23459 after placing a high of1.23940 and a low of 1.22902. Overall the movement of GBP/USD pair remained bullish throughout the day. The pair GBP/USD reached above its two-week high level on Friday near 1.2400 level but could not stay there and dropped back to 1.2300 level. The drop in sterling was caused by the awaiting speech of U.S. President Donald Trump.

Sterling started its day on firm tone and extended its previous day’s gains on the back of broad-based U.S. dollar weakness due to poor than expected U.S. economic data release. The decline in U.S. Treasury bond yields also added to the fault of the U.S. dollar. The Chicago PMI for May dropped to 32.3 from the expected 40.1 and weighed on the U.S. dollar. The Revised Consumer Sentiment from the University of Michigan for May also dropped to 72.3 against the expected 73.7 and added negative pressure on USD.

Other than economic data, the comments from Fed Chair Jerome Powell also exerted pressure on the U.S. dollar. Powell said that the U.S. economy had crossed many red lines that had never crossed before. He also stated that the Fed was launching Main Street Lending Program, which had not used since the Great Depression. After these comments, the GBP/USD pair started to move upward.

Investors became cautious before U.S. President Donald Trump’s speech on Friday and started selling Sterling, who made the pair lose its early daily gains. However, after his speech, the pair continued its bullish trend and ended its day with a bullish candle. The heat between China and the United States was enhanced after the strong response from U.S. President Donald Trump over the new security bill in Hong Kong by China, which was highly awaited as Trump had announced it before earlier this week.

Daily Support and Resistance

  • R3 1.2388
  • R2 1.2371
  • R1 1.2358

Pivot Point 1.2341

  • S1 1.2328
  • S2 1.2311
  • S3 1.2298

GBP/USD– Trading Tip

The GBP/USD continues trading bullish as it has violated the double top resistance area around 1.2364 level. Bullish crossover of this level is now likely to extend the buying trend until 1.2458, but on the way, the upward channel’s upward trendline is likely to provide resistance around 1.2410, while the support level stays at 1.2370 today. 

On the 4-hour timeframe, the 50 EMA is suggesting bullish bias, and now the MACD is suggesting buying trend in the GBP/USD pair as the histograms are forming above zero levels. Consider taking buying trades over 1.2370 and selling below the same level today.


USD/JPY – Daily Analysis

The USD/JPY was closed at 107.767 after placing a high of 107.894 and a low of 107.077. Overall the movement of USD/JPY remained bullish throughout the day. At 4:30 GMT, the Tokyo Core CPI for the year came in as 0.2% against -0.2% and supported the Japanese Yen. The Unemployment Rate from Japan also decreased in April to2.6% from the expectations of 2.7% and supported Yen.

However, the Prelim Industrial Production for April dropped by 9.1% against the expected drop of 5.5% and weighed on Yen at 4:50 GMT. The Retail Sales for the year from Japan also dropped by 13.7% against the expected drop of 11.2% and weighed on Yen. At 10:00 GMT, the Housing Starts for the year dropped by 12.9% against the drop of 12% expected and weighed on Yen. At 10:02 GMT, the Consumer Confidence for April increased to 24.0 from the expected 213 and supported Yen.

The increased confidence in Japan’s economy and better than expected CPI and Unemployment Rate supported Yen and made it stronger against the U.S. dollar, which dragged the USD/JPY currency pair in earlier Asian trading session on Friday.

 The pair dropped to its two weeks lowest level on Friday at 107.077 on the back of increased demand for safe-haven Yen amid escalating tensions between the U.S. and China. On Friday, the President of the United States, Donald Trump announced to revoke its relationship with WHO due to its mishandling of coronavirus pandemic. The U.S. had warned the WHO to be independent of China, change its reforms, and give it 30 days to do so. However, when on Friday, 30 days ended, and no response came back from WHO, the U.S. declared to end its relationship with it.

Trump said that the U.S.’s funds to transfer to WHO will be given to more deserving other nations where urgent help will be required. The decision came in after China issued and passed a new security bill on Hong Kong, and the U.S. said that it would retaliate.

Categories
Forex Market Analysis

Daily F.X. Analysis, May 29 – Top Trade Setups In Forex – Fed Chair Powell Speech in Focus! 

The European Commission will post May CPI (+0.1% on-year expected). The European Central Bank will publish the eurozone’s M3 money supply in April (+8.2% on-year expected). The German Federal Statistical Office will report April retail sales (-12.0% on month expected). France’s INSEE will release final readings of 1Q GDP (-5.4% on year expected) and May CPI (+0.3% on-year expected). The U.S. Commerce Department will post April wholesale inventories (-0.7% on month expected), advance goods trade balance (65 billion dollars deficit expected), personal spending (-12.8% on month expected), and personal income (-6.0% on month expected). The Market News International will release May Chicago PMI (40.0 expected). The University of Michigan will report its final data of the May Consumer Sentiment Index (74.0 expected).

Economic Events to Watch Today


EUR/USD – Daily Analysis

The EUR/USD pair was closed at 1.10771 after placing a high of 1.10934 and a low of 1.09915. Overall the movement of the EUR/USD pair remained bullish throughout the day.

The EUR/USD pair continued its bullish streak for the 4th consecutive day on Thursday and rose near 1.1100level, highest since March 30. On Wednesday, the European Commission proposed an additional $18.2Billion for the European Union’s foreign spending as part of its COVID-19 recovery package. The proposed package gave relief to NGOs that had feared further rate cuts.

This proposal by the European Commission must be approved by E.U. states and would allocate 86 billion euros to the bloc’s development for 2021-2027. The additional resources would be drawn from the 750 billion euro recovery fund, which was also announced on Wednesday, which will be raised by borrowing on financial markets.

On the data front, the German Preliminary Consumer Price Index for May declined by -0.1% against the expected 0.1% and weighed on single currency Euro. While at 12:00 GMT, the Spanish Flash Consumer Price Index for the year came in line with the expectations of -1.0%.

The European Commission indicated that the Consumer Confidence Index in Eurozone edged higher to -18.8 from -22. Still, the Business Climate Index fell to -2.43 from -1.99 and stopped the shared currency from gathering strength against its rivals.

However, the risk-on market sentiment of the market continued to support the EUR/USD pair and weighing on the U.S. dollar. The potential coronavirus vaccines, reopening of economies across the globe, and potential risk for the second wave of corona kept the risk appetite in the market and continued weighing on the U.S. dollar. The weakness of the U.S. dollar gave a push to EUR/USD pair.

On American economic docket, the poor than expected data also kept the U.S. dollar under pressure on Thursday. The jobless claims from the United States for last week rose to 2.123M from the expected 2.1M and weighed on the U.S. dollar. At 19:00 GMT, the Pending Home Sales for April dropped more than expectations and weighed on the U.S. dollar. The actual figure came in as -21.8% against the expected -15%. The closely watched Prelim GDP for the quarter from the United States also weighed on the U.S. dollar when it was released as -5.0% against the expected -4.8%. The EUR/USD pair rose to its 12 weeks highest level on the back of broad-based U.S. dollar weakness on Thursday.

Daily Support and Resistance

  • R3 1.122
  • R2 1.1157
  • R1 1.1117

Pivot Point 1.1054

  • S1 1.1014
  • S2 1.0951
  • S3 1.0911

EUR/USD– Trading Tip

The bullish bias of the EUR/USD continues to prevail in the market as the EUR/USD is heading north towards the next target level of 1.1150 level. The pair have already violated the triple top resistance level of 1.09985, and bullish crossover of 1.1146 level may lead the EUR/USD prices further higher towards 1.12118 level. The closing of three white soldiers in the daily timeframe is also supporting an upward trend in the market.


GBP/USD – Daily Analysis

The GBP/USD pair was closed at 1.23222 after placing a high of 1.23443 and a low of 1.22336. Overall the movement of GBP/USD pair remained bullish throughout the day.

According to the policymaker of Bank of England, Michael Saunders, easing too much rather than easing a little by Bank of England was easier in response to the coronavirus pandemic. He said that the U.K. was at risk of relatively slow recovery than other countries from the coronavirus crisis, and it could prove damaging to the U.K.’s economy.

On Thursday, Saunders added that if Bank of England failed to add more stimulus measures in the economy, than it could slip the economy into an “inflation trap.” Saunders was one of two policymakers of BoE that wanted an expansion inn asset purchases in May. While the other majority wanted to wait, though accepted, more stimulus would be required.

The first speech of Saunders after COVID-19 was encouraging the central bank to cut interest rates to a record low of 0.1%, increase the bond-buying, and boost the capital. However, in response to his speech, British Pound came under pressure on Thursday and fell by 0.2%. On the other hand, the U.S. dollar also remained weak during the day because of risk-on market sentiment along with the poor economic data. The broad-based U.S. dollar weakness overshadowed the drop in GBP and raised the GBP/USD pair.

The closely watched Prelim GDP for the second quarter from the United States was dropped by -5.90% against the expected drop by -4.8% and weighed on the U.S. dollar. At 17:30 GMT, the Unemployment Claims from last weeks also reported higher than expectations of 2100K as 2123K and weighed on the U.S. dollar. At 19:00 GMT, the Pending Home Sales for April also declined by 21.8% against the expected decline by 15%.

Despite reopening all 50 states from coronavirus induced lockdowns, unemployment claims still showed higher than expected figures, which resulted in the broad-based U.S. dollar weakness on Thursday.

On Brexit front, the final round of talks between the U.K. & E.U. before a summit in June will be held next week. Because of the last negotiations that went bad after the exchange of letters between the British negotiator, David Frost, and his E.U. counterpart, Michel Barnier, the hopes for the success of final round talks have decreased. This has raised the bars for no-deal Brexit possibility.

U.K. Prime Minister, Boris Johnson will travel to Brussels for talks with European leaders next month to attempt to revive the negotiations. The two sides were still far apart on fisheries, and the U.K. has said that it would abandon the talks if “shape of a deal” has not emerged by the end of June. The U.K. traders will keep an eye onus data and Brexit updates for further actions.

Daily Support and Resistance

  • R3 1.259
  • R2 1.2477
  • R1 1.2405

Pivot Point 1.2292

  • S1 1.222
  • S2 1.2107
  • S3 1.2035

GBP/USD– Trading Tip

On Friday, the GBP/USD is trading with a slightly bullish bias, facing a double top resistance area around 1.2364 level. Bullish crossover of this level may extend the buying trend until 1.2458. On the 4-hour timeframe, the 50 EMA is suggesting bullish bias, and now the MACD is suggesting buying trend in the GBP/USD pair as the histograms are forming above zero levels. 

Today, the Sterling may find immediate support around 1.2245 levels along with resistance at 1.2360 while the closing of candles above the 1.2360 level may drive buying until 1.2450 level. The violation of support is likely to push the cable further lower until 1.2160 level. Consider taking buying trades over 1.2162 and selling below the same level today.


USD/JPY – Daily Analysis

The USD/JPY currency pair extended its previous 2-days winning streak. They rose to 107.90 marks mainly due to the risk-on market sentiment, which undermined the Japanese yen’s safe-haven demand and exerted some bullish impact on the currency pair. On the other hand, the broad-based U.S. dollar weakness turned out to be one of the main factors that kept a lid on any additional gains in the pair. At this particular time, the USD/JPY currency pair is currently trading at 107.83 and consolidating in the range between 107.69 and 107.91.

However, the reason for the upbeat market sentiment could be attributed to the recent optimism about a possible COVID-19 vaccine and hopes of a global economic recovery, which eventually sent the currency pair higher.

Despite the bullish trend in the currency pair, the USD/JPY pair held well within a near two-week-old trading range. The reason behind the confined trading range could be the escalating tensions between the U.S. and China relations, which kept investors cautious about placing any strong position.

The intensifying tension between the United States and China was further bolstered by the U.S. Secretary of State Mike Pompeo’s statement in which he denied Hong Kong’s special status and said that it was no longer autonomous from China. 

At the USD front, the broad-based U.S. dollar erased its previous day gains and slipped 0.16% to 98.900 on the day due to the rise in Asian shares and U.S. stock futures, which eventually limited the additional gains in the pair. Whereas, The U.S. Dollar Index that tracks the greenback against a basket of other currencies dropped 0.16% to 98.900 by 11:26 AM ET (4:26 GMT). 

Daily Support and Resistance    

  • R3 108.39
  • R2 108.16
  • R1 107.86

Pivot Point 107.63

  • S1 107.33
  • S2 107.1
  • S3 106.79

USD/JPY – Trading Tips

The safe-haven Japanese yen continues to gain bullish momentum in the wake of increased safe-haven appeal for JPY, and it’s dragging the USD/JPY pair lower at 107.120. The odds of selling in pair remains strong as the pair is likely to drop towards the next support level of 106.850. The recent strong selling candle also suggests odds of further selling in the USD/JPY pair today. 

All the best for today! 

Categories
Forex Signals

GBPJPY Bearish Engulfing after double top at the upper edge of the descending channel

GBPJPY has been moving in a descending channel since April 10. The action created a lot of volatility, driving prices back and forth from top to bottom of the channel. The last iteration drove its price to surpass the upper limit, a +2 sigma event, which means the pair was overpriced if we compare it with what we may call the fair price, which is the linear regression channel, the red mid-line.

After the double top, a large bearish engulfing candle was drawn, confirming the reversal signal; thus, we can set up a short trade with entry at the current level, an invalidation point beyond the last top and a target at the projected linear regression point. The Reward/risk ratio of 2 is a conservative value that will ensure our long-term profitability.

Key levels:

Short-Entry:132.175

Take.profit:130.575

Stop-Loss: 132.965

Reward Ratio: 2.03

Risk:735 USD per lot, 73.5 USD per mini-lot.

Reward: 1,491USD per lot, 149 USD per mini-lot.

Position sizing: 2% Risk equals 3 micro-lots for every $1,000 balance in the trading account.

Categories
Forex Market Analysis

Daily F.X. Analysis, May 27 – Top Trade Setups In Forex – ECB President Lagarde Speaks! 

The U.S. dollar, which behaves like a safe-haven asset during political uncertainty & market turmoil, rose to a one-week high against the basket of 6 currencies, but it started to erase its daily gains in late London Session. Tensions between U.S. &China have increased since the coronavirus outbreak, over which both countries have exchanged accusations of cover-ups and lack of transparency with the world. The signs for easing tensions between the two biggest economies of the world are decreasing day by day and have created an uncertain environment in the market weighing on the market.

Economic Events to Watch Today


EUR/USD – Daily Analysis

The EUR/USD pair was closed at 1.09821 after placing a high of 1.09956 and a low of 1.08913. Overall the movement of EUR/USD remained bullish throughout the day. On Tuesday, EUR/USD prices surged and recovered its previous three days’ losses and regained strength in the market on the back of the renewed risk-on market sentiment. The risk appetite after easing of lockdown throughout the world gave strength to the riskier assets like EUR/USD pair and rose them across the board.

The rising hopes for potential coronavirus vaccine added in the risk sentiment and increased expectations for a quick economic recovery. A bid pharmaceutical company, which was the first to make the Ebola vaccine revealed its plans on Tuesday and said that it was working on two potential vaccines and one drug to cure the virus’s infection. The CEO of the company was cautious that it might take a long time to deliver vaccines across the globe.

This raised optimism around the market and raised the bars for riskier assets and moved EUR/USD pairs to recover its previous day’s losses.

On the other hand, in the economic docket, EUR found extra support after the German Consumer Climate from Gfk came in as -18.9 against the expectations of -19.1.

Furthermore, the European Central Bank said that the coronavirus pandemic had amplified the existing vulnerabilities of the financial sector, which will make Eurozone banks face significant losses.

ECB reported that the pandemic had caused one of the sharpest economic contraction in recent history. Still, a wide range of policy measures has been proved helpful in averting a financial meltdown.

Daily Support and Resistance

  • R3 1.1126
  • R2 1.1061
  • R1 1.1021

Pivot Point 1.0956

  • S1 1.0915
  • S2 1.0851
  • S3 1.081

EUR/USD– Trading Tip

On the 4 hour timeframe, the EUR/USD pair is testing triple top level, which is providing resistance around 1.0995 level. Closing of candles below this level may drive selling trades until 38.2% Fibonacci retracement level of 1.0970, and below this, the next support holds around 1.0920, which marks 61.8% Fibonacci area. Overall, 1.0995 is a crucial trading level as above this; the EUR/USD pair may lead it’s prices further higher towards 1.1137. Bullish bias seems dominant today.

GBP/USD – Daily Analysis

The GBP/USD pair was closed at 1.23373 after placing a high of 1.23630 and a low of 1.21807. Overall the movement of GBP/USD pair remained bullish throughout the day. The Pound outperformed on Tuesday and rose to a level 1.236 highest since May 12 on the back of raised optimism about the EU-UK trade deal.

The next round of Brexit talks are due next week, and there have been headlines revolving that British negotiators could seal their first victory in next talks with the E.U. Reports suggested that the European Union was willing to shift its stance on fisheries in the next round of talks with Great Britain next week. If that happens, it would be a significant concession from the bloc in talks with the U.K. on their new relationship after Brexit.

The fisheries were important to the E.U. as most of the fishing takes place in U.K. waters, but the catch goes to E.U. fishers. U.K. wanted to ensure that after Brexit, which will take effect from next year, the U.K. as a newly independent coastal state could be solely in control of its waters and fish.

So far, the European Union has been reluctant to give up U.K. waters and demanded the things to remain the same as they were before in fisheries. However, on Tuesday, an E.U. official said that the bloc’s executive committee, which will negotiate with the U.K. in the name of all 27 E.U. member states, could ease its demand if the U.K. were to move as well.

According to Michel Barnier, surrendering the access to Britain’s fishing waters would be just one of the costs the British government must pay for a trade deal with the bloc. However, he faced pressure from other officials not to surrender to Britain too soon.

Daily Support and Resistance

  • R3 1.259
  • R2 1.2477
  • R1 1.2405

Pivot Point 1.2292

  • S1 1.222
  • S2 1.2107
  • S3 1.2035

GBP/USD– Trading Tip

The GBP/USD prices traded sharply bullish soaring from 1.2200 level to place a high around 1.2360 level. The resistance level of 1.2360 is extended by an upward channel, which can be seen on the 4-hour timeframe. The 50 EMA is bullish, but the MACD is suggesting odds of selling bias in the GBP/USD pair, perhaps because the Sterling is in the overbought zone. Bullish crossover of 1.2360 level may lead Sterling prices further higher towards 1.2460, while support is likely to be found around 1.2289 and 1.2165. Consider taking buying trades over 1.2292 and selling below the same level today.


USD/JPY – Daily Analysis

The USD/JPY pair was closed at 107.539 after placing a high of 107.921 and a low of 107.399. Overall the movement of the USD/JPY pair remained bearish throughout the day. The USD/JPY pair showed a bearish trend on Tuesday but consolidated in a range between 107.3 and 107.9.

At 18:00 GMT, the Housing Price Index for March from the United States was dropped to 0.1% against the forecasted 0.6% and weighed on the U.S. dollar. The S&P/CS Composite-20 HPI for the year advanced to 3.9% against the expectations of 3.4% and supported the U.S. dollar. At19:00 GMT, the Consumer Confidence from Conference Board for May decreased to 86.6 from the forecasted 87.1 and weighed on the U.S. dollar. The New Home Sales for April were recorded as 623K against the expected 429K and supported the U.S. dollar.

The closely watched Consumer Confidence from the United States declined and made the U.S. dollar weak across the board and ultimately dragged the USD/JPY pair on Tuesday. From the Japanese side, at 4:50 GMT, the Services Producer Price Index (SPPI) for the year was dropped to 1.0% against the forecasted 1.3%and weighed on Japanese Yen. At 9:30 GMT, All Industrial activities for March came in line with the expectations of -3.8%. At 10:00 GMT, the Core CPI for the year from Bank of Japan also dropped to -0.1% from the expected 0.0% and weighed on Japanese Yen.

The Governor of Bank of Japan, Haruhiko Kuroda, said that the central bank was ready to ease monetary policy further. To add more stimulus measures, the bank decided to expand its loan programs, cut the rates further, and ramp up the risky asset purchases. In his semiannual testimony to parliament, Kuroda said that Bank of Japan was ready to do whatever it can to ensure markets were stable. He added that the stability of markets was its first importance now because once the pandemic was over, Japan’s economy could resume a solid recovery path.

Daily Support and Resistance    

  • R3 108.39
  • R2 108.16
  • R1 107.86

Pivot Point 107.63

  • S1 107.33
  • S2 107.1
  • S3 106.79

USD/JPY – Trading Tips

The USD/JPY pair continues to trade choppy sessions within the same trading 107.950 – 107.350. Above 107.950 level, we may see USD/JPY prices heading towards the next resistance level of 108.330. The 50 EMA is currently supporting the USD/JPY around 107.350. Breakout of USD/JPY support area of 107.35 can lead the USD/JPY prices towards 106.850. So let’s consider taking buying trades over 107.63 and selling below the same level today. 

All the best for today! 

Categories
Forex Market Analysis

Daily F.X. Analysis, May 22 – Top Trade Setups In Forex – ECB Monetary Policy Meeting Accounts Ahead! 

The U.S. Dollar Index (DXY) fell about 0.25% on the day to post the lowest close since May. Powell said that Fed might need to introduce more stimulus measures if the economic lockdown remains there for a long time. He also added that banks should prepare themselves for the bankruptcies of nonfinancial companies. Let’s keep an eye on U.K. Retail sales and ECB Monetary Policy Meeting Minutes.

Economic Events to Watch Today


EUR/USD – Daily Analysis

The EUR/USD prices were closed at 1.09777 after placing a high of 1.09988 and a low of 1.09185. Overall the movement of EUR/USD remained bullish throughout the day. The EUR/USD pair remained near 1.1000 after the release of FOMC meeting minutes. The surge in the EUR/USD pair suggested that the pair might break its 7-week range and move further to earn more gains.

The FOMC minutes failed to impress the market as there was no surprise element in Powell’s presentation and was ignored by market participants. It was widely expected that the coronavirus outbreak would continue to weigh on the economy, and the economic outlook would remain somewhat pessimistic. Greenback holds onto its losses as there was no room for surprises in the minutes of the meeting. 

The U.S. Dollar Index (DXY) fell about 0.25% on the day to post the lowest close since May. Powell said that Fed might need to introduce more stimulus measures if the economic lockdown remains there for a long time. He also added that banks should prepare themselves for the bankruptcies of nonfinancial companies.

On the data front, at 13:00 GMT, the Current Account Balance from the Eurozone showed a balance of 27.4B during March against 37.8B of February. At 14:00 GMT, the Final CPI from Eurozone for the year declined to 0.3% against the expectations of 0.4% and weighed on EUR. The Final Core CPI for the year came in line with the hopes of 0.9%. 

At 19:00 GMT, the Consumer Confidence on the Eurozone economic condition showed a decline to 19 forms the forecasted decline of 23 and supported EUR. The market participants ignored the poor than expected CPI from Eurozone, and EUR got its support after the release of consumer confidence, which showed less decline than expected.

Furthermore, the latest Franco-German proposal for a 500 euros fund to fight coronavirus crisis helped EUR pair to gain traction in the market and remain stronger than other currencies; this ultimately supported the upward trend of EUR/USD pair.

Daily Support and Resistance

  • R3 1.1067
  • R2 1.1038
  • R1 1.0994

Pivot Point 1.0965

  • S1 1.092
  • S2 1.0892
  • S3 1.0847

EUR/USD– Trading Tip

On Friday, the EUR/USD prices are holding at 1.0940 as these were facing strong resistance around 1.0993, which marks the triple top resistance level and can trigger selling in the pair. Conversely, the EUR/USD pair may find support around 1.0883, once the 1.0993 level gets violated. The MACD is recently forming selling candles, which suggests the trend of the sale in the pair. So the overall trading range can be from 1.0994 level to 1.0886. On Friday, we can look for selling trades under 1.0965 for 40/50 pips profit. 


GBP/USD – Daily Analysis

The GBP/USD pair was closed at 1.22225 after placing a high of 1.22495 and a low of 1.21855. Overall the movement of GBP/USD pair remained bearish throughout the day. The GBP/USD pair continued to follow its previous day’s trend of downward movement and dropped on Thursday as well. The decline in currency pair could be attributed to the increasing speculations that the Bank of England will consider to ease monetary policy further. The Governor of Bank of England, Andrew Bailey, said that he had changed his position into negative interest rates given the crisis.

He added that more easing measures from the Bank of England were more likely, but the interest rates were below on his priorities. He said that though it was not the time for negative interest rates, they could not be excluded from options.

Furthermore, on the lack of progress on trade talks with the European Union, the U.K. was driving its way towards no-deal Brexit. This raised fear amongst investors and raised uncertainty about the future relationship of Great Britain with E.U., making GBP weaker on the board. In the current context of coronavirus shutdown, the U.K. economy was already disturbed, and chances for an unfriendly exit from E.U. along with coronavirus would impact highly negative on the common currency. 

On the data front, at 13:30 GMT, the Flash Manufacturing PMI from Great Britain showed a surge in Index with 40.6 points against the 35.1 of forecast and supported GBP. Sterling was also supported by Flash Services PMI, which exceeded the expectations of 24.1 and came in as 27.8. From the U.S. side, the increased Jobless Claims last week by 2.43M weighed on the U.S. dollar. However, the Flash Manufacturing PMI, which was key data on Thursday from the American side, came in support of the U.S. dollar when released as 39.8 against the expectations of 39.3.

The strong U.S. dollar on Thursday amid better than expected PMI data added in the downfall of GBP/USD pair.

Daily Support and Resistance

  • R3 1.232
  • R2 1.2285
  • R1 1.2255

Pivot Point 1.222

  • S1 1.219
  • S2 1.2155
  • S3 1.2124

GBP/USD– Trading Tip

The GBP/USD continues to trade within the same technical levels, which we discussed a day before. The Cable is facing resistance around 1.2269 level, and it continues to develop doji and bearish engulfing candles below 1.2269 zones, which has driven a bearish retracement in the Cable. On the lower side, the Sterling may find support against the U.S. dollar around 1.2170 level. The MACD and 50 EMA are supporting selling bias in the pair. Today, the release of U.K. Retail Sales m/m may help drive further movement in the market. Therefore, the bullish breakout of 1.2270 level can lead the Sterling prices towards 1.2360. While breakout of the support level of 1.2169 may lead the Sterling pair towards the 1.2080 support zone. 


USD/JPY – Daily Analysis

The USD/JPY pair was closed at 107.604 after placing a high of 107.847 and a low of 107.415. Overall the movement of the USD/JPY pair remained bullish throughout the day. At 4:50 GMT, Japan’s Merchandise Trade Balance for April showed a deficit of 1.0 Trillion Japanese Yen on Thursday. At 5:30 GMT, the Flash Manufacturing PMI came in as 38.4 during May compared to 41.9 of April.

The exports from Japan showed a decline of 21.9% and imports by 7.2%, while overall trade balance showed a deficit and weighed on Japanese Yen. The weak JPY gave strength to the USD/JPY pair on Thursday.

On the American side, the U.S. jobless Claims for the past week exceeded over 2.43M from the expectations of 2.4M and weighed on the U.S. dollar at 17:30 GMT. The Philly Fed Manufacturing Index for May declined by 43.1 against 40.0 expected and weighed on the U.S. dollar.

However, at 18:45 GMT, the Flash manufacturing PMI from the U.S. for the month of May surged to 39.8 against the expected 39.3 and supported the U.S. dollar. The Flash Services PMI for May also exceeded to 36.9 from 32.6 of expectations. 

The C.B. Leading Index for April was expected to be declined by 5.5%, but in actual, it showed a decline of 4.4% and supported the U.S. dollar. The Existing Home Sales remain flat with expectations of 4.33M.

Better than expected economic data from the United States gave strength to the U.S. dollar and moved USD/JPY pair in an upward direction to post daily gains. On the other hand, Fed Chairman Jerome Powell showed concerns about the economic indicators to hit their bleakest levels since the Great Depression. He said that the U.S. economy was facing a whole new level of uncertainty amid the coronavirus crisis. 

Daily Support and Resistance    

  • R3 108.21
  • R2 108.04
  • R1 107.83

Pivot Point 107.65

  • S1 107.44
  • S2 107.26
  • S3 107.05

USD/JPY – Trading Tips

On Friday, the USD/JPY continues trading sideways in between 107.630 – 107.350. Above 107.650 level, we may see USD/JPY prices heading towards the next resistance level of 108.130. The ascending triangle pattern was already violated, and the upward trendline is expected to keep the USD/JPY supported around 107.350. Breakout of USD/JPY support area of 107.35 can lead the USD/JPY prices towards 106.850. So let’s consider taking buying trades over 107.350 today. 

All the best for today! 

Categories
Forex Market Analysis

Daily F.X. Analysis, May 20 – Top Trade Setups In Forex – European CPI Figures Ahead! 

The U.S. Federal Reserve will release its latest FOMC meeting minutes. The European Commission will post the May Consumer Confidence Index (-23.7 expected) and final readings of April CPI (+0.4% on-year expected). The U.K. Office for National Statistics will release April CPI (+0.9% on-year expected).

Economic Events to Watch Today 


EUR/USD – Daily Analysis

The EUR/USD prices were closed at 1.09228 after placing a high of 1.09759 and a low of 1.09020. Overall the movement of the EUR/USD pair remained bullish throughout the day. After gaining almost 100 pips on Monday, the EUR/USD pair rose to near its highest level in 2 weeks of 1.0976 level on Tuesday. The upbeat market mode was derived by the Franco-German recovery fund proposal, which was announced on Monday and provided a boost to the single currency EUR. 

The Vice President of the European Commission, Valdis Dombrovskis, said that the European Stability Mechanism (E.S.) strongly supported the Franco-German proposal. Commission was also looking forward to presenting the proposal in the upcoming European summit on May 27.

Following the previous day’s gains, the EUR/USD pair continued to rise and was further supported by the better than expected economic data release on Tuesday.

At 14:00 GMT, the ZEW Economic Sentiment from the European Union showed that the economic outlook of the Eurozone in the view of institutional investors and analysts increased to 46.0 from the expected27.4 and supported EUR. 

The German ZEW Economic Sentiment also showed an improved economic outlook after releasing as 51.0 against the expected 30.0 during the month of May and supported EUR.

The better than the expected economic outlook of the whole bloc, along with Germany even in the lockdown time, gave a sudden push to the already prevailing bullish trend in EUR/USD and rose its prices above two weeks high. However, pair failed to hold its gains and started to drop in late-session but managed to end its day with a bullish candle.

On the other hand, the greenback lost its demand in the absence of any significant economic data. Only Housing Starts in the month of April were released from the U.S. on Tuesday, which declined to 0.89M against the 0.95 forecasted and weighed on the U.S. dollar.

Meanwhile, the Fed Chair Jerome Powell also refrained from providing any specific surprising remarks about the economy or policy outlook and hence kept the U.S. dollar under pressure. He said that the Fed would remain committed to using its all tools to recover the U.S. economy from a corona-induced crisis. U.S. Dollar Index fell near 99.50 level on that day.

Daily Support and Resistance

  • R3 1.1089
  • R2 1.1008
  • R1 1.0961

Pivot Point 1.088

  • S1 1.0833
  • S2 1.0752
  • S3 1.0705

EUR/USD– Trading Tip

The technical outlook for EUR/USD pair seems bullish as the pair is trading at 1.0938, having formed a bullish engulfing pattern above an immediate support level of 1.0918 level. On the 4 hour timeframe, the pair is also forming a higher high and higher low pattern, which can drive further buying trends in the EUR/USD pair. The MACD is bullish, while the 50 EMA is also supporting the bullish bias among traders. The pair has the potential to trade towards north to target 1.0993 triple top area while support holds at 1.0918 and 1.08850 level today.


GBP/USD – Daily Analysis

The GBP/USD prices were closed at 1.22482 after placing a high of 1.22961 and a low of 1.21839. Overall the movement of GBP/USD pair remained bullish throughout the day. The GBP/USD pair rose for 2nd consecutive day on Tuesday amid the broad-based U.S. dollar weakness and better than expected employment data from the U.K. 

The U.S. dollar was already under pressure the previous day after the announcement of the Franco-German recovery fund proposal, which consists of 500 Billion euros. The increased risk appetite in the market also made the U.S. dollar weaker on Tuesday. 

Furthermore, better than expected U.K. employment data on Tuesday gave strength to GBP and raised GBP/USD prices. The office for National Statistics reported that U.K. Unemployment Rate in April dropped to 3.9% from the expected 4.4% and supported GBP.

Despite the decreased unemployment rate, around 857K people filed for jobless claims in April against the forecasted 675K. The decreased unemployment rate, which covers three months to March, showed that unemployment might have fallen sharply during April considering the increased numbers of jobless claims that month.

Meanwhile, U.K. announced a new tariff regime for Brexit that will remove tariffs on 30 billion pounds worth of imports or about 60% worth of trading coming into the U.K. The latest tariff named U.K. Global Tariff (UKCT) will become effective from January 2021 when the transition period will end.

AT 11:00 GMT, the Claimant Count Change for April showed that almost 856.5K people applied for jobless benefit claims against the expectations of 675.0K and weighed on Sterling. At 11:02 GMT, the Average Earning Index for the quarter showed a decline to 2.4% from the expected 2.7% and weighed on U.S. Dollar. However, the Unemployment rate for March showed a decline to 3.9% against the anticipated 4.4% and supported Pound.

Daily Support and Resistance

  • R3 1.2411
  • R2 1.2319
  • R1 1.2257

Pivot Point 1.2166

  • S1 1.2104
  • S2 1.2013
  • S3 1.195

GBP/USD– Trading Tip

On Wednesday, the GBP/USD traded sharply bullish to trade at 1.2245 level despite the release of worse than expected Labor market reports from the U.K. At the moment, Cable faces resistance around 50 EMA, which holds at 1.2255 level. The closing of candles below 1.2260 can drive selling. Still, considering the recent bullish engulfing and long histograms of GBP/USD pair, we may see a continuation of a bullish trend in the Sterling. On the upper side, the violation of 1.2246 level may lead Sterling towards 1.2318 today.  


USD/JPY – Daily Analysis

The USD/JPY pair was closed at 107.700 after placing a high of 108.086 and a low of 107.261. Overall the movement of the USD/JPY pair remained bullish throughout the day. The pair USD/JPY moved above 108.00 level on Tuesday, which was the one-month top-level amid increased risk-on market sentiment. The safe-haven Japanese Yen was under pressure after the latest optimism related to the encouraging initial results of coronavirus vaccine trials. Weaker Yen moved the USD/JPY pair in the opposite direction and made it to post gains above 108.00 level.

The intraday selling bias towards the Japanese Yen increased after the Bank of Japan called out for an unscheduled meeting on Friday. This fueled speculations that Bank would announce more easing measures.

The strong positive momentum due to weakened Yen lifted the USD/JPY prices to its highest level since April 13. However, the rally remained limited due to the rising concerns about the US-China relationship.

Another reason behind the limited rally on Tuesday was the fears about the second-wave of coronavirus. Senators questioned the Fed Chair Jerome Powell and the U.S. Treasury Secretary Steven Mnuchin about their stewardship of specific aspects of the $2 trillion package on Tuesday.

The Senate Banking Committee held its first look at spending under the package announced in March to assist people affected by the coronavirus pandemic. Mnuchin and Powell showed different perspectives on the economic outlook. Mnuchin remained optimistic and said that in the second half of 2020, the economy would see an upturn, while Powell suggested that congress might need more than trillions to aid the economy.

Daily Support and Resistance    

  • R3 108.04
  • R2 107.78
  • R1 107.56

Pivot Point 107.3

  • S1 107.09
  • S2 106.82
  • S3 106.61

USD/JPY – Trading Tips

On Wednesday, the USD/JPY mostly remains mostly bearish following a bullish breakout of the choppy trading range of 107.480 – 107.029 level. For now, the pair is holding at 107.630, having immediate support around 107.500. Above this level, we may see USD/JPY prices heading towards the next resistance level of 108.130. The ascending triangle pattern has already been violated, and it’s expected to kee the USD/JPY supported around 107.500. So let’s consider taking buying trades over 107.500 today. All the best for today! 

Categories
Forex Market Analysis

Daily F.X. Analysis, May 15 – Top Trade Setups In Forex – U.S. Retail Sales in Highlights!

On the news front, the economic calendar remains busy on Friday. Today’s releases may trigger some price action in the Euro and U.S. related pairs, especially on the release of German GDP, Eurozone Flash GDP, and U.S. core retail sales figures, which are due to come out during European and U.S. session respectively.

Economic Events to Watch Today 


EUR/USD – Daily Analysis

During the early Asain trading session, the EUR/USD currency pair flashing green, but remains trading in the confined range around above the 1.0800 level ahead of Germany’s preliminary gross domestic product (GDP) for the first quarter. The broad-based U.S. dollar modest weakness helping the currency pair to stay positive and kept a lid on any additional losses, at least for now. For example, the currency pair is looking directionless as the S&P 500 is sidelined, and the Asian stocks are adding in a mixed performance. 

The EUR/USD is trading at 1.0806 and consolidates in the range between the 1.0798 – 1.0809. However, the traders are keenly awaiting Germany’s preliminary gross domestic product ahead of a strong position.

At the data front, Germany’s preliminary gross domestic product (GDP) for the first quarter, which is scheduled to publish at 06:00 GMT, is anticipated to show the old continent’s biggest economy declined by 2.2%, having increased by 0.4% in the final 3-months of 2019. It should be noted that the GDP prints of -2.2% or lower would be considered the worst reading since the ist-quarter of 2009. 

Germany had declared a secure national lockdown on March 22, which meant the economic activity came to a stop only in the last 8 or 9 of the 1st-quarter. In contrast, Germany is dependent on the dragon nation, which had already faced a sharp recession in the activity in the first two months of the year, mainly due to the coronavirus pandemic.

Therefore, there are many chances that Germany reporting a bigger-than-expected recession in the first quarter will not be rejected. As we already mentioned, the economists are expecting a 2.2% decrease, as per Germany’s DIW economic institute, the economy expected declined by 2% in the first quarter. Alternatively, the DIW expects a 10% decline in the GDP in the second quarter. 

Moving on, the EUR/USD currency pair may not pay any significant attention if the GDP prints in line with estimates as the market already priced in the worst condition of significant economies during the March and more so in April caused by coronavirus outbreak.

The currency pair could be able to take bids only if prints would be a surprise beat on expectations, but the gains would be temporary or short-lived if the risk sentiment turns heavy. Looking forward, market participants now look forward to Germany’s preliminary gross domestic product (GDP) for the first quarter, which is scheduled to publish at 06:00 GMT. The trade/virus updates could also entertain market traders.

Daily Support and Resistance

  • S1 1.0673
  • S2 1.0758
  • S3 1.079
  • Pivot Point 1.0843
  • R1 1.0874
  • R2 1.0928
  • R3 1.1013

EUR/USD– Trading Tip

On Friday, the EUR/USD is trading at 1.0807, bouncing off over the double bottom support level of 1.07756. On the 4 hour chart, the EUR/USD is closing bullish candles above upward channel trendline, but at the same time, the 50 EMA and horizontal resistance seem to drive bearish sentiment for the EUR/USD pair. Extension of selling below 1.0843 level may lead the EUR/USD prices towards 1.07782 level, and below this, the next support is likely to be found around 1.0730. Consider staying bullish above and bearish below 1.0770 level today. 


GBP/USD – Daily Analysis

The GBP/USD currency pair failed to stop its 5-day losing streak and dropped below the 1.2210 level while representing 0.15% losses on the day mainly due to the Brexit worries and coronavirus crisis. The broad-based U.S. dollar over-all bullish sentiment also weighed on the currency pair and kept the pair down. The GBP/USD is trading at 1.2208 and consolidates in the range between the 1.2203 – 1.2237. However, the traders are cautious about placing any strong position as they are keenly awaiting today’s U.S. consumer-centric data.

At the Brexit front, the European Union (E.U.) and the United Kingdom moderators are still pushing to cancel Brexit talk, which decided to happen through video conferences. At the same time, the European Commission’s (E.C.) took legal action against the U.K., which made talks tougher to happen. The European Commission initiated legal proceedings against the U.K. on Thursday, while accusing the U.K. about failing to comply with E.U. law on free movement which eventually keeps the cable currency under pressure and contributes to the pair’s declines.

On the flip side, the UK PM Boris Johnson keeps its preference high toward border checks at the Northern Ireland (N.I.) while the N.I. Secretary Brandon Lewis has repeatedly said there shall not be a border down the Irish Sea.

At the coronavirus front, the infected cases by coronavirus reached around 233 thousand overall in England, including 25 thousand in London,

as per the latest research by the Public Health England (PHE) and Cambridge University. In the meantime, the United Kingdom is talking with Swiss drugmaker Roche Holding AG about to buy an accurate COVID-19 antibody test after getting preliminary approval by the European Union and the United States.

Apart from this, the Bank Of England governor Andrew Bailey showed a willingness to take further action but denied rate cuts. The reason for the pairs bearish moves could also be attributed to the statement of the British central bank’s citizen panel in which they expect COVID-19 to have a large and enduring influence on the economy and society more broadly.

At the USD front, the broad-based U.S. dollar bolsters by the receding expectations of negative Fed rate and the increased probabilities of further stimulus from the government. While the Dollar Index (DXY), a gauge of the greenback versus significant currencies, remains mildly bid around 100.30 by the press time.

Daily Support and Resistance

  • R3 1.2577
  • R2 1.2508
  • R1 1.2422

Pivot Point 1.2353

  • S1 1.2268
  • S2 1.2198
  • S3 1.2113

GBP/USD– Trading Tip

On the last trading day of the week, the GBP/USD is trading sideways at 1.2200 after breaking below the narrow trading range of 1.2320 – 1.2245. The Cable has formed a new range of 1.2245 – 1.2186, however it’s still holding below 50 EMA, which is extending resistance around 1.2260 level today. On the 4 hour chart, the GBP/USD is gaining support at 1.2180 level while the 50 EMA and horizontal resistance stay at a level of 1.2245. 

The violation of the sideways trading range of 1.2245 – 1.2180, and the release of U.S. retail sales may help drive breakout in the GBP/USD pair. 

The GBP/USD pair may lead its prices towards an immediate support level of 1.2190 and 1.2150 in case of positive date; elsewhere, the GBP/USD pair may soar towards 1.2240 and 1.2310. 


USD/JPY – Daily Analysis

The USD/JPY pair was closed at 107.224 after placing a high of 107.363 and a low of 106.773. Overall the movement of the USD/JPY pair remained bullish throughout the day. After dropping below 107 level on Thursday, the USD/JPY pair regained its strength and posted gains for the day on the back of the improved market sentiment. The increased claims for jobless benefits from the United States during the last week failed to weigh on the U.S. dollar. A total of 2.9M Americans applied for unemployment benefits in the previous week against the expected 2.5M.

At 17:30 GMT, the Unemployment Claims for last week exceeded the expectations of 2500K and came in as 2981K and weighed on the U.S. dollar. The Import Prices for April were declined by 2.6% against the forecasted decline by 3.1% and supported the U.S. dollar.

The U.S. Dollar Index ignored the job data from the United States and moved above 100.40 level on Thursday, which helped USD/JPY pair to stretch its gains. Another factor adding in the upward trend of the USD/JPY pair was the comments from Donald Trump in support of the dollar. He said that a strong dollar was a great thing that could help in fast economic recovery after the coronavirus, this triggered the U.S. dollar buying wave and extended USD/JPY pair’s gains.

From the Japan side, at 4:50 GMT, The M2 Money Stock for the year from Japan was recorded as 3.7% against the forecast of 3.4% and supported Japanese Yen. At 10:59 GMT, the Prelim Machine Tool Orders for the year showed a decline of -48.3% in comparison to the previous -40.7%. 

Daily Support and Resistance    

  • R3 109.37
  • R2 108.57
  • R1 108.12

Pivot Point 107.33

  • S1 106.88
  • S2 106.09
  • S3 105.64

USD/JPY – Trading Tips

The safe-haven Japanese yen continues to trade in line with our previous forecasts. On Friday, the USD/JPY traded bearishly to trade below the support level of 107, which marked the 50% Fibonacci retracement level. The USD/JPY is holding at 107.05, where the 50 EMA is supporting the pair, and it may drop further below the 107 level. At the moment, the 4-hour candle appears to close below 107 support become resistant, and this may drive more selling in the USD/JPY pair. The pair may extend selling until 106.600 level, whereas the closing of buying candles above 107 can trigger bullish bias until 107.50. By the way, bearish bias seems solid today. All the best for today! 

Categories
Forex Assets

Analyzing The GBP/SAR Exotic Currency Pair

Introduction

In the Forex market, currencies are traded in pairs, and one currency is always quoted against the other. The abbreviation of GBP/SAR is British Pound Saudi Riyal. Here, the first currency GBP is the base currency, and the second one SAR is the quote currency.

Understanding GBP/SAR

We compare the value of one currency to another, and hence when we buy a currency pair, we are essentially buying the base currency and selling the quote currency. The market value of GBP/SAR determines the strength of SAR against the GBP, so if the exchange rate for the pair GBP/SAR is 4.7167, it means we need 4.7167 SAR to buy 1 GBP.

Spread

Trading the Forex market usually does not involve in spending a lot of commissions like the Stock market. Here, Forex brokers make a profit through spreads. The difference between the Bid and the Ask prices of an asset is called the spread. Some broker has the cost inbuilt into the buy and sell prices of the currency pair we want to trade instead of charging a separate fee. Below are the spread values of ECN and STP brokers for the GBP/SAR pair.

ECN: 40 pips | STP: 44 pips

Fees

A Fee is simply the charges we pay to the broker for executing a particular trade. The fee varies from the type of broker we use. For example, the fee on the STP account model is zero, but we can expect a few pips on ECN accounts.

Slippage

Slippage is the implementation of a trade at a price different from that requested by a trader. Slippage can either be positive (be additional profit) or negative (additional loss) and Mostly occurs when the market is volatile.

Trading Range in GBP/SAR

The trading range is used here is to measure the volatility of the GBP/SAR pair. The amount of money we will win or lose in a given amount of time can be assessed using the trading range table. The minimum, average, and maximum pip movement of the currency pair is represented in the trading range. This can be evaluated simply by using the ATR indicator combined with 200-period SMA.

Procedure to assess Pip Ranges

  1. Add the ATR indicator to your chart
  2. Set the period to 1
  3. Add a 200-period SMA to this indicator
  4. Shrink the chart so you can assess a significant period
  5. Select your desired timeframe
  6. Measure the floor level and set this value as the min
  7. Measure the level of the 200-period SMA and set this as the average
  8. Measure the peak levels and set this as Max.

GBP/SAR Costs as a Percent of the Trading Range

The cost of trade depends on the broker and differs according to the volatility of the market. This is because the trading cost includes slippage, fees, and the spread. The cost of variation in terms of percentage is given below. We will look into both the ECN model and the STP model.

ECN Model Account

Spread = 40 | Slippage = 3 |Trading fee = 5

Total cost = Slippage + Spread + Trading Fee = 3 + 40 + 5 = 48

STP Model Account

Spread = 44| Slippage = 3 | Trading fee = 0

Total cost = Slippage + Spread + Trading Fee = 3 + 44 + 0 = 47

Trading the GBP/SAR Forex pair

The GBP/SAR is an exotic-cross currency pair and is a low volatile market. Looking at the pip range table, the average pip movement on the 1H timeframe is only 62 pips. Hence, The volatility of this currency pair is on the lower side. We know that the higher the volatility, the lower will be the cost to execute the trade. However, this is not an advantage as trading in a volatile market involves more risk.

Let’s take, for example, in the 1M time frame, the Maximum pip range value is 3952, and the minimum is 896. When we compare the trading fees for both the pip movements, we note that for 896pip movement fess is 5.36%, and for 3952pip movement, fess is only 1.21%. As we can conclude from the above example, trading the GBP/SAR currency pair will be a bit expensive.

Categories
Forex Market Analysis

Daily F.X. Analysis, April 22 – Top Trade Setups In Forex -U.K. Inflation Stabilises! 

On the forex front, the U.S. dollar gained traction against other major currencies, with the Dollar Index climbing 0.3% on the day to 100.20. The U.S. official data showed that Existing Homes Sales fell to an annualized rate of 5.27 million units in March (5.25 million units expected).

The British Consumer Prices Index (CPI), including owner-occupiers’ housing inflation rate, came out at 1.5% in March 2020. Although it’s down from 1.7% in February 2020, it’s not as bad as investors were expecting considering the lockdown in global markets. 

Economic Events to Watch Today     


 EUR/USD – Daily Analysis

The EUR/USD fell by nearly 0.1% to trade at 1.0865. While Spain’s central bank announced, the country’s GDP could fall by 6.8% to 12.4% this year. Later in the today, the major focus will stay on the German ZEW Current Situation Index for April will be released (-75.0 estimated).  

After the Eurozone divided on community debt, most of the analytes are worried that the finance ministers’ may unable to provide a suitable fiscal stimulus to support growth. So, the shared currency could remain under pressure ahead of the Thursday summit.

At the coronavirus front, as per the latest report, the number of confirmed coronavirus cases grew to 145,694, with 4,879 deaths reported in Germany so far. As the cases increased by 2,237 in Germany, a 1.6% rise picking-up pace from Tuesday’s 1.3% increment, the death toll moved sharply up by 281 vs. 194 a day before.

Looking forward, the upbeat Eurozone Consumer Confidence, which is scheduled to release at 14:00 GMT, may put a bid under EUR/USD currency pair. However, the pair trend will remain sluggish until the pair break the trading range of 1.0897 to 1.08616. 

Daily Support and Resistance

  • S1 1.0724
  • S2 1.0788
  • S3 1.0823

Pivot Point 1.0852

  • R1 1.0887
  • R2 1.0916
  • R3 1.098

EUR/USD– Trading Tips

On Wednesday, the EUR/USD is trading sideways at 1.0825, as investors seem to wait for a solid reason to enter the market. The overall bias remains bearish as the EUR/USD prices are holding below 50 EMA, which is extending resistance around 1.08945 level. Continuation of a selling trend below 1.08945 level can continue selling until the next support area of 1.0772, but on the way, the pair may find support around 1.0815 level. 

The EUR/USD is likely to find support around 1.0772, but below this, the next support prevails around 1.0652 level. The pair may find an immediate resistance level of around 1.09230, where the bullish breakout of this level can extend buying until the next resistance level of 1.1036. Conversely, we should look for selling trades below 1.0894.  


GBP/USD – Daily Analysis

The GBP/USD soared 0.3% to trade at 1.2318 as the British Consumer Prices Index (CPI), including owner-occupiers’ housing inflation rate, came out at 1.5% in March 2020. Although it’s down from 1.7% in February 2020, it’s not as bad as investors were expecting considering the lockdown in global markets. 

 At the USD front, investors prefer to choose the U.S. dollar because of its safe-haven-demand in the market due to the fears of economic fallout, which is caused by the coronavirus outbreak. The dollar index, which measures the worth of the greenback against majors, rose 0.20% to levels above 100.00.

The reason behind the decline in GBP/USD pair could also be the immediate rise in COVID-19 cases, with the curve still not notably peaking. It indicates that there is still a high chance that lockdowns could last longer than expected, while the Bankruptcy and bad loans will likely boost the risk-off sentiment in the market and provide further support to the U.S. dollar again.

Apart from the U.K., U.S. President Donald Trump suggested that approximately 20 states ready for re-open while also showing a willingness to sign the bill that stops immigration into the U.S. for 60 days. As in result, the risk sentiment remains under pressure.

The reason behind the risk-off market sentiment could also be the early Asian news surrounding the U.S. Senate’s passage of $484 billion COVID-19 relief package and BOJ’s likely decline of economic and price forecasts. Moreover, statements from the BOE’s Bailey were also necessary to remark during the early Asian session.

As in result, the U.S. 10-year Treasury yields declined by 2-basis points (bps) to 0.55%, after dropping 4-bps on Tuesday, while the most stocks in Asia-Pacific flashing losses by the pres time.


Daily Support and Resistance

  • S1 1.1974
  • S2 1.2148
  • S3 1.2223

Pivot Point 1.2322

  • R1 1.2397
  • R2 1.2496
  • R3 1.2671

GBP/USD– Trading Tip

Yesterday, the GBP/USD fell sharply to trade at 1.2250 after violating the horizontal support level of 1.2424. On the 4 hour chart, the Cable has closed Doji candle above 1.2250 level can drive bullish bias until 1.2350. On the upper side, the Sterling may find next resistance around 1.2426, it’s the same level that supported the pair previously, and now it’s likely to drive selling bias in the GBP/USD pair. On the lower side, the violation of the 1.2265 level can lead the GBP/USD prices towards 1.2175. The 50 EMA and MACD are both are suggesting selling bias in the Cable. So let’s look for selling trades below 1.2322 and bullish above the same level today. 

USD/JPY – Daily Analysis

On Wednesday, the USD/JPY is trading around 107.500 level, mostly exhibiting sideways trading due to a lack of major economic events in the market. The U.S. dollar index slipped to the fresh lows of 100.07 ahead of recovering some ground, still bearish by 0.15% on the day.

The Japanese yen seems to suffer due to a lack of confidence when the state of emergency is being lifted in Japan. While drop-in, the domestic macroeconomic indicators are expected to keep the Japanese yen’s in a bearish mode while maintaining the USD/JPY bullish. Lately, the uptrend in the JPY could be limited due to the forecast of the Bank of Japan (BOJ) support measures to boost funding for the companies due to be announced next week. 

The U.S. Treasury prices advanced as investors continued to seek safe-haven assets. The benchmark 10-year U.S. Treasury yield declined to 0.571% from 0.625% Monday.

On the negative side, the greenback gained ground due to the oil price crash triggered a dash for cash. The high uncertainty in the market also boosted the greenback demand. So, if that trend continues during the ay ahead, the yellow metal could come under pressure.

Daily Support and Resistance    

  • S1 105.92
  • S2 106.84
  • S3 107.44

Pivot Point 107.76

  • R1 108.36
  • R2 108.69
  • R3 109.61

USD/JPY – Trading Tips

The USD/JPY is trading mostly sideways within a narrow trading range of 108.020 – 107.300 zones. At the moment, it’s holding at 107.597, having formed a descending triangle pattern on the 4-hour timeframe. The triangle pattern is extending resistance around 107.850, along with support around 106.980.  

In case, the USD/JPY violates the descending triangle pattern; we may see pair dropping towards 106.200. While on the upper side, a bullish breakout of 108 can lead USD/JPY prices towards 109.100. The leading indicator, such as MACD and 50 EMA, are supporting bearish bias in the market today. Let’s wait for a breakout before taking more trades today.

All the best for today! 

Categories
Forex Market Analysis

Daily F.X. Analysis, April 21 – Top Trade Setups In Forex – Economic Sentiment in Highlights! 

On the forex front, the U.S. dollar firmed against its major peers, with the Dollar Index gaining 0.2% on the day to 99.95. The ZEW survey results of April will be released for Germany (current situation at -75.0, expectations at -42.0 expected) and the Eurozone.

The U.K. Office for National Statistics will report a jobless rate for the three months to February (steady at 3.9% expected). While in the U.S., the National Association of Realtors will report March existing home sales (5.30 million units expected).

Economic Events to Watch Today     


EUR/USD – Daily Analysis

The EUR/USD fell by nearly 0.1% to trade at 1.0865. While Spain’s central bank announced, the country’s GDP could fall by 6.8% to 12.4% this year. Later in the today, the major focus will stay on the German ZEW Current Situation Index for April will be released (-75.0 estimated).  

European stocks were mostly trading higher, with the Stoxx Europe 600 Index surging 0.7%. Both Germany’s DAX and the U.K.’s FTSE 100 added 0.5%, and France’s CAC was up 0.7%, which are somehow supporting the Euro, the single currency. 

As of now, the market participants seem very concerned about the negative impact of the oil prices Monday’s declines and keeps their eyes on it. As in result, the U.S. dollar could continue to gain ground during the Europan trading hours ahead while the S&P 500 futures are now reporting a 0.65% drop. 

The additional bearish pressure could arise from President Trump’s decision to delay immigration to the U.S. to control the coronavirus outbreak. Let’s brace to trade ZEW survey results of April will be released for Germany (current situation at -75.0, expectations at -42.0 expected) and the Eurozone. 

Daily Support and Resistance

  • S1 1.0758
  • S2 1.0813
  • S3 1.084

Pivot Point 1.0869

  • R1 1.0896
  • R2 1.0924
  • R3 1.098

EUR/USD– Trading Tips

Technically, the EUR/USD is trading with a slightly bearish bias at 1.0825, exhibiting a bearish crossover below 50 EMA, which is now extending resistance around 1.0903 level. Continuation of a selling trend below 1.0903 level can extend selling until the next support area of 1.0772, but on the way, the pair may find support around 1.0815 level. The EUR/USD is likely to find support around 1.0772, but below this, the next support prevails around 1.0652 level. The pair may find an immediate resistance level of around 1.09230, where the bullish breakout of this level can extend buying until the next resistance level of 1.1036. Conversely, we should look for selling trades below 1.0870.

GBP/USD– Daily Analysis

The GBP/USD slid 0.5% to 1.2442. Investors will focus on the U.K. jobless rate for the three months to February due later in the day (steady at 3.9% expected). The United Kingdom and European Union Brexit drama keep moving while the latest news recommending to keep a check of Britain’s £39 billion has also been underlined by the cost of dealing with coronavirus, especially the economic £250 billion rescue package announced by Chancellor Rishi Sunak to protect jobs and businesses.

At the USD front, investors prefer to choose the U.S. dollar because of its safe-haven-demand in the market due to the fears of economic fallout, which is caused by the coronavirus outbreak. The dollar index, which measures the worth of the greenback against majors, rose 0.20% to levels above 100.00.

Later today, the U.S. dollar could continue to gain ground during the Europan trading hours ahead due to high safe-haven demand in the market in the wake of intensifying coronavirus fears while the S&P 500 futures are now reporting a 0.65% drop. 

On the other hand, the reason behind the cable’s pair declines could also be the immediate rise in COVID-19 cases, with the curve still not notably peaking. It indicates that there is still a high chance that lockdowns could last longer than expected, while the Bankruptcy and bad loans will likely boost the risk-off sentiment in the market and provide further support to the U.S. dollar again.

Looking forward, traders are keenly waiting for the key U.K. data which is scheduled to release during this day ahead As well as, the coronavirus related headlines also will be key to watch for taking fresh directions in the U.S. dollar.


Daily Support and Resistance

  • S1 1.2298
  • S2 1.2374
  • S3 1.2407

Pivot Point 1.245

  • R1 1.2483
  • R2 1.2526
  • R3 1.2601

GBP/USD– Trading Tip

Taking a look at the 4-hour timeframe, the GBP/USD is trading at 1.2394 level, violating the support level of 1.2400 level. A bearish breakout of 1.2400 support area is expected to trigger a sell-off until 1.2310. The 50 periods EMA is also keeping the GBP/USD pair under pressure while extending resistance around 1.2430. Thus, the bounce off above this level can lead the GBP/USD pair towards the next resistance level of 1.2657. While bearish breakout of 1.2460 can open up further room for selling until the next support area of 1.2220. 

USD/JPY – Daily Analysis

On Tuesday, the USD/JPY is trading with a selling bias around 107.350, due to intensifying coronavirus fears as increased risk sentiment is driving the demand for the safe-haven currency. The slump in the Japanese exports for March keeps Japanese yen down, which also supports the currency pair to stay at the upside. 

The U.S. dollar extends taking bids mostly due to its safe-haven demand in the wake of intensified coronavirus fears. Considering the fresh report that the United States death toll surged over 40,000, whereas SkyNews mentions the U.K. has a bit over 16,000 people who died from the virus.

Looking forward, the North Korean leader’s health and oil moves will be key to watch, and coronavirus updates could be the driver seat for taking fresh directions. Alongside, the trader will keep their eyes on the U.S. dollar dynamics.

Daily Support and Resistance    

  • S1 105.92
  • S2 106.84
  • S3 107.44

Pivot Point 107.76

  • R1 108.36
  • R2 108.69
  • R3 109.61

USD/JPY – Trading Tips

The USD/JPY is trading slightly bearish at 107.339, having formed a descending triangle pattern on the 4-hour timeframe. The triangle pattern is extending resistance around 107.850 along with resistance around 106.980. As we know, the descending triangle pattern usually breakout on the lower side, and if this happens, the violation of 106.980 level may send the USD/JPY currency pair towards 105.850 level. 

All the best for today! 

Categories
Forex Assets

Analyzing The GBP/TWD Forex Currency Pair

Introduction to GBP/TWD

GBP stands for British pound sterling, and it is typically known as Pound. It is the official currency of the United Kingdom and some other countries like Jersey, South Georgia, and Guernsey. The pound is also the 4th most traded currency in the foreign exchange after USD, EUR & YEN. Whereas TWD is the abbreviation of The New Taiwan dollar. The central bank of Taiwan issues this currency.

GBP/TWD

Currency pairs are the national currencies from two countries coupled for being exchanged in reference to each other. In the Forex market, one currency is always quoted against the other. GBP/TWD is the abbreviation for the Pound sterling against the New Taiwan dollar. In this case, the first currency(GBP) is the base currency, and the second(TWD) is the quote currency.

Understanding GBP/TWD

In Forex, to find out the relative value of one currency, we need another currency to compare. If the value of the base currency goes down, the value of the quote currency goes up and vice versa. The market value of GBP/TWD determines the strength of TWD against the GBP. This can be easily understood as 1GBP is equal to how much of TWD. So if the exchange rate for the pair GBP/TWD is 37.093, it means we need 37.093 TWD to buy 1 GBP.

Spread

Forex brokers have two different prices for currency pairs: the bid and ask price. The bid price is the selling price, and ask is the buy price. The difference between the ask and the bid price is called the spread. Spread is basically a type of commission by which brokers make their money. Below are the ECN and STP for the pair GBP/TWD.

ECN: 49 pips | STP: 52 pips

Fees

Each time we place a trade, we need to pay some commission on it. A Fee is simply that commission we pay to the broker for opening a particular position. The fee also varies from the type of broker we use; for example, there is no fee on STP account models, but a few pips on ECN accounts.

Slippage

Slippage refers to the difference between the trader’s expected price and the actual price at which the trade is executed. It can occur at any time but mostly happens when the market is fast-moving and volatile. Also, sometimes when we place a large number of orders at the same time.

Ranges in GBP/TWD

The Range is a measure of volatility. It tells how much the currency pair has moved in a determined period. Whether a trader makes a profit or loss in a given time period depends on the movement of a currency pair and can be determined using the trading range table. It is a representation of the minimum, average, and maximum pip movement in a currency pair. This can be evaluated simply by using the ATR indicator combined with 200-period SMA.

Procedure to assess Pip Ranges

  1. Add the ATR indicator to your chart
  2. Set the period to 1
  3. Add a 200-period SMA to this indicator
  4. Shrink the chart so you can assess a significant period
  5. Select your desired timeframe
  6. Measure the floor level and set this value as the min
  7. Measure the level of the 200-period SMA and set this as the average
  8. Measure the peak levels and set this as Max.

GBP/TWD Cost as a Percent of the Trading Range

The cost of trade mostly depends on the broker and varies based on the volatility of the market. This is because the total cost involves slippage and spreads apart from the trading fee. Below is the representation of the cost variation in terms of percentages. The comprehension of it is discussed in the following sections. We will look into both the ECN model and the STP model.

ECN Model Account

Spread = 49 | Slippage = 3 |Trading fee = 5

Total cost = Slippage + Spread + Trading Fee = 3 + 49 + 5 = 57

STP Model Account

Spread = 52| Slippage = 3 | Trading fee = 0

Total cost = Slippage + Spread + Trading Fee = 3 + 52 + 0 = 55

Trading the GBP/TWD Forex Pair

The GBP/TWD is an exotic-cross currency pair and is a ranging market. A market is said to be ranging when the price hits the support and resistance at least three times. As seen in the Range table, the average pip movement on the 1-hour time frame is only 47. This clearly shows that if we trade in this pair, we will have to wait for a more extended period of time to get some good profit because of such a less movement in the pips.

Here in GBP/TWD, TWD is considered to be an emerging currency. Note that the higher the volatility, the lower is the cost of the trade. However, this is not an advantage as it is risky to trade highly volatile markets.

For example, in the 1M time frame, the maximum pip range value is 3009 and in minimum pip range, the value is 687. When we compare the fees for both the pip movements, we find that for 687 pip movement fees is 8.30%, and for 3009pip movement, fess is only 1.89%.

So, we can infer that the cost of trade is higher in the low volatile markets and high in the highly volatile markets. It is recommended to trade when the volatility is around the minimum values. The volatility here is low, and the costs are a little high compared to the average and the maximum values. But, if our priority is not towards reducing costs, we may trade when the volatility of the market is around the maximum values.

Categories
Forex Assets

Asset Analytics – Analyzing The GBP/DKK Currency Pair

Introduction

GBP Pound sterling, also known as the pound, is the official currency of the United Kingdom and many others. The sterling is the fourth most-traded currency in the forex market. Where in DKK is known as The krone and sometimes Danish crown. It is the official currency of Denmark, Greenland, and the Faroe Islands.

GBP/DKK is the abbreviation for the Pound sterling against the Danish crown. In the Forex, one currency is quoted against the other. Here, the first currency(GBP) is the base currency, and the second(DKK) is the quote currency. The GBPDKK is classified as exotic-cross currency pair.

Understanding GBP/DKK

In Forex, to find out the relative value of one currency, we need another currency to compare. The market value of GBPDKK determines the strength of DKK against the GBP that can be easily understood as 1GBP is equal to how much DKK, so if the exchange rate for the pair GBPDKK is 8.3430. It means that we need 8.3430DKK to buy 1 GBP.

If the value of the base currency goes down, the value of the quote currency goes up and vice versa.

Spread

Forex brokers have two different prices for currency pairs: the bid and ask price. The bid price is the selling price, and ask is the buy price.

The difference between the ask and the bid price is called the spread. The spread is how brokers make their money.

ECN: 39 pips | STP: 42 pips

Fees

A Fee is simply the commission we pay to the broker on each position we open. There is no fee on STP account models, but a few pips on ECN accounts.

Slippage

slippage refers to the difference between the trader’s expected price and the actual price at which the trade is executed. It can occur at any time but mostly happens when the market is fast-moving and volatile. Also, sometimes when we place a large number of orders at the same time.

Trading Range in GBP/HKD

The amount of money you will win or lose in a given amount of time can be assessed using the trading range table. This is a representation of the minimum, average, and maximum pip movement in a currency pair. This can be evaluated simply by using the ART indicator combined with 200-period SMA.

Procedure to assess Pip Ranges

  1. Add the ATR indicator to your chart
  2. Set the period to 1
  3. Add a 200-period SMA to this indicator
  4. Shrink the chart so you can assess a significant period
  5. Select your desired timeframe
  6. Measure the floor level and set this value as the min
  7. Measure the level of the 200-period SMA and set this as the average
  8. Measure the peak levels and set this as Max.

GBP/DKK Cost as a Percent of the Trading Range

The cost of trade mostly depends on the broker and varies based on the volatility of the market. This is because the total cost involves slippage and spreads apart from the trading fee. Below is the representation of the cost variation in terms of percentages. The comprehension of it is discussed in the following sections.

ECN Model Account

Spread = 39 | Slippage = 3 |Trading fee = 5

Total cost = Slippage + Spread + Trading Fee = 3 + 39 + 5 = 47

STP Model Account

Spread = 42 | Slippage = 3 | Trading fee = 0

Total cost = Slippage + Spread + Trading Fee = 3 + 42 + 0 = 45

Trading the GBP/DKK

The GBP/DKK is an exotic-cross currency pair and is a volatile market. For instance, the average pip movement on the 1H timeframe is only 333 pips. DKK is considered to be an emerging pair.

Note that the higher the volatility, the lower is the cost of the trade. However, this is not an advantage as it is risky to trade highly volatile markets. Also, the larger/smaller the percentages, the higher/lower are the costs on the trade. So, we can infer that the prices are higher for low volatile markets and high for highly volatile markets.

It is recommended to trade when the volatility is around the minimum values. The volatility here is low, and the costs are a little high compared to the average and the maximum values. But, if you’re priority is towards reducing costs, you may trade when the volatility of the market is around the maximum values.

Categories
Forex Assets

Trading The GBP/THB Forex Exotic Pair

Introduction

GBP

Pound sterling, also know as the pound, is the official currency of the United Kingdom and many others. The Pound sterling is the oldest currency and even the fourth most-traded currency in the foreign exchange market, after the United States dollar, the euro, and the Japanese yen.

THB

Thai Bhat is the official currency of Thailand. It’s divided into 100 satangs, According to Bloomberg, the Thai baht was the world’s best-performing currency in 2018, and since then, Thai baht is the 10th most frequently used world payment currency.

GBPTHB is the abbreviation for the Pound sterling against the Thai baht. Here, the GBP is the base currency, and the THB is the quote currency. It is classified as an exotic-cross currency pair.

Understanding GBP/THB

In Forex, to find the relative value of one currency, we need another money to compare. The market value of GBPTHB determines the cost of THB that is required to buy one GBP. It can simply be understood as 1GBP is equal to how much THB, so if the exchange rate for the pair GBPTHB is 1.6894. It means that we need 38.92 THB to buy 1 GBP.

Spread

Forex brokers have two different prices for currency pairs: the bid and ask price. Here the “bid” price at which you can SELL the base currency, and The “ask” price is at which you can BUY the base currency. Hence, the difference between the ask and the bid price is called the spread. The spread is how brokers make their money. Some broker Instead of charging a separate fee for trading, they already have the fees inbuilt in the spread.

ECN: 28 pips | STP: 31 pips

Fees

A Fee is simply the commission you pay to the broker on each position you open. There is no fee on STP account models, but a few pips on ECN accounts.

Slippage

slippage refers to the difference between the trader’s expected price and the actual price at which the trade is executed. It occurs when market orders are placed during high fast-moving, highly volatile as well as when large orders are placed at a time.

 Trading Range in GBP/THB

The amount of money you will win or lose in a given amount of time can be assessed using the trading range table. This is a representation of the minimum, average, and maximum pip movement in a currency pair.

Procedure to assess Pip Ranges

  1. Add the ATR indicator to your chart
  2. Set the period to 1
  3. Add a 200-period SMA to this indicator
  4. Shrink the chart so you can assess a large time period
  5. Select your desired timeframe
  6. Measure the floor level and set this value as the min
  7. Measure the level of the 200-period SMA and set this as the average
  8. Measure the peak levels and set this as Max.

GBP/THB Cost as a Percent of the Trading Range

The cost of trade varies based on the volatility of the market. This is because the total cost involves slippage and spreads apart from the trading fee. Below is the representation of the cost variation in terms of percentages. The comprehension of it is discussed in the next sections.

ECN Model Account

Spread = 28 | Slippage = 3 |Trading fee = 5

Total cost = Slippage + Spread + Trading Fee = 3 + 28 + 5 = 36

STP Model Account

Spread = 31 | Slippage = 3 | Trading fee = 0

Total cost = Slippage + Spread + Trading Fee = 3 + 31 + 0 = 34

Trading the GBP/THB

The GBPTHB is an exotic-cross currency pair and is a normal ranging market. For instance, the average pip movement on the 1H timeframe is only 82 pips. Note that the higher the volatility, the lower is the cost of the trade. However, this is not an advantage as it is risky to trade highly volatile markets.

Also, the larger/smaller the percentages, the higher/lower are the costs on the trade. So, we can infer that the prices are higher for low volatile markets and high for highly volatile markets.

To reduce your risk, it is recommended to trade when the volatility is around the minimum values. The volatility here is low, and the costs are a little high compared to the average and the maximum values. But, if you’re priority is towards reducing costs, you may trade when the volatility of the market is around the maximum values.

Categories
Forex Assets

Trading The GBP/SGD Exotic Currency Pair

Introduction To GBP & SGD Pairs

GBP

Great Britain Pound is also known in some contexts as the pound or sterling. It is the official currency of the United Kingdom and many British overseas territories. It is subdivided into 100 pence. The Pound Sterling is the oldest currency in continuous use, and also the fourth most-traded currency in the Forex market, after the United States dollar, the euro, and the Japanese yen.

SGD

The Singapore dollar is Singapore’s official currency, and it is divided into 100 cents. This currency is the thirteenth most traded currency in the world by value.

GBPSGD is the abbreviation for the Pound sterling against the Singapore Dollar. It is classified as an exotic-cross currency pair. In this currency pair, the GBP is the base currency, and the SGD is the quote currency.

Understanding GBP/SGD

In Forex, in order to find out the relative value of one currency, we need another currency to compare. It shows how much the GBP (the base currency) is worth as measured against the SGD (quote currency). It can simply be understood as 1GBP is equal to how much SGD. So if the exchange rate for the pair GBPSGD is 1.6894. It means that one GBP costs 1.6894 SGD.

Spread

The spread is the difference between the Bid (Sell) price and the Ask (Buy) price of an asset. The spread is how brokers make their money. Some broker Instead of charging a fee for performing a trade, the cost is built as a difference between the buy and sell prices of the currency pair.

ECN: 15 pips | STP: 19 pips

Fees

A Fee is simply the commission we pay to the broker on each position we open. There is no fee on STP account models, but a few pips on ECN accounts.

Slippage

Slippage is the difference between the price at which the trader wants to execute the trade and the price at which the trade is effectively executed. Slippage can occur at any time but is mostly happens when the market is very Volatile.

Trading Range in GBP/SGD

The amount of money we will win or lose in a given amount of time can be assessed using the trading range table. This is a representation of the minimum, average, and maximum pip movement in a currency pair.

Procedure to assess Pip Ranges

  1. Add the ATR indicator to your chart
  2. Set the period to 1
  3. Add a 200-period SMA to this indicator
  4. Shrink the chart so you can assess a large time period
  5. Select your desired timeframe
  6. Measure the floor level and set this value as the min
  7. Measure the level of the 200-period SMA and set this as the average
  8. Measure the peak levels and set this as Max.

GBP/SGD Cost as a Percent of the Trading Range

The cost of trade varies based on the volatility of the market. This is because the total cost involves slippage and spreads apart from the trading fee. Below is the representation of the cost variation in terms of percentages. The comprehension of it is discussed in the coming sections.

ECN Model Account

Spread = 15 | Slippage = 3 | Trading fee = 5

Total cost = Slippage + Spread + Trading Fee = 3 + 15 + 5 = 23

STP Model Account

Spread = 19 | Slippage = 3 | Trading fee = 0

Total cost = Slippage + Spread + Trading Fee = 3 + 19 + 0 = 22

Trading the GBP/SGD currency pair

The GBPSGD is an exotic-cross currency pair and is a normal ranging market. For instance, the average pip movement on the 1H timeframe is only 62 pips. Note that the higher the volatility, the lower is the cost of the trade. However, this is not an advantage as it is risky to trade highly volatile markets.

Also, the larger/smaller the percentages, the higher/lower are the costs on the trade. So, we can infer that the costs are higher for low volatile markets and high for highly volatile markets.

To reduce the risk, it is recommended to trade when the volatility is around the minimum values. The volatility here is low, and the costs are a little high compared to the average and the maximum values. But, if you’re priority is towards reducing costs, you may trade when the volatility of the market is around the maximum values.

Also, we can take advantage of the Limit orders to reduce costs. When orders are executed as market orders, the risk of slippage always persists. But, with the help of limit orders, we can completely avoid slippage, thereby reducing the overall trading cost. When slippage is Zero, only trading fees and the spread will be taken into consideration to calculate the total costs. Hence, it brings down the cost significantly.

Categories
Forex Daily Topic

Soros – The Greatest Trade Ever Made

This is the account of the greatest trade, possibly driven by a masterful fundamental analysis and the power and skills to accomplish it. It was the hard fight of The Quantum Hedge Fund, owned and operated by George Soros, against the Bank of England.

The Underlying Theme

In the late seventies and the eighties, the interest rates were extremely high in Europe due to inflation. I remember my first mortgage had a 13 percent fixed interest during the first year, but it jumped up to 21 percent in the subsequent years. I was basically working for the food and the bank.

In 1979, there was a Franco-German initiative to create a European Monetary System (EMS) to stabilize the exchange rates and reduce inflation, thus, preparing the EU countries for monetary integration. One of the components of the EMS was the Exchange Rate Mechanism (ERM). The ERM obliged the participants to maintain their currencies within ±2.25 percent band of a basket of currencies called the European Currency Unit (ECU).

Initially, the UK was not participating in the EMS. Still, it decided to join in 1990 at a rate of 2.95 Deutsche Marks to the Pound with a fluctuation band of ±6 percent, as the ERM was very successful in taming inflation in all European countries.This stability began to fail following the German reunification that precisely started in 1990.

In the subsequent years, the German government spending sharply increased and forced the Bundesbank to print new Deutsche Marks, which created inflation, and, as a consequence, the Bundesbank raised interest rates. That created a side effect in the form of increased demand for DM from investors, raising the price of this currency. Thus, the rest of the EMS member countries were forced to raise their interest rates to keep their currencies within their pegged agreed band.

At that time, the United Kingdom’s economy was weak, and unemployment was quite high. It would not be advisable under these circumstances to raise interest rates. Thus, it would not be easy for the British government to keep the pegged monetary policy for long, and Soros knew it.

The Trade

Soros, running the Quantum Hedge Fund, bet essentially that the Pound would necessarily depreciate against the Deutsche Mark because the UK would need to devaluate the Pound or leave the Exchange Rate Mechanism (ERM). Thus, in June 1992, Soros made a long position in the Pound and a long position in the Deutsche Mark by borrowing pounds and investing in mark-related instruments. He also established positions in options and futures. His bet totaled over $10 billion. He was not the only one. It was said they were organized as a team, so the combined positions created massive downward pressure on the Pound.

The Bank of England tried to hold the pegged rates at the cost of buying 15 billion pounds with its reserves, but that was at the expense of less “fuel” for the real economy. Even the effectiveness of that measure was limited, as the Pound kept trading very close to the lower band limit.

Then, on September 16, 1992, the BoE announced a 2 percent interest rate increase, from 10 percent to 12 percent, attempting to boost the currency. And the next day, BoE Governor promised to raise them again to 15 percent. That was aimed at forcing short-positioned investors to close their trades and free the Pound from their claws, but that was not enough, and traders kept selling the Pound, while the BoE kept buying it.

Finally, at 7:00 p.m. of September 17, Chancellor Norman Lamont announced The UK would leave the ERM, and the rated would be back to 10 percent. That day, also known as “Black Wednesday,” saw the beginning of a severe depreciation of the British Pound over the next three weeks – 14% against the Deutsche Mark and 24% against the Dollar.

Fig 1 – The GBP/DEM Exchange rate  (source: here)

The Aftermath

The quantum Fund cashed in over two billion dollars by selling the Mark-related assets and closing its positions in the Pound. Soros became known as “the man who broke the Bank of England.” During that combined attack, the Bank of England spent 50 billion dollars defending the currency rate.

The success of this trade against the Pound gave fuel to the Quantum Fund and friends to attack other euro currencies. One by one, the Lira, the Spanish Peseta, fell under the attack of this trading group. After the Peseta dropped by 30 percent against the Dollar, also leaving the ERM, The German Bundesbank had to cut its interest rates to help stabilize the European currency markets.


—-
Taken from Day Trading and Swing Trading the Currency Market, Kathy Lien and some facts from old news articles.

Categories
Forex Assets

Information About The GBP/JPY Forex Currency Pair

Introduction

The Great Britain pound versus the Japanese yen is a cross-currency pair in the forex market. It is a widely traded pair with great liquidity and volatility. In this currency pair, GBP is the base currency, and JPY is the quote currency.

Understanding GBP/JPY

The market price of GBPJPY shows the units of yens required to purchase one pound. It is quoted as 1 GBP per X JPY. For example, if the value of GBPJPY is 143.82, then 143.82 yen are to be produced by the trader to buy one pound.

GBP/JPY Specification

Spread

Spread is the difference between the bid price and the ask price set by the broker. These prices vary from broker to broker and type of account model as well. The approximate spread on ECN and SPT accounts is mentioned as follows.

ECN: 0.7 | STP: 1.6

Fees

There is a fixed round-trip fee on every trade a trader takes. On ECN accounts, the spread is around 6 to 10 pips. And on STP accounts, there is no fee as such. However, though there is no fee on STP accounts, the total fee is still compensated with the high spread on it.

Slippage

Slippage is another parameter that adds up to the total fee. It is the difference between price executed by the trader and price he actually received from the broker. This happens solely due to the change in volatility of the market and the broker’s execution speed.

Trading Range in GBP/JPY

The trading range is a pip depiction tool that determines the minimum, average, and maximum pip movement in a different timeframe. This volatility table is pretty useful in analyzing the amount of risk that is involved in a trade. For example, if the max pip movement on the 4H is 60 pips, then a trader can get an idea that he can gain/lose a max of $552.6 in a time frame of 4 hours.

Procedure to assess Pip Ranges

  1. Add the ATR indicator to your chart
  2. Set the period to 1
  3. Add a 200-period SMA to this indicator
  4. Shrink the chart so you can assess a large time period
  5. Select your desired timeframe
  6. Measure the floor level and set this value as the min
  7. Measure the level of the 200-period SMA and set this as the average
  8. Measure the peak levels and set this as Max.

GBP/JPY Cost as a Percent of the Trading Range

The cost as a percent of the trading range is again the volatility but combined with total cost on a trade. It is a tabular representation of the cost of trading in varying timeframes and volatilities. The percentages are obtained simply by finding the ratio between the total cost and volatility.

ECN Model Account

Spread = 0.7 | Slippage = 2 |Trading fee = 1

Total cost = Slippage + Spread + Trading Fee = 2 + 0.7 + 1 = 3.7

STP Model Account

Spread = 1.6 | Slippage = 2 | Trading fee = 0

Total cost = Slippage + Spread + Trading Fee = 2 + 1.6 + 0 = 3.6

The Ideal way to trade the GBP/JPY

The magnitude of the percentages basically determines how high or how low the costs are for each trade. If the percentage is high, the costs are high. If they are low, the costs are low. The very first observation that can be made is that the costs are high in the min column comparative to the average column and maximum column. Hence, the costs are high for low volatile markets, and low for high volatile markets. But, it is not ideal to trade in either of these markets. The best time to get into the pair is when the volatility is around the average values. As far as the timeframes are concerned, the cost decreases as the width of the timeframe increases.

Placing limit orders is another way to minimize your cost significantly. Because this will not take slippage into consideration for calculating the total costs. Thus, the total cost reduces greatly. An example of the same is illustrated below.

Hence, we can see that the percentages have reduced by around 50% or so.

Categories
Forex Assets

Everything You Should Know About GBP/NZD Forex Pair

Introduction

GBPNZD is the abbreviation for the Great Britain pound against the New Zealand dollar. Here, the pound is the base currency, while the New Zealand dollar is the quote currency. Though it is not a major currency, it has considerable volatility and liquidity.

Understanding GBP/NZD

The value of GBPNZD represents the value of NZD equivalent to one pound. It is quoted as 1 GBP per X NZD. For example, if the value of GBPNZD is at 1.9677, then to buy one pound, the trader has to pay 1.9677 NZ dollars for it.

GBP/NZD Specification

Spread

Spread is the medium through which brokers generate revenue. They set two different prices for buying and selling a currency pair. The difference between the prices is their profit. This difference is referred to as the spread. The prices usually vary from type of account model.

ECN: 1.2 | STP: 2.1

Fees

The fee is basically the commission on each trade a trader must pay. Typically, there is no fee on STP accounts, but a small fee on ECN accounts. The fee is usually between 6 and 10 pips.

Slippage

Slippage takes place when positions are opened/closed using market orders. The trader wishes to pay a specific price, but in reality, he receives a different price. And the difference between these two prices is called slippage.

Trading Range in GBP/NZD

The trading range is the depiction of the pip movement of a currency pair on different timeframes. With it, one can analyze how many dollars they can win/lose in a given timeframe. For example, if the average pip movement on the 1H timeframe is 30 pips, then you will either be in a profit of $198.6 or a loss of $198.6 in an hour. Knowing this, a trader can plan their lot sizes accordingly.

Procedure to assess Pip Ranges

  1. Add the ATR indicator to your chart
  2. Set the period to 1
  3. Add a 200-period SMA to this indicator
  4. Shrink the chart so you can assess a large time period
  5. Select your desired timeframe
  6. Measure the floor level and set this value as the min
  7. Measure the level of the 200-period SMA and set this as the average
  8. Measure the peak levels and set this as Max.

GBP/NZD Cost as a Percent of the Trading Range

Having knowledge of the cost of the trade is necessary. Note that the cost varies based on the volatility and the timeframe traded. So, it becomes vital to know when the right moments to enter the market are. Below are two tables illustrating the total costs as a percentage for varying timeframes and volatility.

ECN Model Account

Spread = 1.2 | Slippage = 2 |Trading fee = 1

Total cost = Slippage + Spread + Trading Fee = 2 + 1.2 + 1 = 4.2

STP Model Account

Spread = 2.1 | Slippage = 2 | Trading fee = 0

Total cost = Slippage + Spread + Trading Fee = 2 + 2.1 + 0 = 4.1

The Ideal way to trade the GBP/NZD

The above tables show that the costs are high in the min column and low in the max column. The higher the value of the percentage, the high is the cost. So, this means that the costs are high for low volatility markets and vice versa. It is neither ideal to trade during low volatility nor during high volatility. To have an equilibrium between the costs and the volatility, it is best to enter the market when the volatility is around the average mark.

Slippage is a parameter for calculating the total cost. It has a great weight in the total cost. However, there is a way to minimize and nullify it. This can be simply be done by trading using limit orders instead of market orders.

Categories
Forex Assets

What Should You Know Before Trading The GBP/CHF Currency Pair?

Introduction

GBPCHF is the abbreviation for the Great Britain pound and the Swiss franc. Since USD is not involved in this pair, it is called a minor currency pair. However, there is an excellent liquidity and volatility in this pair. In this pair, GBP is the base currency, and CHF is the quote currency. GBPCHF is often referred to as “pound Swiss franc.”

Understanding GBP/CHF

The value of GBPCHF determines the Swiss francs required to purchase one pound. It is quoted as 1 GBP per X CHF. For example, if the value of GBPCHF is 1.2740, then one needs to pay 1.2740 Swiss francs to buy a pound.

GBP/CHF Specification

Spread

Spread is the difference between the bid price and the ask price in the market. The bid price is the price used for shorting, and the bid price is the price used for buying a currency pair. These prices differ from broker to broker as well as the account type.

ECN: 0.8 | STP: 1.6

Fees

For every trade a trader takes, there is a fee associated with it. This fee is basically the commission charged by the broker. This fee varies from broker to broker. Note that there is no fee on STP accounts, and on ECN accounts, the fee is around 6 to10 pips.

Slippage

Slippage in trading is the difference between the price requested by the trader and the price given by the broker. Due to variation in volatility and the broker’s execution speed, it is not quite possible to get the exact intended price. Slippage happens only on market orders.

Trading Range in GBP/CHF

Knowing the number of pips the currency pair moved in a given timeframe is a good add-on to a trader’s analysis. This will help them get an idea of the profit/loss that can be made in a specified amount of time. For example, if the average pip movement on the 1D timeframe is 50 pips, then a trader can expect to gain or lose $517.5 (50 pips x 10.35 value per pip).

Procedure to assess Pip Ranges

  1. Add the ATR indicator to your chart
  2. Set the period to 1
  3. Add a 200-period SMA to this indicator
  4. Shrink the chart so you can determine an extensive period
  5. Select your desired timeframe
  6. Measure the floor level and set this value as the min
  7. Measure the level of the 200-period SMA and set this as the average
  8. Measure the peak levels and set this as Max.

GBP/CHF Cost as a Percent of the Trading Range

The cost as a percent of the trading range depicts the magnitude of the variation in the cost in different timeframes for different variable volatility. The percentages are useful in determining the ideal time to enter into this currency pair with marginal costs. Below are the tables representing the cost percentages for minimum, average, and maximum volatility.

ECN Model Account 

Spread = 0.8 | Slippage = 2 |Trading fee = 1

Total cost = Slippage + Spread + Trading Fee = 2 + 0.8 + 1 = 3.8

STP Model Account

Spread = 1.6 | Slippage = 2 | Trading fee = 0

Total cost = Slippage + Spread + Trading Fee = 2 + 1.6 + 0 = 3.6

The Ideal way to trade the GBP/CHF

The lower the percentage, the lower are cost on the trade. In the table, we can infer that the costs are on the lower side in the max column. This implies that the cost of the trade is less when the volatility of the market is low and vice versa. Now, when it comes to the best time to trade this pair, it is ideal to pick at times when the volatility is decent, and the costs are affordable. For example, a 1D trader may trade during those times when the volatility is around 100 pips.

Moreover, the total cost of the trade can be reduced by entering and exiting trades using limit/pending orders. This way, the slippage on the trade will be fully cut off. The impact on the cost percentage when slippage is made 0 is shown below.

Total cost = Spread + trading fee + slippage = 0.8 +1 + 0 = 1.8

From the above table, it is evident that the costs have reduced by over 50% or so. Hence, it is preferable to trade using limit orders rather than market orders.

Categories
Forex Assets

Everything You Should Know To Trade The GBP/USD Forex Pair

Introduction

Currency pairs are classified as major, minor, exotic, etc. Major currencies pairs are those pairs that involve the US dollar as one of the currencies. These currencies typically have high liquidity and volatility. GBPUSD is one such example. It is the currency pair where Great Britain Pound is traded against the US dollar.

In this article, we shall be covering all the basic fundamentals which are essential to know before trading this pair. And before getting into the specifications of this pair, let us first understand what actually the price of GBPUSD signifies.

In GBPUSD, GBP is the base currency, and USD is the quote currency. The value (price) of the pair determines the units of USD required to purchase one unit of GBP. For example, if the current value of GBPUSD is 1.3100, then the trader must possess the US $1.3100 to buy 1 Pound.

GBP/USD Specification

Spread

Spread is simply the difference between the bid price and the ask price. The spread depends on the type of account.

Spread on ECN: 0.7

Spread on STP: 1.3

Fees

Again, the fee depends on the type of account. Typically, there is no fee charged by STP accounts. There is a trading fee on ECN account, which depends from broker to broker.

Slippage

Forex is very liquid and volatile. Hence, this causes slippage. Slippage is the difference between the price requested by the trader and the actual price the trader received. And this depends on the broker’s execution speed and volatility of the market. The slippage in major currency pairs is usually within 0.5 and 5 pips.

Trading Range in GBPUSD

As a trader, it is vital to know the number of pips a currency pair moves in a period of time. This is basically the volatility in the currency pair. And volatility is one of the factors which are helpful in risk management.

The volatility is measured in terms of percentage or pips. For example, if the volatility on the 1H timeframe of GBPUSD is 15 pips, then one can expect to gain or lose $150 (15 pip x $10 per pip) within a time period of few fours.

Below is a table that depicts the minimum, average, and maximum volatility (pip movement) on different timeframes.

EUR/USD PIP RANGES

Procedure to assess Pip Ranges

  1. Add the ATR indicator to your chart
  2. Set the period to 1
  3. Add a 200-period SMA to this indicator
  4. Shrink the chart so you can assess a large time period
  5. Select your desired timeframe
  6. Measure the floor level and set this value as the min
  7. Measure the level of the 200-period SMA and set this as the average
  8. Measure the peak levels and set this as Max.

(originally posted in our article here)

GBPUSD Cost as a Percent of the Trading Range

A Forex broker usually levies three type of charges for each trade. They are:

  • Slippage
  • Spread
  • Trading Fee

The sum of all the three costs will generate the total trading cost for one trade.

Total cost = Slippage + Spread + Trading Fee

Note: All costs are in terms of pips.

To bring up an application to the above volatility table, we bind these values with the total cost and find the cost variations (in terms of percentages) on different timeframes. And these percentages prove to be helpful in choosing the right timeframe with minimal costs.

ECN Model Account

Spread = 0.7 | Slippage = 2 | Trading fee = 1

Total cost = Slippage + Spread + Trading Fee = 2 + 0.7 + 1

Total cost = 3.7

STP Model Account

Spread = 1.3 | Slippage = 2 | Trading fee = 0

Total cost = Slippage + Spread + Trading Fee = 2 + 1.3 + 0

Total cost = 3.3

The Ideal Timeframe to Trade GBPUSD

Above are tables that illustrate the cost ranges in terms of percentage. Let us now comprehend the tables and figure out the ideal timeframe to trade this currency pair. From the above table, it is evident that the cost is highest (74% and 66%) in the 1H timeframe when the volatility is low. Hence, it is not ideal to pick the 1H timeframe when the volatility is around 5 pips (minimum).

On the flip side of things, the cost percentages are minimal on the 1M timeframe. Traders with a long term perspective on the market can invest with minimum costs.

Intraday traders, on the other hand, can pick the 1H, 2H, 4H, or the 1D timeframe when the volatility of the market is above average.

Another point to consider is that slippage eats up the costs significantly. So, it is recommended to plan strategies that involve placing of limit orders and not market orders.

As proof, below is a table that clearly shows the reduction in the cost percentages when the slippage is made NIL.

Total cost = Slippage + Spread + Trading fee = 0 + 0.7 + 1

Total cost = 1.7

Comparing these values to the table with slippage=2, it can be ascertained that the cost percentage has reduced by a considerable amount. Hence, all in all, it is ideal to trade by placing limit orders rather than executing at the market price.

Categories
Forex Market Analysis

The Pound Sterling in Focus This Week

The Pound Sterling in focus this week

The pound hit the buffers at the 1.3440 today, just prior to the manufacturing data release which was a miss for April (the second consecutive monthly miss). With manufacturing being the third largest economic sector it can cause an impact on the overall expectations for GDP growth.

The UK’s goods trade balance widened faster than was expected too, and with the construction sector coming up short on data expectations, it was no wonder the Pound spiked lower to 1.3348 on the release before settling around the 1.3365 level at the time of writing.

But the real jitters are due to a host of further data releases coming later in the week, including key employment data, inflation related data, RPI and PPI and retail sales. Plus the UK Prime Minister Theresa May faces a series of votes in the House of Commons on the 12th June on whether to approve 15 Brexit amendments inserted into the EU Withdrawal Bill. If the Government loses one of the key votes it could pave the way for parliament to have a ‘meaningful’ say in the final Brexit deal, and thus potentially leading to a ‘soft’ Brexit.

Plus of course, we have the Fed interest rate decision to look forward to on Wednesday.

Therefore, I would expect many GBP institutional traders to be sitting on the sidelines this week.

Categories
Forex Market Analysis

U.S. Core PPI (YoY) reaching its highest level since 2012

Hot Topics:

  • S. Core PPI (YoY) reaches the highest level since 2012.
  • Volatility moves towards Europe.
  • The pound rally continues due to the weakness of the dollar.
  • Jinping reduces risks of a Trade War.
  • Oil Brent reaches the highest level since 2014.

U.S. Core PPI (YoY) reaches its highest level since 2012.

Signs of strength in the United States economic growth continue showing up. The Underlying Producer Price Index (YoY) reached 2.7% growth in March, the highest level since June 2012. The Core PPI (MoM) index, on the other hand, went up 0.3% fulfilling analysts expectations who projected 0.2%. According to the Bureau of Labor Statistics, 70% of the increase in final demand is attributed to a rise of 0.3% in the prices of final demand services, in the same way, transport and storage services for final demand increased by 0.6 %. The producers’ inflation rise is expected to have an impact on the Consumer Price Index, which will be published this Thursday.

Despite these positive macroeconomic data, the greenback index continues its strong depreciation, losing 2.83% for the year. Today the greenback is closing with a loss of -0.25%. We are paying attention to the zone between 89.15% and 61.8%  Fibonacci retracements, where the Index has found support.

Volatility moves towards Europe.

The risks of a Trade War between the United States and China are disappearing more and more, with the bilateral attempts to resolve the conflict in a friendly way. However, in Europe, the scenario that seemed full of geopolitical stability is changing. This Sunday 08th, Viktor Orban won the elections in Hungary for the fourth time in a row. With an utterly autocratic speech, the nationalist Prime Minister proposes an anti-immigrant policy and open attacks towards the European Union. Hungary refuses to comply with the agreed European migration policy, that is, to accept Syrian refugees quotas in the same way the United Kingdom did as one of its arguments for Brexit. It should be added that Mr. Orban is not alone in this political tendency; he has found allies in power in Poland, the Czech Republic, Slovakia, and Italy. All of them are willing to reject the obligation to accept refugees and respect the right of free movement.

The euro has closed with gains for the third consecutive session with an advance of 0.29%. The pair shows a bullish move in the middle of a sideways formation. In the last trading session, the price has found resistance at 61.8% of Fibonacci retracement.

The pound rally continues due to the weakness of the dollar.

The pound continues for its third consecutive session in a bullish rally advancing 0.64% for the week and gaining 0.35% in the last trading session. All this occurs in a context of a weakness of the dollar, despite the excellent macroeconomic data of the United States. The level of support to be checked is 1.4145; the key resistance level is 1.42 as a psychological level.

Jinping reduces risks of a Trade War.

Chinese President Xi Jinping has promised to reduce import tariffs by alleviating the fear generated by the escalation of bilateral tensions between the United States and China. In a speech held at the Boao Forum, President Jinping promised to open further the Chinese economy and protect the intellectual property of foreign companies. These words filled the market with optimism, leading the indexes to move positively, the Dow Jones Index advanced 1.48%, while the yen reduced its attractiveness as a refuge, leading the USD-JPY to close with 0.41% of earnings.

The USD-JPY pair is forming an ascending diagonal pattern, which still has space to rally. Its closest resistance levels are 107.49 and 108, and the main support level to watch out is 106.64.


The Dow Jones index moves within a descending channel, its price looks to control a support level at 24,037.3 and is developing a possible upward diagonal formation whose closest resistance is at 24,630, a level that coincides with the Upper part of the bearish channel. Bullish positions are valued as long as price does not break the 23,749.3 level.


Oil Brent reaches the highest level since 2014.

The euphoria produced by the reduction of the economic tensions between the United States and China due to Jinping’s latest public speeches, not only has motivated a good mood on the indices but also on oils. The Brent Crude has reached its highest level since 2014: $ 71.03. Wes Texas Crude Oil, on the other hand, approached its two-week highs at $ 65.76. The oil rally and the Dollar weakness also benefited the USD-CAD pair (by inverse correlation), which closed at its lowest levels since February, and testing the psychological level 1.26,  approaching the 61.8% Fibonacci retracement level at 1.2583.


Our central view for this highly correlated group has been bullish; but we currently prefer to maintain a neutral position considering that once oils reach specific long-term levels on their structures, they should make a significant corrective movement that will allow us to join the trend. As long as Brent does not reach the area between $ 71.26 and $ 72.91, and Crude Oil does not come close to $ 69 and $ 70, we do not expect a significative correction to begin.

In the case of the USD-CAD pair, once it reaches the base of the channel,   we expect the beginning of a bullish move.