Introduction
USD/BND is the abbreviation for the US Dollar against the Brunei Dollar. Brunei is located on the Asian continent, and this pair is classified as an emerging currency pair. In the USD/BND, USD is the base currency, and BND is the quote currency.
Understanding USD/BND
The market price of this currency pair specifies the value of BND equivalent to one USD. It is quoted as 1 USD per X BND. For example, if the value of this pair is 1.3711, then these many units of the quote currency (BND) are required to purchase one unit of the base currency (USD).
Spread
The difference between the bid and the ask price is called the spread. The spread varies from broker to broker and also by execution model used.
ECN: 5 pips | STP: 8 pips
Fees
A fee is a synonym for commission. This is similar to the one that is paid to the stockbrokers. Below is the fee on ECN and STP brokers.
Fee on ECN – 0 pips | Fee on STP – 5-10 pips
Slippage
The difference between the price requested by you and the price you actually received from the broker is called slippage. There are two reasons for slippage to place:
- Market volatility
- Broker’s execution speed
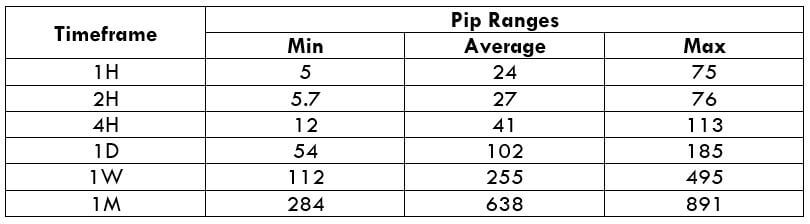
Trading Range in USD/BND
A trading range is a tabular representation of the minimum, average, and the maximum volatility of this currency pair. And these values help in determining the profit/loss of a trade in a given timeframe. Hence, this is a great risk management tool for traders.
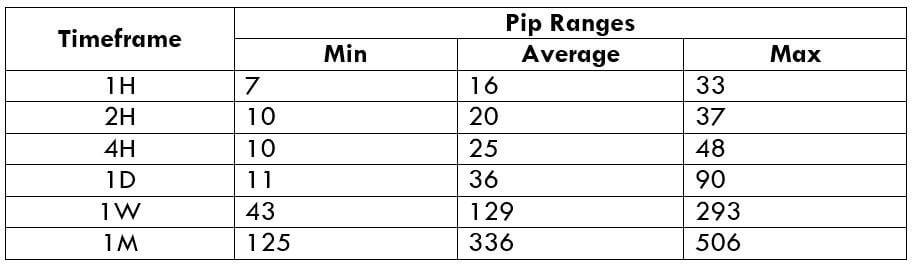
Procedure to assess Pip Ranges
- Add the ATR indicator to your chart
- Set the period to 1
- Add a 200-period SMA to this indicator
- Shrink the chart so you can assess a large time period
- Select your desired timeframe
- Measure the floor level and set this value as the min
- Measure the level of the 200-period SMA and set this as the average
- Measure the peak levels and set this as Max.
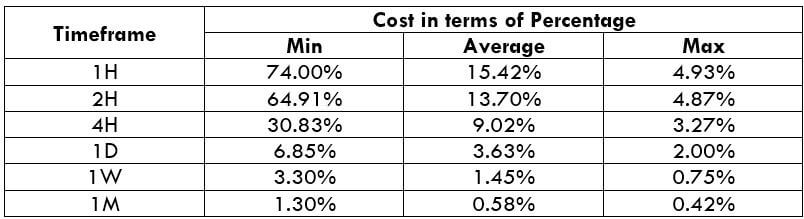
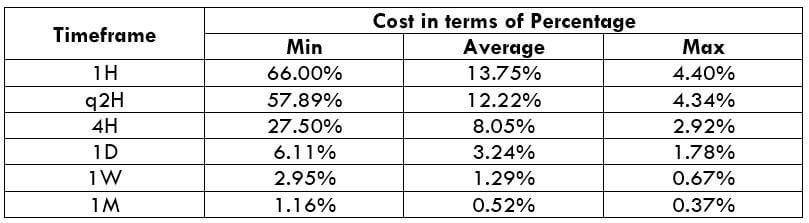
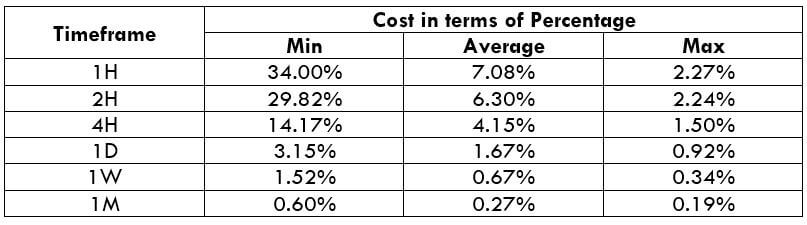
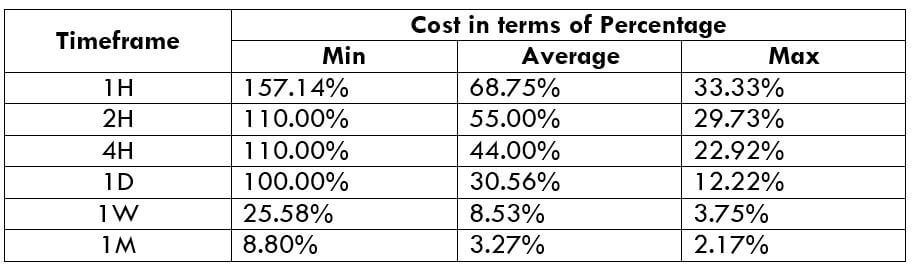
USD/BND Cost as a Percent of the Trading Range
The cost as a percent of the trading range is the representation of the cost variation in a trade for different volatilities are timeframes. This variation is represented as a percentage. The magnitude of these percentages depicts the highness and lowness of a trade.
ECN Model Account
Spread = 5 | Slippage = 3 |Trading fee = 3
Total cost = Slippage + Spread + Trading Fee = 3 + 5 + 3 = 11
STP Model Account
Spread = 8 | Slippage = 3 | Trading fee = 0
Total cost = Slippage + Spread + Trading Fee = 3 + 8 + 0 = 11
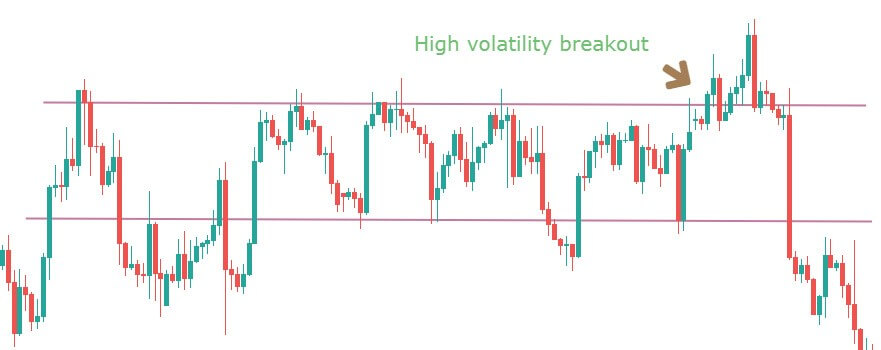
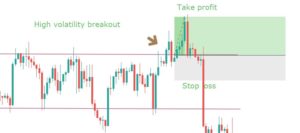
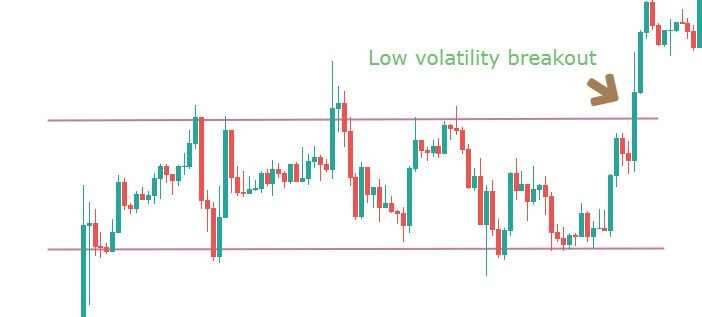
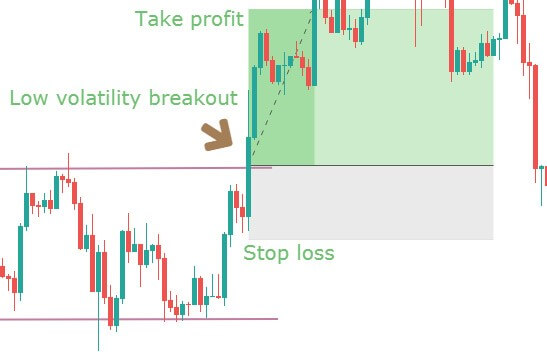
The Ideal way to trade the USD/BND
Trading the USD/BND is simple. This pair is not so volatile, like the other emerging pairs. Moreover, the spreads are low too.
From the above tables, we can see that the percentage values are pretty high in the minimum column, and comparatively lower in the max column. This means that the costs are high for low volatile markets and low for high volatile markets. So, traders who need high volatility may enjoy low costs. And trades who want to minimize their risk and trade low volatile markets will have to bear higher costs. Finally, traders who need a balance between the two may trade when the volatility of the market is around the average values. This will ensure the equilibrium between volatility and costs.
Moreover, there is a way through which you can cut off the slippage on your trade. Placing orders as limit orders instead of market orders will take away the slippage and bring down the total cost on the trade. So, in our example, the total cost would reduce by three pips.
We hope this article will change the way you trade this currency pair. Happy trading!