Categories
Forex Basic Strategies

Timing Buying Entries Using Bullish Pennants and Awesome Oscillator

In this article, we paired the Bullish Pennant trading pattern with Awesome Indicator to identify the trading signals.

BULLISH PENNANT PATTERN

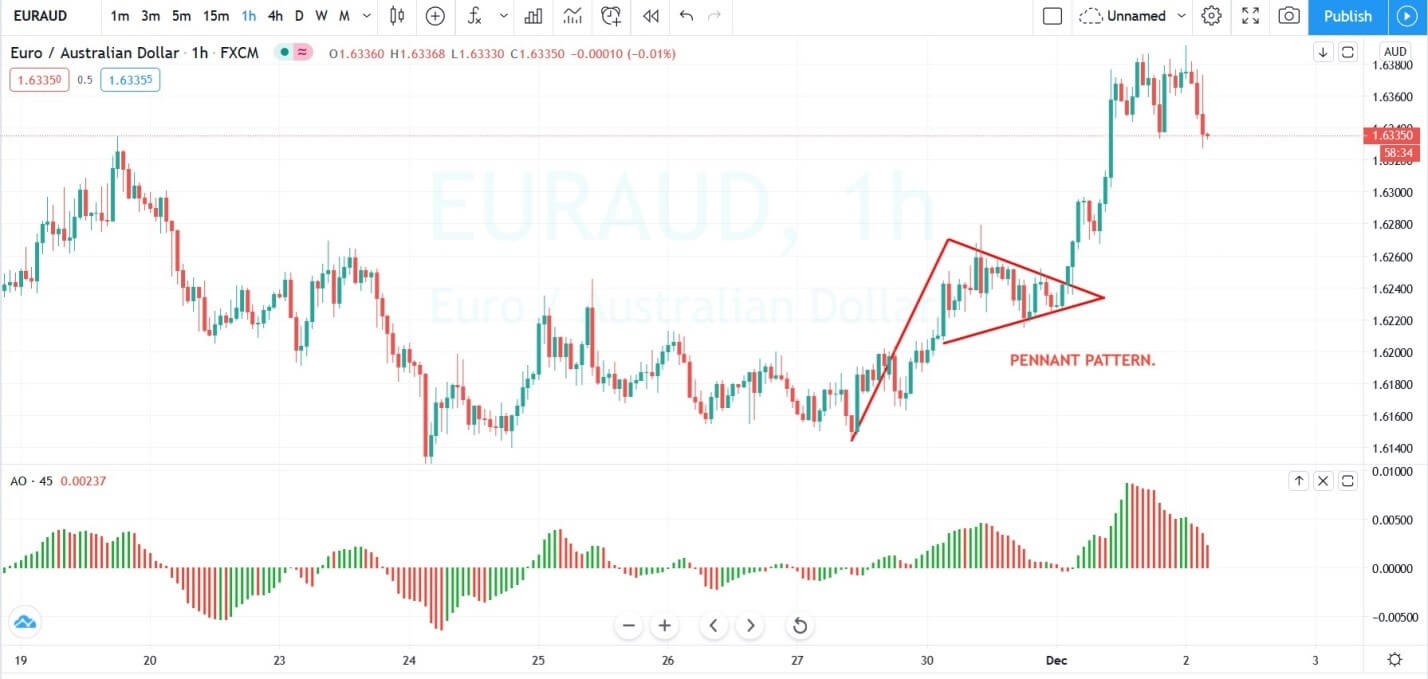
Bullish Pennant is a continuation trading pattern that appears in an ongoing uptrend which used by the traders to predict the upcoming market movements. The pattern is seen when the asset experiences large upward moves followed by a brief consolidation, before continuing to move in the direction of the ongoing trend.

Key Characteristics of the Bullish Pennant Pattern

A FLAGPOLE – The pattern always begins with a flagpole which is an indicator of a strong uptrend.

BREAKOUT LEVELS – You will witness the two breakouts level on the pattern, the first one is at the end of the flagpole and another one after the consolidation phase.

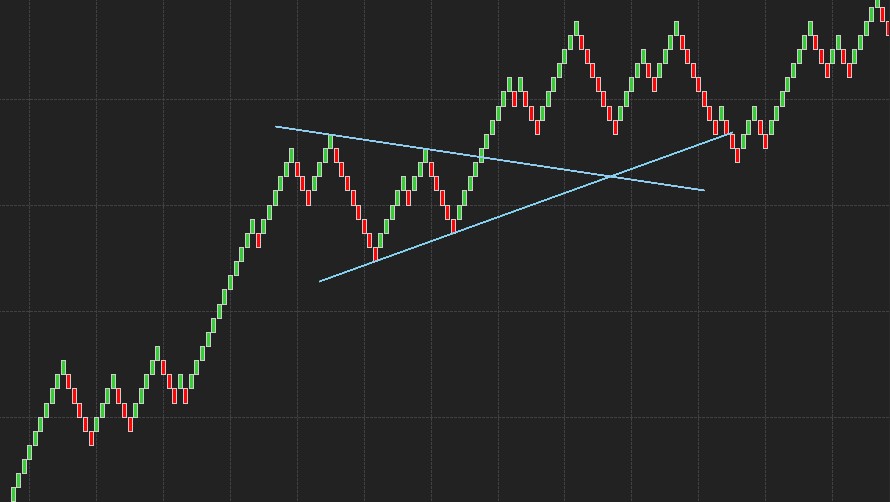
PENNANT ITSELF – It is a triangular pattern that appears when the market consolidates between the flagpole and the breakout.

THE IMAGE ABOVE REPRESENTS THE BULLISH PENNANT PATTERN

AWESOME OSCILLATOR 

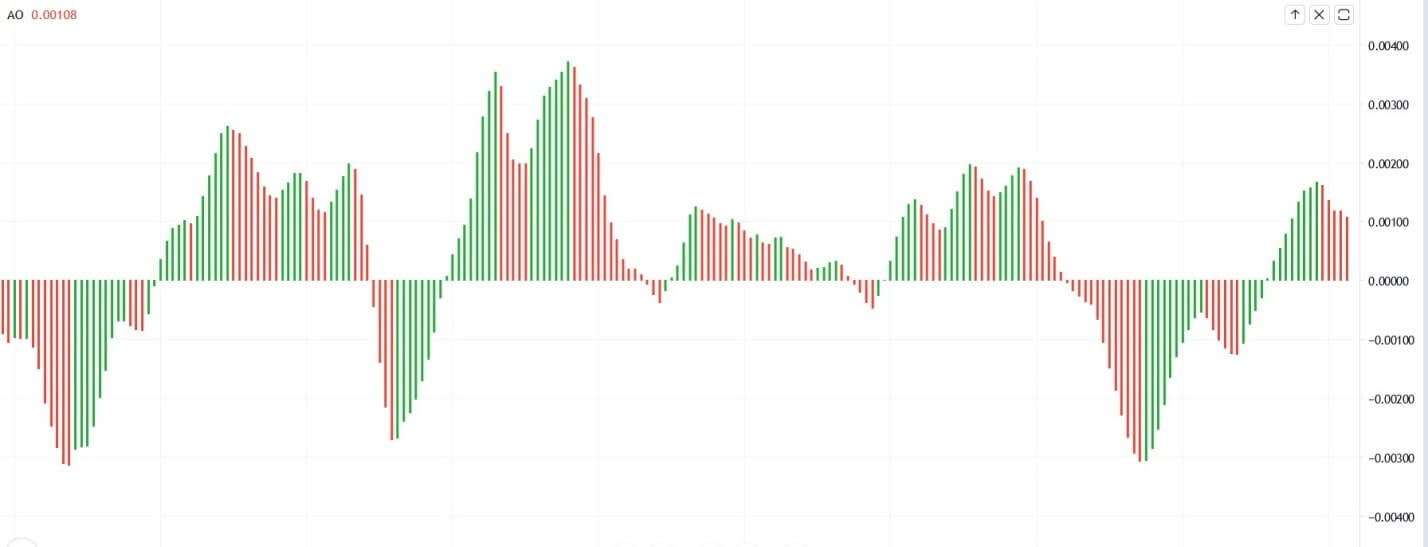
Awesome is a momentum oscillator developed by the technical analyst Bill Williams to determine whether the buyers or bears are dominating the market. The indicator is used to gauge the market momentum and to affirm the ongoing trend; also, it is used to anticipate the upcoming reversals. Depending on your charting platform, the indicator most often appears in many different formats, but the most common format is the histogram. The indicator fluctuates between the positive and negative territory; A positive reading means the faster period is greater than, the slower ones, and the negative reading the fast is less than the slow.

The image below represents the Awesome oscillator on the price chart.

TRADING STRATEGIES

The image below represents the bullish trend and pennant pattern on the AUDUSD chart. This formation appears on the sixty-minute chart, which mostly used by traders for intraday trading. The awesome oscillator was already above the zero lines, which means the buying momentum is stronger, and the breakout of the pennant pattern was a sign to go long.

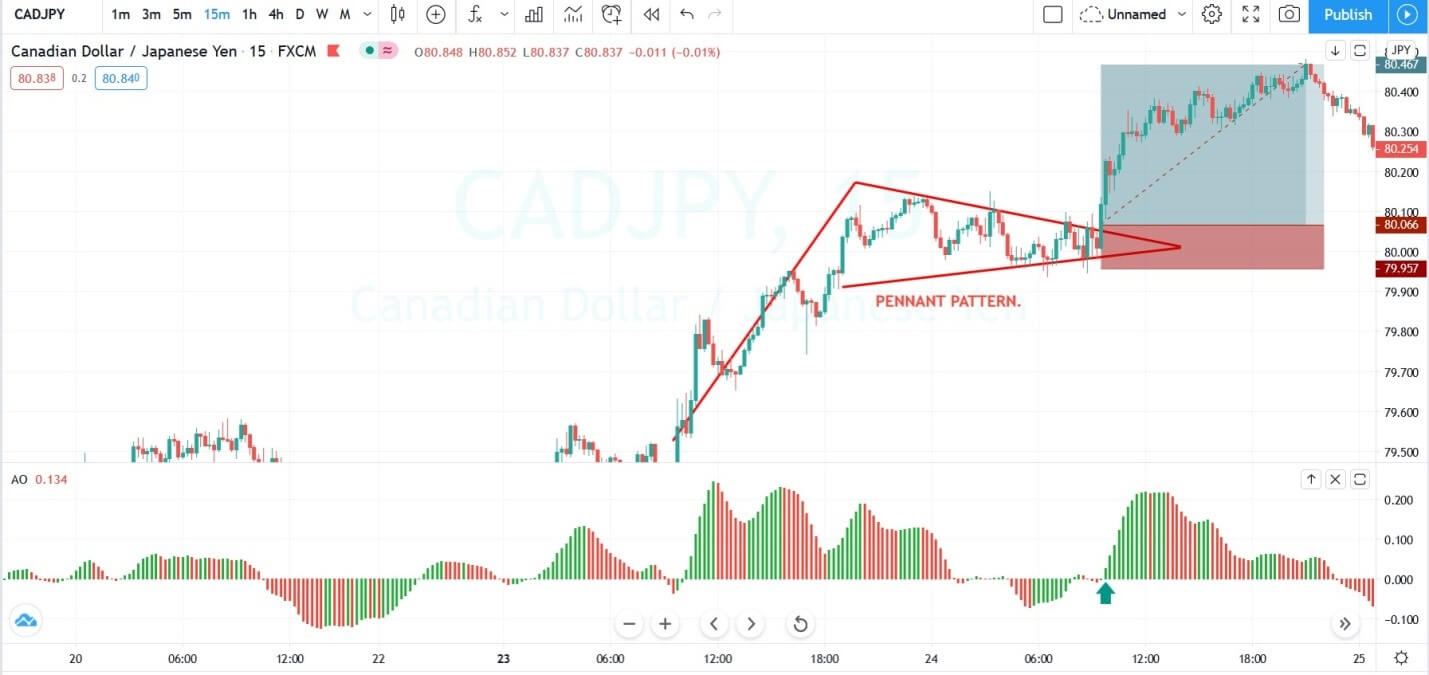
The image below represents the pennant pattern on the CADJPY 15 minute chart. This timeframe is also used by traders for intraday trading, in an ongoing uptrend the formation of Pennant and reversal of histogram lines above the zero line was an indication to go long.

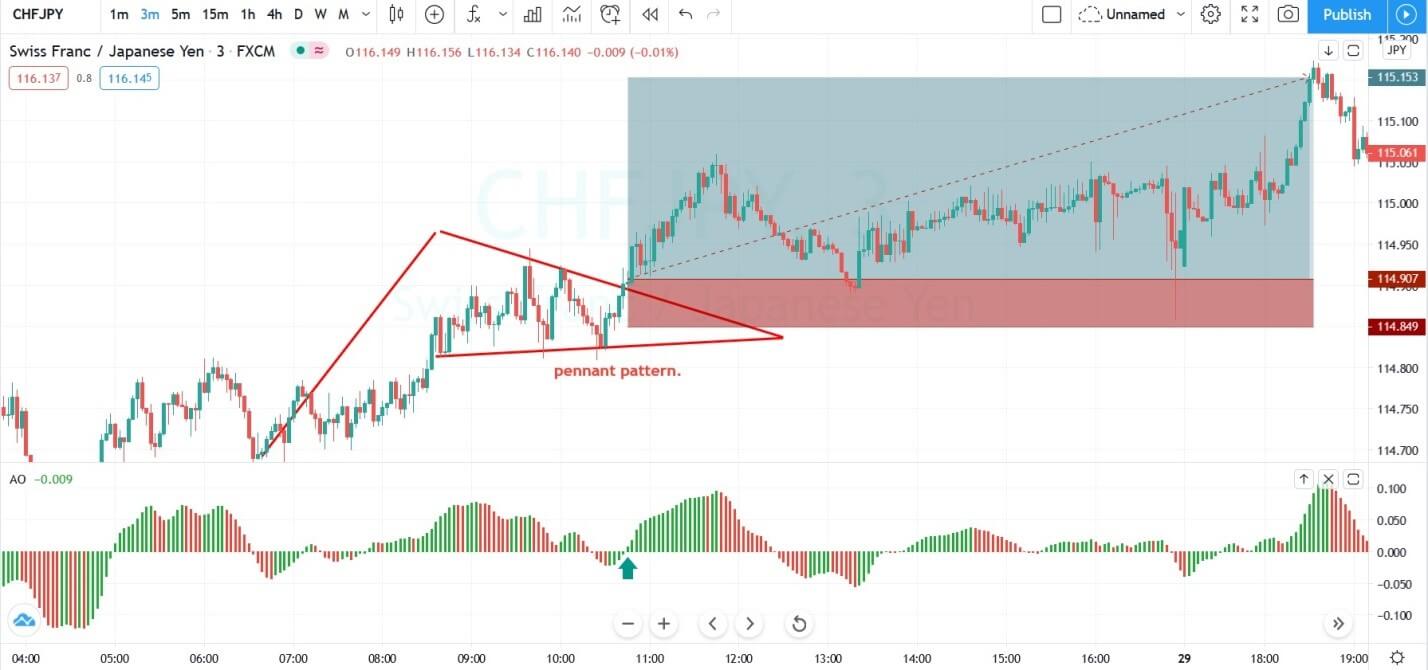
Mostly scalpers book the profits with the small price movements, but if they can use the proper trading strategies for scalping, then they can hold their trades for the longer targets. In the image below on a three-minute chart, the prices were in an uptrend, and during the pullback phase we witnessed the pennant formation, and the reversal on the Awesome oscillator confirmed that the breakout is real. Here we book the profits of around the 30 pips in this pair, by just taking the proper trades on the three-minute chart. Sometimes scalpers have no trades in the market, so in these conditions, it is always advisable to follow the proper trading strategies to milk the market.

ENTERING IN A TRADE PRIOR TO THE FORMATION OF THE PENNANT PATTERN

The image below represents the pennant pattern on the sixty-minute chart.

Here in this strategy, we are using the lower line of the pennant pattern to time the market. The lower pennant line is an ascending line, so when the price action touches that line, it never came back to the same price again. In this way, if we bought at every touch of the lower pennant line, we can easily ilk the bigger profits.

In the image below, we mark the pattern on the sixty-minute chart and choose to take the entry on the 15-minute chart. The pair was in an uptrend, and when the price approaches the lower pennant line, at that stage of the market the awesome indicator lines were also declining which is a sign of sellers are no more interested in selling, and going long will be a good idea. Keep in mind in the first trade always risk less money; this is because the sellers are still the dominating force. When the prices failed to break below the pennant line, it means buyers are there, and going big on the second trade will be beneficial. When the second time prices approached the pennant line, the awesome oscillator showing no sign of any sellers even buyers were stepping in, this was the sign for us to go long in this currency. After our entry, we choose to go for a brand new high with the stops just below the first entry.

The image below represents the pennant pattern in the EURNZD forex pair.

The image below represents the buying trade in the EURNZD pair on the daily chart. As you can the currency was in an uptrend and during the pennant formation prices dropped below the lower pennant line with the declining histogram bars. The next green candle immediately came back, which means it was a faker, and there were buyers who exists in the game. We took the entry after the fakeout and were waiting for the prices to go higher once again to take another buying trade, but the price action holds at the lower line which means the buyers were building the order. This consolidation phase at the support level and the green histogram bars on the indicator motivated us to take another long trade. The very next day price action takes off, and we witnessed the brand new higher high.

CONCLUSION

Trading the markets in today’s world is an easy game for those who properly follow the rules and master the well-proven trading strategy. The Pennant is a leading trading tool that appears on all the trading timeframe, you can use the pattern alone but if you desired good risk-to-reward ratio trades then pairing this pattern with another indicator is always beneficial. Keep in mind, the Pennant is a continuation pattern, and it only appears in an uptrend, don’t try to trade the pattern everywhere in this way you will be not able to scale your trades, Instead trade the pattern only in the trending market and when the formation appears to scale your trades every time.

Categories
Forex Assets Forex Basic Strategies Forex Trading Strategies

Trading Strategy For the CAD/JPY Currency Pair

In this article what I want to tell you is one of my strategies that is working well in real life using the CAD/JPY pair. Why this pair? I have chosen this pair as an example but will show you different trading systems using different currency pairs.

What is the Strategy Based On?

In a very simple system, you will know that my systems are characterized by that. The reason is that they tend to be the ones that last the longest and the most robust. You’d be amazed to see the simple systems that exist that have been producing good results for years and years.

First of all, what I’m going to show you next is a profitable, not perfect Forex trading system. The curves without falls or volatility are left to the martingales and gurus.

1.1 Criteria for entry

We will enter the market by purchasing in the CAD/JPY pair when there is an upward turn in the Accumulation Distribution indicator and the price opens below the simple moving average of 19 periods. We will do the opposite (we will enter shorts in CAD/JPY) when the AD spin is down and the price opens above the average. As I write this article we are short on this pair indeed.

1.2 Exit criteria

We will close the position we have taken provided one of these conditions is met:

1.2.1 Output per indicator

We leave the buying position when the Williams Percent Range indicator falls below the marked level (59, you can see in the chart above). We will also close our short position when it passes this level.

1.2.2 Exit by stop or profit

If the indicator has not already given us a sign of closure, we will do so when our operation reaches the loss limit of 60 pips (stop loss) or we have reached our profit target (take profit) of 220 pips. The interesting thing here is that a winning operation compensates us for more than three losing trades since when we achieve 220 pips we can lose three out of 60 and still not have lost money.

Statistics of the System

With the well-defined rules of our trading system, let’s see how it has behaved in recent years and what the main features are. Note that this system has not been optimized.

The stability in the balance line, as its name indicates, measures how the return curve behaves. Our goal is that it is as stable as possible and that there are no abrupt drops. The closer to 100 the better, so an 81.73 is good data. In addition, it is important to note that we have a sample of 300 trades so it is a significant sample. If I show you this strategy with 40 trades and it is winning, it can be a chance. Logic tells us that the larger the sample, the more reliable will be. Remember that we seek to minimize chance and bring statistics to our advantage.

It’s very important to know that you have up to 11 consecutive losing trades, but considering that the risk-to-profit ratio is 1:3, it is acceptable. One of my favorite parameters when choosing a trading strategy is the profit factor or profit factor. A PF above 1.5 is good. This ratio tells us how much our system earns when it pays compared to how much it loses when it loses. Simply put, our system on average earns more when it wins than it loses when it loses. And we’re very interested in this.

Another star point for me within a trading system is return/drawdown. Why? Because it is a yardstick to measure what has fallen the profit curve and that profit obtained. When you do real trading you don’t only care about the return, but you care about how to get that return and try to minimize these drops. A ratio of 7.48 is more than okay.

What Can We Expect from this Strategy?

Let’s see how this strategy behaves by comparing buying and short transactions. Not bad. Both when the CAD/JPY pair has maintained a trend and when the pair has steered without a clear direction the lengths and the shorts have remained stable. Now we see those falls as they are. There are no peaks too strong and they are also kept under control.

Is It a Forever Strategy?

This strategy is not the only strategy I apply and it will not last forever. It is a strategy of a portfolio of systems that I apply in an automated way in Forex. It is a portfolio that rotates with rules of connection and disconnection of systems depending on their behavior.

You must understand that there are trading systems whose statistical advantage disappears and that you must therefore stop trading. This is nothing else that stops being profitable because a certain pattern is no longer profitable. This happens on a day-to-day basis with some businesses, with trading also happening, for example, when a large number of traders exploit a method. The advantage disappears, therefore.

Instead of applying or learning the foolproof method of trading on Forex or any other asset, learn to measure what you are going to apply before, during, and after. If you can measure, you can improve, but above all, you can make informed decisions.

Is This the Best Strategy Ever?

The goal of this article is not to remove the arsenal. But it is a system that I have been applying in real life with good results. The important thing is that you understand that a simple strategy can work very well over time, that you need data to evaluate it and criteria to manage it. And that this is all just a work plan.

Categories
Beginners Forex Education Forex Basic Strategies

Forex Strategy: A Simple Definition

We can debate how to define a forex trading strategy but in the end, is it really important? We believe it is more important what elements are crucial and how to use them so you know you have a strategy. It is needless to say that without one you are blind and not make very far in forex trading. 

The Definition

We can find many definitions online but here is one that is simple but covers what is important: A strategy is a set of skills, tools, and information that consistently generate profitable trading decisions. We emphasize the word – consistently, so only when you have something that works over a long time you know that strategy has a meaning. It does not mean every trade or month has to be a winner, professionals usually take several positive months to conclude their trading strategy is consistent. The goal is to have profited from trading, however, we would not plan to gain percentages as goals right away simply because pursuing them might set beginner traders to think about winning only, whereas the true effect on the bottom line is about eliminating losers. Here is how to know you are on the right track to having a good strategy.

The Skill Element

Before all else, you need to be true about it. Follow your plans or everything you designed goes to waste. Your mindset has to be right to pursue any strategy or you are just playing games with yourself. Now, some traders do not rely on tools such as indicators, but they look at the charts at different timeframes and look at how the price is moving. Patterns, volume, and other aspects of the market are considered but they also consider what is going on with other markets, currencies, and any information that moves the upside/downside scale in their heads. This is the skill element of the strategy, and it takes a while to learn fundamental analysis and chart reading. Of course, there are other ways to trade where other skills are developed and could be used in a strategy. 

The Tools Element

One example is the use of indicators and rules for them. Technical traders do not want to rely much on their subjective analysis of the charts or events that drive the markets. They may have an opinion or predictions but they do not trade until their indicators confirm it. Even if they think otherwise, they listen to their tools. Their skill is to be able to create a setup of different indicators that jointly create consistently good decisions. This skill to combine the right tools also requires a lot of work. 

Technical traders are focused on indicators research and how they can make for a better overall performance with the others. They understand probabilities, statistics, and gauge what tools could mitigate losses. Also, when it is better to create a rule, like closing all trades on Fridays, they implement them into the strategy mix. Technical traders even use indicators for their money management if needed. It could be said that Price Action traders rely on fuzzy values while technical traders prefer precise points where they put Take Profit and Stop Loss orders, for example. 

The Consistency Element

Consistency is probably the hardest strategy element to achieve. You can have a strategy with inconsistent results but we regard that as an inconclusive trading solution. It is not a strategy that works in the long term. A car that does not move is not really a car, just a pile of materials. 

No strategy works every time on every market. And that is why traders spot the best market behavior for their strategies or develop different strategies for different market conditions. They look for ways to attain consistency with their strategies since they make losses in certain situations. That can only be avoided if they wait for a new period of right market conditions. Traders then implement rules to their strategies. The right market conditions have to be spotted. Technical traders have tools or indicators for that while plain chart readers just observe the candles. Forex trading is directional trading so traders of both kinds often look at the volatility and volume. They make rules based on these measurements and pick only volume/volatility levels where their strategies work best. That is why forex, precious metals, stocks, commodity traders have different strategies. 

It is not rare to see mixed strategies, technical indicators with fundamental analysis. These traders take into account more data but often they come up with conflicting signals and therefore need more time for a good setup. Does it mean it is better to mix different analyses to attain consistency? Not really, you can see pure PA or indicator traders that perform exceptionally well. 

Consistency can be achieved with a certain strategy, but as said in the beginning, a trader has to be consistent first. This side of trading is not in focus by beginners because working on the psychological part is not fun and you will not see it by reading strategy definitions. Therefore, we would also widen the consistency strategy element to the trader psychology too. This is also a skill, a rule, a tool, name it how you wish, but it is a requirement for any strategy to work. Traders that attain consistency with themselves and with the strategy are the elite in forex trading. They have one of the best “jobs” when we speak financially but also about their free time, stress, and resistance to side effects like different crises. 

Building a strategy does not stop when it becomes consistent. A trader explores any ways that the strategy becomes either more consistent or more profitable. It does not mean a trader has to change what is already working well, but exploring other markets where such a strategy with small changes could work. More opportunities open where more profits could be made. A strategy like this is evergreen and could be regarded as a holy grail in trading. 

To conclude, you have defined a strategy when you have educated yourself about how different strategies work and then design your own with specific rules, tools, or PA patterns. Have a plan for each trade this way and consider consistency building with loss elimination, money management, and having the right mindset. Only then you know you have a strategy that could be built upon as you advance. 

Categories
Beginners Forex Education Forex Basic Strategies

Apply These 5 Secret Techniques To Improve Your Forex Trading

There are so many ways to fail with forex trading but so many ways to improve on. Each trader is unique in how he is playing the long forex game, however, common techniques are applied in various forms that make a huge difference to the trader’s psychology and other trading aspects. Such techniques are not always on the scene, frankly, we think most of the good stuff is not in plain sight. This article will try to provide techniques everybody can apply but a few know about. 

#1 Use Personality Tests

You will certainly find trading techniques not applicable to you or your lifestyle. Every trader has inherited advantages and disadvantages related to forex trading. Now, it is very rare to connect your results from popular personality tests with forex trading. Did you know you can use these tests to see where you will be great and where you will fail in trading, regardless of the strategy you choose? This is a secret only experts talk about or prop firms when registering new members. It may be a good idea for you to research this topic, however, we will give you some examples. Personality tests are there to help you, so you should answer them honestly, they are just describing your personality after all. We will use 16 personality types created by Isabel Myers and Katharine Briggs. 

  • If you are an extrovert, you are likely happy to start trading right away, opportunities are never missed, you like to take action. All this eagerness, on the other side, is dangerous. Overtrading is a common mistake with these traders, they also get emotional quickly. They should work on rules that will prevent them from overtrading, such as going to the gym, reading sessions, or similar, just away from their trading platform.
  • Introverts are great strategists, planners, strategy engineers. On the downside, they miss opportunities because of too much information. Another drawback of such traders is their hesitation to talk about their trading that could produce a great idea. 
  • Your lifestyle is how you look at the world and this also defines how you look at fore trading. If you are perceptive, for example, you do not like plans, rigid constructs that tell you what to do exactly. Even though such traders are curious and open-minded, they may lack conviction or confidence. Accepting a decision system solves this, provided a trader follows it to the letter even though he dislikes it in the beginning. More on the personality test is found in our dedicated article.

#2 Achieve Consistency With Indicators

Indicators are a way to go for beginners especially. If your trading is already advanced and consistent you do not have to mess with indicators. Beginner traders need guidance, and indicators are tools just made for that. However, consistency could not be achieved just by plugging random indicators, you will need a system. Indicators are great decision-makers, but you need specialized ones. To be precise, each indicator has its role, what they measure, how they serve best. You will rarely find a good indicator that is universal if that is even possible. Use specialized ones and arrange them to have a system you can follow, do not rely on your instincts, at least not until you build experience. 

Your instincts and your psychology do not do well when you start losing. Each time you experience a loss from a gut feel trade, there will be self-doubt. Continue to do so and you might quit trading altogether. By using an indicator system, and following it, you create a foundation where you can relax. On a proven system you know you have a winning formula, drawdown will not shake you as much. Many adverse factors on your consistency will be eliminated this way, forget all the videos about trading that do not implement indicators. Find special Moving Averages for trends, volume indicators for gauging market conditions, and even use indicators for money management. To some, this might not be any secret technique, yet you will be amazed how many beginners do not know the true value of trading systems. 

#3 Custom Formulas

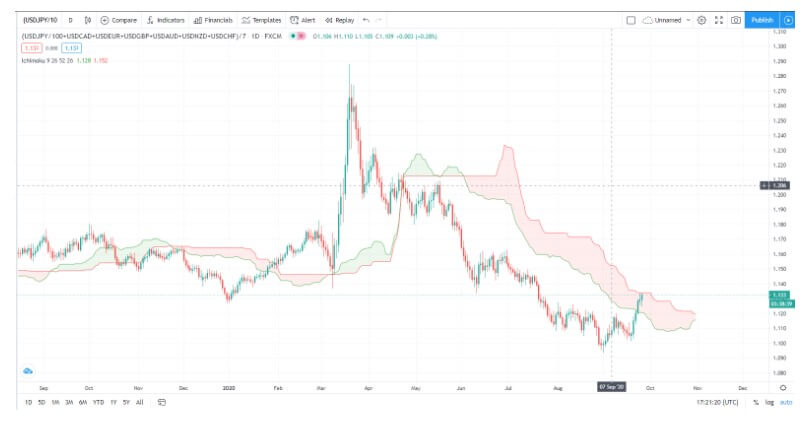
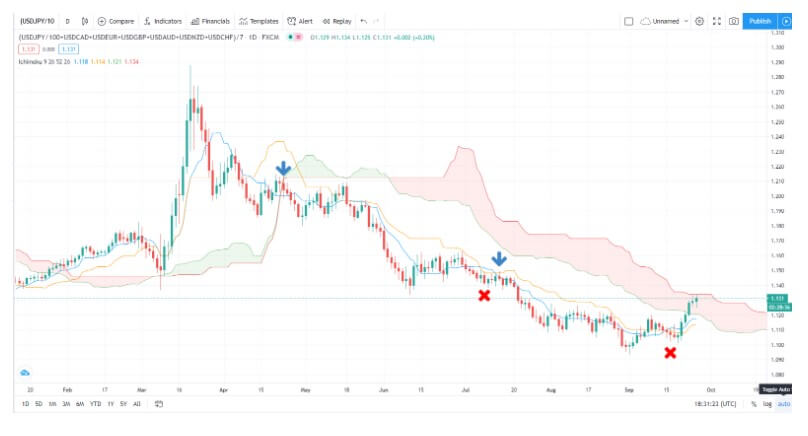
Did you know you can use a formula to make your index or a currency basket? Tradingview is a popular platform that allows you to do this. Indicators for MT4 that represent a currency basket, for example, are very rare, but in TradingView, you can make your own by typing one in the symbol box. Currency strength meters are not quite good replicas because you cannot see price action and you cannot factor in or out assets you want. This is still possible for free on the mentioned platform. You can use this formula for the Euro against the other 6 majors: 

(EURUSD+EURJPY/100+EURAUD+EURCAD+EURNZD+EURCHF+EURGBP)/7

You can also use inversion (1/X) which is needed for correct chart presentation, such as for the USD basket:

(USDJPY/100+USDCAD+1/EURUSD+1/GBPUSD+1/AUDUSD+1/NZDUSD+USDCHF)/7

On a basket chart, you can analyze, draw lines, put indicators like on any other. This is a secret technique currency basket traders adore, however even if you do not follow that strategy you can use it for a scoring system. If a single currency is trending up then you know to avoid selling it and mark it +1 point if you are looking to buy. This is just one secret from using custom formulas, we leave the rest for you to find out or create one of your own.

#4 Have a Schedule

Did you know trading is not only reading about strategies and ways to win trades? Professional traders have their routines and do not deviate from them. The reason for this trading technique is that it fosters their pros and encloses their drawbacks. It is what makes them have their trading “mojo”. We have mentioned indicators but professionals retain the edge with a routine, especially if they do not have a strict technical trading system. 

Take any trading book and you will see a lot of charts and setups, however, rarely about what really makes a professional trader. If you want to use a daily, weekly, or even monthly time frame, your trading schedule is much easier. Lower time frames require your presence but without a schedule, you can mess up your trading big time. If you find yourself looking at the charts for fun, to see what is going on in the middle of the night or similar, this is a sign you need to work on your schedule. FOMO is an unreasonable fear, there is always another opportunity with trading, chasing them is actually bad. 

Daily timeframe trading requires very little screen time. Basically, just 30 minutes to check if you want to trade and the news. Each period is one day so you only need to take a look once the candle closes. Set and forget for the next 24 hrs, easy. Lower time frames, on the other hand, require a plan in line with the sessions and the strategy. Execute this plan to the letter and then close the charts, do something else. You will be glad you did.

#5 Using Volume and Volatility

Did you know the trend following strategies are the most successful compared to everything else? Try to develop one with this special ingredient. So, if you are not totally new to trading then you have heard about volatility and volume. But have you noticed very few traders use these measurements? Too bad for them but now you know the secret of trend riding. To connect the two, trends rely on energy that pushes them further, and that energy is measured with volume/volatility indicators. This is a secret once again because rising volume or volatility alignment with the trend start makes such a big impact on trading. Whatsmore, such indicators are not common, which makes them even more special. Incorporate one as a rule for your trading, there are some to be found on the MetaQuotes portal for MT4 or ForexFactory

Categories
Forex Basic Strategies

Is There Really a 100% Winning Strategy in Forex?

The short answer to this question is simply, no, there is not a 100% winning strategy, the only way that you can avoid losing is to simply not trade at all. It is actually a good thing that there isn’t a 100% winning strategy as if there was, there would be no trading as everyone would be going for the same thing. It is simply impossible for there to be a 10% winning strategy, if there was then trading would not exist, so the fact that reading has been around for so long is testament to the fact that you cannot win all the time, but surely there are some strategies that are almost right all the time? Again no, each strategy has its merits and its downsides, the person trading it has an effect, and more. We are going to be looking at why there isn’t a 100% winning strategy and also why there never will be one.

Let’s get the risk out the way straight off the bat, if you are planning on having a profit with every single trade that you make, then it would be a better and much more profitable idea to not trade at all. As soon as you plan to profit with every single trade, you are basically throwing any sort of risk management out the window and are technically risking the entire account balance with each and every trade. This is simply due to the fact that you will be reluctant to close any trades down when they are in the red, waiting for them to return, if they do not return then you will eventually lose your account. So do not go into trading with any sort of strategy and think that you will have each trade come back as a profit, losses are inevitable and they are a part of trading.

You need to accept that there will be losses and you also need to plan for them, planning for losses may sound pretty negative, but it is in fact one of the most positive things that you can do as a trader. Planning for losses also means that you will be minimising them, a planned loss will cause you to lose a certain amount of your account, say 1$% or 2% of it with each trade, an unplanned loss could be 10% or 20%. You need to plan the maximum loss of each trade, yes you will be making losses, but they are controlled and you can decide before even placing the trade, the maximum amount that you are able to lose on it, one of the primary ways that we stay profitable is by doing this, and we can technically be profitable with more losses than wins.

You may have seen people advertising their strategies as a guaranteed win or as a strategy that has a 100% winning rate, but there are a number of different factors and reasons as to why this is not the case. Simply put, no strategy can account for all market conditions and no strategy can account for natural disasters or certain news events. If the markets moved like the ocean, simply moving up and down in a predictable manner then yes, there probably would be a strategy that could win 100% of the time, the problem is that this is not how the markets move and work. Some strategies work for a few days, others for a few weeks, and others even a year, but at some point, the markets will do something that is unexpected and this will cause the strategy to start to lose.

Forex is partly about planning, but it is also about adapting, when the markets move with a natural disaster or simply go against expectations and trend the other way, you are required to adapt, each strategy has been set up for a particular scenario and market condition, as soon as that changed, if the strategy is left as it is then it will incur losses, you need to be able to adapt it to better suit the new and changing conditions. Of course, you will still be expected to take losses, especially when experimenting with changes, although that is what demo accounts are for.

So while there is not a strategy that will get you a 100% win rate, there are some things that you can do to help improve those odds or at least to improve the chances of you being a profitable trader. To start, you need to manage your money, the losses that you will take need to be managed and they need to be controlled. You need to have a set risk management plan in place that will detail the maximum loss of each trade as well as your risk to reward ratio, so you can ensure that you are more likely to remain profitable overall. The traders that do really well also have multiple strategies that they use, if you stick to one, the markets will eventually turn into a situation where you cannot trade properly with the strategy. Due to this, having multiple different strategies available for you to trade with will enable you to trade better in different conditions and be more profitable in multiple different market scenarios.

If you try to go for a 10% strategy it will only end in disaster, the first thing that will start to disappear is your account balance or equity, as trades start to fall into the red and you refuse to close them. The second thing that will start to deteriorate is your psychology, you will begin to become stressed, you may even become greedy or overconfident depending on how the trading has been going. What is important to understand is that as you try for this 100% win rate, you will begin to really feel the strain of trading, something that can be avoided by cutting losses early on, it helps to take away the stress of holding and seeing red trades as well as protecting your capital. Many traders who go for a 100% strategy and end up losing, will simply deposit more and try again, resulting in even further losses, so the best thing to do would be to accept that there will be losses from the get-go.

To summarize what we have spoken about, the markets simply do not allow for a strategy to be a 100% winning strategy, it just won’t happen, things are constantly changing and most strategies are set up for a single market condition, you should also not leave trades in the red and close them early in order to protect your own balance and capital. So don’t go out there looking for the perfect strategy, instead look for a number of different ones that can be used to help you trade in multiple different conditions, and most importantly, expect losses.

Categories
Forex Forex Basic Strategies

How To Earn $398 Per Day Trading Forex

How does earning $398 a day sound to you? Good right? Many of us can only wish that we will eventually make this much, for some it is a reality, but for most, it is a distant dream. Yet it is achievable, but the real question that you need to be asking yourself is whether or not you should be aiming for that amount, and what stage you are currently at. Yes, it is achievable and we will be looking at how you can achieve it, but also why you probably shouldn’t be aiming for something so high straight away.

Should You Aim High? 

Ultimately, yes you should be aiming that high, but you should not be aiming that high straight away. In fact, your first goals should be to simply be consistent or even profitable, those are good targets to aim for. If you think about your current trading and your current strategies, what level are you currently at? How much are you making? You will need quite a large balance and a lot of experience in order to make so much per day. Yes, it is certainly achievable, but it is achievable once you have a number of years of success under your belt. Aim high, but do not aim too high too fast.

Start Low

It is important that you start with more realistic targets, start thinking about simply being profitable, that should be your first goal and the first thing that you aim for. Even something like $10 a month is still a positive result and is still a good step in the right direction. Then once you achieve that, increase it, to $20, then $50, then %100, then start looking at weekly targets, $50 a week, $100 a week, and so forth. While many like to look at daily targets, we would actually advise against this, simply because it can force you to make mistakes or to trade when you shouldn’t, but we will look at that shortly.

Daily Targets

We mentioned earlier about daily targets, sometimes people like to set daily targets but we like to think that these can actually be quite dangerous. If you are trying to make a certain amount each day it can lead to over-trading or larger, more desperate trades. This is why we try to place longer-term trades, it takes away a lot of the pressure that you may be putting yourself under. So instead of placing daily targets, try placing a weekly one, this will mean that you can still have bad days and you won’t feel that you need to make additional trades just in order to meet your targets. Weekly or monthly targets are best, just don’t try and put yourself under too much pressure with large and short goals and targets.

It Takes Money to Earn Money

Let’s be honest, if you want to make a lot of money you are going to need a lot to begin with. Otherwise, you will be using ridiculous amounts of risks which could very easily lead to you blowing your account. If you want to be making $398 each and every day then you will either need to be placing some rather large trades or an awful lot of them, either way, you just can’t do this with a small balance, even with a balance of $10,000 you will most likely struggle to get near to this figure. So the simple fact is that if you want to make a lot of money you will need to have a lot of money in the first place. This does not however make the target unachievable, as it will just mean that you will need to build up your account balance first, start small but aim high.

Take Your Time

You need to remember that you aren’t actually in a rush to make his amount, yes we want to get there as quickly as possible but there is no reason to rush and no reason to put your account under any additional risks by trying to get there as quickly as possible. Instead, take things slowly, the markets aren’t going anywhere and so there is no rush to get to your targets as quickly as possible. Use the time it takes to get there to build up your account balance and to learn, learning is a never-ending endeavor within the trading world and so take your time, do not rush, and try learning a little bit extra along the way.

It can be very tempting to rush your way to achieving such a good target, making that much each day is a dream for many and it would allow them to quit their job and work from home. That amount could solve the majority of a lot of our money issues, but it is not something that you will achieve straight away. You need time and money to get to that stage, a lot of time and a lot of money. Set your goals high, but ensure that you do not rush and that you plan your journey there, do not put your account under risks that you do not need to.

Categories
Forex Basic Strategies

WARNING: You’re Losing Money by Not Using this Forex Strategy

What if there is a solution to keep your account afloat no matter the strategy you are using? Would you follow it to the letter? Well, such strategies already exist, the issue is beginner traders cannot resist not to stray away from it. Ridiculous as it sounds, most traders lose because they start gambling instead of trading, even though they have something that already works. Apply this strategy and it would be very hard to blow an account. 

Money Management (“Oh no, that again”)…

You will find many strategies online, ready to be implemented. However, rarely you will find information about how big your trade or position should be. It is a risk management strategy. Yeah, the thing “no one” wants to listen, it is not as cool as some pimped indicator you can plug in. It is the same rule you need to follow when on a diet. You can eat this and this much every day. The desire to eat forbidden food may get the best of you, but if you persist, positive results are unavoidable. 

The brain just wants excitement…

Except in trading, you feel the gambling desire. The idea you can double your account tomorrow is very exciting and lucrative. The truth is it may happen, it can happen more than once. The feeling gets you moving. Unfortunately, everything will end badly. Excitement will be replaced with rage or depression. This game has no good ending unless you cash out and never return after a successful account doubling. But again, you will have to stop thinking about doing it once more, the idea of getting rich quickly. 

Fundamental, technical, it does not matter…

Fundamental analysis, all the news, and events that you think might get the price of some asset going are answering the question of when and in which direction. Technical analysis does this but more strictly. Money Management answers the how much question. No analysis will help you if the Money Management plan does not exist. Spend so much time developing a good entry and exit strategy, all is for nothing without this boring MM plan. Luckily, once you set it up, it is done, just follow it. Oh, yeah, you have to follow it to the letter. 

Your strategy should work…

Finding new ways to trade is great. However, now you know that a strategy needs optimal capital allocation for each trade. If you do not spend much time finding indicators and like to draw support and resistance, Fibonacci, and so on, that strategy is good too. The good news is money management makes any strategy work, essentially it is this thoughtful position sizing that drives your account value up and down. The even better news is that once rounded up, money management does not require you to work on it, just repeat the same for every trade you do. 

Easy MM with Ratios…

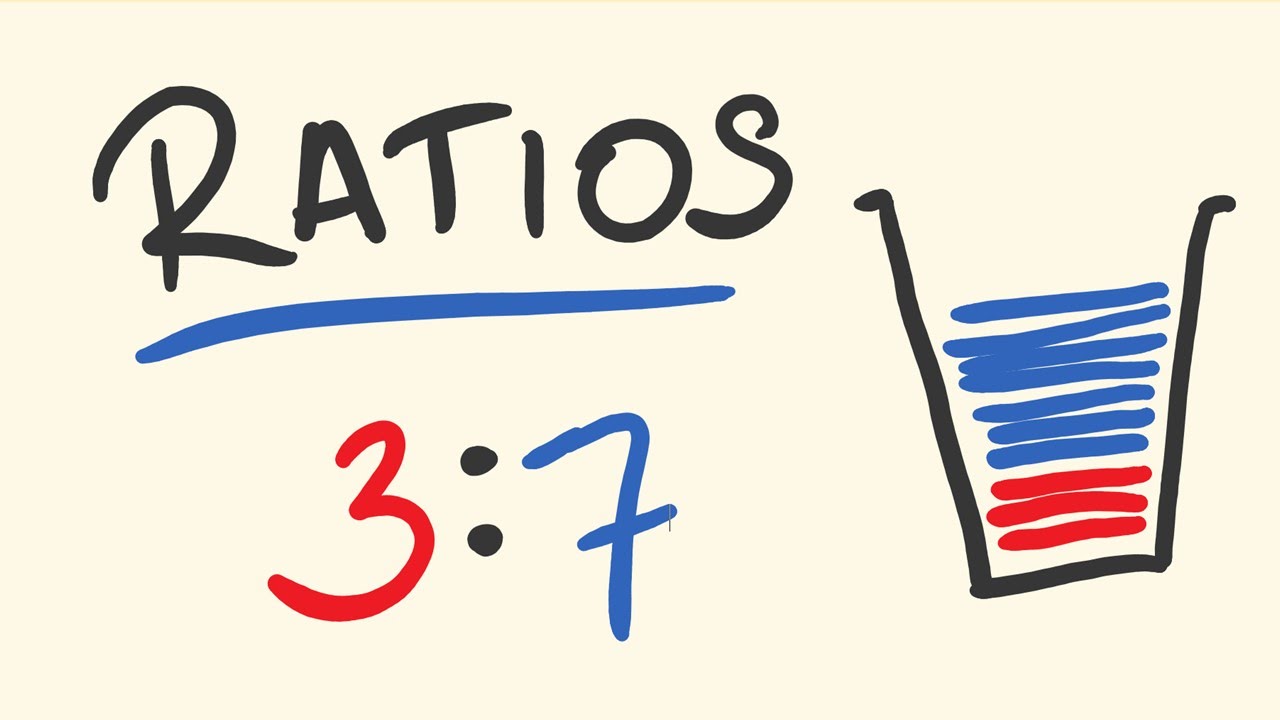
Ratios are easy to set up. Once you understand the Stop Loss and Take Profit idea, try to go with the generally accepted approach of having at least a 2 to 1 ratio. This just means your TP is two times away from the trade entry price than the SL. Where to place TP and SL is something we have discussed a lot before, but initially, you can take any channel-type indicator that measures volatility. Place TP at the top or bottom of it, depending on which direction you are trading. SL point is easy to place now, just halve the TP distance for a 2 to 1 ratio. 

Easy MM with Price Action pivots…

Simply said, pivots are price tops and bottoms you see on the chart. These extremes are used to place support and resistance lines, especially if they are repeatedly appearing at the same price levels. These lines are easy picks for your SL positioning, and if you follow the ratio rule TP is also defined. You can experiment with your ratios, extending them to 3:1 or higher. Now when you know how to protect and capture profits at the basic level, the only thing that remains is how much money to put into every trade.

How much to put into a trade…

Technical traders like indicators and indicators are really good at precisely telling you how much to invest. Volatility indicators usually produce a number to tell how something is volatile. You can try and open fixed-size trades. For example, if you have a $10000 account always open $500 positions. That can be 5% per trade. However, when an asset is really moving, more than others and more at that particular time, that 5% can suddenly become a serious loss, even with a proper SL. Of course, we can simplify things. Currencies or assets that are more volatile, such as the GBP, are not going to follow the same 5% trade saying rule. Simply have it to 2.5%. If you see chart candles that are higher than usual, do the same. Now if we really want to get nerdy and precise as technical traders, we can use volatility indicators to calculate precisely how much to invest. One such indicator is now a standard issue on many trading platforms, the ATR indicator.

Strategy example with Keltner Channel…

The picture below contains two indicators, the mentioned Keltner channel and a simple volatility indicator using the TradingView platform. The strategy uses the Keltner channel to set the SL level, at the bottom for long trades and the top for short. Since the channel can be used for breakouts and reversal trading, and it also shrinks if the volatility is getting lower, we have a universal tool for placing SL and TP. Mix in the ratio rule and the position sizing rule and your Money Management is all set. The green vertical line is our long entry moment. We enter a trade when the price breaks out of the channel AND the volatility indicator is rising, but also we consider if the price has broken previous resistance marked with a red horizontal line. The middle channel line is our SL and TP is twice as far from the market with the green arrow.

As you can see, our TP was hit almost at the top of this small trend. Now, the price action went into consolidation, new support and resistance levels are formed until we notice a new breakout of the Keltner channel. It was a short trade that pierced the support line but failed to make the way to the TP level, we were stopped at the SL. Even though we have 1 win and 1 loss, we are still in the money since the TP to SL ratio was 2 to 1. If we fail again, only then we are at breakeven. Testing your strategy, you will aim to be better than 50%, right? Because 50-50 is just coin-flipping. Even then you will be profitable just because you have a money management plan in place. Now you can do the fun stuff. Find a winning strategy of your own.

Sources of knowledge…

On your way to finding a winning strategy suitable to your lifestyle and psychology is fun, it is like finding parts of a money-making machine. On this very website is a whole library of strategies, concepts, and indicators. Of course, consider tweeter and youtube but also dedicated forums where people share ideas. You will notice that something could blend into your strategy. The best part is you do not have to worry about losing. Even if you are very bad, Money Management will give you many more chances to slowly get it right. It is one universal thing that can be used in many other markets.

Categories
Forex Basic Strategies

Create a Powerful Forex Strategy In Only Five Steps

One of the first things that can happen to you when you start trading forex is seeing that it is possible to earn money without having a fixed course. This will create a false feeling that trading is easy and you don’t need anything else. Then, the market will put you in your place. But of course, you’ll get pretty high for the previous gain and then the fall will be harder. Then the frustration will be such that you will want to quit trading and think that everything is manipulated and against you. Does it ring a bell?

Why is this happening? You were lucky to start and you don’t have a clear strategy that allows you to trade without those ups and downs as if you were on a roller coaster. If you spend time creating one or more strategies and adjust the risk so that market movements don’t leave you with KO, you can put the odds in your favor.

How can you create a trading strategy? It is very simple, nowadays there are many tools that allow you to create systems and automate them without learning to program. As easy as having to follow a series of steps to make sure you have everything defined and that you don’t leave anything in the air. I tell you the five steps to set up a trading strategy.

Define A Time Period

Your trading strategy needs to be well defined over time. Set when to open a position and when to close it. The exact moment in time or circumstance. In addition to the frequency. if for example will not operate on Fridays or during a strip at night. This is especially useful in some intraday strategies to limit that no trades are made during rollover, as spreads are usually higher and we pay more for each trade. Also interesting not to trade for example on Sundays at the opening or when there is volatility as when macro data is published.

If you do day trading you will look for small time frames trades with the aim of looking for intraday movements in the price, while if you do swing trading you will look for wider ranges in the price and your time horizon will be wider.

Input and Output Indicators

Indicators, as their name indicates, will act to give an input or output signal from a position. An indicator can be simple as a moving average or more complex and personalized. Really indicators with very simple rules work very well over time. For example, we can define in our trading strategy that when the opening price in an hour of EUR/USD exceeds its 20-period weighted moving average, buy and close the position when subsequently, the opening price in one hour is below this average.

The objective of an indicator is to serve as a reference, for example, to detect a trend. Indicators are not the panacea or magic, they are just markers on the way to reach our goal. You have to see it as clues so that everything develops in the best way and get an advantage, but remember that the key is to work with different systems.

Defining Risk Strategy

Defining risk in our trading strategy is not that it is important, it is that it is basic and fundamental. Your system should consider how much you will buy or sell an asset and how much is the maximum you can lose. The maximum amount you can lose can be calculated in euros or dollars or you can calculate it in % of your account. I recommend that you do it in percentage terms to avoid constantly adjusting.

Many traders start to consider how much they can lose once it’s happening, as at first, they believe it’s something that won’t even happen. Incredible but true. This puts them at risk for more money than they can actually assume. Set a maximum percentage you can lose in your trading strategy (depending on your actual risk tolerance), it will help you keep your feet on the ground.

Configuration of Parameters

Where will you place the stop loss? And the take profit or target of each operation? What will be the settings of the indicators you will use? For example, if as I said in the previous example you use a moving average. How many periods will it be? It is important that all of this is well-set, clear, and objective. This way you will have a perfectly defined trading strategy that will not make you think or doubt its execution.

Write Your Strategy

Could you explain your strategy to someone in a simple way? One thing that is often said is that your strategy should be able to enter a post it. Maybe it’s a little radical, but in essence, the shorter and simpler, the more robust and more likely it will work over time.

Writing your strategy is something that will help you understand it. Imagine if you had to tell someone to program it for you. You should be very objective and avoid statements like “much, high, little or low”. You will have to define very well how much is that much, that high, that little, or that low. That will help you not to sabotage yourself and to have the mental clarity to act accurately in reality. Whether you’re operating manually or automated.

[Extra] Keep Track of Your Operations

Many traders create a strategy and simply execute it. If it goes well they raise the amount until they can’t take any more risk, the position goes against them by little, and by going so exposed they blow the account. Others simply carry it out and if it is not profitable at first, abandon it.

Winning traders do not do this, they work with different strategies that monitor proper risk management. This means that your perception is not focused on a single strategy and that you will play everything to one card. You will have a more panoramic view, but remember that you must follow your strategies.

This point is important because it will help you establish criteria where you disconnect strategies that are not working. It’ll help you limit your losses considerably. Many traders live clinging to the idea that they need to be strong no matter what and stay true to your system. But of course, what if your strategy is no longer profitable? This is nothing new, there are trading systems that no longer have a statistical advantage in the market. That’s why working with a wallet is the smartest thing. So you can have some on the bench to replace the headlines when they flounder.

If you operate manually and you are starting to apply a system, quiet, it is good to start, but keeping control of each operation and its result can help you a lot and is basic. You can do this by connecting your account with platforms such as myfxbook, fxblue, etc.

Now you have a roadmap to follow to create your own system (without forgetting to monitor it). Remember that there are tools that make life easier for us and that can do all this for us.

Categories
Forex Assets

The Definitive Guide to Forex CFD Trading

Although it is a basic term within trading and forex, in this article I will explain what CFDs are and what they are not. I begin almost necessarily by telling you that CFD, as you know, corresponds to the acronym “Contract For Difference”, which translates into Spanish as “Contract For Differences”. It is a financial product in which the differences between the purchase price and the selling price of a financial asset are settled. When we talk about Forex specifically, about a pair of quoted currencies.

Yes, a CFD is a derivative instrument, or what is the same, it is issued on the price movements of an instrument listed in a market (referred to as the underlying asset), but without being able to physically purchase that asset. Only the benefit or loss of the transaction is charged or paid, but ownership of the asset is never acquired. CFDs have no maturity, the open position in the market can last as long as the trader deems necessary.

Index
  1. How CFDs are valued
  2. How to operate CFDs

2.1. Why an expert trader chooses to trade CFDs

  1. Why trade CFDs instead of shares
  2. Trading platforms to trade CFDs
  3. Characteristics of CFDs
  4. Trading strategies with CFDs

6.1. Risks of trading CFDs

6.2. Learn how to calculate the profits and losses of your CFDs

  1. Who can trade CFDs?
  2. Advantages and disadvantages of using CFDs
How CFDs are Valued

In case you are wondering how CFDs are valued, they are contracts with a broker who issues them, unlike for example the shares that are acquisitions of assets in the market. Typically, the broker offers two prices around the asset’s quotation, one for the purchase (which the trader is supposed to sell) and one for the sale (when the trader wants to buy); these prices are what you can see as “bid” and “ask” respectively.

In forex, standard contracts are called lots and are equivalent to 100000 units of the base currency. Although there are also mini-lots (10000 units) and even micro-lots (1000 units).

For example: if we buy 2 CFDs (2 lots) of the currency pair EUR/USD, it means that we are carrying out an operation of 200000 euros. If the pair is quoted at 1,1200, according to the ask price of our broker (one euro equals 1,1200 dollars), the value of our position would be 224,000 dollars.

How to Operate CFDs

To operate CFDs you only need to establish a contract with a broker that issues these financial products, opening an account with it, and providing an amount of initial capital. Generally, the whole process is done online. When opening an account, the broker usually provides all the tools necessary to trade CFDs, including the trading platform where market analysis is performed, purchase orders are issued and the capital contributed is managed.

Trading with CFDs is as easy as buying, launching a purchase order on the aforementioned trading platform when a price increase is expected. As well as selling when you expect a decline. CFDs are bought and sold as if they were the asset on which they are issued, with the advantage that it is not necessary to own them in order to sell them. It is possible to sell first and repurchase later to close our position (this operation is called “short investing”, “short position opening”, etc.).

To undo the operation, you just have to throw an order opposite to the opening one, even though the platform itself allows you to do it in a simpler way, simply by choosing the option “close position” (or similar).

Why Expert Traders Choose to Trade CFDs

A skilled trader knows how to handle financial markets (which doesn’t mean he always makes a profit), handles risk well, and is able to control his emotions. In this sense, trading through CFDs is an option if your goal is to use leverage. Trading with CFDs has a number of advantages and a number of risks that we will see below. Risks are controllable if you have the knowledge and a necessary methodology (an expert trader has these two characteristics). Once these two skills are achieved, trading CFDs can be an option to consider.

Trading and trading with CFDs requires:

  • Protect capital at all costs, managing the risk of each operation.
  • Think of trading CFDs as a business and not a hobby.
  • Create a strategy and follow it with absolute discipline.
  • Don’t overleverage yourself.
Why Trade CFDs Instead of Shares

When buying shares in a company, a part of the ownership of the company is acquired. In other words, we are shareholders and we are linked to the business of this company. However, we can only sell the shares if we have previously purchased them (unless they are requested on credit). Short transactions are therefore difficult: we can only have a profit if the shares are revalued. With CFDs this changes, it is possible to make money with upward and downward movements.

With the cash shares, we will not have leverage, we must disburse 100% of the purchase price of the same. This means that the volume of operations is limited to our capital in the account. In this case, the investments will require more maturation time, because they need more price travel to obtain an acceptable profit. Intraday trading, even short-term trading, becomes almost impossible unless a high amount of capital is available. Finally, when buying shares a physical purchase is made, you have ownership of them and this fact requires incurring commissions and additional costs.

Trading Platforms to Trade CFDs On

There are many trading platforms to carry out trading through CFDs. Generally, it is the broker himself who provides this tool to the trader when opening an account. There are brokers that have designed their own platform, others, on the contrary, offer it under a customer terminal, but it is not their property and can be used by various intermediaries. Some platforms you can find to trade with very popular CFDs are Metatrader 4 and 5, Visual Chart, Pro Real-Time.

Characteristics of CFDs

The main characteristics of CFDs are the great flexibility they provide, added to the leverage capacity. As I have told you before, are financial products with leverage, the trader does not need to deposit the entire value of the investment. Simply by providing a percentage of it as a guarantee to cover possible losses (margin required) it is possible to open a position with a much larger volume. The potential profit is increased because it is operated with the capital in excess of that actually available.

Liquidity is another of its characteristics, we can buy and sell at the desired time (the Forex market is always operating from Monday to Friday, 24/7) without worrying about the counterpart.

Trading Strategies for CFDs

A trading strategy is about maintaining rules, both for the analysis and for the execution of the trade. The strategy determines the purchase and sale decisions of CFDs, as well as the time, the asset, the volume of the transaction, the potential profit, maximum allowed loss, etc.

To establish a trading strategy with CFDs, the first thing we must decide is the tools we will use for our operations in the market:

Price action.

  • Trends: follow-up and rupture of these.
  • Use of technical indicators to determine market momentum or depletion.
  • Operate according to economic news and other key data.

In addition, the trader must define its style when trading (according to the time duration of the investments in CFDs):

  • Day trading
  • Swing trading
  • Position trading
Risks of Trading CFDs

The risk of trading CFDs comes precisely from the use of leverage. Trading with more than available capital means that each market fluctuation has a greater impact on the trader’s account, whether in favour or against.

An unfavorable operation, if you don’t have proper risk management, can damage your money. When the margin runs out, the broker will require a new contribution or close the position. Be careful because here you must already assume the corresponding loss.

The maximum leverage level for CFDs on the Forex market for major currency pairs and for retail traders under the ESMA regulation for European customers is 1:30 (which means providing a margin of 3.33% on the volume of the actual trade), in accordance with current regulations. So, in this way, the risk of CFDs is limited.

How to Calculate Profits and Losses

To calculate the profit or loss when trading with CFDs, the first thing that will be necessary is to take into account the costs of the transaction.

The main fees charged by CFDs brokers are:

Spread: the difference between sales and offer prices (mentioned above). They are usually a few points and are usually loaded at the time of opening a position. For this reason, trading with CFDs starts with a small loss.

Swap: also called “rollover” or “night premium”. This commission has as a concept the daily interest of the money that the broker lends us for leverage. It is a charge or credit to our account each day, depending on the difference in the interest rate of the two currencies of the pair in which you trade.

Once the costs are known, the factors to take into account to calculate our profit or loss from the position with CFDs are the following:

The contract size or volume of the position (in the base currency).

  • The opening price of the position.
  • The closing price of the position.
  • Gains or losses are determined: (Contract size*Closing price) – (Contract size*Opening price) – Commissions.

In Forex, the minimum price move is called “pip”. A pip is a variation in the fourth decimal place of the currency pair, except for the pairs involving the Japanese yen, which will be the second decimal place. The number of pips earned or lost by the value of each pip (depending on the volume of the position), less the commissions applied, results in the gain or loss.

Then we will have to convert profits or losses into the local currency at the exchange rate.

Who Can Trade CFDs?

Basically, any person with the ability to contract and who has available capital to invest is in perfect disposition to trade with CFDs. In other words, simply by being of age (and not being legally incapacitated) and contributing an amount as capital, it is possible to open an account with a CFD broker and start trading. Trading CFDs is within the reach of anyone because it is not necessary to have a large sum of money.

Advantages and Disadvantages

The advantages of operating with CFDs come from the characteristics of these products, as we have seen above:

-We will only have to deposit a part of our capital as a guarantee, being able to increase the amount of our trading operation.

-The liquidity of the profits obtained is immediate, we can withdraw the profits once obtained.

-They offer the possibility of short trading with the same ease of long trading. The trader can make profits even when the market drops.

-They are extremely agile, it is possible to perform operations of a few minutes duration. Thanks to CFDs and the leverage they offer the trader can take advantage of the slightest movement of the market.

-They require, in most cases, lower commissions than the sale of physical assets.

-They are available to anyone, it does not require much capital to trade with CFDs.

With regard to the disadvantages of:

-Leverage is the risk factor for CFDs, which can be both an advantage and a drawback at the same time. Comprehensive risk management is needed; for this reason, expert traders choose CFDs: they are masters in risk management.

-Although these products do not lack reliability and transparency, they are not quoted on an organised market.

-Daily interest payment is required due to the money borrowed by the broker in the leverage.

Categories
Forex Basic Strategies

Signs You Need Help With Your Forex Strategy

We all need help with things in life, the problem is that it can often be quite hard for us to realise that we need the help, we need someone on the outside to point it out for us. This is no different when it comes to trading and forex, often we think we are doing fine, only to have someone else come along and tell us that we are doing things wrong or to point out the fact that we aren’t actually profitable at the moment.

When we are told we are wrong or we aren’t doing well, it can make us feel pretty down but it is also the first step to improving and the first step towards being a better trader. So if someone tells you or points out something that needs improving, take it on board and put it into action. We are going to be looking at some of the signs that may be there that could be telling you that you need to make changes and that you may need a little help with your forex trading.

You Aren’t Profitable

Sometimes when we are in the driving seat, we don’t actually realise whether we are profitable or not, we are concentrating so much on our actual trading that we are no longer looking at or recording the results that we are taking. We could be months in, with hundreds of trades under our belt, but until someone comes along and looks at those results, we won’t realise that we aren’t actually making any money.

There is an easy solution to this, you need to keep a trading journal. This will allow you to write down pretty much anything that you are doing, and by doing this, you are setting yourself up for success. Simply down to the fact that you will be able to look back at your previous trades and see exactly what you did and the results of that trade. This way you will be able to see exactly what your profits and losses are, and allow you to work out whether what you are doing is effective when it comes to being profitable.

It’s Too Stressful

Many people find trading stressful, that is one of the many natural emotions and reactions that you will get to trading, the problem comes when people find it a little too stressful. Some find it so stressful that they simply need to stop or they just cannot think of anything else, or even function properly afterward. If stress is starting to take over whenever you are trading you most likely need help, but first, you need to look at how you are trading.

Firstly, the money that you are using to trade with, do you need it? Will losing it negatively affect your life when it comes to things like food or rent? If the answer is yes, that is why it is so stressful and that is why you should not be trading with that money, never trade with money that you cannot afford to lose, it will always be a stressful situation. The second thing to look at is whether or not you’re using the correct trade sizes. If you are using trades too big then you will be putting too much of your account in danger, and seeing the trades go into the red can be stressful when the trade sizes are too large. So limit your trade sizes and only trade with money that you can afford to lose, those will instantly reduce your stress levels while trading. There are also a  number of different support groups out there, even just talking to someone, friends, or family works well, can help to reduce your stress levels but getting help from professionals about your stress levels could be an option if it is really getting the most of you.

You Don’t Have Time

Trading can take a lot of time, it also can not take a lot at all, it all depends on you and the strategies that you are using. For many, at the start it can take a long time, there is a lot of learning to do even before you place your first trade, and this can be boring for many who simply want to skip it and start trading, but you need to take the tie to learn. The other thing is that certain strategies take a long time to trade with, there can be a lot of analysis, there can be a lot of trade preparation, and then once you place placed your trades, you need to sit there and monitor them, this is especially true for scalping, where you need to be at the computer during the times of your trading.

If you are someone that does not have a lot of time, then there is not really much point in you trading a strategy that requires you to spend a lot of time in front of your trading terminal. Instead, you should be choosing one that only needs you to place the trade and then the rest will be done for you, these longer-term trading styles are perfect for people who do not have a lot of free time each day to trade. So if you are finding that you don’t quite have enough time, think about switching things up and seeing if you are able to trade more effectively.

Not Knowing What To Do

This is something that is far more common than you may think, yet a lot of people simply do not want to admit it. There will however be situations and times where you simply do not know what it is that you are meant to be doing or how to analyse certain information. Try and get involved in some trading groups and communities. They can really help you out, if you are stuck, ask the question and people will always be happy to help, or even just browsing the community can mean that you find out some information that ultimately helps you to improve and get past your blockage. The moral is to simply ask for help if you are in a situation where you are not sure what to do.

There will of course be other signs that you may need help, if you find yourself in a situation where you are stuck, not understanding something, or cannot see any way to improve, it is important that you talk to people, join an online trading community and talk to people, it is the best way to get around things and people are always willing to help. So if you need help, simply ask for it, it’s the best thing that you can do.

Categories
Forex Basic Strategies

Ways to Completely Revamp Your General Forex Strategy

When you have been trading for a while, you will most likely come across some rough patches, or times where you simply do not think that your strategy is still good enough. Due to this, we will often have to try and change a few things to try and stir things back up and to make a few adjustments. Sometimes, however, you will need to completely revamp your strategy, a complete overhaul to make things more successful. So let’s take a look at some of the things that we can do in order to revamp our strategy and to bring back that spark that it once had before.

Start Over

Sometimes things can become very stale, if you feel your strategy has come to the end of its life then there are still things that you are able to do to try and revamp it. One of those things is to start again from the bottom up. Start with the foundations of your strategy, try and rebuild it based on the current market conditions, this way it will once again suit the conditions of the markets. This may seem a little extreme, starting over completely, but that is one of the ways that you can really tailor your strategy to the current market conditions and one of the ways that you can ensure that it will have the best opportunity to be successful in those market conditions.

Test A New Asset

Sometimes you do not need to actually change or revamp your strategy, instead, you can simply change the asset or currency pair that you are going to be trading. This can put some new life into an already established strategy that you may be using. This once again will enable you to feel as if things are a little fresher even without making any changes. You never know, maybe the strategy will be far more successful on the new strategy than it currently is on the asset that you are trading. So consider this as an option as well as making changes to your current strategy.

Make Subtle Changes

Sometimes you do not need to make large changes, a simple change to one of the parameters or the rules that you use with the strategy could be enough, part of using a strategy is that you need to keep making small adjustments as you go. As the market conditions change, so does your strategy, but the changes do not need to be large. These regular small updates are all things that will ultimately add up to larger changes, so after a year or so of very small changes, the strategy could resemble something that has pretty much nothing in common with the initial strategy that was created. That is the beauty of the small changes, it will create large or completely revamped strategies without needing to spend a long time at once totally changing it up at the same time.

Make Changes to Risk Management

A major part of any strategy is risk management. This is what can potentially make or break a strategy and is the last line of defense for your account balance. Sometimes all you need to do in order to completely revamp your strategy is to change up the risk management that you are using. This may be a change to your risk and reward ratio, a change to the positions of your stop losses, or take profits. Or it could be a change to the size of our trades or even the amount of trades that you place at once. Whatever the change is, be sure to test it first and to ensure that your account always remains safe. Also remember, if your changes to risk management mean that you don’t make as much, you can very easily revert back to the previous plans that you were using.

Be Dynamic

The markets are constantly changing, they are dynamic and will have multiple different trading conditions throughout the year, there will be slow times and there will be times of higher volatility. Due to this, your strategy needs to be dynamic in order to keep up with the ever-changing market conditions. As the markets change, you will need to make adaptations, both big and small changes in order to keep the strategy in line with the markets. This could be changed to your stop-loss levels, your trade sizes, the currencies that you trade, the number of trades being made, and pretty much anything else. Remember that you don’t need to make big changes, but keep track of what the markets are doing, and adapt your strategy and your trading to it.

Look Within

One thing that you also need to do in relation to our strategy, instead of thinking about changing your strategy, there may be something within you that you need to change yourself, or something that you currently do like a bad habit that you need to change. The strategy may actually be working fine, but there is something that you are doing that is causing the issues, or at least reducing the profitability of your trading. So look back at your journal, look back at the trades that you have made in order to ensure that you are following your strategy properly and to help find any bad habits that you may be partaking in, nip those in the bud and your trading will improve without having to make any changes to your trading strategy.

There are many ways that you can change or revamp your strategy, sometimes you only need very small and subtle changes, other times, depending on the market conditions you may need to change the entire thing or even try a new strategy completely. What is important is that you take it one step at a time, and ensure that you are comfortable with the changes, if you are changing something that takes you out of your comfort zone or potentially reduces the profitability of your strategy then there may not be a good reason for making the change. Do not be afraid to make changes though, if one is needed, then it is most likely for the best that you make that change, no after how small it may seem.

Categories
Forex Basic Strategies

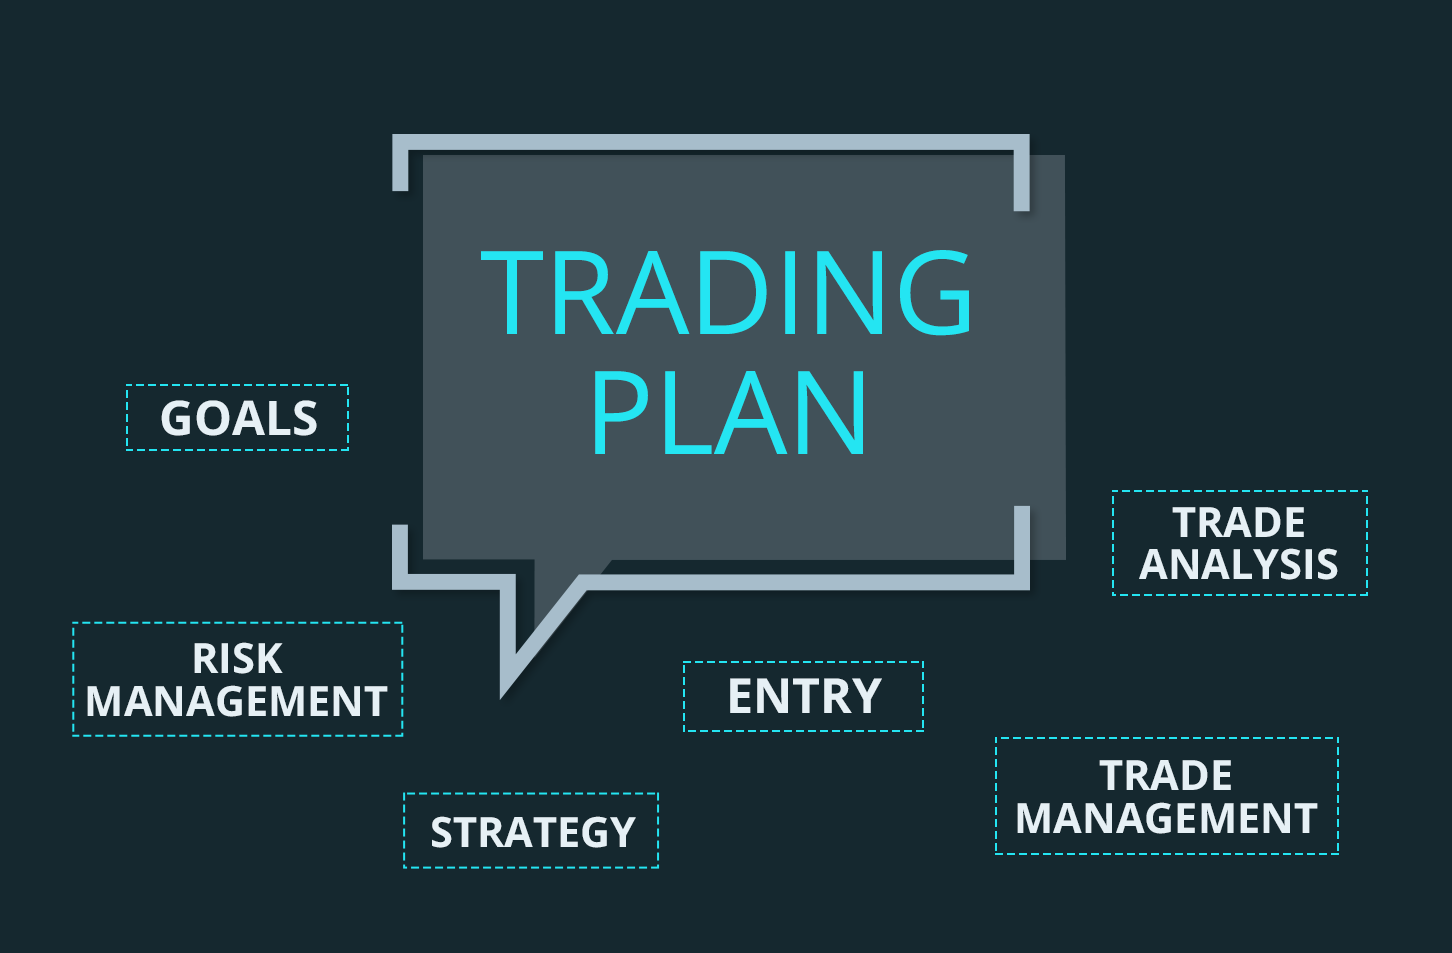
How To Construct and Write Up Forex Trading Plans

A good winning Forex trading plan should become the start for any path to becoming a consistently profitable trader. Unfortunately, some traders don’t write one until they’ve shredded some trading accounts. Even the task of writing a trading plan often falls into the category of, “I will do it when I have more time!”

So why don’t a lot of merchants spend some time making one if we’re talking about something so important? The answer is very simple: we don’t like the rules. And this doesn’t just apply to traders. We use the term “us” to refer to the entire human race.

When entering forex, we find an environment without many rules. Except for the ones our broker can put on, we’re free to do whatever we want. This is a somewhat frightening proposition for someone who’s been bound by rules all his life. We attribute to this fact the phenomenon that so many traders fail; they cannot handle the fact that they have no rules to follow. Or rather, they do not set their own rules.

In this article, we intend to check what a trading plan is all about, why it is so important and some points we think you should consider including in your own trading plan.

What Is A Forex Trading Plan?

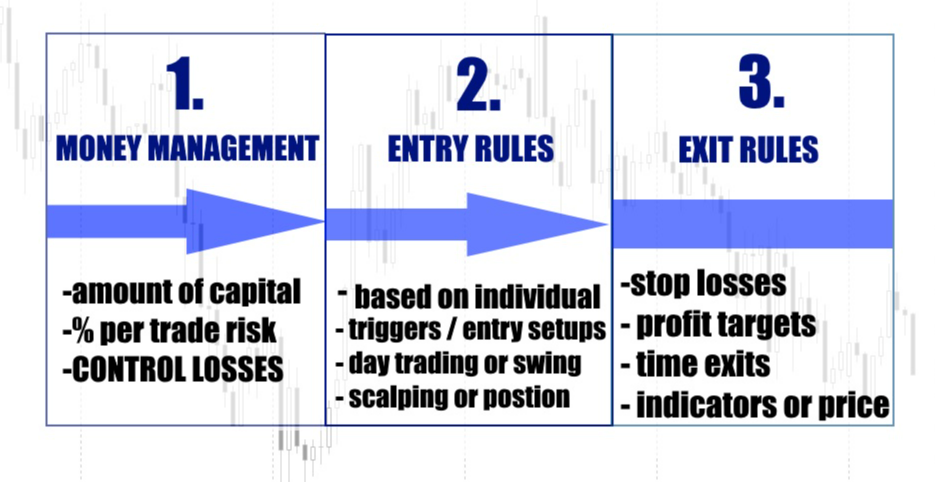
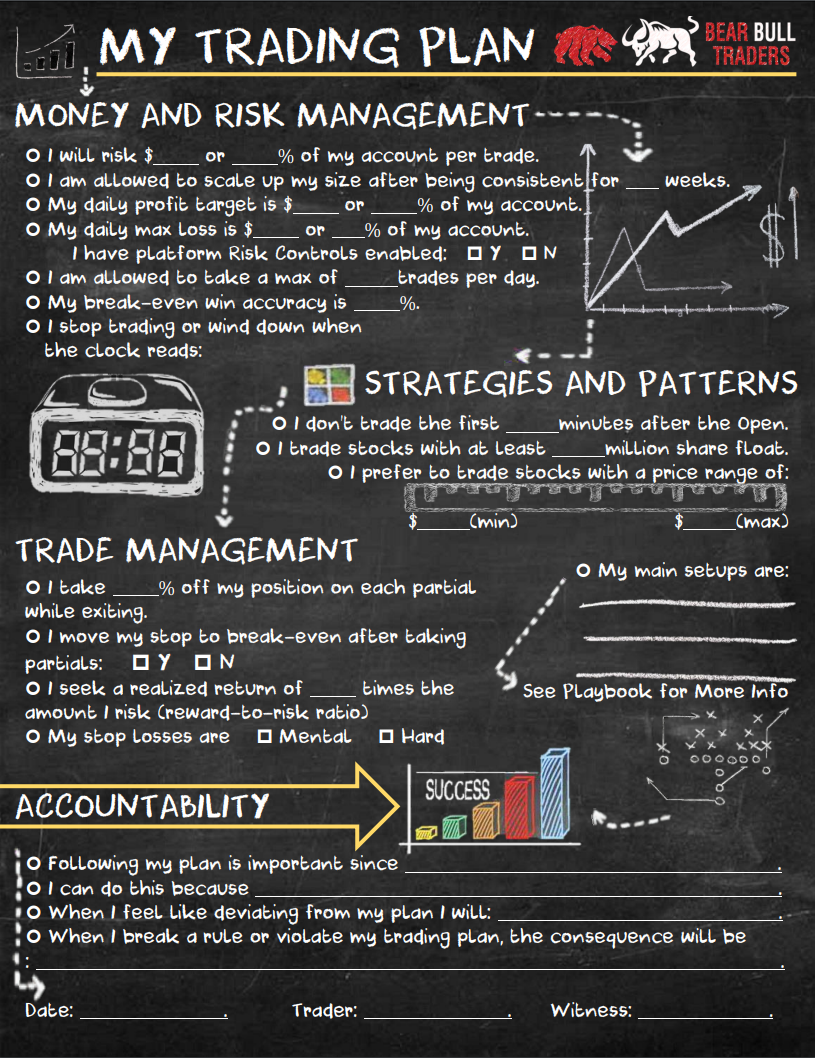
A trading plan is like the original plan of everything you do as a trader, grouped as concisely as possible, but also descriptively. Your negotiation plan should consist of how and when you operate, as well as what you do before and after each operation.

Anyway, writing your trading plan isn’t the hard part. The hard part is to do it in as much detail as possible while keeping it as concise as possible, preferably just one page. After all, an 8-page trading plan that takes 15 minutes to read is not likely to be consulted often, which you should be doing.

Finally, your plan needs to be reviewed as your trading skills improve. Do not mistakenly think that your business plan is immovable and that just have to make it work.

Why Is A Trading Plan Important? 

Simply put, a forex trading plan helps you stay disciplined. Commerce is a business and has to be treated as such. Like a business has a standardized operating procedure to keep things running properly, you must have a trading plan to keep yourself disciplined. As mentioned above, the forex market is a boundless environment and rules, so you need your trading plan to serve as a rule book to help you stay out of trouble.

Building Your Forex Trading Plan

Now is the time to work to put the pieces together. Below we have outlined what we believe are the most important topics to include in your trading plan. This is not a complete list, so you are free to add topics that you think should be included in your trading plan.

Every winning trading plan begins with a well-defined strategy or set of strategies. For us, these strategies could be the indecision candle, reversion pinbar, internal bar breaks, power candle, etc. It is important to define each strategy you will use and also to define the market conditions necessary to validate a setup. Does the market have to be biased or can it be of rank? Should the pinbar occur at a support and resistance level or will you also consider operating continuation pinbars?

Defining Time Frames

This theme is very simple, but it is also crucially important. You have to define the time frames in which you will operate. The omission of this simple rule has caused a lot of headaches for many traders. For example, we know a trader who when he first started in this world of forex, was constantly changed from the time frame. One week he used H1, then he got bored and moved on to M5 the next week.

Not only that, but he was in the habit of entering the market by looking at the H1 graph and then switching to H4, D1, M15, and even M5, just to see if things looked “right”. This person had no idea what he was looking for but was determined to make sure that every time frame looked favorable.

Choose only 1 or 2 time frames with which you feel more comfortable and stick to them. Look for setups in these time frames, operate in these time frames, and exit the operations in these time frames. This is the only way to break with “the dance of time frames,” which I think we’ve all experienced before.

Defining Your Watch List

As part of your trading plan, you will want to define the currency pairs you will operate. As with your overall trading plan, your watch list will change over time. Normally we recommend starting with 10 pairs of coins to observe at any time. This will give you several setups every week even in the highest time frames. As time goes on your business skills will tend to improve and your confidence increases, you can extend the list to include other pairs and even some commodities.

Mental Preparation

No, you should not meditate. Mental preparation is undoubtedly the most neglected topic in a trading plan. Maybe it’s because traders are too busy defining their strategy. Or perhaps simply because people don’t like to talk about their feelings. Whatever the case, this point is a must!

How do you feel today? Did you have a good night’s rest? Do you feel energetic, tired, or something in between? These are virtually all the questions that need to be asked as part of your business plan. We’ve all had those mornings. Whether we’ve been up late with friends, the stress of life that won’t let you sleep, or maybe you got up on your left foot. These things happen to the best too and will continue to happen. It’s your job to assess the situation and find out if you’re mentally prepared to face the markets. If not, maybe it’s best to sit back and do nothing until tomorrow.

The financial markets will always be there and believe us when we tell you that it will be much better to wait to operate until you are mentally prepared than to lose money for a mistake you would not otherwise have made. Just remember, being “flat” (not having open positions) is one position and the safest you can have.

Lay Down Your Risk

As some will know, we do not recommend setting the risk in percentage terms. A much more precise approach is to define your risk level as a monetary value. But on the other hand, setting a percentage also gives some value, so we think it advisable to use both methods combined.

Here we can give an example of how you could define your risk within your trading plan. First, you must determine what your risk threshold is in terms of percentage. We recommend something between 1% and 5%. Let’s assume that you want to risk 2% per operation. The next step would be to define your risk threshold in terms of monetary value. Suppose you have a $10,000 account and are comfortable with risking 2%. Using the percentage rule only, your risk will be $200 on any transaction. But the question is, what kind of risky dollars do you start feeling a little anxious about?

Put another way, how much capital are you willing to lose an operation? The reason you have to ask yourself this is that it will not always fit perfectly with the percentage you have defined above. Let’s say your monetary threshold is $100. Any value above that and your emotions will start to bring out the worst in you. But in the $100 example is half of what your 2% rule tells you that you should risk…

For this reason, it is important to define risk in both terms: percentage and monetary value, and that you risk the least between them. Clearly, these numbers will change as your trading account grows, just be sure to redefine both whenever necessary.

Define Your Multiple of R

Your multiple of R is simply your profit-risk ratio expressed in a single number. For example, if you risk $50 on an operation and your potential gain is $100 (based on your goal), then your risk-benefit ratio is 1:2. In other words, the risk is half of the potential benefit. In terms of multiple of R, this would be a “2R”.

Another example would be to risk $70 to get a potential of $170. By dividing 170 between 70 we get a 2.4R. It is important to define a minimum ratio as part of your trading plan. We recommend 2R, but of course, we each apply the value that best suits you. The higher the value R is the better.

Defining Entry Rules

How are you going to enter into the trading strategies you previously defined in your plan? Let’s take an example, if any of your strategies are pinbar, what kind of input method will you use? Will you enter a “nose” break of the pinbar or perhaps prefer to enter in the middle of it?

If you are open to both methodologies, you should also define when to use each of them. What market conditions justify using the method of entering the middle of the pinbar? What market conditions must be present to justify entering a pinbar nose break?

Defining Output Rules

This is one of the most misunderstood rules when we talk about drawing up a trading plan. Why? Because too many people are so obsessed with developing a setup to operate that they completely forget to look for outlets before entering the market. Although most traders are excellent at finding a possible way out, everyone likes to see how much money they have a chance of making on each operation. But not defining an exit point will prevent you from defining your R-value based on your potential loss.

In this heading of your business plan, you will want to define where the stop loss will be located as well as how to define your objectives. Speaking of objectives, you’ll also want to define in detail how you plan to get out of a winning operation. Will you go out of position completely to the first target achieved, or will you close only half of the position and keep the other half in play? These are questions that need an answer.

Risk Management

Setting rules to manage your risk is an essential part of a good trading plan. Even though you have already established where you will place your initial stop, you will also want to define how you plan to modify it as the operation develops, if you wish to do so. For example, you could use the highs and lows of the previous days to move your stops to safe places and insure profits.

The issue of risk management is what makes a trader. As we said before, it’s not your percentage of winning operations that makes you consistently profitable, but the amount of money you make with a favorable operation vs. the amount you lose with an unfavorable operation averaged over a long series of operations. And the only way to put the scales in your favor is with a solid plan for your risk management as well as a disciplined approach to implementing your plan.

What you do after each operation is as important as the way you mentally prepare before the operation. One of the most important rules is how long you will take away from your trading place before entering the next transaction. This is very important! After losing an operation, you may be tempted to take revenge and take back what you’ve lost. This is usually called revenge trade and is one of the reasons why so many traders fail.

The urge to jump immediately to the market after a winning operation is also very strong. This impulse is caused by 2 thoughts:

You feel invincible. That feeling that everything is going as you expect, so why not take another operation and earn even more money?

Building trust is one thing, but not being able to recognize overconfidence in key situations is called arrogance. And this one has no place in the forex market.

You feel like you have extra money to spend. The profits made in the last operation give a feeling of “I found money”, then no problem if I return some to the market. We call this “casino mentality”. It’s the same feeling that casino players get after winning $500. Instead of leaving with that money won, they immediately bet the $500 just to lose everything and a little more. You must use this part of your operations plan to redefine how to mentally prepare for the next operation.

Summary

The hardest part of writing your own forex trading plan is not defining your rules. The most difficult part is to include enough details to make it effective and yet be concise enough for you to use in practice. Remember that the idea behind putting together a trading plan is so you can go over it daily. This means that it must occupy 1 page (or 2 at most) and must be somewhere that is visible to you. It is our wish that this article has given you some practical tips on how to write a forex trading plan.

Categories
Forex Trade Types

Taking Profit in Forex with Dynamic Stop Losses

Many traders will agree with me that one of the most difficult things in Forex trading is the placement of Stop Loss and the levels of take-off. Much of the educational material for learning foreign exchange is focused on how to find the right spot to place an operation. 

While it is true that the entry point is very important, the management of a good trade -that is, the good use of the Stop Loss and the levels of profit taking, changing these levels appropriately as the operation progresses- is equally important. It is quite possible that, even if you get the tickets right, you will lose money in general. Assuming you have a good entry strategy, how can you exploit it to the fullest? Is there a better or more dynamic methodology than just placing a Stop Loss and profit-taking levels and forgetting? There is, although this may be a challenge as the “place and forget” methods are psychologically easier to implement.

This is as important as the analysis one would make before opening a position. In this article, we present a brief guide on how to make the placement of the Stop Loss and the levels of making profits.

Stop Loss (SL) or stops is defined as an order you say or send to your Broker telling you to limit losses in an open position (or trade). Taking profit (TP) or target price is an order you say or send to your Broker, informing you to close your position or trade when the price reaches a specified price level on the profit. The right place for the Stop Loss and the profit-taking levels are of a static nature. In other words, orders are activated (and their operation is closed) when a security value reaches a specified price level.

Dynamic Stop Loss

It is a good idea to never operate without a hard Stop Loss, for example, that is properly registered on your broker’s platform for execution unless very small position sizes. This is an essential point for controlling risk in Forex operations. Imagine the Trade without a shutdown, which could potentially drain your entire capital. Similarly, imagine that you don’t trade without a target price, which basically exposes your entire account’s equity to market fluctuations.

The Stop Loss can be dynamic, as a way to ensure profits in a transaction that progresses in a profitable way. However, the Stop Loss should be moved only in the direction of reducing losses or blocking profits. This way, a trade with good performance will end up giving benefits. This is of course an excellent way to leave an operation ends with a “natural death,” rather than aiming for profit goals that can be very difficult to predict.

An example of a dynamic stop loss is the Trailing Stop. This can be placed on a certain number of pips or based on the average measure of volatility. This last option is the best. Another example would be to move the Stop Loss level periodically so that it is ahead of the main maximum or minimum or other technical indications. The advantage of this is that the operation is kept alive as long as it performs well. When a long operation begins to break through the key support levels, then this type of Stop Loss is hit and ends the operation. This method is a way to let the winners run and stop the losers in their tracks.

Dynamic Profit Taking (Take Profit)

First of all, it is worth asking why you should use Take Profit in Forex. Many traders usually use them instead of moving the Stop Loss and letting the operation end up that way, for the sole reason that the latter method means they always give up a little floating profit. But why cut a short winner? You might think that the price will be directed only at X level but, what if it actually goes ahead? If you list your last hundred operations, I will almost guarantee that you will see that the use of some kind of Stop Mapping would have generated more profits than even your wisest Take Profit command application. Of course, if your style of negotiation is very short-term, profit-taking orders make more sense. However, if you let winning operations run for days, weeks, or even months, then taking profit really does nothing but exacerbate your fear and greed.

There is a possible compromise. You may want to use dynamic pickups set in locations relatively far from the current price, which could be reached by, for example, a sudden news spike. This could get you some nice benefit at the peak, and allow you to re-enter at a better price when the turbulence passes. This is the most suitable use of Hard Take Profit commands within “non-scalping” negotiating styles.

You can also use the soft profit taking levels if you manage to see the price make a good end long candle. Such candles can often be good points for quick departures and reentry as described above. Note, however, that this tactic requires real skill and experience to be used in Forex markets, being a dangerous path for novice traders.

The Trading of Darwin

Charles Darwin’s theory of evolution suggests that the fittest elements within a species are more likely to survive. We can all see this when we plant plants in a garden. Usually, the baby plants that look stronger and taller are the ones that eventually become the best specimens. Skilled gardeners will remove diseased and weak plants and leave the strong ones to grow and harvest when they begin to die. Profitable forex trading is known as “Darwin trading” can be achieved in exactly the same way, by using a combination of soft and dynamic stop loss plus take-profit orders to effect pruning and harvesting, cutting down losers, and letting the winners keep running. A Stop Loss that results in profits can be called a take-profit order when you think about it.

Case Study

In Darwinist operations, the strongest operations survive, and the weakest artists are sacrificed. We can show how you can improve results using “Darwin trading” techniques using the last three years of the EUR/USD currency pair as a case study. 

Long operations began when a fast exponential moving average crossed a slow simple moving average in the hourly graph, considering that all the higher time frames were also aligned (up to and including the weekly time period). An initial hard Stop Loss equal to the 20-day Average True Range was used.

The results of the tests were very positive: of a total of 573 operations, 53.40% reached a profit equal to the hard stop loss and 25.65% reached a profit equal to five times the hard stop loss, before arriving at the hard stop loss. These results clearly show why it is much more profitable to let the winning operations run.

Now, let’s analyze the number of operations that showed benefit 2 hours after entry. Only 48.31 percent of operations fit this category. However, if you look at all the operations that finally hit five times the hard stop loss, you see that 57.44% of these operations made a profit 2 hours after the entry. Five times the average real range is well beyond the average two-hour volatility, so there is an impulse factor.

Categories
Forex Indicators

How To Use the ADX for Forex Day Trading

All that glitters is not gold, they say. The same often applies to everything that is popular. And, if nothing else, ADX is one of the more popular indicators on the market.

Still, is there a way for us to use this tool effectively?

Traditional ADX Indicator

The average directional index (ADX) was developed more than 40 years ago. Nowadays, this tool is typically used by technical traders to measure volume. 

ADX consists of two main components – the ADX line and Directional Index (DI). The indicator aims to show trend strength and trend direction.

ADX line

The ADX line is a single line with a range of 0—100.

As this line is non-directional, it can only show trend strength. Therefore, while it measures the strength of the trend, it cannot distinguish between uptrends and downtrends.

So, the ADX line will rise during both a strong uptrend and a strong downtrend.

When the ADX is above 25 (like in the image below), the trend is strong enough to apply trend following strategies. However, traders who want to get faster signals often use the 20 ADX threshold as well.

When ADX is below 25, the market is in the consolidation stage. The image below portrays this well and, as we can see, there is a lack of a trend. With trends involving ADX below 25, we can no longer apply trend trading strategies but the strategies for ranging markets.

Directional Index

When the ADX is above 25 and the positive directional indicator (+DI) is above the negative one (-DI), the ADX measures the strength of an uptrend. The cross between the two DIs, together with the ADX line that is higher than 25, resulted in an excellent bullish move.

When the ADX is above 25 and +DI is below -DI, the ADX measures the strength of a downtrend. 

Values higher than 50 ADX indicate a very strong trend.

Important Facts

ADX should only be used with higher time frames because it tends to give false information on lower time frames. 

The ADX has a tendency to lag and the volume meter is generally very slow, which can lead you to enter the market too late.

The strategies used with the traditional ADX alone are insufficient and can offer a lot of false signals, but the ADX indicator can be used with other tools to obtain better signals.

Alternative ADX Uses

ADX + MA

ADX can serve as an example of how you can apply the moving average (MA) to a volume indicator

In the example below, we removed the ADX line (25) and added the MA, keeping the period at 10.

As ADX does not perform well during market consolidation, it would take a lot of time to go below that line and inform the trader that it is not a good time to trade. That is why traders take many losses with ADX alone when the market goes sideways.

Although this combination is not the best tool you can use, ADX has proved to perform better after the changes have been made.

ADX DMI + OBV + MA (100)

OBV (on-balance volume) shows whether the volume in the market is flowing in or out of the instrument.

The moving average (MA) of 100 is applied to determine is the momentum in the market is bullish or bearish.

A signal to enter appears when the two indicators indicate the same thing.

This strategy, however, always requires higher time frames as well as an instrument with some volatility and a high ATR.

Needless to say, traders must always use risk and money management skills to protect their trades from false signals and limit any potential losses.

ADX + RSI

Wait for the reading to get the ADX of 25 to know you are in a strong trend and that the trend is likely to develop. 

Use the last 50 candlesticks to determine the trend. Therefore, if the price is heading lower during the last 50 candlesticks, you are in a bearish trend. 

We will ignore the typical rule for using the Relative Strength Index (RSI) as we normally interpret the RSI reading below 30 as an oversold market and a reversal zone. To get an entry signal, use the same settings for both RSI and ADX.

Sell when the RSI indicator breaks, showing a reading below 30.

We will also add a stop loss for maximum protection. To determine the best location for your stop loss, find the last high of ADX before the entry. Then, identify the corresponding high on the price chart from the ADX high and place your stop-loss point there.

We will take profit after the ADX indicator breaks back below 25, which tells us that the strength of the prevailing trend is decreasing. You can also consider RSI going back into the normal zone as the exit point.

For a buy strategy, apply the exact opposite.

Non-Traditional ADX Indicators

ADXm

Unlike the traditional ADX indicator, which makes it hard to see where the market is headed, ADXm clearly shows both positive and negative ADX half-waves (colored parts of the line in the chart below).

ADXm uses the same method as the traditional ADX. We will use a reading of 20 to 25, depending on the time frame.

The original and this improved version differ with regard to price options. While the traditional ADX offers no price options (i.e. it uses fixed close, high, and low for circulation), ADXm allows traders to use three prices – the price for close, high, and low. 

Still, there are also many similarities between the two (e.g. the results, if default parameters are used).

DMI Oscillator

The original ADX uses SMMA (i.e. running MA or Wilders EMA), while DMI Oscillator allows traders to experiment with the other types of averages as well. 

The improved version also lets traders smooth the results of the oscillator. Moreover, it offers three different color options – on levels cross, zero cross, and slope. Change alerts are triggered according to the trader’s choice of color.

Traders seem to love DMI Oscillator because they can apply different strategies (scalping, swing trading, short term trading, binary trading, etc.) on different time frames and regardless of candle behavior.

Conclusion

The ADX indicator is great for determining trend strength – both bulls and bears at the same time. 

While it is good for identifying trending conditions, the traditional version of this tool may lag quite a lot. Not only does it often cause traders to enter trades too late but it also gives too many false signals, which then result in losses.

The daily time frame is the best option for using the ADX because it offers the least amount of inconsistency and incorrectness. 

The best profits come from catching strong trends and, with the right ADX strategy, you can accomplish your trading goals.

Since the standard version of ADX does not contain all data for the analysis of price action, it must be either used with other tools/indicators or simply replaced by a more recent, modified version.

It is extremely important to note that ADX (in particular) requires traders to rely on money management and risk management – especially with the original version. As Peter Borish says, we want to perceive ourselves as winners, but successful traders are always focusing on their losses. We cannot let the possibility of getting a false trend stand in the way of our (and our account’s) growth.

Finally, all indicators are just tools. We should use them only if they benefit us. Test ADX as well as all other ADX versions and tool combinations, and leave out anything that you feel you cannot use optimally.


Categories
Forex Market

Five Ways to Survive and Thrive in Extreme Volatility

Market volatility can be both a blessing and a curse, Many traders out there trade only in the most volatile of conditions, while others get hit pretty hard when it takes them by surprise. The volatility of the markets at what give us our profits as well as our losses, so it is important that we have an understanding of how to control our trading during times of volatility and also how to potentially predict it to help us get through it with as little damage as possible. Volatility has caused a lot of accounts to blow in the past and it will cause a lot more to in the future to, so that is why we are going to look at different ways that you can help prevent it from happening to you.

Limiting Trade Sizes

The first thing that you can do to help protect yourself and your account during these volatile times is to limit your trade sizes. The larger your trades are the more danger you will be putting yourself in. During extreme volatility, the markets can jump up and down in pretty large chunks. This is something that can be pretty deadly when it comes to an account that is using larger trade sizes. So in order to combat this, we need to ensure that we are either using the appropriate trade sizes for our account or if we often use larger ones, to try and reduce them during these times. This will then prevent any larger losses should the markets jump in the opposite direction. It will, of course, reduce any profits should go the right way, but during these extreme times, it is important that you protect your account above all else.

Sit Back and Watch

Sometimes you just need to step back and watch. The markets can be a dangerous place to trade, and knowing when things might be a little too much can be a great trait to have as a trader. Not every situation will merit a trade. In fact, when times are really extreme, it can often be better to simply not trade at all. Why risk what you currently have in order to make a bit more when the conditions are so volatile? Protect what you currently have and sit out the markets this time. You will have plenty of time to make some more profits once things have settled down again. You also need to consider that your trading plan probably didn’t take these extreme conditions into consideration, so you will be kind of trading blind, which is an increased risk in and of itself.

Always Use Stop Losses

When it comes to managing risks, ensuring that you have stop losses in place is vital. You should be using stop losses anyway, as this is an integral part of trading. If you aren’t using them, then you are trading wrong and are putting your account at risk with every single trade. This risk is multiplied tenfold when it comes to volatile conditions. If you are going to be trading during these conditions then you have to have them in place and you have to have them with every single trade that you place. I know we are repeating things, but you should not be placing any trades without a stop loss being in place. Protect your account before you think about making any additional profits.

Monitor the News

Monitor the news. Often, during times of extreme volatility, there is a real-world event that is causing it. This could be something like an economic news release, or it could be a disaster such as an earthquake somewhere in the world. Whatever it is, there will be news about it, and being on top of this and understanding what is going on can give you a big advantage. Normally when there is a lot of volatility, people are jumping in trying to make a quick profit, not really knowing or understanding why the markets are behaving the way that they are. This can be used to your advantage. By understanding what is happening, you are also able to gauge when the sentiment may change, allowing you to trade in that direction and profiting from people trading the current movement. Of course, this comes with risks and you may be potentially trading against the trend. The markets do not always react the way that you would expect, but it can be an advantage to understand what is happening with the news nonetheless.

Diversify Your Portfolio

Something that you probably would have been told at some point is to diversify your portfolio. When it comes to trading forex, this would simply mean that you are trading more than one currency pair. This is a way of helping to protect your account as you are not putting all of your money on a single trade or currency pair. Volatility can of course affect all markets, but it can also be concentrated on certain currencies, meaning that while one pair may be going a little crazy, some of the others may be more stable. This could then mean that you are unable to trade the less volatile pairs while the volatile ones are doing their thing, or it could mean that you can counter some of the risks of the volatile pairs with trades on the more stable ones. Either way, it is good practice to ensure that you are diversifying your portfolio and expanding into more than just the single currency pair.

So those are five of the things that you can do to help you survive the markets when they are going a little crazy with volatility. There are other things that you can do, and your own style of trading will help you to get through it and to better understand what it is that you need to do in order to prevent the risks, but the five things we have mentioned are a good start and are generally relatable for everyone. We wish you the best of luck once the markets start picking up their volatility levels!

Categories
Forex Basic Strategies

Undeniable Proof That You Need A Trading Strategy

If you are new to trading or are simply thinking about joining and have spoken to another trader, they most likely would have asked you what strategy you are using. While for many it is quite a straightforward question to answer, for others it is not quite so simple. There are thousands of different strategies out there, and some traders even trade a hybrid of more than one strategy at the same time. What is important though, is that you have a strategy, no matter what it is, it is imperative that you have one, and we are going to be looking at why it is so important to have a strategy, no matter what it is.

Gambling Is A Loser’s Game

If we are to trade without a strategy, we are effectively just gambling. There is no other way to describe it. You are taking a wild guess at what the markets will do or you are using a hunch, but that hunch is based on no real facts or figures. Due to this, you are simply placing your bet and hoping that the markets go the right way. The problem with this is that the markets like to move how they want to move and they do not always move in one direction for long enough for a gamble to be effective. What’s worse is that if your first trade losses, you will simply place another trade with no real reason behind that one either. You need to lose a strategy, the strategy gives you rules to follow and ensure that your trades have the best opportunity to profit, rather than simply placing trades and hoping that it is a loser’s game through and through.

Strategies Give You Rules

One of the things that a strategy will give you are rules, house rules are there to ensure that your trades are consistent and that the trades that you are putting on have the best opportunity to be profitable. When we have a strategy in place when we place a trade that is not in line with the rules that we have set out we consider it a bad trade. We are trading outside our strategy and so the profitability factor or risk and reward ratio of that strategy is no longer accurate making it far harder for us to keep track of how well the strategy is doing or how well we are doing as traders as a whole. Once you have set rules, stick with them, this is the best thing that you can do in order to ensure that you remain profitable.

Strategies Give You Stability

The rules that we set out above are there to give us stability. Those are the main reasons behind them, and due to that, using a strategy gives us a lot of stability when it comes to our trading. It makes us consistent in the trades that we are making. It ensures that we are always placing good trades and ultimately it can make our profits and overall capital a lot more stable.

Strategies Protect Us

A major part of any strategy is the risk management that comes with it. The risk management part of strategies are there to help protect your account, they include things like your risk to reward ratio, stop loss locations, and other elements like that. All designed to limit the amount that you can lose with each trade and to ensure that you do not blow your account too quickly. We need to trade with risk management within our strategies, if we don’t, no matter how good a strategy actually is, a single trade can actually cause you to completely blow your account.

Strategies Help You to Focus

One fantastic thing that strategies help us to do is to focus, they help us to avoid distractions and they help us to concentrate on what it is that we need to be doing, rather than looking elsewhere. We know what we are looking for in the markets, and exactly what we need to do. This really helps us to focus on what we are doing which in turn can make us a lot more efficient in our trading.

They Can Save You Time

When you use a trading strategy you will know what you have to do. This will help to save you time from analysing or looking at things in the arts that you certainly don’t need to. Much like when we mentioned keeping focus above, using a strategy can help you to save time as you are focused on what you are doing. It also helps you to avoid some distractions. There have been plenty of times then we have wasted a lot of our time by looking at things that are completely irrelevant to our actual trading, the strategy helps you to avoid doing this. At least not all day like we have been guilty of before, ending up with no trades for the entire day.

They Help You Learn

Many people think that strategies are only there to help us to trade, but they also help us to learn. They help us to better understand why the markets may be moving the way that they are and they help us to better understand the way that we trade. The more strategies that you learn and understand, the more of an understanding of the overall markets you will have. Multiple strategies also give you more of an opportunity to trade in different trading conditions, allowing you to be far more profitable throughout the year than you would using just one or even no strategy at all.

Those are just some of the reasons why you should be using a trading strategy, they can be relay helpful in your trading, your results and overall they are what make us traders, as long as you are using one you should be on a positive step towards being profitable, just try to avoid trading without one, that is simply gqambling and will only lead to losses in the long run.

Categories
Beginners Forex Education Forex Basics

These Small Changes Will Make a Huge Difference in Your Profits

It’s no secret that every single forex trader wants to make as much money as possible, otherwise, what’s the point? Even if you’re already bringing in consistent profits, you might be surprised to learn that there are some very simple changes you can make to put more money in your pocket. If you’re a beginner, this could even be the difference between having a positive or negative profit ratio. Would you put in the effort to make the difference? 

Change #1: Use a Simple Trading System

It might seem like more complicated trading plans bring in more money. After all, these plans seemingly account for more factors and are more technical, so it’s easy to think that they’re better. In reality, simplicity is key to making consistent profits and avoiding all that unnecessary confusion. If you know what you’re doing, you’ll be less stressed and you won’t have to spend as much time in front of your computer screen, so this is definitely a win-win for everyone. If you’re currently using an overcomplicated plan, do yourself a favor and switch to a simpler version.

Change #2: Trade During the Best Times

Did you know that there are certain times when it’s better to trade? The best trading times occur whenever sessions overlap and things tend to heat up towards the middle of the week. Mondays and Friday evenings are slow, and nobody wants to trade on the weekends, so you should give yourself the much needed time off when there aren’t good trading opportunities. Other times to avoid trading? Major holidays and whenever big news is expected to be released. If you trade during the best times and avoid the worst ones, you’ll be able to profit more efficiently without making the mistake of trading in more volatile market environments. 

Change #3: Check Your Broker’s Costs

Whether you recently signed up with a broker or you’ve been using the same one for years, it’s a good idea to go back and check out their rates, then compare them with a few other options. You might find that switching to a new broker will save you a ton of money, plus, several new companies have probably opened up since you opened that old trading account. Say your broker charges a 5% withdrawal fee for withdrawing via card but you’re able to switch to a broker with no withdrawal fees. Or perhaps you could save 0.5% or more on the spread or commission charges. At the end of the day, these small changes will really add up and leave you with more of your money. Another added bonus is that your new broker may offer some extra perks like a deposit bonus that will add to your money when you switch over. 

Change #4: Limit the Pairs you Trade With

Some traders like to trade a variety of assets, which can be profitable, but it might be more helpful to stick with around three pairs so that you don’t have to keep up with as many factors affecting prices across different markets. If you’re able to focus more clearly on what you’re trading, your profits are bound to increase as you’ll avoid missing out on important news or becoming overwhelmed. 

Change #5: Make Smarter Leverage Choices

The more leverage you use, the more money you might make…or lose. If you’re looking to increase your profits, now is a good time to consider the leverage you’ve been using and to think about your profits. If you’ve been losing money, you might want to lower the leverage you’re using, as this will lower the amount of losses you take from losing trades. On the other hand, those that are making consistent profits might want to increase their leverage slightly, as these traders are more likely to benefit from doing so. Every now and then, you can increase your leverage in increments as long as your profits stay consistent. 

Change #6: Be Patient

Some traders have a difficult time sitting around without entering trades, especially after some time has passed. However, you shouldn’t trade for the sake of doing so. If the market isn’t throwing out any good opportunities, simply don’t trade. Otherwise, you run the risk of losing money on a trade when you could have opted not to trade at all. In times like these, remember to stick to your trading plan and know that the market will give you more opportunities later on. 

Change #7: Never Stop Learning

It’s easy to start thinking you know everything you need to once you’ve been trading for a while with consistent profits; however, you should never stop seeking out more trading knowledge. Learning about trading psychology and reading about different or new kinds of strategies are a couple of examples of topics you can look up, but you shouldn’t stop there. The more you know, the more chance you’ll have to increase your profits, and you might even find a better trading system along the way.

Categories
Forex Basic Strategies

Optimization Vs. Over Optimization

Today we discover the dangers of optimization: over-optimization. That’s the secret to making our system robust, consistent, and quite durable over time, or a quick way to lose your capital. It’s a fine line we shouldn’t cross. Let us then see what requirements we must take into account and what precautions we must take during the creation of a system, either automatic or 100% manual. At what point does optimization appear?

When we are creating our trading robot, the first thing we do is determine how it starts making market entries, when it will come out with its corresponding motives (crossover, RSI, MACD, different timeframes, etc). Once this is done, we start with optimization.

Right now we are going to adjust the robot to each market, as it is quite difficult for them to behave in similar ways. Therefore, if hypothetically our robot enters by moving averages when we are optimizing, the program will tell us that moving averages have gone better and which ones have gone worse. It’s just in that instant that we’ll have to be very careful, because it is when the joys of seeing a system that has multiplied our capital by 4 in 6 months come, forgetting the rest of optimizations. Error.

What do we have to look at in optimization?

In the graph of the evolution of our capital. Capital should not have any operation that excelled from the rest notably. Trading is a work of constancy; we must never seek the ball, the trade of your life… if it comes, it will come. Imagine that our profit after a year (500 operations) amounts to 1,800€, but we see that with a trade or two we have made 2,000€. We are in front of a system that will rarely get super trades, but that for the rest of the time, will be a negative or near-zero profit system.

Another point that can help us identify whether or not we are over-optimizing will be to look at the values of nearby means and see what results there are. If the results are very uneven, be careful, it is very possible that we have over-optimized. It may be that the means 10 and 20 go very well and that the means 12 and 25, fail miserably. A good system has to keep these values quite similar, the more subsystems (system configurations), the better the overall result.

It is necessary to be careful that when we decide to optimize a variable, it must be directly related to the market, that is, that it is something measurable, some numerical value.

As an example of this point, we could optimize our trading system by the hour. The market does not know what time it is, nor is it sleepy, the market is there. We must draw a pattern of behavior from indicators, or whatever, that depends directly on the market. Not because it’s 9:00 in the morning the market is going to move or the other way around; not because it’s 10:00 at night, the market is going to be flat. There are trends day and night, although it is true that there are more during the day. If we decide to optimize by eliminating certain hours of the day, the days that for some unknown reason there is no trend, our system, if it is tendential, will probably suffer.

Time for backtesting and subsequent optimization. If our strategy is long-term, we must have at least 200 trades, at least. With less, it is impossible to get reliability from that system. It is estimated that the robot continues to operate for a period of approximately 1/3 to 1/8 of the total simulation. If we do a test of 8 months, at least the system should work from one month to almost 3.

If after optimizing the system does not work, nothing happens. I know, it’s nice to see how your system in the past could have made a killing, but now it’s no good. It was a combination of trades that might happen again, but maybe 20 years from now. Are you going to be losing money for that long?

The last thing, I was looking for images to illustrate the post and I remembered the most over-optimized systems that exist, the trading robots that are sold online. 95% are scams. With phrases like this: “I doubled the capital, in 6 months” and a guy smiling with money, people go crazy. The final part of the advertisement says: “For only 29,95€”… If the programmer had a system that doubled the capital in 6 months, it would be cheaper for him to go and ask for money in the bank or wherever. I put the photo here, so you can see the graphic they show on their websites. Good and functioning robots make money in the long run, but they are not exponential and perfect trend lines, without any failed trade.

Categories
Forex Basic Strategies

How to Measure Your Trading Strategy with “R Square”

Chances are if this is the first time you’ve heard that square R, you have no idea what exactly I mean or where the thing is going. It is normal, there is much written about supports, resistances, chartist figures. but not so much about more objective indicators. The subject is a bit technical, based on mathematics and statistics, but I’m going to (try) explain it in a practical and straightforward way. In the end, everything is easier than it looks.

What is the R Square?

First, let’s start by defining and understanding the concept of R Square. R Square is a coefficient of statistical determination, also represented as R2, which allows us to predict some results or test a hypothesis. In other words, when we analyze a statistical model, the square coefficient R determines the efficacy of the model (which is so good) and also expresses the percentage or proportion of variation results that are explained by this model.

With this definition clear, in order to use this coefficient R square in practice, it is necessary to understand two important concepts:

Linear Regression: In statistics, a linear regression, also known as linear dependency, is a mathematical model used to approximate the dependency relationship between a dependent variable (for example Y), independent variables (X1,X2,X3,ǐ.Xn) and a random term ɛ (associated with any process whose outcome is only foreseeable in the intervention of chance).

Pearson correlation coefficient: Speaking of statistics, the Pearson correlation coefficient is a linear measure of the degree of relationship between two quantitative random variables, that is, two variables that can be measured or observed and also represented by numerical quantities.

Now, defined these concepts, you may be wondering: How to use this to evaluate my trading system? Step by step.

Each trading strategy or system needs an objective assessment of its effectiveness. In order to achieve this goal, we could get to use an extensive range of ratios, some more complex than others, both in their calculation process and in their interpretation. Despite all this variety, there are very few quality metrics to evaluate something very important: the regularity of the system’s balance line or trading strategy.

To do this, let’s manage the coefficient of determination, R square, to calculate the quantitative estimate of that ascending straight line that all traders want to see in our results.

Characteristics of an Assessment Criterion for Trading Systems

Each criterion or ratio used to evaluate the effectiveness or robustness of a trading system has its limitations in application. There are no ideal or pre-established criteria that allow us to determine with absolute certainty the robustness of a trading system. However, some properties or characteristics may be formulated that must have:

Independence in relation to the duration of the probationary period: Many parameters of the trading strategy or system depend on the duration of the trial period, for example: the longer the trial period for a profitable strategy, the greater your net profit. Independence from the time period is necessary and essential to compare the effectiveness of different strategies in different trial periods.

Independence of the end point of the test: For example, if the strategy «plays» with which simply exceeds the losses, the end point of the test can considerably change the final balance. The criterion or indicator should be immune to such machinations and provide a clear picture of the trading system’s work.

Simplicity of interpretation: All indicators of a trading system must be quantitative, that is, they must be represented by a certain number. It is important that this number is intuitively understandable. The simpler the interpretation of the value obtained, the easier the parameter to understand. It is also desirable that the value of the indicator is within a set range or a defined range, as it is more difficult to understand the meaning of extremely large numbers.

Representative results with few transactions: This is probably the most complicated requirement to meet in the list of features for a good metric because all statistical methods depend on the number of measurements. The higher the measurements, the more stable the statistics obtained. It is virtually impossible to fully solve this problem in a small sample, but you can soften the effects that arise due to a lack of data.

Linear Regression Application

To calculate the coefficient of determination R square, we must calculate or determine the linear regression. As explained above, there may be several independent variables, however, for a better understanding we will use the simplest case: A single independent variable.

In the case of an independent variable, the linear regression or dependence of a dependent variable (Y) on an independent variable (X) can be expressed by the formula Y=aX+b. This formula graphically represents a line in the XY plane, hence the name linear regression.

Now we will choose on our trading platform a chart of a currency pair, of our preference, with a clear upward trend in a given period of time. We download and save this data, then build a chart in Excel with closing prices. On the Y-axis we will have the closing prices and on the X-axis the dates that we will replace by order numbers (for convenience: 1, 2, 3, A). In doing so, we’re going to get a chart with a clearly bullish trend, but we’re interested in a quantitative interpretation of that trend.

The easiest way to reach the target is draw a line that will be more precisely adjusted to the trend obtained in the chart. This line is linear regression. If the graphic is fairly uniform one or more straight lines can be drawn that fit or describe our bullish graphic. Then a question arises: which of these lines is correct? The correct line shall be that straight line where the sum of the distance of the existing points to the line is the minimum distance.

It is also important to note that the regression line must always pass through the center of gravity of all the data that make up the point cloud. The coordinate of this point of gravity would be on the x-axis, the mean of the x-variable, and on the y-axis, the mean of the y-variable. Knowing a point of the line we can use the slope point equation to determine the line equation. By getting the correct line we can calculate the coefficients of the linear regression.

Pearson Correlation Coefficient

Once the linear regression is calculated, we have to calculate the correlation between the line obtained above and the data on which the line was calculated. Let us remember that correlation is the statistical relationship between two random variables. The correlation can take values ranging from -1 to +1. A value close to zero means that there is no relation between the measured values, a value of +1 (or very close to it) means a direct relation of the variables and a value of -1 (or very close to it) means an inverse relation of the variables.

The Pearson correlation coefficient could be calculated by means of the following formula:

Where: XY – is the covariance of (X, Y)

X: is the standard deviation of the variable X

Y: is the standard deviation of the variable Y

Covariance is a value that indicates the degree of joint variation of two random variables with respect to their means. In other words, it is the common variance between the variables and the standard deviation is the square root of the variance.

The Pearson correlation coefficient shows how far the line describes the data. If the data points are at a large distance from the line, the dispersion is high and the correlation is low and conversely, if the data points are at a small distance from the line, the dispersion is low and the correlation is high. A value of zero says there is no relationship between linear regression and data.

Importantly, in Metatrader there is a metric called LR Correlation and shows the correlation between the balance line and the linear regression found for that line. However, in the statistics, they do not usually directly compare the data and the regression that describes them.

Calculation of the Coefficient R Square

In the case of linear regression, to calculate the coefficient of determination R squared is sufficient by squaring the Pearson correlation coefficient that we calculated in the previous step.

This coefficient can take values ranging from 0 to +1, being a result equal to zero or very close to zero pure random unpredictable and a result equal to or very close to one a market in which all quotes are placed on the line. R square shows us what percentage of the price movement follows a definite trend, while the rest of the percentage will be due to random movements.

Limitations On Use

Each statistical metric has its advantages and disadvantages and the coefficient of determination is no exception. Some disadvantages are:

  • They depend on the number of trades. Exaggerate indices with few trades.
  • For calculation, complex mathematical computations are required.
  • It is applicable exclusively for the estimation of linear processes, or systems trading with a fixed lot.

Application in Trading Systems

In trading systems you can see this ratio represented in percentage, which the closer to 100% the better (in theory) is the quality of our system. In my experience, a system with a score above 65 usually has a fairly stable performance over time. It’s one of my favorite filters.

Conclusions

After analyzing and studying the process of calculation of the coefficient of determination R square I can tell you that this coefficient is one of the few measures that calculate the regularity of the curve both of the line of the balance sheet, and of the unrecorded benefit of the strategy (among others).

R² is easy to use because its range of values is fixed and is within the limits of -1 to +1. Values close to -1 alert us or warn us of the negative trend of the balance of the strategy. A value close to zero warns us of the lack of trend in the balance sheet of the strategy. Values close to +1 warn a positive trend.

As I have told you, the square R, like any other ratio, has its limitations that you must take into account. In my case I use it as a top 3 ratios to measure if I have a valid trading strategy or if instead it goes to the trash.

Categories
Forex Basic Strategies

Profitable Forex Strategies That Nobody Tells You About

There are a lot of factors that can make or break your chances of success in the forex market, from the amount of money you risk to your general knowledge of what moves the markets, and everything in between. One of the most crucial keys to success is to trade with a solid trading strategy that has been tested and proven to actually bring in profits over a period of time. 

Forex traders typically base their strategies on two different types of data. Fundamental strategies consider economic data and data that is affected by businesses, while technical analysts use indicators and study historical price data. Trading strategies consider data based on their chosen method and then provide traders with techniques that tell them when to enter or exit the market in order to make a profit. Your trading strategy will guide you and ensure that your trading decisions are structured and based on as much fact as possible to increase your chances of making money. 

If you search for trading strategies online, you’ll find a long list of options. The choices can honestly be overwhelming for beginners, as there are so many different factors to consider when choosing a strategy. There is no one-size-fits-all method, as every forex trader has different needs and thinks from a different perspective. So which strategy should you choose? Below, we will break down three of the best trading strategies out there so that you can decide for yourself based on your own personal preferences. Keep in mind that many veteran traders might not tell you about these choices, as many professionals prefer to keep beginners out of the loop when it comes to top-rated trading secrets for success. After all, it is a competitive industry.

Not Sure Which Trading Platform to Use? Try MetaTrader 5

MetaTrader 5, or MT5, is one of the most popular trading platforms out there, right alongside its predecessor MT4.  MetaQuotes developed this platform to offer more financial instruments, trading tools, and resources. Here are a few of the highlights that influence our love for this timeless trading platform:

  • Provides access to a wide variety of forex, stocks, CFDs, and futures
  • Offers a navigable interface with 21 timeframes and 6 pending order types
  • Supports robotic and algorithmic trading
  • Allows hedging and netting
  • Supports 36 technical indicators, 44 analytical objects, and an unlimited number of charts
  • Built-in economic calendar for quick access to important news data
  • Can be accessed through a web browser, desktop version, or on mobile devices and tablets

When compared to other options out there, MT5 truly offers more services and resources to traders, making it a great tool for success if it is incorporated into your trading routine. If you do plan to use it, you can find many video tutorials on YouTube that will teach you how to use the platform efficiently. The best way to use the MT5 platform is to open an account through a broker that offers it so that you can trade on MT5 for free, as licensing fees can be expensive. 

Using Trading Signals

A trading signal is a suggestion to enter a trade that is typically delivered to the trader through a phone or email alert. The suggestions come from expert traders that have personally analyzed the market based on their own ideal sets of data so that you don’t have to. This concept is especially helpful for beginners that may not completely understand the market or for traders that just don’t have the time to sit around analyzing charts and data all day long. Many traders consider signals to be a shortcut to success that takes away from the overall time spent trading, as long as a profitable signal provider has been chosen. 

Experts that create trading signals do so to help other traders, but there is usually a cost of these services. Keep in mind that some signals are free, while most cost money, but you shouldn’t blindly trust every signal provider that’s out there because scammers are involved in the market. Before choosing a provider, you should read online reviews about their services and take a look at their overall reputation, especially if it is a paid provider. 

One-on-One Training Sessions

Some traders overlook the benefits of personal one-on-one training sessions with professionals for a few different reasons. One of the most common reasons is that these sessions usually cost money, although some brokers will offer you free sessions if you make a large enough deposit with them. It’s true that there are many free resources available online, but you should stop to consider some of the benefits of one-on-one training:

  • You’ll be mentored by a veteran trader that knows the market inside and out.
  • You can ask personal questions and receive professional-grade advice.
  • Your coach will teach you basics, market fundamentals, and everything you need to know.
  • Your mentor can suggest profitable trading strategies you might not have heard about once they learn about your personal trading style.
  • You’ll learn to use technical indicators and how to effectively analyze the market for trends and directions.
  • This is one of the best ways to get hands-on practice in a live market environment.
  • You’ll receive tips that can help you to achieve profits on the same level as expert forex traders.

The Bottom Line

If you want to get the same results as a professional trader, you’ll need to trade like one. The three professional-grade strategies we’ve outlined above can help you get off to the right start in the financial markets, as long as you take the time to practice them effectively.

Categories
Forex Risk Management

Best Trading Position Part 3 – Risk in Parallel Trades

If you are reading this article, you must be serious about trading. Did you know that curiosity and eagerness to learn are the two crucial components of being a successful trader in the long term? Since this is our part three discussion on the best trading position, we are continuing our journey of discovery, listing proven ways to achieve sustainable success. Now, of course, there can be many different approaches to trading, but here you can learn what actually works. If you happen to be seeing this title for the first time, make sure that you go back and read the story from the beginning, covering parts one and two as well, along with related exercises

Last time we talked about effective ways to protect your trades, deepening the story about the risk and introducing the topic of stop losses. What we did not talk about in the previous article is that traders often wonder about exiting trades, fearing that they might miss that one opportunity to preserve their assets. However, you will find that with the right system in place, you should always be notified before a particular trend or favorable period ends, so the price should not even hit your stop loss.

If the price ends up violently moving in a different direction from what you would want to, you still know that you would never lose more than 2% of your account if you set everything up the way we discussed earlier in this series. That is what the ATR indicator we previously talked about is about, helping you manage and adjust to volatile markets regardless of the circumstances. Now, besides general risk and exiting trades, there is another key question to ponder about if you really want to protect your assets.

How many individual trades can I have open at 2%?

When traders read about the 2% instruction, they often fall for the trap of overleveraging, which tends to lead to really bad consequences. To understand where most traders fail, imagine that you entered three trades involving the following currencies: the EUR/AUD long, AUD/USD short, and AUD/CAD short. You assume that by opening three trades at 2% each, you are doing the right thing. Unfortunately, your thinking would be faulty here and you would add more risk instead of controlling it properly. Since there are three trades involving one currency (AUD), you now have a 6% risk in one asset. Therefore, please note down the following rule in your notebook: You can have as many trades running at the same time as you please, but you must never have more than one trade at 2% risk going long or short with the same currency.

What should I do if I am getting several signals for one currency?

There are a few solutions that you can always use in trading if you find yourself in a similar situation. For example, you can choose only one trade to enter. You can either make this choice freely or, if you need reassurance, compare the other two currencies in the pair and measure them against other currencies. So, if you are weighing between the AUD/USD and the AUD/CAD, compare the USD basket and the CAD basket to see which seems to be a better option

Aside from this approach, you can also opt for entering both trades but at 1% risk each. This is not only a wise way to control the risk when you have multiple trades open at the same time but also a form of a hedge, as you have one currency against two different ones.

What should I do when I almost get another signal involving the same currency?

First of all, you do not have to necessarily ignore all signals of this type. If you happen to get one signal for a particular pair, followed by something that may turn out to be a signal soon, you can always choose to play smart – enter one trade at 1% and wait to see what will happen with the other pair the following day. With such “almost signals,” it is always wise to give yourself space to gather more facts before you make any decisions.

Should I always enter trades at 1% risk only?

No, by no means should you enter all trades at reduced risk. Overleveraging is as detrimental to your account and development as is being timid. This mindset will not get you far, so make sure that you avoid seeing this as a form of protection because it is will hinder your growth, both in terms of your trading skills and your finances.

Regardless of your market of choice, you must always put your risk under control no matter how many trades you decide to enter. Greed can be a funny thing, especially when we don’t know what situations trigger our hunger for more. To have control over your trades, you must consciously choose to follow a specific rule and do so in a disciplined manner. And, on this note, we are going to end today’s lesson, leaving you with the task of trying out these methods with your demo account as soon as possible.

As we promised, we are offering you the right solution to the problem given in the last article of this series:

RISK = TOTAL ACCOUNT x 2% = 50,263 USD x 2% (0,02) = 1,005.25 ≈ 1,005

ATR = 86

STOP LOSS = ATR x 1.5 = 86 x 1.5 = 129

PIP VALUE = RISK ÷ STOP LOSS = 7.79 ≈ 7.8

Upon the completion of this task, we know that one pip should equal the previously calculated amount, so we can estimate that the unit value is going to be 78,000 (usually 0.78 lots) for the EUR/USD currency pair. 

P.S. Practice note-taking whenever you test a new method or approach in trading and watch for Part IV to follow.

Good luck!

Categories
Forex Basic Strategies

The Swap: 20% Yearly Gain Forex Strategy

Recently I came across a seemingly interesting trade strategy aimed at trading futures, but theoretically applicable to Forex trading. The author of this interesting strategy claims that, even with completely objective and direct rules, a “trend tracking” strategy simple and complete operated through a highly diversified group of liquid futures markets has produced an annual return of approximately 20% per year over the past two decades, significantly outperforming global exchanges and matching the type of returns produced by hedge funds of professionally managed futures following the trend.

As a professional in the world of Forex, I thoroughly researched that strategy to see what kind of margin it could have historically provided to Forex retail traders. The results are really encouraging because they show perfectly why it can be so complicated for individual traders to exploit margins that exist within markets.

For the sake of full disclosure I will show the rules of the entire strategy:

Risk: The 100-day ATR (Average True Range, or real average range) should be equal to 1 risk unit.

Entrance: long at the end of the day that closes above the highest closing of the last 50 days; bass player at the end of the day that closes below the lowest closing of the last 50 days.

Input Filter: long inputs only when the 50-day SMA (Simple Moving Average or Simple Moving Average) is above the 100-day SMA; short inputs only when the 50-day SMA is below the 100-day SMA.

Departure: You should use a 3-time 100-day ATR trailing stop from the highest price since the operation was opened (for lengths) or the lowest price opened since the operation was opened (for shorts). The final stop must be calculated consistently as a “chandelier stop” and should be a soft stop: an exit is only done when a daily lock is in or beyond the stop loss.

This strategy has been tested against the most liquid and popular Forex spot pair: EUR/USD, for a long and recent period of time (from September 2001 to the end of 2013), using publicly available EUR/USD cash data with daily opening and closing at midnight.

The results show that the strategy gives us a profit margin in EUR/USD during the trial period. More than 366 operations, a total return of 33.85 risk units achieved, giving an average positive hope per operation of 9.25%. This means that the average operation produced a return equal to the risky amount plus an extra 9.25% of that amount. Understanding that the strategy is quite mechanical and that it represents only one instrument within what is traditionally the worst-performing trend tracking asset class (currency pairs), this is not a bad result at all.

However, commissions and fees should be taken into account in determining the return that could have been truly enjoyed. Assuming that trading was carried out by a fund with EUR/USD futures contracts, and that:

-A quarter of the transactions were subject to “roll-over” before the expiry of the contract, causing an additional commission, and that a “round-trip” commission of $20 per transaction had to be paid, and that,

-An account of 10 million dollars was traded with each risk unit equivalent at 1% of the initial position size, then,

-The total return would be equal to $3,385 million, minus 366 operations multiplied by $25 each, representing commissions. This would mean a return reduction of only 0.1%, offering a total return of 33.75%. It could be assumed that if the “roll-over” strategies were very imperfect, there would be several additional losses.

Now imagine yourself in the place of a retail trader with a $10,000 account who wants to operate according to this strategy, using a retail currency broker. Fortunately for this trader, brokerage allows access to some sort of approach to a futures contract that can be negotiated with a very small batch size, as well as trading spot Forex with a very small lot, so there’s no problem with scalability.

The next step is to address some of the likely trading costs for the individual trader who is starting to implement this strategy in the same period in EUR/USD. The first thing we can see is the cost of using Forex in cash:

-Each operation involves a spread of 2.5 pips, and:

-Each position that remains open at the close of New York has an overnight swap cost that varies from one position to another, but roughly equivalent to three-quarters of a pipe for each night.

To simplify things we can do a rough calculation based on pips. The return calculation of 33.85% was based on a gain of 9088 pips. The spread is only 2.5 pips multiplied by the 338 operations, equivalent to 840 pips. The costs of overnight swaps must then be deducted. Our individual trader kept an open trade for 9879 nights, which means 7415 pips. So we are forced to deduct a total of 8277 pips from our total profit of 9068 pips, leaving a net profit of only 821 pips!

With this rough calculation, if we assume that the return is evenly distributed over each pip, this represents an enormously reduced net profit for our retail trader of only 3.09%, compared to the return of 33,85% reached by the $10 million fund we saw earlier.

Our individual trader could have an alternative, which would be to acquire futures contracts for mini synthetics that do not incur overnight swaps charges, but have wider spreads; something like 14 pips per transaction for EUR/USD. Reviewing the numbers and also assuming that a quarter of all trades must be roll-over, our retail trader would face 457 times a commission of 14 pips, equivalent to a deduction of 6422 pips. This would represent a net profit of 2678 pips. Assuming again that all returns are equally distributed on each pip, our retail trader ends up with a net total return of 9.87%. So using mini synthetic futures would have been much more profitable, but that would still mean an annualised total return in the trial period of less than 1% profit per year! On the other hand, this return would be less than a third of the amount enjoyed by the large fund.

Analysis of the Situation

Why are things complicated to our individual trader? There are different reasons and a thorough examination of each of them can help any aspiring retail trader to understand how certain margins can be incurred in the market by a poor choice of broker or execution methods.

Futures contracts are of very high amounts to be available to most individual traders and the size of the position cannot be adequately achieved with amounts of less than several million dollars in a diversified strategy of tracking trend. Mini futures are always a possible solution, but if they are not very liquid, then it is unlikely to present the same trend tracking margin as ordinary futures. Listed Funds (ETF s) are another partial solution, But still, the individual trader will have to pay a spread in order to access a suitable market well above the $20-dollar round-trip commission paid by a major Futures Exchange customer.

This brings us to the issue of spreads. Really, there is no reason why an individual trader should pay more than 1 pip for a round-trip transaction in an instrument like vanilla as in EUR/USD. Brokers who charge more than this really have no valid excuse. It has to be said that spreads in the retail sector have been falling in recent years. Even though this is good news, and if the individual trader we talked about had been assuming 1 pip and not 2.5 pips, this would have increased profitability by only an additional 1.5% and cannot be truly traced back to 2001 under any circumstances.

Derived from all this, we can finally recognize and expose the real culprit of the decrease in profitability: the overnight swap rate, which is widely misunderstood, and therefore worth a detailed examination of it.

Overnight Swap Charges

When you do a Forex trading operation, you are actually borrowing one currency in exchange for another. Therefore, you must logically pay interest on the currency you are borrowing, while receiving a return interest on the currency you have. The truth is that it is very common that there is an interest rate differential between the two currencies, this will mean that you could be either receiving or paying an extra fee for that currency each night, representing the spread, and, of course, the exchange rate is an element, because currencies are rarely at the parity level, that is 1 to 1. On the one occasion, you would not have to pay or receive anything would be if the exchange rates were exactly the same at the time of the rollover (the overnight carry-over or renewal of the overnight position), and there would be no interest rate differential.

This means that sometimes you pay the difference and sometimes you receive it, so in general, this swap is canceled. Unfortunately, it’s not as easy as that because of several variables such as the following:

-Currencies with higher interest rates tend to increase against currencies with lower interest rates, this is why over time they tend to find themselves in longer trades where you will be borrowing the currency at the highest interest rate, Which means he tends to pay more than he gets.

-Retail Foreign exchange brokers pay or charge different rates than foreign exchange brokers customers of a particular pair. Many brokers are very opaque in this and do not even display the applicable rates on their websites, even though the rates can be found within the brokerage feed of any Metatrader 4 platform. It is worth mentioning and stressing that, To be fair, there are different legitimate calculation systems of this charge. But, if you look at the compiled table in myfxbook, which shows a wide range of overnight rates (transaction fees that remain open overnight) charged by some Forex retail brokers, you will get an idea of the tremendous variety that we can find in the market.

In addition to collecting or paying the interest rate differential, some brokers also apply a “management” fee, which can mean that you will get nothing, ¡This happens even at times when the interest rate differential is favorable to you! Ironically, these are the same brokers who charge you for account inactivity, and that is that the fact that management is applicable when rarely operated in the real market is widely questionable. The most common is that the result is usually to stretch the commissions even more to the disadvantage of the customer.

Most traders are highly leveraged, which means they are borrowing most of the currency they are trading. Individual traders tend to forget that one consequence of leverage is that it increases commuting expenses, and this is because you have to pay interest on all money borrowed, not just for the margin they are putting into that particular transaction. Of course, this is an element that is legitimately charged.

The custom of charging an amount for each night to customer holds a position is not only open to abuse, but it can also be an effective way to drastically reduce the odds that a trader can try to move things in their favour by intelligent use of long-term trend trading, which is usually worth it over time if you run it correctly. It could be said that some retail brokers are using widespread ignorance about these charges as a way to add more profits to their balance sheets and that regulatory agencies should take action against these practices.

It could also be said that we cannot expect a market maker to create a market that is systematically damaged by the statistical behaviour of the market in the long term. It could be that many of the differential rates among brokers are reflected by the currencies from which their clients go long or short at any given time. It can be observed that one broker might be offering a better offer than another in one currency pair, but not in another, which seems significantly odd.

A systematic study of this topic would result in a very interesting reading. Meanwhile, a retail trader looking to systematically hold overnight positions (overnight open positions) should make sure that at least you have already thoroughly researched what they offer you when you are looking for a broker and keep in mind that the speed of a price movement in favor of the broker can have a great effect on the profitability of any trend or push strategy that he might be using.

Categories
Forex Ichimoku strategies

Ichimoku Kinko Hyo Strategy for a Takeaway

Ichimoku is a popular indicator made by Japanese experts decades ago, yet, as with other products made in Japan, it is still usable today. It is a composite indicator with several elements that are made to ensure high probability signals. However, some prop traders analyzed each element separately to determine if their roles are performing well. This article will explain the elements, describe the default way of using it, and present two beginner-friendly strategies useable right away. Ichimoku can be used in many different ways, it is far more complex than Moving Averages opening the doors for many interpretations and strategies.

Indicator Theories

There are many theories about the indicator, going very deep in its meaning even creating exclusive fan trader groups. To beginners, this might be overwhelming and unnecessary to know. The opinions presented here about the indicator and its elements are just for reference, your trading and decisions should be your own. A lot of research was done by traders about Ichimoku summarized in this article, giving you a good starting point in understanding the trend following strategies. 

If you are a beginner, then definitely you do not need to concern yourself with the mathematical background of each element, what they account in measurements, history, MA names translations, and so on. Practical application is what matters in the end, your end balance, and other, theoretical information is not going to add value at this point. Therefore, we will focus on what you do to use Ichimoku effectively in two ways. 

Indicator Elements

This indicator has five different parts. They can be grouped by their action. Moving Average crossovers is the dominant category. Two Moving Averages, Tenkan-San and Kijun-Sen are fast and slow MAs that generate the main trend confirmation signal. These do not move smoothly as classic MAs, they have their calculations causing this, but this is not a con. A second category also has two elements that make the Ichimoku Cloud – Senkou Span A and B. The cloud is a filter. It represents an area of lower quality signals generated by the fast and slow MA crossovers, therefore you should not trade.

If the price is above or below the cloud, you are safe to take the MA crossover signals. Some traders complicate the role of could elements, paying attention to the width, slope, and so on, but this is unnecessary. The last piece is the Chikou Span. This element does not have an obvious, clear role. Some traders use it while others just do not see where it fits. When you test an indicator or experiment, you try to give some meaning to it in conjunction with the price action, taking various patterns as a signal in some way. Imagination can take you to see a pattern but testing will prove if that idea is consistent and worthy. However, the factor Chinkou Span represents can be worthy or not to you. 

Kumo Cloud

Let’s start with the Kumo Cloud part. Ichimoku is already integrated into the MT4/5 platform by default, no need to install it from other sources. The image below is showing only the Ichimoku cloud without the other elements on the tradingview.com platform. Note that the USD (USD index) is inside the cloud after a rally in a long downtrend, each candle is one day. This moment is not good for trading the USD in any currency pair since the price is in the cloud. So Ichimoku has a filter, a rare element in an indicator. For beginner traders, this is very important. When we first start trading forex, we take all the signals we can from an indicator, even though we know not all are going to be good. We also do not know which one is fake and we do not have any money management plan. Ichimoku is showing you how to discipline yourself and wait for high probability trades, a very important lesson when creating your first system and a trading plan. 

There are other ways to use the cloud but for now, we will stick with its filtering role. The cloud color change and switches are some other signals that are also going to be analyzed in another article about this indicator. Now, the Kumo Cloud has another function, not only does it tell you to stop trading that pair or asset, but it also tells you to trade only in one direction if the price is not inside it. Therefore, you enter only short trade signals if the price is below the cloud and only long if above. Now, because of these rules, a lot of your trades are not going to be eligible. Suddenly, trading you used to know as fun is becoming boring. It is now a waiting game. If you are a trader looking for fun, excitement, forex will not give you that for free. If making money is exciting to you, this waiting game for high probability trades sounds great, but do not get emotional when losing streaks come. When you get a bit more experienced, you can try to trade signals inside the cloud at half the risk you normally would. The trading system can get more advanced as you build it to the point even these trade entries end up good enough. 

Trade Entries

Talking about the trade entries, Ichimoku has an interesting MAs crossover solution but also price combo signals. In the picture below we have the same chart but with the Tenkan-San and Kijun-Sen present. We have added arrows for entry signals and exit markers when the MAs crossed back again. As you can see, we have only traded short trades once the price broke out the Kumo Cloud down, ignoring all long signals – when the faster blue MA crossed the slower orange MA up. All signals gave us successful trades if we are to short the USD with the best-performing currencies in this period.

Even though we are using the USD Index, you can apply any asset here. Ichimoku settings are by default. Train your discipline by following the signals to the letter including the rules of the cloud. Add on money management, where you put your Stop Loss and Take Profit, and how big are your positions. After this practice, your understanding of trends and trading will sip into your mindset. Now, every system you come up with will have these values in the core, your ascension to a professional level is now not in question. 

Put this Ichimoku trading strategy to all 28 currency pairs having the major 8, test all signals on a demo account, see if it works. If you keep it on a daily timeframe, the signals will be more consistent but you will have to trade for a longer time.

Money Management

Money management is one of the top priorities in trading, above technical systems like Ichimoku. If you are struggling to create one, this indicator can also help you with that. For simplicity’s sake, you can always set your risk per trade to 1% of the account balance. Stop Loss placement can be put on the slower Ichimoku MA at the moment of the trade entry. When you are winning, if you wait for the faster MA to cross the other the exit might not be optimal. A better position can be when the price crosses the faster MA. This can also be your Take Profit in a form of a trailing stop. In the picture below we see Ichimoku in action on a daily EUR/USD chart.

Added arrows mark the moment when the price broke out of the cloud and when the MAs had a long signal. This trend lasted for about 10 days until the price closed below the fast blue Ichimoku MA. We have marked this moment with a cross, here you exit a position. If you were to exit when the MAs cross again you would take considerable drawdown risk, even though the position would have been a bit better on both long trades. The second long trade is a continuation. MAs crossed again and we have a green light to enter. This trend was even better. Ichimoku is not only an effective tool but also a great teacher of trading. As a bonus, it spurs ideas on how you interpret patterns into signals. You are probably thinking about using the slower MA as the exit moment instead of the faster, or look for a signal when the MAs broke out of the cloud. All of these are legitimate options. At the end of the day, you need to test them all. Still, have in mind improving technical analysis is not your priority, money management rules and psychology is. 

Chikou Span

The final element of the Ichimoku and the most mysterious is the Chikou Span. The line lags 26 periods, it is not drawn at the current period, it is shifted. It represents the exact price action except it is shifted back 26 periods, it is not a Moving Average. Chikou Span’s classic use is as a filter. When the line is in the cloud, 26 periods before, you do not enter a trade if there is a signal currently. 

In the picture below we have Gold on a daily with a complete Ichimoku indicator on default settings. The usual MA cross gives us a signal to short the Gold, the price went out of the cloud and the Chikou Span line colored black is also out of the cloud. We have everything set up to short here, the entry moment is marked with an arrow, and the Chikou Span is checked. 

Chikou Span can also sometimes be above the cloud when you have a short signal. This is also a case when signals are filtered. Sometimes this filter can cause you to miss good trends and sometimes it keeps you out of fake signals. Some traders do not see it as an effective tool while others rely on it every time. Again, what every trader needs to do is test it out. Not only every trader is different and has different systems, but also they trade different assets, some of which Chikou Span is a very useful filter. This element can be interpreted in your own way, you do not have to blindly follow classic views. 

A Final Word

Ichimoku is fantastic for beginners. It has money management levels, filters, effective confirmation elements, and trains discipline. Furthermore, the ideas that it can spur create motivation to dive deep into forex trading. Just take caution not to get overexcited, when you meet a losing streak your morale can take a hit to avert you from trading completely. Since Ichimoku is already integrated into the MT4, there is no effort barrier to start trading the right way.

Do not think if you trade Ichimoku only will get you to the professional level. You will have results, but beginners need to understand that having a break-even result at the end of the year is a success. Most traders are bust because of bad money management (if any) and no discipline, while Ichimoku traders have learned how to stay above. The rules you set before testing are permanent. Think about how do you want to use the elements of this indicator, if the Chikou Span is good enough, where are your Take Profit and Stop Loss levels, how much to risk, how will you measure volume or volatility since Ichimoku does not cover this category, and so on.

Set everything up and then start executing without deviations. After testing is done, analyze your trades, try to cut the losers first with some measure or a tool, and then try to catch more winners with other methods. This indicator has so many traders and there are so many methods to use it. Some professional traders just use one or two elements and add other tools that improve on it, creating a unique system. The second Ichimoku article will present other aspects of this indicator you can also take and apply to your trading right away. 

Categories
Forex Basic Strategies

Profit Today from These Tried & Tested Breakout Strategies

Let’s talk about currency breakout strategies. Have you ever heard that most breakouts are fake or that you should avoid operating breakouts? In the results of the World Cup Futures Championship 2017, first place went to Stefano Serafini, with an impressive return of 217%. What was Stefano Serafini’s main strategy to achieve such an impressive performance? Intraday breaks. So it would be very positive for you to do the following, the next time you see a so-called guru saying “most breakups are fake” or “avoid breakups”. Share this article with them.

In this article, we will teach you two currency breakout strategies to help you increase your accuracy and profitability when operating them. Of course, we will additionally teach you how you can use this to avoid any fake breakout.

While there are many types of currency breakout strategies, they can be classified into two broad categories:

1 – Setup “Momentum breakout”

2 – Setup “Breakout pullback”

In the article we present today we will focus on the second breakout strategy (the “Breakout pullback”), as it is much easier for operators to learn and execute it because it requires less skill.

Setup “Breakout Pullback”

Before you can even operate the pullback setup, you will need to identify some of the pullback patterns by analyzing the price action. Once you learn this, you’ll be able to identify “A+” setups. That is, the best patterns. These will increase your accuracy and profitability by operating them. There are many activities that you can develop to identify “A+ ” pullback setups, but there are two things I will give you so that you can go working.

Breakout Pattern: Finding a Key Level of Support or Resistance

Why two touches, huh? While the market can reach a key level of support or resistance with just a touch in that area, what usually indicates a potential flow of institutional commands and players who want to maintain that level, are two touches. These indicate a higher probability and number of orders in that area. The more buyers or sellers have that level, the greater the likelihood that the transaction will succeed.

Why? One reason is that those same players, when they skip stop loss orders after the level of support or resistance is broken, are removed part of the flow of orders against that break. This makes it easier for the rupture to continue.

In addition to this, big players, with smart money, after being eliminated (and detecting a good breakout) will often switch sides after their stop orders are skipped, which will provide a greater boost to the breakout. Therefore, it is important to identify a level that has a minimum of two touches (the more, the better) to increase the likelihood that a breakout setup will form.

Breakout Pattern: Minor Reactions or Setbacks

Why does analyzing a recoil or reaction before a key level of support or resistance help break operations? Let’s say the market is on an uptrend and is finding a level of resistance where there are likely to be bearish positions at that level. If the bullies reach the resistance level, for the first time, and the market regresses, say 50 pips, if the second time the price reaches that resistance level, the market only regresses 25 pips, this will indicate a weaker reaction from the bearings.

A weaker reversal of the bearings equals a lower flow of orders and strength in their favor. As his side continues to weaken, this will give the bassists the signal that they are more likely to see a breakup and communicate that his side is losing the battle. These weaker reactions warned that the bearings were less able to bring down the price while the bullies kept their foot on the accelerator, producing an eventual leak. Therefore, be sure to look for weaker reactions each time you are before a key support or resistance level to identify a high-probability break. Be sure to look for weaker reactions each time you are before a key level of support or resistance.

Key: An additional pattern, which you can apply in the price action, is to look for breakout setups that are forming in trend vs countertrend. After I’ve taught you two underlying components of a breakout strategy, we can talk about how we can achieve a pullback breakout.

The “Breakout Pullback”

Assuming you have found a situation where both touches are given at the same key support or resistance level, along with weaker reactions before you get there, let’s talk about how you can enter a breakout pullback setup. Once the price has broken the support or resistance level, I will place a limit order on that specific support or resistance level to operate in the direction of the break.

NOTE: I don’t expect a price action confirmation sign to form at that level. If you have read the price action context correctly and found an interesting break, any signal confirming the price action will only give you a weaker ticket, and then your profitability will be reduced. If you could learn to read the price action, you won’t need any price action confirmation signal to enter the market, because the flow of orders from the big players will already be there.

When I operate a breakout pullback setup, once I identify the breakout, I open my operation, long or short, at the level where the pullback is performed. If the command flow at that level is interesting, there will be larger players willing to be long or short at that level without the need for any price action confirmation. When I operate a breakout pullback setup, once I identify the breakout, I open my operation, long or short, at the level where the pullback is performed.

When there are two taps on a support level, together you bounce weaker and weaker. Once the market broke the level, I put my order for short. After returning to my level, and narrowly entering the negative ground, the pair fell generating more than 100 pips of profit. If I had waited for any sign of confirmation, like a bar pin or something like that, I would have gotten a worse ticket and a lower profit potential.

You can see another example of a live trade using a pyramid trading strategy where I go into a pullback breakout in both trades, trading with the tendency to make additional profits.

Avoiding False Breakout

You can tell a lot about how to avoid false breakout when operating a pullback breakout setup. There are many breakup patterns that often fail.

To simplify, the best thing you can do is:

  1. Learn to read the price action context
  2. Operate with the trend as much as possible.

By learning to read the context of price action, you will have a better understanding of finding key levels of support and endurance where there is a large flow of orders around that level. You will also have the ability to know how to detect much better trend contexts, which are much more favorable for breakout trading setups. This is because there will be more flow of orders in your favor to support your operation.

In Sumary…

Trading breakout patterns in currencies can be a highly profitable trading strategy when you learn to identify “A+” breakout setups. There are two types of breakout, which are a) the breakout itself, and b) the breakout pullback.

There are also breakout patterns that you can detect in price action and help you find breakout operations of higher probability. Trading breakout patterns in currencies can be a highly profitable trading strategy when you learn to identify breakout setups.

At first, try operating pullback breakout setups as they require fewer skills and will help you have confidence in breakouts over time. Finally, when trading the pullback breakout make sure you don’t expect confirmation signals of the price action as they will give you a worse entry and reduce your profitability.

Categories
Forex Basic Strategies

Is Buy Low/Sell High Truly the Most Effective Strategy in Forex?

The concept of buying low and selling high is an interesting one for many reasons, it has been the essence of trade and making money since the beginning of man, back before money was even invented, the concept of buying low and selling high existed. Farmers trading livestock at the market, corn for pots, these trades were all based around the perceived values to those who have them in their possession, you will always want to trade what you have for something that you believe is of more value.

The Essence of Trade

This is exactly how the world works now, buying something for a certain price and then trying to sell it for a higher value. Of course, we already know that this is the essence of forex trading too, we are purchasing one currency with another hoping for the price to change when we can then sell it back to have a little more of the base currency than we started with. The concept of buying at a low price and selling at a higher one is certainly true when it comes to forex trading, the problem is that it is just a little bit more complicated than that and we are going to be looking at exactly why this is and why it can be profitable, but not something to solely rely on when trading.

Determining the Lowest Values

The first and most important thing that you need to consider when using this sort of strategy is where the low is, looking at the chart, you would think that this is the lowest point on the chart, form that timeframe this would be correct, but what about other time frames? Turn it up from the 5-minute chart up to the 1-week chart and the markets will look very different and the low that you were previously looking at could potentially be quite near the top of the weekly chart, this is why it is so hard to judge where the low actually is. In fact, it is almost impossible to judge it completely, there are some things we can do to help but to actually guess the exact low and turning point is pretty difficult to do.

Looking at the charts, we have seen the lowest point on our chart so we decide that this is low and where we should buy, we do so but then the markets move down a bit further, creating a new low. We buy again as this is the ow, but then it drops further, you can see the point that we are making. Just because the price is currently at the bottom of the current chart, it does not mean that this is the bottom and it does not mean that this is the right place to put in your buy order. The markets can continue to decrease without any reason creating new lows as it continues, so we need to use a number of different things to help us to work out exactly where the lows could be, of course, there are no guarantees that even if you use 100 indicators, it won’t still continue lower, but we can move the probabilities into our favor in order to get a better understanding of where the low in the market actually is.

If you are a short-term trader then you can use things like the support and resistance levels to work out where the markets may be moving and turning. These are for short term traders such as scalpers wh only need little movements in the markets, so the price jumping between the support and resistance levels gives the good opportunity to buy when the price is low at the support and levels and then to sell when the price is higher at the resistance levels. This is the very essence of buying low and selling high. There are of course no guarantees and the price will eventually break either up or down, but the support and resistance levels can give a good short-term idea of where the market may be hitting their lows and reversing, at least temporarily.

Determining the Highest Values

We speak about needing to know where the lows are, but we also need to know where the highs are too, this is where you will be taking your profits on a rising market. Part of trading is being able to maximise your profits, so this means knowing when to get out too. You do not want to get out too early and you will lose a lot of unrealised profits, you also do not want to get out too late as the markets could reverse causing you to lose off the profits that you would have otherwise taken. So when you are analysing the lows, ensure that you do the same for the highs, so you can then work out exactly how much you could be making on a trade before even putting it on, a great idea for your risk management.

Speaking of buying low and selling high, the great thing about using an appropriate broker is the fact that you are also able to sell high and buy low, the exact same concept is used, just you are ceiling instead of buying. Use the exact same analysis and the exact same concept, just the reverse, so you can also make a profit when the markets are moving down and not just on their way up.

So that is the concept of buying low and selling high, does it work for forex? Technically yes it does, it is pretty much how we make money, but you cannot rely on it as a single strategy. You should be buying low and selling high or selling high and then buying low depending on the direction that the markets are traveling, but you need to ensure that you have proper analysis behind that and not simply just guessing where the lows and highs are.

Remember, that buying low and selling high is not a strategy in itself, it is simply the concept of making money with forex and trading.

Categories
Forex Course

188. Straddle Trading Strategy – An Efficient Way To Trade The News

Introduction 

In the previous lesson, we covered how you can make money if you knew the direction the market was going to move. In this lesson, we will show you how you can make money if you have no idea about the direction the market is going to move.

When there is high volatility in the market, especially as a result of a news release, it is possible to achieve this. Note that this strategy is different from trading with a directional bias.

Let’s break it down!

Firstly, you have to aware of an upcoming high-impact news release. Unlike trading with a directional bias, you don’t have to familiarise yourself with the direction the news will move the market. All you have to know is that the market will significantly move.

Let’s say, for example, that a news release is scheduled for 8.30 AM. Using the 5-minute timeframe, observe the trend for the past 30 minutes and establish the support and resistance levels. You will use these levels to set a buy stop and sell stop order.

With the buy stop orders, if the price breaks above the resistance level, a long order will be triggered. In the sell stop order, if the price breaks below the support level, a sell order will be triggered. Let’s use the news release of the US unemployment rate on October 2, 2020, at 8.30 AM EST.

Here’s the logic behind the straddle strategy. If the news is significant enough to break through the support level, then it is plausible for the bullish trend to continue in the short term. Conversely, if the news release is significant enough to blow the price past the support level, then the bearish trend might progress in the short-term.

Note that you can pre-set your ‘take profit’ and ‘stop-loss’ levels when using the forex pending order types. Doing this ensures that you get to determine your absolute downside in case a trend doesn’t hold. Furthermore, you can opt for only the ‘trailing stop order’ alongside the stop orders. Your ‘stop-loss’ value is not fixed with the trailing stop, which increases your exposure to the upside.

For instance, if, in the above example, we had set our take profit level at ten pips, we would have only made the ten pips. But, if we used the trailing stop order instead, we would have gained more than the ten pips. Cheers!

[wp_quiz id=”98844″]
Categories
Forex Technical Analysis

Using Moving Averages as Professional Traders Do – Here’s How…

Some traders use moving averages as resistance and support indicators or focus on whether a candle has closed above or below a specific moving average. The ability to use moving averages in the same manner as professional traders can make all the difference in the world with regards to your earnings. With that in mind, allow us to explain just how to do this.

Los Cruces

A cross is the most basic type of signal and many traders favor it because it eliminates the emotional element of trading. The most basic type of crossing occurs when the price of an asset moves on one side of a moving average and ends on the other. As we have commented, price crossings are used by traders to identify impulse changes and can be used as a basic output or input forex strategy. A crossing below a moving average can signal the beginning of a downward trend and will probably be used by traders as a signal to close any existing long position. On the contrary, a closure above a moving average from below may suggest the beginning of a new upward trend.

The second type of crossing occurs when a short-term average crosses through a long-term average. This signal is used by traders to detect when the momentum is changing in one direction and a strong movement is likely to approach. A buying signal is generated when the short-term average crosses above the long-term average, while a selling signal occurs when a short-term average crosses below a long-term average.

These methods are not the best way to use moving averages. In fact, they can be used much more cost-effectively if we use moving averages as impulse indicators, indicating the absence or strength of a trend, in company with other factors that recommend entry. This is how moving averages are often used by Forex market professionals.

Types of Moving Socks

There are several different types of moving socks and we should know each one before using them. Almost all graphics platforms offer all kinds of moving socks. Firstly, you should know that moving averages can be applied to the closing price, the opening price, or to high or low prices in a timeframe. They are usually applied to closing prices, and this is logical since closing prices are of great importance, and each opening price is also a closing price or a previous candle. Closing prices weigh heavily on the samples because it is often a level at which the price has settled.

At this point, let’s take a look at each type of moving average.

The simple moving average (SMA) is only an average of all the periods to which it refers.

The exponential moving mean (EMA) is calculated by giving more weight to the most recent value. In other words, we say that, for example, if the price has not moved, but starts to go up, an EMA will be demonstrating a higher level than an SMA for that same review time period.

The linear weighted moving average, sometimes referred to simply as a weighted moving average (LWMA or WMA), is like the EMA, being also calculated by giving more weight to the most recent value, but the weighting is proportional throughout the data series, while EMA only gives more weight to the most recent sample.

There are other types of moving stockings, but you don’t need to worry about them. These three types can provide you with everything you need.

Important Moving Stockings

There are some specific moving averages that are used by many traders. I will describe them here, but I do not suggest that much attention be paid where the price is related to any of them as if this were something very important in itself. The important moving averages are:

  • 20 EMA
  • 50 SMA
  • 100 SMA
  • 200 SMA
  • 200 EMA

Using Moving Stockings as Impulse Indicators

One of the best occasions to use moving socks like professionals is to use them as impulse indicators to determine if there is a trend and how strong it is. The best advantage that retail traders can take advantage of is to be able to trade in the direction of the trend if there is one.

One way to do this is to observe the slope angle of a moving average. For example, in a strong bullish trend, many traders will be looking at the angle of EMA 20. If the angle is consistent and strong, it is a sign that we have a trend in place. Note how, in the graph below, the EMA 20 is showing a rather strong angle, and also note that the price has remained largely below it in the graph. This is a sign of a downward trend.

Crosses of Moving Averages as Impulse Indicators

A more sophisticated way to do this is to check if a faster moving average is above a slower moving average and check this in several time frames. When you have bigger time frames that show a good trend, but a regression in smaller time frames, this could give you a chance to get in the direction of the trend, when moving averages cross again in the same direction as the time frame greater or smaller.

A combination of moving stockings that I like to wear is EMA 3 as a fast-moving average and SMA 10 as a slow-moving average. There is nothing especially magical about these numbers – beware of traders who swear that something like the LWMA 42 is a magic indicator -, but the difference between them tends to offer us an early warning of a change in the direction of the market. In fact, when we use this combination, I not only check several time frames, but I also need to see that the 10-period RSI indicator matches the address. This type of trading strategy using the moving average in various time frames can be very profitable.

In the example graph below, these two moving averages in all upper time frames are showing EMA 3 below SMA 10. In this 5-minute graph, while this quality existed within the larger time frames, EMA 3 retreated twice before crossing again below SMA 10 as indicated by the blue arrows. These two crossings could have provided profitable operations in the short term.

Deviation From Moving Averages

It is generally not sufficiently appreciated that almost all trend indicators are based on some sort of moving averages. For example, the Bollinger Band is simply the EMA 20 in the center with statistical deviation channels based on the historical price range.

Another way to use a mobile average is to take high probability quick pips following the following strategy. Let’s say that a very short-term moving average like EMA 20 is showing a strong angle and the price generally staying above it. If the price falls suddenly hard enough to get below the moving average, there is a high probability that the price will go back quickly to get back above it.

Another strategy is to look for a candle that is not touching the moving stockings at all, but that is indicating a movement back towards the moving stockings area. 

Frequently Asked Questions

How is the moving average calculated?

Basically, a moving average can be calculated by adding the last closing prices of “X” periods and then dividing that number by “X”.

What is EMA trading?

One type of essential tool for assessing trends in markets is the exponential moving average (EMA). In this article, we will present a specific type of stockings called Exponential Moving Media.

What is a mobile media filter?

Using statistics, a moving average is a calculation that is used to analyze a data set in point mode to create averages series. Thus the moving averages are a list of numbers in which each is the average of a subset of the original data.

Categories
Forex Market

Forex Liquidity and It’s Impact on Strategy Selection

Liquidity is often confused with volatility, but both are different concepts. A liquid currency is an asset that can be exchanged very quickly for another type of asset. We will always find many buyers and sellers in the liquid market and consequently, the spread will be very small here. But as soon as some important news is published, buyers or sellers disappear from the market, and the currency changes from liquid to volatile. However, there is no strict inverse relationship between these terms. In this summary, you will learn more about this, as well as what liquidity is, what it depends on, and much more.

What market is the most liquid? It is logical that the less liquid markets are those of antiques and collectibles, where the turnover of capital is relatively small and, more importantly, few participants. Stock and foreign exchange markets are different. The stock market is believed to be more liquid, at least because the turnover of the OTC currency market is almost impossible to assess accurately. But can you buy a stock in two clicks with 10 US dollars? And a currency? That is precisely why I believe that the liquidity of the foreign exchange market is more attractive to a low-capital investor.

In this article, you will learn:

*What is the liquidity of a currency and why a trader needs to know about it.

*What is the difference between a liquid currency and a non-liquid currency. Factors that affect liquidity.

*Strategy and liquidity. How can we choose a currency pair for a particular type of trading system.

The concept of “liquidity” can also be easily found in the financial results of companies. It means assessing the company’s ability to pay its obligations quickly. Liquidity ratios are an aid to assessing the solvency of a legal entity. We can comment on this issue separately (if you are interested, leave a comment), but this summary will focus on currency liquidity.

Use of Liquidity and Market Volatility in Strategy Building

The liquidity of one currency measures the possibility of exchanging rapidly one currency unit for another. The faster it can be done, the more liquid the currency unit is. Freely convertible currencies are considered the more liquid. The lower the country’s share of the global economic space, the greater the “regulation” of the domestic market, and the manual control of the economy, the lower the liquidity of the currency.

Simple analogy. You have US dollars on your hands. You can always quickly find someone who is ready to exchange them, for example, for euros, because both currencies are traded worldwide. You can also change them with the same ease again. USD and EUR are very liquid coins, just as the EUR/USD pair is a highly liquid pair. You can also buy Venezuelan bolivars with dollars. The country goes through hyperinflation and will gladly sell you the national currency. But then you won’t find buyers and will be forced to sell it for a penny. Bolivar is a low-liquidity currency.

In a highly liquid market, there will always be a relatively equal number of buyers and sellers (or an equal proportion of supply and demand). Liquidity reflects the interest of market participants in both the absolute number of participants and the volume of transactions per unit of time. When liquidity is very high in a market, the faster goods can be sold/purchased, and the greater the volume of transactions possible.

Simple analogy. There is a market where there are 10 vendors, each ready to give 5 euros. The buyer needs 45 euros, the market volume is 50 euros (10*5). For the buyer, this market is very liquid. If there were 3 sellers, and each would be prepared to offer 15 euros. This market can be called highly liquid, as supply and demand satisfy each other. Suppose there are only 1 buyer and 1 seller on the market. The buyer wants 40 euros, but the seller only has 10 euros at the current price. The buyer is forced to raise the price or wait for other sellers. It is a low liquidity market.

Traders often confuse the concept of liquidity and volatility. Volatility is the extent of price changes per unit of time. In a market with excellent liquidity, prices do not have very large fluctuations in one direction or another, as purchases and sales are made almost instantly at satisfactory prices. Price moves smoothly in small steps. Conversely, a low-liquidity market has frequent price spikes.

High liquidity does not mean high volatility. A high-liquidity market is characterized by smooth movement, while in a low-liquidity market the shares of large individual players can bring chaos to the movement. Why do you advise not to operate during the news outing? Because any news is subjective and liquidity providers prefer not to open operations. The loss of liquidity generates an increase in volatility (increased amplitude), a situation in which small volumes of transactions, even small amounts, can influence price.

Differences Between Liquidated and Non-Liquidated Currencies

*Small spread (the difference between purchase and sale price). If the coin is not attractive to buyers, the seller will be forced to lower the price until a buyer wants to buy it.

*Free access to information. If liquid coins are attractive to traders, so are analysts, news agencies, etc. You can find information about non-liquid currencies mainly in the original sources.

*Formation of the contribution market. Highly liquid currency quotes are defined by the supply-demand ratio (floating exchange rate). Illiquid (illiquid) currencies are often strictly regulated by central banks.

*Economic development. Low-liquidity currencies are the currencies of developing countries.

*Liquidity tends to change. Despite the fact that more liquid pairs are considered freely convertible currencies, a possible situation is when the price of a particular asset falls but cannot be sold due to a lack of buyers.

Liquidity on Forex Depends On…

*Supply and demand volumes. Large trading volumes provide the currency with a constant supply and demand. If there are, for example, few buyers in the market, the seller is forced to place a lower price to have buyers available or expect. The fewer participants negotiate, the less liquid the currency.

*Session. Trading activity, and the liquidity of the Forex market, is to some extent defined by the trading session. For example, the largest number of operations in the Japanese yen is observed in the Asian session, when in the region it is day. If we talk about the currency market in general, the least liquid in the Asian session and the most liquid in the European session.

*Key factors, including holidays. News, press releases, speeches by representatives of central banks, force majeure: all this affects, to a certain extent, the volume of trade, which also means in liquidity. The liquidity of the currency is also affected by trading days. For example, on the eve of holidays (or the holiday season), trading volumes are reduced and liquidity along with them.

*High liquidity currencies are EUR, USD, JPY, CAD, GBP, AUD and CHF. If we talk about the liquidity of currency pairs, these are all previous currencies paired with the USD, although opinions differ here. In some sources, the GBP/JPY pair is also considered highly liquid

Interesting fact. The 2008 crisis showed how liquid currencies can quickly become volatile. In addition, investor dissatisfaction with the growing US public debt that we see more and more is a time bomb. According to one version, USD liquidity may falter and commodity currencies in the foreground will emerge as the most stable (least exposed to demand and volatility). These include the Norwegian krone, Australian, New Zealand, and Canadian dollars.

Choosing a Trading and Liquidity Strategy

Should I consider the level of liquidity when creating a strategy? The question is not so clear. I will try to put the same thing in other words. Small traders often follow the trend, that is, they follow the majority led by market makers. Which market is profitable for big players in terms of liquidity? There are two versions:

High liquidity market. Excessive liquidity will serve as a buffer for the sudden formation of price spikes. In other words, large volumes liquidate sudden price spikes. This market is considered quieter because it is interesting for market makers who are used to stable pragmatic trading.

Low liquidity market. The condition when a small number of traders remains in the market is called a thin market. For example, during the holiday season or holidays. For large capitals, this is a gold mine. The less liquidity, the easier it will be to change (need less money) the price in the right direction, taking it to key levels (disrupting other people’s stop orders).

Everything depends on the situation. It is very logical that liquidity levels may affect the choice of a particular strategy, but they do not actually affect it as much. For example, the EUR/USD currency pair is considered very liquid and with average volatility. When the market is calm, it is very suitable for intraday trading and scalping, but during the news outing, its expected volatility increases sharply, thus eliminating most scalping strategies.

What is Liquidity in a Currency?

Here you can see that, despite the high liquidity in short terms, in long-term periods, the amplitude of the movement is quite large.

Characteristics of highly liquid currency pair trading:

  • Liquid currencies require the utmost attention and the ability to make decisions instantly.
  • The time period is usually short: M5-M30, hourly intervals are used less frequently.

A trader must understand microeconomics and macroeconomics, know where to get some information quickly, understand the economy and policy processes of developed countries, and know what will have the greatest impact on the exchange rate.

Highly liquid currency quotes are more susceptible to the manipulation of large capital. The larger the size of the market and the smaller the participants, the greater the possibility of creating the right news fund using the right media, analytical summaries, or statistics.

Low-liquidity currencies are suitable for two categories of traders: lovers of long-term strategies and those who trade in Forex for excitement and pleasure, so the probability of winning is low. While here you don’t need to constantly monitor the news.

Liquidity is changing, so there are no liquidity calculators. But there are volatility calculators that show the current range of price changes.

What is Liquidity in a Currency?

This calculator can provide indirect information about liquidity. For example, low volatility may indicate high liquidity at this time. On the other hand, this can mean a plane, that is, the absence of negotiation in this pair. In other words, the volatility calculator does not allow for unequivocal conclusions regarding the level of liquidity, but it can serve as an auxiliary tool.

Conclusion. Liquidity is the ability to quickly exchange one asset for another. Low-liquidity markets are not protected against sudden price jumps. They may be of interest to investors who tend to take higher risks for high returns. The main advantage of highly liquid markets is that no major player is able to influence price significantly. They, therefore, involve fewer risks and, due to greater predictability, are more suitable for technical analysis.

Categories
Forex Basic Strategies

Walk Forward: Optimise Your Trading System to Boost Your Earnings

Before you start talking about optimizing a trading system, it’s important to know what these systems are based on or why you should work with them. In this article, we’ll talk about one of the most popular trading tests that exist today. It is the walk-forward test.

What Is the Optimization of a Trading System?

We have all asked ourselves the question of what optimisation is. The optimization of a trading system is based on the study of history of past premises or events. This is done in order to get a number of values to render our system cost-effective. In other words, it is based on carrying out a relevant study about the best results that have occurred in the past, this seeking to obtain a range of possible positive results for the market in which one is working.

Since optimization is based on finding possible numbers or values that approximate or resemble possible current values, it is necessary to take into account that you must have prior market information or valid premises. When you want to perform an optimization of a trading system, it is necessary to take into account the type of objective function you are working with. This is because, for each type of objective function, its values are different.

The objective function with which you are working can be framed in any of the ratios to evaluate systems. All these ratios are based on different ways of working, from here arises the difference between the values that can be given. For example, an objective function may be for the system to have the maximum net gain possible or the minimum possible loss. Depending on this, the parameters of our system can be different.

Ratios for Evaluating Systems

The ratios for evaluating systems are based on the ways you can look for a gain. These give you an assessment of the risk there may be, how profitable it may be, the duration and profitability of profits, among others. To optimize a trading system, you need to be clear about the ratio to maximize or the one you want to prioritize. Thus, when performing the optimization you will look for the results obtained in previous periods and guide you in the possible values to which you can decline.

There are several types of ratios to evaluate the system, I explain three in this article:

Net Profit Ratio

This is one of the most elementary proportions, you can understand it simply as the profitability of the system. This profit is calculated in relation to the initial investment. It’s one of the simplest ways to calculate. However, it is necessary to assess certain circumstances to see whether this system is profitable in the market being operated. In some cases, this system only works within a limited time. Later, you start to generate higher losses, which compared to profits can be disposable.

You should also evaluate the number of trades you can make a profit on, as there may also be a limited number of trades in which you will receive a profit (minimum 150 trades in my case but it varies depending on the type of system). After this, you can only generate losses from your capital.

Ratio through the Drawdown

Many people use Drawdown to opt-out of a trading system. Drawdown is based on the number of consecutive losses in your trading strategy. That is, it is evaluated from the highest point that could be obtained previously, to the lowest point obtained before generating another high point. It is important to note that optimization, in these cases, should have a good margin of error and not fall into over-optimization.

R Squared

The use of R2 or the coefficient of determination for statistical models whose main objective is the prediction of future results based on other related information. The R2 value is a number between 0 and 1 and describes how well a regression line fits a data set. When the value of R2 is close to 1, this indicates that the regression line fits the data very well, while a value of R2 close to 0 is an indication that the regression line is not adjustable in any way to the data. The higher the value of R2, the better the capital curve of the trading system. A very high R2 value should result in a profitable trading system with little drawdown.

The Backtest

This word is very important when performing the optimization of a trading system, since its result will depend on the study of optimization trading. Simply put, doing a backtest is performing and evaluating a history of operations. With this, you get a percentage of hits, the amount of drawdown or net profit, among others. These data are used as results to enter future parameters, seeking to obtain a benefit. The backtest needs to be done with certain variants. The more variants that emerge, the more backtest you’ll have to do until you hit a closed result, but be very careful with over-optimisation.

What is Over-Optimisation?

In the optimization of a trading system, we look for the possible values that can be generated in the future. This is done by evaluating an earlier historical and a number of previous variants. The over optimization is to play with the marked cards. It is to set the parameters for the best past results. When many backtests are performed, the result gets closer to a point of non-existent perfection. That is, a point where there are no faults or margins of error. When this happens, it is because of a saturation of the variants.

This saturation is called over-optimization. It is one of the factors to which one must be very careful when optimizing a trading system. Because when you over-optimize a system, the perfect result, it’s just a big value error. To prevent you from entering an over-optimized, it is advisable to do an optimization with few parameters to optimize. By entering many parameters, you can fall into over optimization. In my case, in fact, I try not to optimize anything.

What is Walk Forward Optimization?

This is one of the most robust optimization systems available today. This is because it performs a complete optimization, but a little late and complex. Thanks to its system being a bit complex, if you have a considerable historical, your results can become numerous. In other words, the more historical you have, the more results you can get.

What makes the Walk Forward so good, if it gives numerous results? The Walk Forward is considered to be one of the most robust optimizers as it optimizes through historical intervals. This amount of results can be reduced. However, be careful not to over-optimize. The optimization using the Walk forward system is performed by analyzing short intervals in the history of market operations. That is to say, when you have a history of 10 years, for example, you take the first three years (1, 2, and 3) of history, they are optimized and you get the backtest.

After this, it is taken from the last year of the first optimization, until the subsequent two years, including the first backtest. In other words, in the second optimization the years 3, 4, and 5 would be taken, together with the first backtest. This will be done with all the following years until the last backtest. Which will be the result of continuous optimization throughout the history. This constant and repetitive optimization is what is considered as the Walk Forward and, thanks to its level of complexity, is considered as one of the most robust. However, it usually gives very accurate results, within the margin of error.

For what purpose is optimization with walk forward used in trading systems? The function with which this type of optimization is performed is based on the verification of the system for the future. In the same way, you can implement it to obtain possible values that generate a profit. All this is done with a series of premises. That is, you must do it with a history of operations. By doing so, you can get an idea about the market in the future. In this way, you will be able to observe if it can be productive to apply the trading strategy that you are evaluating. In certain cases, you will check that the profitability of the system or ratio is only temporary.

A Correct Optimization

As you know, you should avoid over-optimization, as this does not generate more than losses. One of the points you should look at when performing an optimization of a trading system is to avoid single or isolated values. Imagine creating a strategy based on an average of 20 periods that works perfectly. But when you look at their results with an average of 19 or 21, it’s a complete disaster. Doesn’t sound very reliable, does it?

I don’t mean that your trading strategy works well with any parameter you use. But what we’re looking for are robust systems, and if any sensitive change causes results to be altered abruptly, what we have is not a robust system. Keep in mind that the market can make drastic and abrupt changes. Therefore, it is recommended that you make several optimizations at considerable intervals of time. This ensures that the values obtained the first time, remain constant. If not, the market may make a change, and you should engage with that change.

How to Use the Walk-Forward Test?

In my case, I don’t use it to optimize my trading systems. I use it as a test to evaluate its robustness since when we apply it we are seeing different periods outside the sample. In this way, we obtain more information on how it can behave in the future and on the consistency of the strategy. In the end, as you can see, it’s about having the possibilities in our favor with winning strategies, and this test is throwing information about our strategies. As I always say, don’t look for perfect strategies, look for real strategies.

My recommendation is that you study the test and if it is useful incorporate it into your methodology. For me, it is one of those tests that is worth it along with that of Monte Carlo.

Categories
Forex Basic Strategies

Check Out These Amazing Strategies for Students Trading with Low Capital

Let’s get one thing straight right off the bat, it is a pretty hard thing to be a trader and a student at the same time, you will be jumping to and from your studies and trading, and there is a good chance that one of them will start to take over the other, there are also plenty of different strategies available to trade, but some of them are not quite as easy to do when you have other commitments taking up a lot of your time. So we are going to be looking at some of the strategies that could work for you.

Of course, these same strategies can also be used if you are a full-time worker, as the shared responsibilities remain the same, the difference with a student is that you often also have a lower amount of capital available to trade, and so that is what we are going to be taking into consideration too.

As a student, you are probably strapped for cash, most of that is going on your rent, your foot, and your tuition, so if you are thinking of being a forex trader, then you are going to need a strategy that does not take a lot of money to do. This will throw a lot of strategies out of the window including things like swing trading, position trading, and trend trading. These strategies require you to hold on to trades for a long period of time and so would need the capital in order to do that, probably a little bit more than what you have at your disposal.

So what strategies can you use? Well the main two would be day trading and scalping, scalping takes the least amount of capital and also each trade takes the least amount of time, the problem with scalping is that you will most likely need to be there at the computer screen when reading. As a student, you most likely do not have as much time as you would like as you have your studies to do. So the scalping strategy, while cheap to use will require you to be there, taking you away from your studies, and you do not want to sacrifice your grades and results for trading.

So this leaves us with day trading, trades generally take between a few hours and a day in order to complete and these sorts of strategies will ensure that you close out the trades at the end of the day so as not to hold them overnight. This strategy does not require you to have a huge balance due to only holding them for the day, and the length of them means that you do not need to sit in front of the computer which is perfect as a student trader.

Probably the biggest issue that comes with being a student is not your time, but the amount of money that you have, being a student is expensive with the tuition fees and living costs, it doesn’t leave you with much. So you really need to make a decision before you even start trading, can you actually afford to trade? It’s a big question, if you are using money that you would have otherwise spent on food, then do not trade, if it is money that you would have just thrown away on a night out then go for it, ensure that you are only using money that you can afford to use. A lot of students jump into trading in the hope that they can make a quick buck or make enough to pay for their course, this is not always a realistic goal, get into it for the experience and any profits are simply a bonus.

Having said that, no strategy is good for a student if you do not have the right risk management plans in place. Risk management is there to protect you and your account and is even more important when you are thinking about trading with a lack of time and a lack of capital. This will include things like stop losses, take profits, a proper risk to reward ratio, and proper entry and exit requirements for your trade. When you start out trading you should have worked out what these are, however going in as a student will mean that you will need to be stricter and to adhere to them at all times, you may even need to adjust them to better suit the amount of time that you have and also the balance that you have.

You will find people all over the internet simply telling you that you should not be trading at the same time as being a student, but this is not the case at all. There is the opportunity for anyone to be a trader, all you need to do is to adapt the way that you trade to better meet your own personal requirements. Use proper risk management and choose a strategy that works for you. All of them could work, but it will be based on your current circumstances of time and money available. So do not be disheartened, as student trading may be a little slower and the gains a little lower, but you are learning and the markets are not going anywhere, so do not rush, take your time and build that foundation for being a successful trader.

Categories
Forex Basic Strategies

The Sharpe Ratio Strategy That Very Few Traders Actually Know About

When we analyze and evaluate the performance of a financial asset or trading system, we usually focus on the profits that it produces over a period of time and forget about a no less important question: what is its associated risk? Undoubtedly we want to have a winning trading system, which generates profits, but we must not forget the star parameter: risk. As you know, there are enough ratios to measure our trading strategies, but in this article, we will discuss the Sharpe ratio at length. 

Ratio or Sharpe Coefficient

The Sharpe ratio was developed by Nobel laureate William Sharpe and is one of the most widely used ratios for evaluating and comparing financial assets or trading systems. To do this, it analyzes the return on an investment taking into account the risk of that investment, which allows us to determine if the profitability of our trading strategy is due to a really good system or, on the contrary, we have taken a lot of risks.

The calculation of the Sharpe ratio is quite simple and is defined as the annualised return of the trading system (fund, portfolio, etc.) minus the risk-free return and divided by standard deviation or standard deviation. The formula is as follows:

  • Sharpe ratio = (rp – rf) / σp

Where:

  • rp: average return on the financial asset.
  • rf: average return on a risk-free portfolio (risk-free return).
  • σp: standard deviation of portfolio profitability.

In case you have any doubt about these three parameters, here is a simple way:

The average return on the asset: is the expected return on the asset in the selected period, which can be a year, a month, or a day.

Risk-free yield: these are the short-term public debt obligations (bonds, treasury bills, etc.) of a geographical area similar to that of the asset we wish to assess. This is the minimum return an investor can obtain in the market.

Standard deviation. In short, the standard or standard deviation measures as soon as returns deviate from their average.

Interpreting the Sharpe Ratio

As I have already mentioned in other posts, the most important thing when we use statistical metrics to evaluate a trading strategy is the correct interpretation and understanding of the values obtained. Basically, the value of this ratio can be classified into three possible scenarios:

Ideally, the value of the Sharpe ratio should be equal to or greater than 1. The higher the Sharpe ratio, the better the return relative to the risk assumed when making the investment.

If the value is between 0 and 1, the strategy is not optimal, but it could be used.

If the Sharpe ratio is less than 0, we should not use the strategy or portfolio we are evaluating. The negative Sharpe ratio means that the risk-free asset is more profitable than the risk-bearing asset.

In addition to interpreting the numerical value of this ratio, the Sharpe coefficient allows us to:

  • Compare the risk-benefit ratio between different investment opportunities.
  • Select the most attractive strategy from the point of view of risk, with the same performance.

Disadvantages or Limitations of the Sharpe Ratio

As I told you before, there are no perfect metrics and each has its limitations. In this sense, the Sharpe ratio is no exception and among the main disadvantages you can mention are the following:

  • Does not distinguish between consecutive losses and intermittent losses.
  • The Sharpe ratio does not depend on the order of the sample and it is not the same to lose 10 consecutive times as alternately.

So that you understand better, I will explain with an example:

Suppose we evaluate two strategies during a year, both strategies had 6 months of profits and 6 months of losses. Strategy A had alternating gains while strategy B had 6 months of losses and then 6 months of gain, as shown below.

If we analyze both systems, we see that the two have the same mean benefit and the same standard deviation, therefore, the same simplified Sharpe ratio. But if we look at the cumulative profit graph, it’s not hard to realize that strategy A has a more regular or stable cumulative profit curve than strategy B, I would therefore choose to select strategy A over strategy B despite having the same Sharpe coefficient.

Another weakness of using the Sharpe ratio is that when we use the standard deviation of profitability to calculate risk, there is no difference between bullish or bearish volatility. The volatility of a trading strategy allows us to measure or predict the performance of that strategy. So the more volatility the expected returns will be more inconsistent.

Sharpe’s ratio is very useful only when compared to another trading or investment strategy. Let’s look at an example for you to understand me better: Suppose we evaluate a strategy or portfolio and the Sharpe ratio is equal to 1, this value is pretty good. We now evaluate a second portfolio and its Sharpe ratio is equal to 3.5. Although the first strategy has a good Sharpe ratio, the second strategy has a better ratio and this makes it more attractive to choose some of them on equal terms

Simplified Sharpe Ratio

Many times instead of using the Sharpe ratio, according to the formula I described above, it is common to use a simpler version known as the simplified Sharpe ratio. The formula for its calculation is as follows:

Simplified Sharpe ratio = mathematical hope/ standard deviation.

Because Mathematical Hope can be interpreted as the mean profit (net profit / total number of operations), then we can rewrite the formula as follows:

Simplified Sharpe Ratio = Average Benefit / Standard Deviation

Example of an evaluation of a strategy using the Sharpe ratio:

Suppose we have an investment strategy A, which has an annual return of 16% with a standard deviation of 9%. In addition, We have another investment strategy B with an annual return of 9% and a standard deviation of 3%. The risk-free return benchmark for these strategies will be Treasury bonds that have a return of 1%.

If we look only at the returns, it is very easy to see that strategy A is better than strategy B. However, we do not know the risks we have taken in strategy A to get that return. That is why we need to adjust profitability to risk and thus determine which strategy actually achieved the best return. We did this using the Sharpe ratio.

Let’s calculate the Sharpe ratio for strategy A:

Sharpe ratio = (rp – rf) / σp = (16 – 1) / 9 = 1.67

Let’s calculate the Sharpe ratio for strategy A:

Sharpe ratio = (rp – rf) / σp = (9 – 1) / 3 = 2.67

If we analyze the results, we realize that, according to the Sharpe ratio, the strategy that achieved the best return according to the risk assumed, was strategy B. For this reason, We must not always let ourselves be dazzled by the performance of a strategy; we must look at it from different points of view.

Conclusion: Is it Useful?

Finally, we can say that the Sharpe ratio can be used when we want to know the risk assumed when executing a certain strategy or investment, indicating whether the return obtained is due to an excess of risk. To get to the point, it allows us to compare the effectiveness of strategies.

If we are evaluating two trading strategies, the one with the highest Sharpe ratio is the best because it has a lower risk associated. The value of the Sharpe ratio of a strategy in itself is not so important, what matters is its comparison with the value of the ratio of other strategies.

As I have mentioned in other posts, I do not recommend that you base your trading decisions on the results of a single indicator or metric and the Sharpe ratio is no exception, do not use it alone. I personally consider that the Sharpe ratio is nowhere near the best trading measures you can take into account. For example, if you apply a system with lower stop loss and take profit compared to larger ones, the ratio will benefit the former, even if the latter has better statistics.

In addition, the issue of not taking into account positive volatility is a big point against. Having the same weight in positive and negative positions is a great limitation. We need realistic measures and a good X-ray of our trading. Which ones?

And one more thing, when comparing different strategies or portfolios keep in mind that these portfolios belong to exactly the same category, not make sense to compare radically different portfolios where it is more than evident the risks associated with each portfolio or strategy.

Categories
Forex Basic Strategies

This Momentum Strategy Is Nothing Short of Amazing

Momentum is hard to catch. It’s like when you want to go to a party, you arrive and you see a queue of people to get in, you think the party must be great and you pay a pretty expensive entrance to get through. Then you come in, you order a drink and three minutes later the music stops and the party’s over. And there you are, looking silly, seeing how many have had a very “good time” but finding that you’ve missed it.

With a momentum strategy, if you don’t manage it well, it’s pretty much the same. You enter the market with expensive prices and a stop-loss that is far away so that a few candles after the supposed trend is over. Then, in this article we will analyze this type of strategies, to be able to adjust our radar better and thus take advantage of the party as long as possible.

What Is a Momentum Strategy?

A momentum strategy is part of the set of trend strategies. Following a momentum strategy is basically investing (taking long positions) in those financial assets that are showing a clear increase in their price. Those assets that are strongly bullish are bought in hopes that this bullish fortress will continue. In momentum strategies, the strength of movement is the key.

When to Choose a Momentum Strategy

The theory is that all assets have their momentum, you just have to know how to catch it in time. Following the simile of the party, in a city there are several discotheques, but curiously there are only some that – for various reasons- are fashionable and is where there are more people. The fashionable discos take turns, the one that was fashionable last summer, this one is no longer fashionable, but maybe it will be fashionable again in three years. The idea is to be able to find out what the reasons are that make a disco fashionable, or that a financial asset begins to rise so that they can enter in time.

Similarly, going back to the world of investment, we can see that momentum is not a permanent effect. Its duration is limited in time. This forces us to evaluate and alternate the elements of a momentum portfolio on a regular basis.

Absolute Momentum and Relative Momentum

If you analyze the momentum you can distinguish two situations. On the one hand, we have the impulse of the asset for itself ( time-series momentum), and on the opposite side, the impulse of the asset with respect to other values ( relative momentum).

Time-Series Momentum: Autocorrelation in Time Series

The autocorrelation level in an asset tells us if its past and future profitability are correlated. Put simply: the idea is that today’s profitability is related to yesterday’s profitability. In this case, if the degree of autocorrelation is high, it can be interpreted that we can estimate future performance.

Cross-Sectional Momentum or Relative Momentum

In this case, what counts is the profitability plus when we compare different assets. The idea is that those shares or assets that have a higher relative return continue to maintain this advantage over time.

One type of momentum is independent of the other. We can find that an asset shows a positive relative momentum (it is stronger than the others), but nevertheless has an absolute negative momentum (it is in a bearish trend). Conversely, you can also give an asset a positive absolute momentum but still have a negative relative momentum as there are other assets that are rising even further.

How to Measure Momentum?

Do not confuse a momentum strategy with the Momentum indicator. You can use the Momentum indicator to follow a momentum strategy, but you can also use other indicators of technical analysis (such as RSI, ROC, moving averages, etc.) or directly the price analysis.

The Momentum Indicator

This indicator simply shows the price difference between the current candle and the N candle days ago. The value of the Momentum indicator is expressed in absolute terms ( how many € or USD of difference in the quotation). If you prefer to express this difference in relative terms, then use the ROC ( Rate of Change).

The graphical representation of the Momentum indicator is an oscillator that fluctuates around a 0-neutral line. In technical analysis, attention is often paid to the oscillator crossings with line 0 and to the divergences between the Momentum oscillator and the price.

Momentum Strategy Values

In general, a momentum strategy will have good results in assets showing trend behavior. For example raw materials, some currencies, low capitalization stocks… According to some studies, the momentum has a longer duration and impact on those actions with lower capitalization and a lower BTM ratio ( book to market).

One way to know if an asset has a trending behavior, and then it might be a good idea to apply a momentum strategy, is to do the test that is detailed in this entry “Tendencial or antitendential system Which one to choose? “

Advantages and Disadvantages of a Momentum Strategy

Momentum is not a permanent effect. It’s not some kind of “buy and hold” strategy. We have to assess the assets on a recurring basis and if necessary modify the items we have in the portfolio.

  • Consequence 1: It is a strategy that needs regular attention.
  • Consequence 2: Attention to commissions according to the broker you work with.

In the case of following a momentum strategy with actions, the key is in diversification and in managing the risk of each position (as an example you can see this Momentum System for trading with actions). You don’t have stable returns. Investing in momentum is a long-term strategy. In some years it works and in others, it doesn’t.

Examples of Momentum Strategies

A simple example is to use the RSI – relative strength index – to signal inputs and outputs. Now we see that the purchase is made at the time the RSI is greater than 70 and the position is closed when the RSI is less than 30.

This other strategy applies the logic of momentum to commodity futures, rebalancing the portfolio of futures once a month: Momentum Effect in Commodities. Use momentum indicator crosses: Purchase order when the momentum indicator cuts up the 0 line and sale when the indicator cuts down. Strategies of “Dual momentum” where the absolute moment is combined with the relative one.

How? in this case it is started by using a relative momentum strategy while avoiding assets with negative absolute return (comparing the difference in return of the asset with respect to short-term bonds).

Categories
Forex Basic Strategies

Apply These Special Techniques to Trade Reverse Splits

In the financial markets and in the stock market, there are different ways in which companies can manipulate their stock prices, including the reverse split of shares. Manipulation is not always bad. Sometimes, a company has legitimate reasons to change the price of its shares. But that’s not the case when what we’re dealing with is a reverse split in the world of penny stocks.

In fact, for me, it is not excessively important if a company manipulates their actions. Splits aren’t always bad, it depends on the company and why it’s doing it. However, I think it is wise to know well what a reverse split means does and why most penny stocks do it. So, let’s dig deeper into the reverse split of actions. We’ll look at some examples and look at whether they’re good or bad.

What is a Reverse Split?

A reverse split happens at the moment that a company decreases its share amount at the same time that increases the price of the same. A company cannot magically increase the price of its shares, this phenomenon is due to reverse split. Therefore, you have to “get rid” of the stocks to increase their price. As you see, they are simple mathematics.

It seems harder than it really is. Technically, the company doesn’t dispose of the stock, it just combines the existing stock. I’ll tell you what it means later. What does a reverse split mean for an investor? We need to keep in mind that traders and investors have different approaches to seeing markets.

Investors hold equity positions for an extended period of time, usually to obtain a slow and steady profit. Traders, on the other hand, enter and exit the positions of relatively fast action, for potentially faster profits. I have no mania for investors, but investing in the fraudulent stock companies I usually operate in is a very risky gamble.

I make this claim because many times, split is mainly applied to penny stocks. A large company with a price of $100 per share will normally not split: the price of its shares is probably already good. Technically, a reverse split means nothing to an investor: consider the keyword “technically”. I’ll talk about whether a reverse split is good or bad for a company’s shareholders in a short time, but first I wish to clarify something else.

Reverse split basically means nothing to an investor because the value of their position in the company does not change. It simply means owning fewer shares at a higher price. Is a reverse split good or bad for shareholders? Just because a reverse split is not significant to an investor doesn’t mean it’s a good thing. In fact, it’s usually bad news. That may sound confusing, so I’ll look at it. I’ve seen toxic companies do reverse splits for over 20 years. And it usually doesn’t end well.

Why? The reasons for the split must be analysed or divided. A large and reputable company with a stock price of $100 per share is probably financially stable. But a penny stock at a price of 50 cents a share probably isn’t as financially stable. In fact, the company may need to raise money through public offerings. But penny stock bids are often toxic and almost always end horribly badly.

Institutional investors do not want to invest in a company with a low share price with tons of negotiable shares, making it difficult for their investment to make money. Therefore, a company can make a reverse split to look more attractive to potential investors. It reduces the number of shares and increases the price, which greatly facilitates public offers. Public offers dilute the company’s shares and make the company less valuable over time. Reverse splits can be a way for a scam company to hide how toxic it is, usually, is a bad sign for the average shareholder.

How does a reverse split work? Let’s look at a super basic example:

Let’s say Company A has a share worth $100. Since the price of your stock is $100 and you only have one share, the company is worth $100. The total value of a company is usually based on the price of its shares and the stock count. This is known as market capitalization, about which you can read more here.

We have Company B with 10 shares, each stock with a price of $10. That company also has a value of $100. Therefore, the two companies have the same economic value., but their stock prices are different. If Company B wants to increase the price of its shares, it could do a reverse split. But this does not increase the value of the company.

It simply means that the company’s share price is higher. So, if Company B wants the price of its stock to be $100 per share, it would merge the existing 10 shares into a single share now worth $100. Of course, a company cannot simply split up. It has to be managed by its investors who have to approve the split.

Impact on the Reverse Split Market

I’m gonna say it again. A reverse split does not affect the valuation of the company. There is no technical impact on the market for a reverse split of shares in terms of the value of the company. By this, we do not mean that affects shareholders in a long term. The market impact of a stock reverse split is that it reduces the number of marketable shares of the company by combining multiple shares into one. This allows a company that decides to do a reverse split only with the intention of doing something nice skewed things.

Companies that do reverse splits have more capacity to participate in toxic financing, which can be extremely bad for shareholders. Again, this is only if the company decides to participate in toxic financing such as offers in the market. The fact that a company carries out a reverse split of shares does not necessarily mean that it will get involved in toxic financing. But from what I’ve seen in the last 20 years, a lot of them do. But unless the company becomes involved in toxic financing, there is no real impact on the market of a reverse split of shares.

Why Companies Do Reverse Splits

The inverse spits are fundamentally a remedy designed for companies to increase the price of their shares and try to attract investors. Sometimes it’s a way for companies to remain listed on a larger stock exchange.

This is another reason why reverse divisions can be bad news for shareholders. But really, if a company is doing a division to stay on the list, it already had clear problems before the division.

An example. A requirement to stay on Nasdaq’s list is that the price of the company’s shares must be above $1. In a letter from the SEC to Accentia Biopharma, (NASDAQ: ABPI) on the price of its shares in 2008: 

“Market Rule 4310(c)(8)(E) states that Nasdaq may, at its discretion, require an issuer to maintain a price of at least $1.00 per share for a period exceeding ten business days in a sequential manner but normally not more than 20 business days in a row, before determining that the issuer has demonstrated a capacity to maintain long-term compliance”

This is part of the warning that the SEC issued to ABPI about keeping the price of its shares above $1 per share. If ABPI did not comply, it would be removed from Nasdaq. It was finally removed from the list. When companies receive such letters, they usually do a reverse split in order to comply with the requirement.

Do you see why reverse divisions are usually bad news for long-term investors? It may indicate the long-term failure of a company to consistently meet the quotation requirements of a major market, which is not good.

Calculator of a Reverse Split

So, you know a little bit more about reverse splits and what they mean, now I want to help you understand and show you what the calculus for the price of recent reverse split shares. It’s actually quite simple. When a company announces that it will do a reverse split, it also has to announce what that division number will be. Here is another theoretical example. The same concept applies to a real action that makes this type of division and we will cover some real examples later.

Let’s say Company A announces a reverse split of 1:10.

This means that 10 shares held by a shareholder-owned before the split, they will now have one.

Now, suppose Company A had a 50-cent share price before the split. To find out the share price after the split, simply multiply the share price by 10. In this case, an inverse division of 1:10 would mean that Company A would then be traded at $5 per share.

Most stock prices will not be so simple: the price obviously will not always be a round number. In addition, each division is different. Some companies only do a reverse split 1:2, while others can do 1:30 or even 1:50.

In any case, just take the last number of the ratio and multiply it by the share price to find the price per share after the split of the company.

Examples of a Reverse Split

Let’s look at some real examples…

Many penny stocks do a reverse split at some point. Not all but many do.

Pro tip: Know how to calculate a reverse split.

Reverse share divisions can influence stock prices after the split.

Again, the division does not change the value of the company, but it may highlight any reasons of interest to the company. The main question right now would be, how can we find information about reverse splits or other relevant news in the stock world? Use a filter like StocksToTrade. Its new Breaking News feature alerts operators to the latest news, such as reverse splits.

Now, let’s look at some examples of reverse splits.

XpresSpa Group, Inc (NASDAQ: XPSA)

The reverse split of this action took place on June 11, 2020. I completely don’t know why XSPA made the decision to make a stock reverse split, and I won’t waste my time researching right now. If the action leaves good news and comes into play, that’s what I really care about.

Sonnet BioTherapeutics Holdings, Inc. (NASDAQ: SONN)

This reverse split of shares occurred on April 2, 2020. It was actually a 1:26 split: 26 actions of action before division became an action after division. That’s a pretty big jump. Think how a few days after the reverse split, the shares had a giant volume and had a massive move of around $16. This is quite common with the reverse split but does not mean that it always happens.

Remember, many fraudulent companies use reverse split as a way to participate in toxic funding. That usually means they will increase the price of their shares to raise money. That is usually clear from the candle on the daily chart. In the case of SONN, it peaked at over $16 the day news came out, before falling below $10. It would not be strange if SONN had released many of his actions in that movement.

Cyclacel Pharmaceuticals, Inc. (NASDAQ: CYCC)

This action was split on April 15, 2020, only a few days before its massive execution to approximately $19 per share. But like SONN, CYCC seems to have been involved in some toxic funding. Watch carefully the candle that corresponds to the day of its execution. The great wick shows how high it arrived before falling to new lows in the day.

Most likely, CYCC had shares it wanted to release, so it released a juicy press release to generate some enthusiasm. This is an added reason why you should not believe the hype that some news has.

It’s okay to operate on these moves, don’t get me wrong. But many of these companies launch news to raise their short-term stock prices. That is why it is advisable to get in and out of these operations quickly.

Categories
Beginners Forex Education Forex Basics

How to Trade Your Way from $10,000 to $1 Million

Forex opens and an incredible array of possibilities of how you can get your target million. Therefore, there is no single answer. More importantly, the answer you may get might not be adequate to your character, and the way you approach forex trading. Beginner traders asking this question fall into the first and probably the most dangerous trap called “getting rich quick”. This desire in young traders is overwhelming, aligning with the temperament that only spells failure in forex trading, unfortunately. Getting rich quickly in forex is plausible, forex is a game of probabilities, and is also a mechanism where higher risk brings higher reward and vice versa. However, not all risks are justified, some things are just worth trying while others border with stupidity. 

If getting rich quick is what you want to make out of forex, there are some ways of doing it that are better than having any plan at all. So, the key is having a plan. A plan that will increase your odds however abysmal they might be when you are after that $1million during a very short time. At this point, forex trading is more like buying lottery tickets worth $10.000 – scoring the jackpot probability is still way under 0.1% in most major lotteries. There has to be a better way right? Well, increasing the odds is an everlasting quest of a forex trader, do it meticulously, and finding ways to get “lucky” will be opening up in front of you. Instead of presenting how percentages and compounding works, let’s get into a few basic examples to get things into perspective, just note the following ways are not recommended. 

Assuming you are hyped and do not want to spend time learning how to trade like professionals, try to search for a good forex robot. This process might take a few weeks but it is still better than going all-in without any clue where. Try to find good reviews about the robot with a high win rate on a single, specialized asset they run best on since you will need consecutive wins over a short time. Forex robots or Expert Advisors for MetaTrader platforms are numerous, some are free. A higher price for a robot does not mean they are better, just try to find one with good ratings, results, and reviews (be aware of fake reviews). Pay attention to the leverage, how much is put into every trade, and set everything to your $1 million goal time frame. All you have to do is let it run, watch, and hope. By the way, some brokers might be hesitant to pay you out and will probably try to find anything to discredit your incredible gains, but this is another topic. 

Our second do-not-do-it example of how to get rich quick is trading high-risk forex events. Such events are global and deep, like elections or recent pandemic. The extreme moves they cause in a short period are your perfect playground to get that gain you need. Identify a trend that has started on a specific asset, for example, the S&P 500 index or the USD currency pairs where big moves are expected. Now, you need to set your position sizes and leverage to endure the drawdown you might experience as your tolerance for losses is extremely low with the way you are trading, even on an already established strong bear rally. By getting in a strong trend your odds of survival for the first candle (periods) are better than 50% and you also have a chance to win big as the trend continues for days, just know to set a trailing stop optimally. You might still need a few of these monster wins to get to that $1 million but at least you have better odds with a plan. Waiting for these opportunities might take some time, however, it still counts as getting rich quickly. 

The final example is popular and directed to another type of new-age currencies. You got it right – cryptocurrencies. There are several ways to fill your pockets in this market, but similarly to trading forex during extreme global events, you will need extreme mover assets. Splitting your $10.000 across several altcoins with a good perspective to get popular will get your portfolio skyrocketing. All you have to do is research what are good picks. This method applies diversification, meaning the likelihood of losing everything is low, especially if you pick more than 10 coins. Of course, your $1 million goal needs to wait for things to get going, yet if only one multiplies in the value we are talking about extreme gains, possibly above your targets. An example altcoin that changed investor’s lives is the Verge with a 1,581,942% peak gain, going from $0.000019 per coin to $0.300588 per coin from December 2016 to December 2017. Similar to what happened to Einsteinium and Reddcoin. So the odds are much better here than with lottery tickets, especially if you do some fundamental analysis about altcoins. Suddenly picking 100 altcoins and investing $10.000 in them does not sound like a bad idea, just know you will never know when it will happen (if it happens at all), so it may not be as quickly as you expect. 

Now, the recommended way to get rich is by devoting to the process of learning and experiencing forex trading. This path requires effort and not for getting rich quick-minded people. Professional traders sacrificed some time, a few years to get at the top of the game. They do not have extreme triple-digit returns over a year, but they are consistent. They switch high-risk returns for consistency that lasts for a lifetime. The two biggest pillars of trading are Psychology and Risk or Money Management. The analysis comes third after these most important aspects often overlooked by impatient traders. As with the above not recommended methods, start with a plan. Seek out beginner forex trading portals (such as babypips.com) to get the basic understanding of forex and then explore some more advanced topics such as strategies, indicators, trading systems, theories, and some forex psychology books. Improve your knowledge following financial websites and social media channels. Follow smart investors and traders on Twitter and try to find their channels on youtube or some other platform. Some of these figures are going to be appealing to you and your learning curve will get easier quickly, open your mind, and get motivated.

For some, a few years of demo trading and trying things out might be too long but reaching $1 million from $10k is what professional traders actually do consistently. Many spend decades just to try to live with $10k let alone become millionaires. What is great about forex trading is it does not force you to quit your daily, conventional jobs. It is as flexible as it is deep. You may become a purely technical trader, long term investor, crypto holder, but all successful traders have things in common, they all have a plan or system, structured risk management, and have mastered psychological trading aspects. Having a good plan is great, sticking to it is the psychology challenge most cannot overcome. However, with the internet, all the information available to you, all you have to do is dig up a bit and put that $10k to use, $1 million might be just a couple of years ahead.

Categories
Forex Course

This Forex Trading Plan May Actually Shock You

In the forex market where every activity and movement happens rather quickly, traders need to be particularly prepared to take on unexpected challenges. This form of readiness requires preparedness and understanding of various steps that would secure one’s position regardless of external influences or triggers. Naturally, traders may find a specific activity to be of greater difficulty, such as journaling is for many, yet these tasks need to be incorporated and accepted as habits. It is in the acknowledgment of the purpose and effectiveness of having a fixed routine where traders can finally learn how to exercise control and minimize the risks in which this market is so profoundly abundant. As this article focuses on risk as a concept and as an inherent part of the forex market, traders are invited to think through and analyze what their understanding of this term is and assess how much risk they are generally ready to take. Today’s topic is also a path to a discovery of one’s own perception and risk tolerance, supported by constructive advice on how to actively control and limit any risk-related issue, towards learning how to use this knowledge to create a functioning trading plan. 

We know that the forex market is, unlike others, almost always open and this characteristic often draws traders into assuming that they are in a position to take action just because there seems to be movement. This compulsive and uncontrolled drive is frequently emphasized by a desire to increase one’s capital, but they, unfortunately, lack the insight into the market’s nature and the skills to plan their actions. As the market typically moves quite randomly and unexpectedly, traders usually fail to grasp the fact that they can only trade when there is an actual trend or a move taking place that is worth the risk they are about to take on. Due to these reasons, it is crucial that traders learn how to plan their trades, weigh their options, and construct a plan based on the charts.

What traders are summoned to do is strive to understand why their results do not match their initial expectations and become introspective to reach invaluable conclusions. The ability to ponder actively and check in on oneself is key because the realization of what has caused all the losses one has had to take renders the trader free. When people get into thinking of why they made a certain move and what kind of behavior enabled a certain string of events, they may come to understand how their personality is linked to the outcome they have never seen coming. Once they start unfolding layers and opening up to an internalized assessment, traders have a real opportunity to see how their traits and characteristics affect and create their trading styles. What is more, this process also allows traders to discover areas where they are likely to struggle as well as parts of their personality which can be particularly useful for their trading careers.  

Since many of us, including traders with years of experience in this market, lack this deep understanding of why we keep making the same mistakes over and over again, it is high time that we asked ourselves why this keeps happening. Why is it that we repeat the same actions that continually impact our trading in a negative way? Unfortunately, even when traders make a promise to themselves that they would be more disciplined and that would strive to control hazardous behaviors, their actions often fail to follow their thinking. If we had the power to do everything ourselves, we would have corrected our flaws by now. As this is not the case and we are unable to effectively alter the behaviors that proved to be detrimental to our finances and accounts long ago, we need to acknowledge the fact that there is a deeper underlying problem.

Learning the basics of this market may take a few months, after which you will be fairly versatile in charts, currencies, crosses, and rates although, needless to say, the amount of time needed to study yourself is much longer. With the development of a trading plan, you are rounding off your trading career, thus setting yourself off on a good path to prosperity. We know by now how the market is going to oscillate freely and regardless of what you chose to do at a particular moment and, as such, it is still not the least uncontrollable factor – you are. Each trader is the variable that can put effort and work on himself/herself to become a constant in whichever context. And, again, in spite of what market situation you find yourself in, you need to find the beliefs, skills, and steps that will put you in the group of winners because this market is always going to bread both winners and losers under all circumstances.

To be able to create an effective trading plan, traders need to set realistic goals and returns, so once they complete their education on forex basics, they need to move on to its practical applications. It is unfortunate that after years of trading, many individuals still show no knowledge of some elementary terms such as currency swap. What is more, even when they do complete the initial learning stage, traders are faced with the cold reality where many theoretical items of knowledge go against what they are required to do in actuality. As in real life, theory always differs from practice and this is the concept shared across various businesses, asking people to always come up with new and innovative ideas to adjust to real-life situations. 

This article will be divided into several sections – we will firstly assess and explain the forex market, show how it operates, and reveal some interesting facts that traders may use in the future. Then, we will move on to currencies and learn about the major currencies and different monetary systems across the globe. Afterward, we will highlight the differences between going short and going long, which are considered essential for trading, and see how we can use pairs trading. We will also learn how traders actually get their orders filled and how we can reach the market. In addition, we will cover the differences between amateurs and professionals, where you can go through a checklist and assess yourself. Last, we are going to analyze different constituents of a trading plan, giving you a definitive list of the parts you need to incorporate when creating your own trading plan. 

The Forex Market 

The Foreign Exchange market, otherwise known as the FX, Spot, Cash, Currency, or Interbank market is the largest one in the world so far. With an incredible turnover of people and finances, this market is entirely different from any other marketplace or trading experience. As such, forex required all interested parties to exude a special interest in these topics and show a true passion for trading. For example, many expert traders who first started off in some other markets quickly learned that trading currencies differs greatly from experience accumulated while trading equities or futures. With equities, in particular, the stock market opens at 9.30 AM EST and closes at 4 PM EST each and every day. This schedule allows stock traders to go home at the end of the day and relax without thinking about trading or needing to make a move outside their working hours. Trading currencies is, however, vastly dissimilar because of the market uniqueness and the fact that it does not close the way others do. Many professional trades explain how they see forex both as a blessing and as a curse, having experienced the greatest wins and the biggest stress trading in this market. Experts also point out how the FX market rendered their lives less traditional than before owing to the intricate characteristics and a distinctive schedule each currency trader comes to develop over time.

It is interesting to note how traders within the United States of America typically trade currencies on the side, while they primarily engage in trading stocks, options, and/or futures. Traders in some other countries, however, appear to be strictly focused on the forex market because the local markets are quite underdeveloped in comparison to the currency market. Canada could serve as a great example of a country whose stock exchange includes solely a few hundred stocks out of which only approximately 100 have a volume decent enough to start trading in the first place. As the market is simply not big enough in terms of depth and liquidity, Canadian traders are understandably more specific with regard to the markets they choose to trade. Similarly, Indian local markets severely lack structure and are highly affected by corruption, which directly propels locals to turn to currency trading. 

With $4 trillion transactions a day, the forex market is undeniably immense and diverse. As such an immense marketplace, its scope encompasses the US stocks, futures, commodities, and the Treasury markets combined and multiplied by three. Interestingly enough, despite its wide applications from the perspective of geography and the fact that it is so widely dispersed and lucrative, forex actually has no physical marketplace. Stocks, for example, are traded at the New York Stock Exchange and, even though technology has changed the way everything is processed, orders are still sent to the nearest exchange where they are filed electronically whenever a trader clicks to buy shares. Another American stock exchange, the NASDAQ, however, does not have an actual building although it ranks second after the New York Stock Exchange. The advertisements created for this exchange even seem to suggest that traders can actually walk freely into its offices when, in fact, one could only find empty desks and computers in their database located in New Jersey.  

The forex market resembles the NASDAQ, as traders cannot find an actual exchange that they could visit. In actuality, the forex market is comprised of various banks, corporations, and traders that weave this intricate network together. All rates are put on the interbank rate list with thousands of participants giving their bids and ask, thus creating the market in question. Forex is also known for its high liquidity that surpasses any other market along with the unique speed of trade and transaction costs. In addition, when compared with the stock market, forex traders need not worry about the low volume and large spreads between the bid and the ask (or between what you buy it for and what you sell it for). In the currency market that numbers such so many participants, the number of transactions is incredibly high, which entails that traders need not worry about the same challenges that are present in other markets. Aside from its tight spreads, the FX market is also praised for the best possible rates for spreads and commissions. 

Trading styles can be truly diverse and they may vary from one market to the other. As forex is a trending market, most traders are solely interested in directional trading, i.e. traders buy and you sell or they sell and then they buy, although they have a plethora of other options at their disposal. For example, in options and futures, it is possible to try spread trading; in trading stocks, participants can learn about pair trading and, in trading currencies, everyone is mostly governed by the notion of making a profit based on the difference between buying and selling, which is what directional trading essentially means. Despite the many trading variations that traders can test and use, forex is an exceptionally good market for directional trading because of its depth, the lowest prices, and the best trends.

In the stock market, a particular stock can move in a specific direction for a few days or a few hours before it finally pulls back. In the currency market, the price has been known to keep moving one way for five or more days without any substantial pullback. Prices in forex can even keep going down without a bounce for over a month too, which leaves much room for successful directional trading due to the trending nature of this market.

As explained before, it is the nature of this market to be constantly open. In fact, the forex market offers 24-hour access over 5 days a week. It opens at roughly 5 PM EST on Sunday and closes at about the same time each Friday. Due to its availability and ease of access, traders often feel compelled to trade and they often do it excessively, falling into the trap of overtrading. Many professional traders explain how they have struggled with this issue in the past, feeling grateful that they started in some other market first. We have seen above with some other markets how traders are unable to click any more buttons or make additional trades once these markets close at the end of each day. As forex does not have this ability, it is important to remember that we can only enter trades when the market is there or when there is sufficient energy to do so. As in the forex market, we do not need to wait for the following morning to start trading again, we truly need to learn when we can and cannot trade because trading whenever we feel like it is unproductive and quite hazardous as well. 

Most currency trading is done through the banks, which are major market participants that are always in the act of buying and selling, as well as through the interbank rates. The reason why the forex market is always open lies in the fact that one can always find banks to be open sometime, somewhere in the world. The first bank that opens on Sunday with respect to the daylight savings time is located in New Zealand, immediately followed by the banks of Australia and Japan. As the chart below shows, both the Australian and the Japanese banks close just after European banks open, which only points to the nature of the currency markets to always be open and running somewhere on the planet. We can also see how when the US market closes, the New Zealand banks open up, so trading happens continuously. This chart below is clearly very inviting for anyone who wishes to start trading, and with so many options and availability in terms of time, it is easy to fall for the illusion that you can trade anytime, whenever you please. 

High leverage, which is an inherent part of trading currencies, can be either good or bad, depending on how it is used. Many traders struggle with overleveraging, which is one of the fastest proven ways to lose an account. Traders have confessed to having lost 25% of their accounts in the past, and some have even gone beyond 50%. Even with a loss of smaller proportions and of a lower percentage, after two losses in a row, all of a sudden, this person is down by nearly half of their account, which means that they need to double that return to get that back. Even if they do get wins, the losses in between can be so heavy that they enter a downwards spiral causing their account to gradually fall down in value. 

While it is increasingly wise not to start with a lot of leverage, it is also incredibly important to get used to adding leverage to the winning trades. The Forex market is truly exceptional because it proved the traders with the highest leverage power among all markets; however, it is at the same time one of the greatest challenges for forex beginners. It is because of these hidden dangers that traders need to use a strategy and determine where to put a limit. For example, you can limit your leverage to 5%, but there is no need to go all in all at once. You can start slow and buy one lot, and if this turns out to be a good trade, you can then buy another lot and repeat the process again and again. Most importantly, if this trade keeps going your way, you may end up buying five lots in the end, but you do not need to hit your limit right at the start. This is extremely significant advice, as you will be much better off if you gradually build up your position. That way, even if you do take a loss, it is minimal, whereas you leave room for your wins to get really big.

Some additional benefits of the FX market include low transactional costs, low accounts minimums, and above-average profit potential. The amount of cost to execute trades has dropped considerably in recent years. Nowadays, there are no exchange fees and clearing fees since forex is an over-the-counter market. Additionally, individuals today can get started with a minimum account for as little as $500 and there is no doubt that forex trading has massive potential regardless of where you are on this planet.

Currencies

Today, there are more than 80 currencies in the world and, understandably, we cannot possibly trade them all. Despite this diversity and abundance, we only want to trade the most liquid currencies. We have no desire to trade some obscure currencies such as the Indonesian rupiah because there is a lack of volume, the spreads are wide, and there is a lot of slippage involved. Traders are advised to focus on the major eight currencies – the EUR, the USD, the JPY, the CHF, the GBP, the AUD, the NZD, and the CAD. Some people also like to add currencies such as the Swedish krona to this list, which may not make a lot of sense because this currency is highly correlated to the EUR. This essentially means that if the EUR goes up, the krona will do too. Therefore, if either one of them goes down, the other one will follow as well, so experts would typically recommend traders to just trade the EUR in this case. Similarly, a person wishing to trade the Hong Kong dollar might want to know that this currency is pegged to the USD, so trading the latter would simply be more sensible.

As traders should always focus on the major currencies, they should also strive to learn as much as possible about them, including their nicknames. The alternative name for the GBP, for example, is cable, which is completely understandable considering the currency’s history. Back in the 1920s, the very first telecommunications line was laid across the ocean from London to New York City in order to get quotes in real-time. Therefore, whenever someone wanted to get a quote on the exchange rate of the GBP, they had to go through that cable stretched across the Atlantic Ocean. Soon enough they started asking “What’s the quote on the cable?” and the rest is history. It became common knowledge that whenever someone would refer to the cable, this person was referring to the GBP in fact. Additional names for the GBP also include the sterling or the pound sterling, while some other currencies such as the EUR do not have any nicknames. Nicknames can get quite creative, such as the greenback for the USD, and we may see how certain alternative names are often derived from the actual name of the country (e.g. swissy). 

Some traders even shared that when they heard some currencies’ nicknames (e.g. loonie for the CAD), they assumed that they referred to an unstable person due to the meaning of the word. The loonie, clearly, is not a name for someone who is challenged in any way, but the name of the C$1 coin, which originates from the name of the bird (loon) engraved on the front of the coin, which is why the Canadian $2 coin is called the toonie. Each one of these currencies will also have a symbol, and most of them are acronyms or first letter abbreviations that are used frequently in writing and in speech. 
Pairs Trading

Pairs trading is a strategy that consists of going long on one thing and short on something else, which means that traders will always enter two trades at the same time. For example, a trader can show interest in Ford and GM stocks (the two companies’ charts are shown below) and decide to go long on Ford and short on GM. This concept entails that the undervalued stock is bought while the overvalued one is sold short because of the premise that one is a better stock than the other. By doing so, the profit does not depend on market activity any longer because both of these stocks are going to go down if the stock market starts to sink. Should the market go up, however, both of them will also rise in value. In addition, if money starts pouring into the Automobile sector, it will reach both of these stocks too. This is called a market-neutral strategy which entails the effort to reduce the impact of all the things that make stocks move up and down in value. If you do a pairs trade with Ford and GM stocks, you are taking all the components affecting these stocks out of the equation. That way you will inevitably make money if your premise is right. Even if both of these stocks crash, which is what happened in 2009 when GM almost reached zero and Ford went down by 42%, your short position made a profit of 60%.
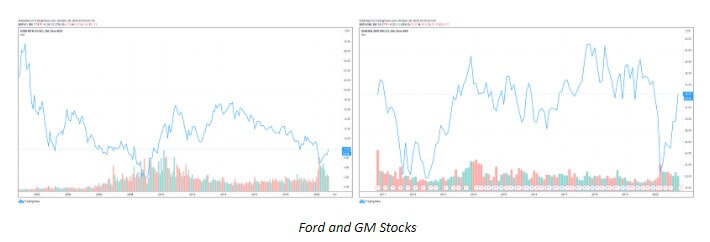
To further clarify the previous strategy and provide additional information, it is also vital that we practically explain what going long and going short entail. The two are found among the most important concepts to remember because trading will always involve one of the two if not both at the same time. Whenever a trader goes long, he/she actually buys something first only to sell it after. Traders always look for a discrepancy in price, so they may buy something for $50 and sell it after for $5 more. This concept is something that most beginners in the forex market seem to comprehend effortlessly. However, early on, traders seem to have difficulty with understanding the other concept because it seemingly differs from what most people are accustomed to. When we go short, what we actually do is sell first and buy second. This is what traders do when they, for example, believe that a stock is going to go down, so they may sell it for $50 (which is allowed), which then makes them short. If the stock goes down to $45 and the trader buys it at that price, he/she makes a $5 profit. Unfortunately, if its value goes up, this person will find himself/herself at a loss. This is the essence of going long and short in trading.

Forex Brokers

Any trader who is ready to make use of his/her system and buy a specific cross must do so through FCM which handles all such transactions. FCM is in fact a name for a broker in the stock market which acts as an intermediary between the two sides. As traders cannot possibly visit the nearest stock exchange and buy 100 shares of a company, they actually have to go through an individual, a broker, having a seat on the New York Stock Exchange. The same applies to the forex market where all traders pass through an FCM because the entire process is regulated in the same manner. Hence, any trader wishing to get to the market must do so through a broker.

In the world of currency trading, there are several brokers traders may already know of. The largest currency trading firm in the world is FXCM, which is also known for its infamous moment when they almost went out of business due to the Swiss national bank decision to pull their peg to the EUR in 2015. The company ended up losing more money than what they had in their accounts, thus threatening all clients’ finances. Luckily for everyone involved, FXCM managed to emerge from the potential catastrophe unharmed as they were bailed out. The company is no longer operating within the United States after it was banned by the Commodity Futures Trading Commission (CFTC) which revealed some fraudulent behavior on behalf of the company. The entire turmoil over the event and disclosure of the information was settled in 2017 when FXCM agreed to pay a $7 million fine and never seek to register with the CFTC again.

Another well-known brokerage firm is IB (Interactive Brokers), which is a huge multinational company often praised for their professionalism. The benefit of collaborating with such a company lies in the fact that it is used to dealing with currency traders and currencies. Besides, Interactive Brokers always wins all the awards for the fastest execution and the lowest cost alongside having been rated first by Baron’s, a US weekly magazine/newspaper published by Dow Jones & Company. Along with that, since all brokers, or FCMs, always publish the percentage of their profitable currency traders, IB usually displays between 15% and 20% of such winning traders although this percentage is at about 50% almost every single month. The company is also preferred by expert traders owing to its professional and fast execution as well as the greatest spreads and fees.
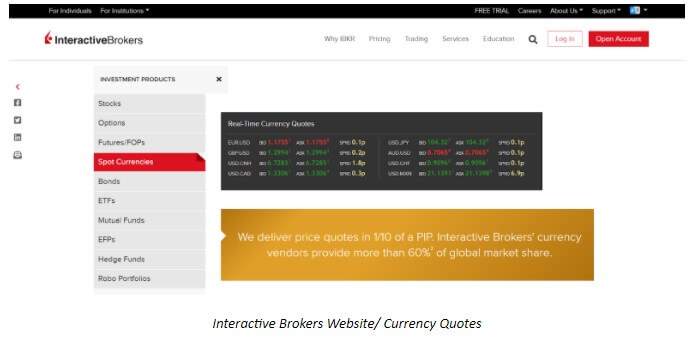
Apart from choosing a broker you wish to collaborate with, it is also necessary to create a demo account after you have worked on your simulator and perfected some of your strategies. Different people will always use different systems, so some traders might opt for MetaTrader for example. MetaTrader operates similarly to IB and traders should expect to become conformable using the platform after a week’s time. Traders are simply required to get used to having and using a demo account; besides, it is typically the place where professionals go too. 

Interactive Brokers also offers multiple trading platforms and they have the best mobile trading platforms (e.g. TWS or Trader Workstation) for which they have already been awarded in the past. These platforms are truly applauded by many forex trading experts who used to have difficulty making a work-life balance in the past due to technological limitations of the time. Most professionals nowadays actually first started to trade in the 1990s, when it was impossible to use phones to check or manage trades unless they were physically behind a system. The internet was a luxury at the time and it was mostly available in the offices only, which meant that traders would have to leave their homes or other social engagements to be able to know where the market was and what was happening, get quotes, or close out a position. 

Mobile trading alleviated most of these problems, so traders are not obliged any longer to go into their offices at night and close their positions which they did not want to keep overnight. These platforms also give traders the freedom to do business wherever they please, and some experts even say how they have had the experience of trading in some unusual places such as a cave or an island. As mobile trading allows you to trade regardless of your current location, it does bear a negative side to it as well. Similarly to the nature of the forex market, which is always open, mobile trading platforms may put extra pressure on traders who are prone to making rash decisions and overtrading. Traders need to have discipline and set up strict rules to prevent making mistakes when they feel bored or compelled to enter a trade, which understandably never leads to success in most cases.

While MetaTrader is undeniably the most popular platform, it typically does not function as an FCM although it can be attached as software to one. Aside from FXCM and IB, traders can also have an account with TDM or ETrade, which equally allow you to make money because they are going to the same place or the same market. Regardless of which platform or broker you chose to use, the rules are always the same. If a trader is unable to trade well and keeps making mistakes taking many losses, he/she will not be able to earn a profit through either of them and vice versa.   

Professionals vs. Amateurs

In order for any trader to make it in this market, every single participant needs to treat the entire process as a professional and set the ground for the next steps. Naturally, in order for anyone to be able to see trading from a different perspective, he/she also needs to grasp the difference between the professional and the amateur approach to trading shown in the table below. Professional traders always have clear trading plans with set goals which may vary between daily, weekly, monthly, and even yearly ones. They also know how to make money in the market and manage their risk through the use of stops/hedges. To ensure consistent and continual growth, experts always keep their records making it a habit despite the difficulty. Moreover, professional traders rely on strategies, which is the biggest difference between the professionals and the amateurs, who are likely to jump on any opportunity. As amateurs are likely to be drawn to any movement they notice without a previously devised plan, they are highly exposed to failure because this approach rarely works since traders need to have specific entry and exit points. Furthermore, amateurs are prone to taking advice and tips from any individuals, while professionals in the market strive to consult with other professionals seeking expert opinion. The more advanced traders have also already made their selection of tools and they insist on using the best suitable ones which have emerged top after thorough testing. Furthermore, they have invested in getting informed and educated on topics that may relate to forex. The essence of prosperity in this market lies in having a plan and as you can see, the moves that amateurs make are not only fewer in terms of numbers but are completely opposite from what professionals do to remain on the top of the game. As a professional, everything is clearly designed and set up, which further entails that traders cannot just click buttons whenever they feel like it.
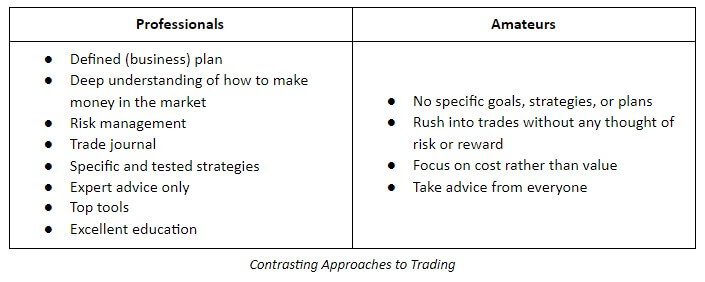
Trading Plan

Before any decision is made, it is crucial to design a trading plan which lies in the basis of any and every activity a trader wishes to take. Simply put, a trading plan translates as the steps you are going to take in every possible situation. It also includes decisions on specific moves you may take on a particular day when an important news announcement is supposed to come out. These choices are never made randomly because they all comprise your trading plan. Every trading plan consists of a number of such decisions that have been drawn and written before any event takes place as a result of your own action or occurring independently in the market. Professional traders predetermine everything and if you do the same, you will know that the market is aligning with your intentions rather than going against you. With a plan and discipline, every trader can achieve success in the forex market.

To better explain what a trading plan is, we need to precisely separate its consistent parts and discuss each one separately. Firstly, the initial part of the trading plan always boils down to several questions: why am I am going to do something; how am I going to achieve this; and, what my hours are going to be? The beginning stages always involve the type of questions that concern the trader alone, while the following parts will mostly have to do with your strategies. Naturally, as there are numerous ways to earn a profit, you may need to ask yourself if you are willing to trade breakouts, cup and handles, hammer candles. It is vital that you assess and predetermine what you are going to trade, letting go of all other options. Traders who fail usually assume that it is enough to just sit down and trade without giving it any thought before, but as you can see, the planning stage is essential for achieving success and each part of the picture is equally relevant. 
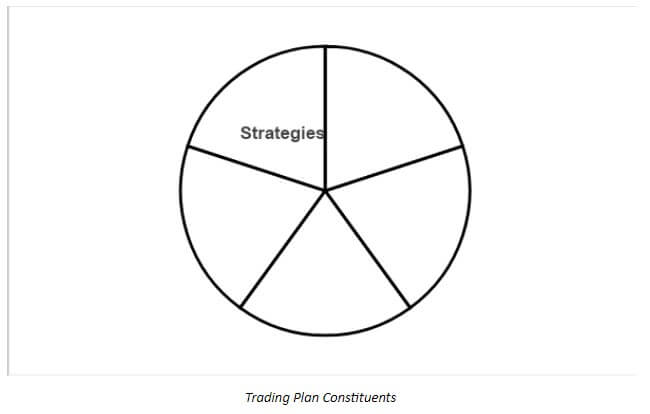
Goals

Before proceeding to read the importance of having clear goals, you can use a pen and paper and create an outline based on these instructions. The first step in your trading plan should be to write about you and determine when you want to complete each stage of the process. For example, when are you going to start demo trading or live trading? When are you going to leave time for education? Is it going to be a span of a few hours on a specific day or will you divide this time frame into several days? You can make use of the list of questions below and fill it with your own answers. Of course, allocating time to clearing up what you want and how you are going to achieve your goals may not be a particularly fun activity but it is the only way to properly build a foundation for your future trading. 
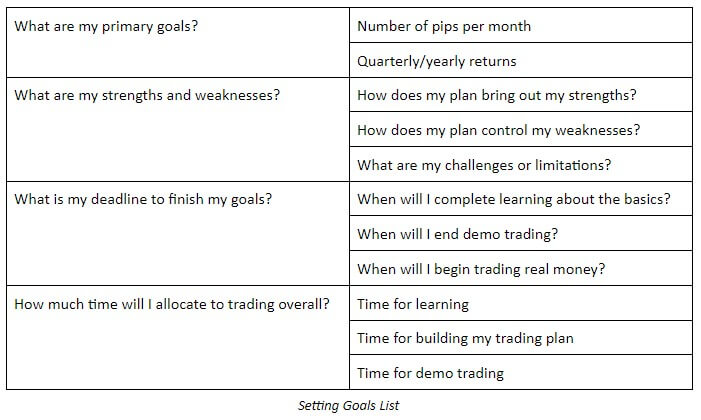
Education

Whenever we discuss education, it is necessary that we first accept that we do not know everything and remain open to being molded and shaped by the information we absorb. Many people turn to professionals for help, but all they are truly looking for is not education but money, wishing to amass a fortune quickly and effortlessly. In trading, however, there are no quick fixes, so if someone already claims to know everything, we may naturally wonder why this person does not already enjoy the abundance that should naturally spring from this richness of information they supposedly possess. When you are open to learning, you reveal that you are a humble individual and that you understand how there are areas you may need to clean up to make room for prosperity. 

While being open to learning is important, it is also vital that you create your own style of trading because no one can trade exactly like someone else. Everyone is different, thus having different psychology, triggers, and personality. Therefore, adopting someone else’s choices and positions might be an unnerving experience, which is why it is important to realize what you can accept, apply, and control. Nonetheless, it is a must for any trader to build his/her foundation slowly and thoroughly. Understand that, as with anything else, there are layers to knowledge on trading, and you can come up with ideas with time how and when you want to learn different things. You should strive to explore classes and lessons that are available and seek professional advice. Expand the tactics and techniques you can apply, and also get educated on other markets where you can trade such as options or futures for example. Last but not least, keep building on your risk management, tools, and skills.

Go through this process and see how the information you take in corresponds to your own personality and traits. Some people may like trading the hourly chart, but you are free to choose any other time frame instead if you feel like that is too slow for you. Most importantly, learn how to use all the knowledge in a practical manner and test it via a demo account. Soak in as much as you can because the more you know, the greater the protection from your own self-sabotaging mechanisms is and, hence, the healthier your trading plan will be.
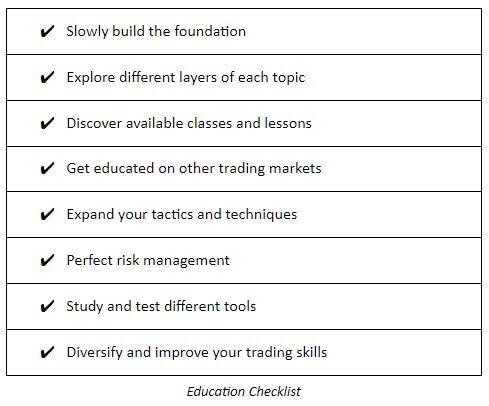
Risk Management

As we all understand by now, every trader is unique, which is why some people are going to want to enter the daily chart, while some others will prefer different time frames. Although these questions are open to interpretation and depend on personal preferences, time management is an area where such variations must not exist. Especially when you start working as a prop trader and you are given someone else’s money, you are expected to treat that money with respect. Nevertheless, one cannot build this kind of attitude unless it is initiated from the very beginning. 

You need to know your rules and as things can quickly turn against you in trading. How can you control the situation and yourself? If you see that a trade is turning sour, when will you draw the line and decide to exit? Also, when you want to enter a trade, how much are you willing to risk if it turns out to be a winning or a losing one? When a particular pair you are trading breaks up above or goes below a certain price, when are you getting out? How much in terms of percentages does it need to pull back for you to exit the trade? All of these points are incredibly important and you need to be aware of them and know the answers in advance. 

Many amateurs start trading immediately, without any preparation, only to realize how they should have learned and figured out everything before they started investing their capital. What this means is that the majority approaches trading as gamblers, not knowing what they want to achieve, how much is at stake, and how much they are willing to risk. As the first rule of trading is to protect your capital, consider the following questions:
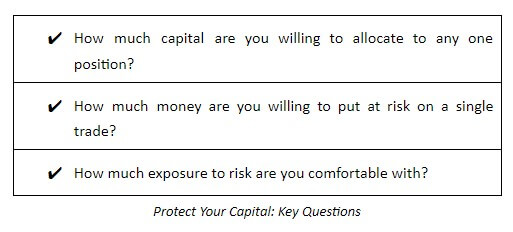
Strategies

Strategies may vary from person to person and they can, in fact, turn out to be vastly different from what other participants chose to use in trading. When creating your own array of strategies, always think of the question of when you want to enter and exit the market. It is vital that you be as specific as possible and explain to yourself every step you may take at some point. For example, some traders only trade specific circumstances such as high breakouts during some events. While this may seem like a narrow option, it is still an excellent approach because these traders clearly defined the circumstances, their goals, and their actions both for a winning and for a losing trade. Even if you wish to try something new, always make sure that you test it before you incorporate it into trading. It is all these points that your strategy list should consist of and, as long as you test everything out with your system and through your demo account, you and your finances are safe. You can also consider the checklist added below to serve you as a reminder when creating your own strategic plan.
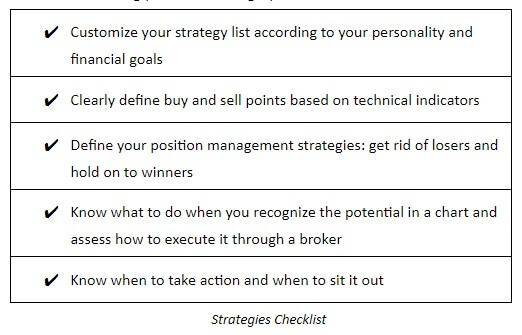
Analysis

With so much room for making mistakes, trading must be kept under close control. To achieve that level of scrutiny, each trader must keep a trading journal. Trading journals are the most effective way in which a trader can keep track of past actions and develop himself/herself. It also allows traders to learn from their mistakes and not repeat them while revealing which behaviors turned out to be beneficial in the past and should be used in the future as well. 

During this process, while you are learning from different materials, taking tests, using a simulator, developing a trading plan, and testing it all through a demo account, you still need to know what your results are. All traders need this form of analysis to know that they are going to make money before real trading begins. Keeping a journal may be the most difficult part of the process for some people, but at the same time, it is difficult to understand why anyone would want to invest real money without any preparation, backtesting, forward testing, and without realizing whether those actions can lead up to any profit. Being detailed and meticulous is a must if you desire to become a professional trader.

Trading journals are essentially Excel sheets where you enter your trades, your win/loss ratio, risk and rewards, percentage of gain, pip gain, and profit/loss ratio. These pieces of information help you know how many pips you earned this month and what your growth percentage is. Journals may differ based on what you want to keep track of – for example, you may keep different journals for a simulator and for your demo trades. 

If you happen to lack this kind of information and do not keep track of these numbers, you are not trading but gambling. However, if you know that after 100 trades, you win 55 and lose 45 of them; if you are aware of the averages you are making on both winning and losing trades and you can compare them effectively, this no longer falls under gambling. Even if your results have not reached the level of satisfaction or success you want to have while trading, by possessing this information, you are already ahead of the majority of traders who go into this business blindly. Keeping your records and tracking your progress is an immensely important topic and one of the major stepping stones to becoming a professional trader where you can independently follow your rules and system.
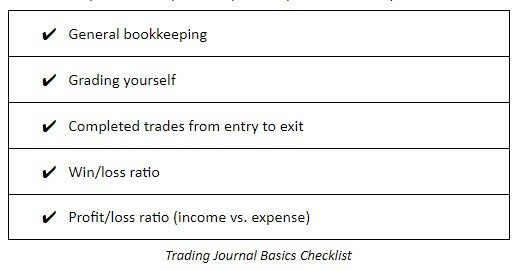
While we discussed a number of different aspects that make the essence of a trading profile and portfolio, understand that this is also the very foundation. You should, therefore, view today’s lessons both as one of many facets that constitute any professional trader as well as an approach to trading that makes it possible for anyone to keep trading. In order to complete our trading plans, we also need to educate ourselves on forex basics, currency pairs, and margins, and pips, thus helping ourselves understand the forex market. After we take in all the information and absorb whatever knowledge we had the chance of learning, the time for practice comes. Practice is not only about trading with a demo account but space where you have room to test yourself and see if you are ready to take on the next level. Practice is also where you should stress your tracking skills and use the time for deep analysis that will prepare the ground for the real game. The matter of fact is that, while all these processes may seem dull and too detailed, all effort will pay off the moment you start trading real money. If you desire to be on top and bear the fruit of the market, you must devote time and prepare to get out of the comfort zone. Use today’s tips and advice as practical steps you can take and as an outline on which you can base your trading plan.

Finally, remember that if you could get over your weaknesses on your own, without seeking expert advice, you would have already managed to do so by now. Understand that some faults and flaws cannot be fixed and that we go into detailed planning so as to create a trading plan that could go around those negative aspects of our personalities. See this process as the most useful way in which you can use your personality, knowledge, and skills to evade your weaknesses, stop repeating the same negative patterns, and get the most from trading in the forex market.
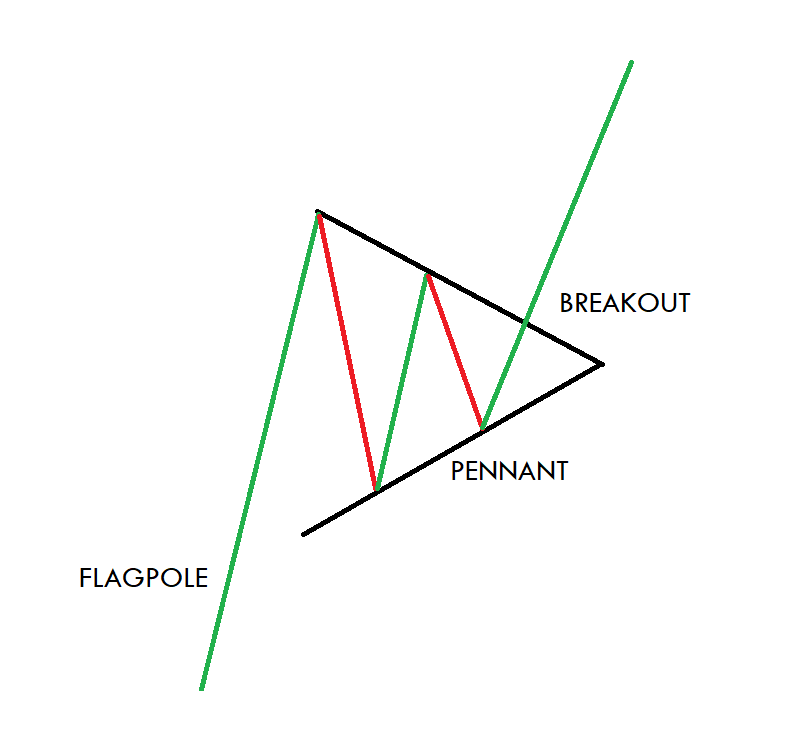
Categories
Forex Basics

Forex Trading: Is there a Holy Grail?

When you decide to become a trader, you might start looking for a magic answer that is “guaranteed” to be profitable. This is only natural, as humans are accustomed to looking for cheat codes. If there’s an easier way to do something, we’re all for it, especially where money is involved. This is why beginners are often drawn in by brokers that promise you’ll make a profit or by similar claims that come in the form of forex strategies or robots that will magically trade for you without ever losing money. At least, these products are advertised in this way, but it’s important to know that these are false advertisements. 

If you’ve been trading for some time, you may have already gotten burned by a shady broker or invested a few hundred dollars into a forex robot that lost money. Or maybe you took advice from someone online that claimed to have figured it all out. We’re not saying that everything you read online is a lie, but it is impossible for anyone to promise that you won’t lose money trading. Allow us to explain why.

First, nobody can accurately prepare for all of the uncertainties that come with the trading market, even if they are developers or very experienced traders. In order to know these things, that person would need to be able to predict what financial institutions will say in the future, predict national disasters, and prepare for other unexpected circumstances ahead of time. Obviously, this isn’t possible.

Another cause of market unpredictability is the fact that it is moved by humans. One person might interpret an economic release in a different way than another while some might hold onto a position longer than others. You can’t always predict what other humans are going to do because different traders think differently. It’s also hard for software like trading robots to predict because they don’t think like humans, who are susceptible to emotions and other uncalculated factors.

Many trading systems that you read about online do work well under certain market conditions, but they don’t perform well under others. Things might go in your favor for a while, then you’ll start losing money when the price shifts into another pattern. This doesn’t mean that these tools and systems aren’t useful, only that they can’t be 100% right all of the time. You can also add to your problems by making mistakes like using too many indicators, which can cause delayed trading decisions or make you feel overwhelmed. 

At the end of the day, every trader needs to know that there is no holy grail in forex trading. Some strategies, robots, and systems work much better than others, that much is true. You can also find some golden advice online, while others may not give you the best suggestions. The key is to figure out what works best for you, develop a solid trading plan, and to manage your risk. Also, always remain cautious when someone promises or guarantees that they can make you rich when it comes to trading.

Categories
Forex Basic Strategies

How To Trade A Ranging Market

One of the toughest things to do in forex is to remain profitable, the thing that is even tougher than this is to remain profitable within a ranging market, some people absolutely love a ranging market while other people hate it, it can all come down to the strategy that you are using and also the type of trader that you are.

A ranging market is basically when the markets are going sideways, there are little movements up and down but it stays between a high and low price range, the unfortunate thing is that it is very easy to make mistakes during this type of market and a lot of traders do a lot damage to their accounts when the markets are in this sort of situation. This is far more preventable in traders who have learned to trade during a trend, either a bull or bear trend when the markets continue in an upwards or downwards direction.

Having said that it is a dangerous time to trade, there are certainly ways to trade within it, and it is still possible to make a profit within these ranging markets. In fact, some people are able to profit more from a ranging market than they can from a trending one, so we are going to e looking at different ways in which people can and do profit from a ranging market, trading in this sort of environment can be quite exciting, so let’s take a look at the ways that you can do it.

Support and Resistance

When you are thinking of trading in a ranging market. The first thing that you should be considering are the support and resistance levels that the market is currently adhering to, you may not actually be trading these levels but knowing where they are will give you a good idea of the current market conditions and how it is performing, it will also show you the potential levels that the markets could reach if the current ranging of the markets were to break.

The first thing that you need to do however is to identify that the markets are actually ranging, one of the main things to look for is that the sideways markets have quite a distance between the support and resistance levels. If the support and resistance levels are actually quite close together then this would be considered as a choppy market and they hold a lot more risk and so it may not actually be worth trading in this condition, so ensure that the support and resistance levels are a little further apart. Trading a choppy market has a form of gambling within it and will not have a very good risk to reward ratio level making it a dangerous time to trade.

There are of course a few different types of ranging markets, these include a perfect range which is when the range reaches the support and resistance levels a number of times, the price will be going up and down in a very predictable pattern, when drawing out the support and resistance levels it should create a very clear rectangle. The next type of range is a ranging market with a pattern, this kind of range often appears to have some kind of direction, there may be a number of lower highs and lower lows which could be suggesting that an onward trend is forming, or the opposite for an upward trend emerging. The thirst type of the ranging market is a range without a pattern, this sort of ranging market is a little less predictable with the prices going up and down with no clear pattern or reason.

By being able to identify the type of ranging market that is occurring will allow you to make a much more informed decision when it comes to the sort of trades that you are going to put on. It would be far better and easier to make predictions in a market where there are patterns forming than it would in a completely random one. When ranging with a pattern can also indicate that the markets are going to potentially move into a trend and can give you an idea of the possible direction of that trend, you will want to avoid trading in choppy markets or a ranging market without a trend as this can be a much more dangerous market to be active in. A ranging market can also occur in the middle of a trend, so it is important that you manage to identify the overall trend direction too.

Trading Support and Resistance

So let’s assume that you are going to be trading in these ranging markets, one of the most simple trading methods is simply to trade the support and resistance levels. So we have marked out our support and resistance levels, we then wait for the price to hit either the support or resistance level, when it hits the resistance level when we want to sell and when it hits the support level we want to buy. Some people suggest that you should only buy or sell once the levels have been breached rather than just hit, trading this method is very simple and is a safer option as there are fewer things that can go wrong. It is important to remember to put on your stop losses a little below or above the levels in order to help protect your account from a potential breakout.

Channel Patterns

You can also trade with channel patterns, these are somewhat similar to trading with support and resistance levels in the way that it is a similar type of trading, we will just be setting our levels a little differently. Channel patterns are something that are offered and available on most charting software tools and packages, you can use them to make the highs and the lows of the markets. You will then work the same way, selling on the highs and buying on the lows, these sorts of patterns can also be used with a trending market and not just a ranging one.

Trading False Breakouts

False Breakouts, otherwise known as fakeouts, are another way of trading these ranging markets. The way that these are normally observed is by a pin bar candlestick that sticks out of the support or resistance levels. It is known as a false breakout due to the fact that instead of then breaking out the market will then continue back into its range. For those that trade breakouts this is a form of trap that can get them stung but for ranging markets they are pretty nice as they can present you with a great opportunity for a buy or a sell.

Bollinger Bands

Bollinger bands are often used to try and work out just how volatile the market share is, the top band will tell you how high the price has reached which the lower band will tell you how low it has been. If the bands are too close together then again this will indicate that the markets are choppy and so it may not be worth trading in this condition. If the bands are quite far apart this can also mean that you should not trade, due to the markets being a little too volatile. You can probably work out how to trade these bands, when the price reaches the lowest band you should buy and sell when it reaches the higher one. It is often a good idea to use Bollinger Bands in a pairing with another indicator such as support and resistance levels.

So those are some of the available trading patterns and systems that you can use in order to trade during ranging markets, it should be pointed out that this is not for everyone. If the markets that you are currently trading in are suddenly ranging, then try looking into new markets, just don’t go crazy and start trading exotic pairs that you have absolutely no idea about, they could be a little more volatile than what you are used to.

Of course, if you are a trend trader or a longer-term trader then it may be the best idea to simply not trade at all, the risk to reward ratio in this sort of trading is often a lot lower than you may be used to, you will be risking more for less, so if this is not the sort of trading you are used to or interested in then the best things for you to do may be to simply not trade at all. There is of course no harm in taking a little break from trading when there is nothing available for you to trade, do not try to force it in order to simply have something to do.

So to sum things up, when thinking about trading in a ranging market you should be looking for the support and resistance levels, you should be looking for patterns and you should be considering how volatile the markets are at the time of your trading. If things fall into place and you want to try it, start small and then build your trading up. It is a difficult time to trade but if you manage to get good at it, it will be another weapon in our trading arsenal and will allow you to trade and be profitable no matter what the trading conditions are like.

Categories
Beginners Forex Education Forex Basics

How Do I Know if a Trading Strategy is Good or Bad?

If you plan to succeed as a Forex trader, you should be able to distinguish between good and bad business strategies. While the easiest way to measure success is to observe the profit and loss summary for any given strategy, there are other issues to consider when choosing a trading strategy.

Trading Strategies Must Be Personal

Business strategies must be personal, and for very good reasons. This is because markets are very volatile and very emotional at times. Many traders implement risky business strategies, and that may not be the best option for you. Just for this reason, if you are thinking about copying someone else’s trading strategy, you should look beyond the basics of the strategy and also consider the aspect of risk management, to determine whether it is right for you.

Be brutally honest: if you don’t feel comfortable keeping an operation in strategy or placing operations according to the rules that are part of that strategy, no matter whether this strategy has an expectation of long-term profitability or not. You will find it difficult to follow the rules and will not achieve optimal results.

Understanding the Expectation

Expectation is a word you should use quite often, especially when determining whether a negotiating strategy is good or bad. A trader will understand that the trading system has a good chance of making money in the long term based on this figure. The expectation is calculated by taking a calculation of the results to calculate the typical profit of each trade place. If negative, the strategy would be a losing strategy. If it is positive, then that strategy is successful. The calculation combines the number of operations that are one with the average loss of the losers and the average gain of the winners as a formula.

The mathematical formula for calculating expectation is:

(Gain % x Average Size earned) – (Loss % x Average Loss Size)

This gives you a general impression of how much you can expect to earn per trade. It doesn’t matter if you make money most of the time or infrequently, it all comes down to what math works in general. For example, there are traders who earn money 15% of the time, but those profits are much greater than its losses that the system can prove to be profitable. The question, obviously, is whether it can cling to a strategy like that. Most people can’t, so clearly you have to think about it.

So, does a strategy always depend on a set of variables?

Some strategies take into account a specific set of variables. To give an example, there is a strategy known as the ‘London Dawn Strategy’, who looks at what London does when London traders and the rest of Europe get on board. This is because the most liquidity during the day is during the European session, so it makes sense that perhaps the large amount of money is making the market move in a particular direction. Logically, if you are working or sleeping at that time, that strategy will not work. It doesn’t matter if the strategy works or not in this case, what matters is that it won’t work for you. Fortunately, there are enough strategies that can work within your boundaries, so all you have to do is look for one with variables that match yours.

The Markets are Changing

One of the most important things to keep in mind is that financial markets change. Sometimes that feeling fades, sometimes it is the general tendency that changes (some would say they are the same). Many long-term traders are very reluctant to change a strategy that is used on a daily basis, but in reality, sometimes the situation demands that you do. It is for this reason that at all times you must be looking for possible changes in the performance of any trading strategy. A really good strategy will adjust to new market conditions, while an incorrect strategy could continue to work when it is not appropriate.

For example, markets may suddenly calm down for several days at a time, and you need to understand how to negotiate this. Obviously, a long-term trend tracking strategy is not going to work as well in this scenario. For this reason, many traders will need to have a couple of different systems, but you have to recognize that it is very important to use the right system in the right scenario. What I want to express with this is that something that uses the stochastic oscillator usually doesn’t work well on a trend, but it does pretty well on consolidation.

Obviously, something that is expecting Bollinger bands to offer trading opportunities will tend to be much better in some kind of trend or at least in general volatility. Knowing the scenarios the system tends to focus on, then it can exchange the appropriate system at the right time and not become obsessed with the results itself, as some systems simply should not be exchanged in certain scenarios. In short, even the best strategies don’t work all the time, so it’s a good idea to consider some solid forex trading strategies when the market changes. Good or Bad Trading Strategies

In Conclusion

I think systems are like tools. In another way, you should be able to apply the right tool to the right job. I also think there’s no “magic bullet,” so you should be careful thinking that way. There’s an unwritten law in the business that can give two traders a winning strategy and expect completely different results. That is the most important thing to keep in mind. Any business strategy can be good or bad, depending on how and when it is implemented.

Categories
Forex Basic Strategies

The “Set It and Forget It” Forex Strategy

Is there such a thing as set and forget strategies? We would like to think that there should be some trading strategies that can work this way, but these should be used with caution and minimal understanding of the market, at least. When we talk about such strategies, the first thing you should know immediately is that they are made to be used with small leverage. After all, the last thing you would want is to be leveraged up to 200 times, perform an operation and then withdraw hoping that there will be some sort of backlash against you, as it could be too costly.

In the investment world, a set and forget strategy is the idea that you can buy or sell something and just retire. This is similar to what a trader shareholder does, buying a share in a company like Walmart while assuming that there will be dividends and that the company will continue to exist. There are no worries about a margin call. They simply buy shares and keep them. This is not the same as in the Forex market, as leverage and volatility make long-term retention a much more dangerous idea. Most retail brokers are speculators, so they tend to focus on short-term strategies.

One of the exceptions was the old carry trade, but that strategy no longer exists for the most part because retail brokers have broken the differentials between paired interest rates. Not so long ago people would just buy something like AUD/JPY at the end of the day interest rate, implying that at the end of the day they received very little payment, but much larger funds were getting advantage of this at the same time, raising those pairs. The financial crisis eliminated many accounts while that kind of trade was dismantled. Unfortunately, many retail brokers face margin calls after months and years of reliability.

Investment and Lack of Leverage

One of the questions you should know about setting up and forgetting strategies is that they are more suitable for investors and less suitable for speculators. This doesn’t mean you can’t use it to speculate, it’s just that you need an appropriate amount of capital.

When you make the decision to invest you assume that the price of a financial asset will be valued over the long term. The average investor is not worried about a 1% decrease in the value of an asset he owns. For example, if you bought a share of Microsoft and it lost 1% today you wouldn’t be surprised or worried. You are probably expecting to own such stock for several weeks, perhaps months or years. You know that in the long run, Microsoft will probably appreciate, or at least pay dividends. Maybe I’d have an emergency stop on the market, but that could be 10 or 15% below the current price. This is because you’re only risking 10 or 15% because there’s no leverage.

Reduce Leverage for these Strategies

Just as you wouldn’t use leverage for long-term trading of financial assets, you don’t need to use it in other long-term trading strategies. It’s true that leverage can make you extremely rich, but the most likely thing that could happen is that you would have a pullback that would cause a margin call, or a pullback later that would make you nervous enough to leave the trade, making it impossible to retain in the long run.

A perfect example would be to use the moving stocking crossing system. Although there are shorter-term versions of this, one of the most common ways to trade with this system is to use an exponential moving average of 50 days and one of 200 days. If the 50-day pass above the 200 day pass you must keep the asset in your possession. In the same way, if the 50-day pass below the 200-day, you should sell it. There will be traders in the market any minute, coming and going as moving socks cross each other. We need not say that it needs a trend to make this happen effectively. The side markets are very difficult when it comes to moving average crossing systems.

In the world of Rex, the way to avoid this potential danger is to take a position with little leverage. For example, if you have 1000 dollars in margin, the size of your position could be something like 5000 units. That’s 5-to-1 leverage. We understand that doesn’t sound like much, but it also gives you the ability to stay in that trade for weeks, months, and even years if the system allows it. Beyond that, if you have losses, and you will eventually have them, these will be small.

Another example of a “set and forget strategy” is to use a longer-term Fibonacci backlash based system. In the example below, you can see that we have the same graph that I used for a moving stocking crossing system. This time, you can see there’s a blue arrow in 50% of Fibonacci’s recoil. Most of the time, the longer-term traders will take 50% back from Fibonacci from a high swing as a sign that they must buy, and use the next Fibonacci recoil level, less than 61.8% in this case, as their stop loss. This case ended in a 230 pips stop loss, but you expect the market to return to its higher values at least. That would be a goal of 700 pips. Obviously, this works in the end.

A stop loss of 230 pips frightens many traders but in the end that depends on the size of the position. I guess the biggest lesson of all is that your position really matters. You will not get rich this way, however, you can create your account without stress. With such strategies, it is necessary to review the charts only once a day. Obviously, there are many other strategies but these are two of the most basic and popular.

Alternatives to Leverage

There are a couple of alternatives if you need to use leverage. One, of course, is to resort to the options market. You can go to the options market and sell against the SPY, for example. This shows that you believe the market goes up and automatically creates leverage. In fact, you can buy calls, there are millions of ways to go for options through your broker or your futures platform.

However, if you are selling and buying FX spot, the only way we know how to use leverage and a set and forget strategy, in this case, is to simply put your stop loss and profit target in order and shut down the computer. It’s possible, even if it’s hard. One of my favorite trades was the short sales of the USD/SGD pair. I went on holiday forgetting that I shortened the market, but I had a stop loss put there. When I came back, I had grown 800 pips.

In a way, all trading strategies must be set and forget, for this is stop loss. If you’re very nervous about a position, chances are you have too much leverage. Think of it this way, you’re gonna be a lot more afraid of losing 1000 USD than you are of losing 10 USD.

Categories
Forex Ichimoku strategies Forex Trading Strategies

Breakdown of the Ichimoku Strategy

Trading only with the Ichimoku will not get you to the top trading levels, but some parts of this indicator are worth analyzing as one of the best you can find according to certain professional technical traders. Taking elements from Ichimoku and applying it to your system is a good idea. Very often taking certain elements with a specific role from other systems and adapting them to your system advances trading to another level in terms of technical precision. However, these improvements are a priority only when you develop money management and a trader’s mindset.

Ichimoku allows a beginner to develop all of it. It has enough parts to cover the most important trading aspects and it is also a base for money management. Of course, developing a proper mindset takes time, and only if you have the discipline not to deviate from the plan. Ichimoku system or indicator will not get you far, at least not into the pro trading level, yet on the other hand, it presents a great path for learning. In our previous Ichimoku article, we have discussed the best ways to use it. Now we are going to see how good it is when each element is separately analyzed. Collectively we already know Ichimoku is a good indicator, but can it be better or can you use some parts of it that are just great on its own for something else?

The synergic effect all these elements create can be broken if you tamper with them, but does it mean a system is great only if its elements are great separately? According to technical prop traders, this holds true, players make the team, however, bad players are unlikely to make a great team however good they are when playing together. So let’s break down the Ichimoku, see how good the elements are. 

The Chinkou Span element is not used very often and is unique to the rules of the Ichimoku system. It is unusual in many ways since it is just a price level line shifted 26 periods back and yet it is used as a trade filter in conjunction with the Ichimoku cloud. Whatever your decision on using it is, Ichimoku trading will still be good enough provided you stick with the plans. According to professional traders, when you trade with it for a long time, you will want to move on and improve. A lot is missing with Ichimoku, forex areas you want to cover and implement into the system. Similarly to playing chess, when you start without any plan or strategy, anyone can beat you. When you follow a structure or a strategy, suddenly you can beat anyone you know. The basic strategy you have will not work against professionals, of course. This is the same feeling we get trading with Ichimoku only after some time. 

Ichimoku indicators are quite old, made in 1930. They still work but makes you wonder is it possible nothing better has been made for almost a century and can new, better indicators be applied instead. When you test new indicators you will see they are not very good, more often they are abysmal when it comes to signals and filters. But occasionally you will find great ones worth keeping. Technical traders say some people hate indicators because they never went on the quest to find the ones worth in gold. Note though, the awesome indicators you find may not play well when you plug them into your system. Creating this algorithm is a lot of trial and error work that not many will want to pursue.

Even though the indicator is great but does not fit however you tweak it, keep it. Systems evolve with your improvement and research, and it may not take a while for this great indicator finds its role in a new system version of yours. Now, Ichimoku has not evolved for a long time, forex has changed, computers have changed, people too, it is interesting how it still works to a certain limit. Additionally, forcing you to use the Ichimoku indicators combination only is a very limiting view and practice. It will not get you far. 

Opinion presented in this article should not concern you, especially if you already have a system that brings profits consistently. It is for those who are still building their system. Ichimoku Indicators are all based on lines calculated based on the price movements. Some will call these secondary indicators, primary is the price action. These lines create a cloud, MA crossing signals, and the Chikou Span on its own. Some people create mystery about the secrets of Chinkou Span, but there are no secrets, if traders do not see how it fits their systems it does not mean there is a secret ( and also profitable?) meaning.

It is common to see people making something more interesting by stirring up a mystery, hype, or other unproven claims. Mysticism explains nothing, however, this trend was popular since the 80s and it was carried over to healthcare, conspiracies, lifestyle, diets, mental practices, and to forex trading too. There is no room for these interpretations for professional traders. Everything technical traders do have a number, a measure, or evident meaning. Ichimoku indicator and especially Chikou Span attract esoteric interpretations you should ignore. There are so many ways Ichimoku can be interpreted and this is not the one you need even though they are popular. 

Since we are going to measure the performance of every Ichimoku element separately, let’s see how Chikou Span goes on a daily chart. You can use this line in the basic already explained way or have some other interpretation with the price, for example. If we look at Chikou Span only, when the price is below the line 26 periods before we trade only shorts, and when it is above only long trades. So it is still a filter indicator and there are even more ways to use it. Try to test is with your favorite trend confirmation indicator.

Does Chikou Span filter bad trades, make your confirmation indicator better? If the answer is yes then you may have an element worth your while. However, according to the testing made by other prop traders, the results are not good and pale to other filtering methods. It should eliminate losers and keep the good as much as possible. Unfortunately, Chikou Span filtered too many winners and not enough losers whatever method we have used. So we are eliminating this element from our list, we will have to find other filters. But let’s move on to other arts of Ichimoku.

Ichimoku Cloud is formed by Senkou span A and B. The cloud is the purpose of these two lines. Traders also have many ways to what they pay attention to and how they interpret signals or filtering with the clouds and the lines. There are three main ways. The first one is the classic way, take only shorts if the price is below the cloud and vice versa. The second one is using the cloud extension. If you have noticed, the cloud goes beyond the current asset price, into the future.

Since we have it in the future, it can also mean it is plotting a prediction of how the price can behave. The cloud has a bullish and bearish color, usually marked by green and red shade. The cloud will shift bullish and bearish shades telling traders there is a price momentum shift probably too. The third most common use of the cloud is as a dynamic Support and Resistance. Traders will interpret any price breakouts out of the cloud as a signal to enter a trade. In this case, the cloud is a signal generator and a reversal predictor, not a filter indicator. 

Now when we test the breakout way of interpreting the cloud we do not have consistent results. There are many cases when the price closed and broke through the cloud only to reverse. Some of the breakouts are false, some are good, overall not good enough compared to other tools. So this method is not classic but it does not mean it is better either. However, you will need to test this out yourself. As for the reversals, we found it is hard to define a reversal signal as the price can enter and get out of a cloud multiple times in a couple of days. This problem is especially apparent when in ranging areas, where reversals should work better than in trending. Whatsmore, reversal strategies are not as good as trend following according to many studies. We will eliminate the breakout way of how the cloud is interpreted and move on to the cloud predictor way.

Whenever the Kumo Cloud turns its colors, this is a signal the price is going that direction. When we have a future shift and see the cloud in front of the current price, we can use it as a predictive signal whenever it switches colors. Is it accurate in predictions? According to our tests, its performance as a trend confirmation or prediction is abysmal. It even feels like the prediction part of the cloud is there just because the cloud is used as a filter in a classic way, and the rest of it is just the result of the code. It was never meant to be a confirmation or prediction tool.

It would be great to have something that predicts the price, even with average accuracy, but we have not found a way to have anything remotely useable. A combination with other indicators could make it better, and it can be your quest to find it. Just do not invest too much effort into something it is unlikely to get better. We say this because no indicator can predict the effect of the big banks, news events, and other catalysts. The only way to partly predict this is by having insider bank information. Let’s move on to the next way. 

We have only left the classic Ichimoku cloud role interpretation. While trading this way, one cannot notice trades are far apart if we trade only when the cloud filter allows for it, without any other rule, such as when the price breaks through the cloud. Now, this is great for training your discipline but it definitely filters out trends that make a difference to the balance have you taken the trades filtered. On some occasions, only two to three trades can happen on a particular currency pair in one year. This is not optimal if you want to forward test some system, it would take you a long time to have a good trading sample. When you get advanced, the Kumo cloud is not good enough. If you are a beginner, the cloud and complete Ichimiku will teach you a lot of essential skills. 

After all said and done, the cloud and all of its interpretations do not have a place in prop traders’ algorithms. Moving on to the last pieces of Ichimoku, the MAs. In the article about crossovers we have presented the drawbacks and how MAs can be used more effectively. If we take the classic Ichimoku approach and wait for the MA crossover as a trade entry signal, they tend to lag too much, similarly to the other MAs types. This is not about the settings, it is inherent to crossovers no matter what settings you set. If we take the price instead of one MA and use it as the signal generator when the price close-crosses the MA, we have a whole new result. We can take the faster MA out and use only Kijun-Sen.

What we get is very good entries but not quite in line with our usual Take Profit and Stop Loss levels according to the ATR. There is simply too much drawdown. However, Kijun-Sen can play a critical role if we follow our system structure. Kijun-Sen is a top-rated Baseline element to some prop traders. On its own, it can generate consistent results if each crossover is taken as an entry. This means it is a very good candidate for our system that can refine the signals once use in conjunction with other elements. 

Kijun-Sen is the element we can take out of the Ichimoku. We have described the Baseline in another article, according to one trader’s ranking, Kijun-Sen is top 100 indicator in the baseline category. You do not need to adjust the settings if you follow our structure on the daily chart. The baseline is also the core for our money management, it is the starting point for our ATR measurements and it is involved in some of the trading rules. Now you have something for a takeaway, still do not stop your search for better tools. Kijun-Sen will up your odds tremendously, still, it may not be enough for the elite rank. 

Finally, you can trade Ichimoku, test it, see it in different ways, even find something we did not, there is nothing obligatory in this article. Ichimoku has a forced group of indicators, it will force you to trade its way even though it has limited performance. Later on, when you need to advance, you need to make your system. Kijun-Sen based indicator already exist, some of them have some addons that may or may not improve its effectiveness. One example of such an indicator is Jurik Smoother Kijun-Sen by Mladen, available for free. It is available on various popular trading websites.

Categories
Forex Basic Strategies

Design, Approach, and the Selection of Trading Strategies

In quantitative trading, there is a typology of systems that is practically impossible, but only two general approaches to constructing them: The analytical and the statistical. Both will face the processes of optimization and selection of strategies in a very different way, affecting even the way in which the results of a backtest are interpreted and evaluated.

APPROACHES TO SYSTEM DESIGN

The analytical approach, also known as the “scientific approach” or “Quant approach”, investigates the processes underlying market dynamics. It analyzes in-depth its large-scale structure and microstructure, trying to find inefficiencies or alpha-generating sources. For example, it conducts studies on:

  • The sensitivity to news and the speed with which markets absorb their impact.
  • The specific causes of some seasonal phenomena observed in commodity markets.
  • Interest rates and their impact on different asset classes.
  • The way high-frequency trading alters the microstructure of a market.
  • The effect of the monetary mass on the expansive and contractive phases.
  • The “size factor”, the “moment” and the dynamics of reversion to the mean.

As a result of these often interdisciplinary and highly complex studies, researchers formulate hypotheses and construct models that they will later try to validate statistically. In this approach, the backtest aims at the historical analysis of the detected inefficiencies and their potential to generate alpha in a consistent manner.

The next step will be the construction of the strategy itself: Operating rules are formulated that reinforce or filter out this inefficiency. Some will be parameterizable and others will not. Therefore, the risk of over-optimization is not completely eliminated. However, the big difference with conventional systems construction is that researchers know in advance that there is a useable inefficiency and More importantly, they have an explanatory model that links it to processes that affect markets and modulate their behaviour.

The statistical approach does not pursue knowledge of market dynamics nor does it make previous assumptions about the processes that lead to inefficiencies. Search directly into historical data patterns, cycles, correlations, trends, reversion movements, etc. that can be captured by system rules to generate alpha. The rules can be crafted by manually combining the resources of technical analysis based on previous experiences or using advanced techniques of data mining and machine learning (ML).

Here, backtesting occupies a central place, since it allows us to distill the strategy in a recursive process of trial and error in which an infinite number of rules and alternative systems are tested. Optimization arises from the progressive adjustment of rules and parameters to the historical data series and is calculated by the increase in the value of ratio or set of criteria (Sharpe, Profit Factor, SQN, Sortino, Omega, Min. DD, R 2, etc.) used as an adjustment function.

The big problem with this way of looking at things is that we will never be able to know with certainty whether the results we obtain have a real basis in inefficiencies present in price formations or arise by chance, as a result of over-adjustment of parametric rules and values to historical data. On the other hand, ignore the processes involved in the generation of alpha, converts the system into a kind of black box that will have the psychological effect of making the trader quickly lose confidence in their strategy as soon as the actual operating results start to be adverse.

Obtaining data mining systems need not lead to over-optimised or worse quality strategies than in the analytical approach. In our opinion, the keys to this procedure are:

-Starting from a logic or general architecture consistent with the type of movements you want to capture. This will lead us not to improvise, testing dozens of filters and indicators almost randomly.

-Rigorously delimit the in-sample (IS) and out-sample (OS) regions of the historical, ensuring at each stage of the design and evaluation processes that there is no “data leak” or contamination of the OS region.

Do not fall into the temptation to reoptimize the parameters or modify again and again the rules when we get poor results in the OS.

Keep the strategy as simple as possible. Overly complex systems are authentic suboptimizing machines. The reason is that they consume too many degrees of freedom, so to avoid an over-adjustment to the price series we would need a huge historical one that surely we do not have.

Even taking all these precautions, there is a risk of structural over-optimisation induced by the way such strategies are constructed and which is virtually impossible to eliminate. Takes different shapes depending on whether the strategy construction is manual or automatic:

In the case of craft construction, and even if regions IS and OS are strictly limited, the developer has inside information about the type of logic and operating rules that are working best now and ends up using them in their new developments. Markets may not have memory, but the trader does and cannot become amnesiac when designing a strategy. Perhaps you will be honest and try your best not to pollute the OS with preconceived ideas and previous experiences. But believe me, it’s practically impossible.

In the case of ML the problem is the extremely high number of degrees of freedom with which the machine works. A typical genetic programming platform, such as SrategyQuant or Adaptrade Builder, has a huge amount of indicators, logic-mathematical rules, and input and output subsystems. Combining all these rules, many of which include optimizable parameters, the genetic algorithm builds and evaluates thousands of alternative strategies on the same market. The fact that two or more regions of history (training, validation, and evaluation) are perfectly limited does not prevent many of the top-ranking strategies from operating in the OS by chance, instead of demonstrating some capacity for generalization in future scenarios.

OPTIMISATION AND SELECTION OF STRATEGIES

If we start from a simple dictionary definition, optimization in mathematics and computing is a “method calculate the values of the variables involved in a system or process so that the result is the best possible”. In systems trading, an optimization problem consists in selecting a set of operating rules and adjusting their variables in such a way that when applied to a historical series of quotes they maximize (or minimize) a certain objective function.

Depending on the approach, the concept of optimization takes on different meanings. In the analytical approach it is optimized to:

  • Adjust the parameters of a previously built model to the objectives and characteristics of a standard inverter.
  • Calibrate the sensitivity of filters that maximize detected inefficiency or minimize noise.
  • Adhere to the operating rules to the time interval in which inefficiency is observed.
  • Test the effectiveness of rules in different market regimes.

In general, this is a “soft optimization” since the alpha-generating process is known prior to the formulation of the system. In contrast, in the approach based on data mining, optimization is the engine of strategy building. It is optimized for:

  • Select the entry and exit rules.
  • Determine the set of indicators and filters that best fit the data set.
  • Select the robust zones or parametric ranges of the variables.
  • Set the optimal value of stops loss and profit targets.
  • Select the best operating schedule.
  • Adjust the monetary management algorithm to an optimal level in terms of R/R.
  • Calculate the activation weights in a neural network.

In the ML world, the historical data set used as IS, and the testing or evaluation period (testing set) to the off-sample or OS data is called the training period (training set). Configurations that are subject to evaluation are called “trials”. And this number of possible trials depends on the complexity of the system to be evaluated. With more rules and parameters, more configurations, lesser degrees of freedom, and greater ability to adjust to the IS series. In other words: The more we adjust and the better the system works on the IS side, the less capacity to generalize, and the worse performance on the OS side.

In a realistic backtest the average results obtained should be in line with those of actual operation. But this hardly ever happens, because during the construction and evaluation process many developers make one of the following five types of errors:

ERROR I: Naïve evaluation. The same data is used to build and evaluate the strategy. The whole series is IS and the results obtained are considered good -perhaps with some cosmetic corrections. It is surprising to find this error even in academic papers published in prestigious media. In our opinion, any backtest that does not explain in detail how it was obtained is suspicious of this error. And here it is not worth putting the typical warning that it is “hypothetical data”: They are not hypothetical, they are unreal! And the whole industry knows, except the unsuspecting investor.

ERROR II: Data contamination. Due to the poor design of the evaluation protocol, data are sometimes used in the OS that has already been used in the IS. This usually happens for two reasons:

The IS-OS sections have not been correctly delimited in the evaluation phase. For example, when performing a walk-forward or cross-validation. Information from the OS has been used to re-optimise, or worse, to change the rules of the strategy when the results are considered too poor.

ERROR III: Historical too short. There is not enough history to train the strategy in the most common regime changes in the markets. In this case, what we will be building are “short-sighted” systems, with a very limited or no capacity to adapt to changes.

ERROR IV: Degrees of freedom. The strategy is so complex that it consumes too many degrees of freedom (GL). Such a problem can be solved by simplifying the rules or increasing the size of the IS.

In a simple system, it is easy to calculate the GL and the minimum IS needed. But what about genetic programming platforms? How do we calculate the GL consumed by an iterative process that combines hundreds of rules and logical operators to generate and evaluate thousands of alternative strategies per minute in the IS?

ERROR V: Low statistical significance. This usually happens when we evaluate strategies that generate a very small number of operations per period analyzed. With very few operations the statistical reliability decreases and the risk of over-optimization skyrockets.

We can approximate the minimum amount needed for a standard error that is acceptable to us, but it is impossible to establish a general criterion. Among other things because the amount of operations is not evenly distributed in the different periods. For example, when we work with volatility filters we find years in which a high number of operations are generated and others in which there is hardly any activity. Does this mean that we will reject the system because some OS cuts, obtained by making a walk-forward of n periods, have low statistical reliability? Obviously not. The system works according to its logic. So what we could do is review the evaluation model to compensate for this contingency.

Another example would be the typical Long-Term system applied in time frames of weeks or months and that does at most ten operations per year. In these cases the strategy cannot be analysed asset by asset and the only possible analysis is at the portfolio level, mixing the operations of the different assets, or building larger synthetic series for a single asset.

A cost-effective and fully functional strategy does not need to meet all these criteria; it is a table of maxima. However, as long as it does, we will have more reliable and robust systems.

On the other hand, this issue does not look the same from the point of view of the developer and the end-user of the system. As developers, we will approach these criteria as long as we have a well-defined protocol that covers all stages of design and evaluation. And, of course, if we also want to meet the first requirement, we will have to spend a lot of time on basic market research.

When the strategy is designed for third parties, these requirements are only met under the principle of maximum transparency: The developer must provide not only the code but all available information about the process of creating the strategy. Actually, this is not why the vast majority of systems available on the Internet to retail investors by sale or subscription. That’s why we’re so skeptical of “black box” or similar strategies. We don’t care if someone puts wonderful curves and fable statistics on their website. That’s like wrapping a box of cookies in a supermarket: If we can’t taste the product, we can’t say anything about it.

Categories
Forex Basic Strategies

Turtle Soup +1 Forex Strategy

Important decision-makers are accountable. The decision to conclude a transaction is the trader’s prerogative, which must take into account the behavior of market professionals and crowds. Many players prefer to wait for the end of the trading day. Therefore, traders who use the strategy Turtle Soup have time to think about an exchange with a more balanced approach. An operation is transferred the next day of negotiation and this strategy, which is updated and is called “Turtle Soup+1”.

The creator of the “Turtle Soup+1” strategy is Linda Raschke. She highlighted the following conditions necessary to build a trading system:

– The market falls to a bottom of 20 bars.

– The previous 20-bar background must have formed at least 3 trading sessions before (for the daily chart).

In this scenario, the trader has the opportunity to:

– Place an order pending to be able to buy in the previous minimum level of 20 bars lower on the second day after the formation of a new bottom of 20 bars.

– Place a stop protection order at the new minimum level of 20 bars lower or at the minimum of the next day, depending on which of them is lower.

– Set a portion of the winnings in 2-6 trading days and use a floating stop order to control the rest of the position.

In early May, in the daily chart of USD/JPY appeared the necessary conditions to implement the strategy «Turtle Soup+1»: a minimum of 20 bars were formed and the previous minimum of 20 bars was created 5 days before. A trader waits for the closing and places a pending purchase order the day after the formation of the new minimum of 20 bars. The activation of the pending order allows us to place a stop order at the minimum level minus a few points and observe the market reversal. After 2 days part of the position closes and the market grows 4.5 figures.

Having a reserve time allows the trader to analyze the situation in different periods of time. In the USD/JPY daily chart RSI was moved to the oversold zone, which may be a confirmation signal of a correction or a reversal of a bearish trend.

Everything that is fair to the bearish market in Forex is also applied in a bullish situation. The algorithm for implementing the “Turtle Soup+1” strategy in bullish conditions is as follows:

– The market is growing at a peak of 20 bars.

– The previous peak of 20 bars must have formed at least 3 trading sessions before.

– Place an order pending sale at the previous maximum level of 20 bars on the second day after the formation of a new peak of 20 bars.

– Place a stop protection order at the new maximum level of 20 bars or at the maximum of the next day, depending on which of them is higher.

– To fix a part of the profits occurs in 2-6 trading days.

– A floating stop is used to control the rest of the position.

A good example is a situation that occurred on the USD/CAD chart. The distance between the new and previous maximum of 20 days is 8 bars, the opening of the position is made the day after the formation of the pattern.

By taking time out, a trader can move to a shorter time frame and see a clear divergence MACD, which is an important investment signal in technical analysis.

In my opinion, the strategy “Turtle soup+1” is more interesting than “Turtle Soup”. It does not require an instant reaction and a trader has time to think well about a transaction. On the other hand, a trader always has the possibility of failing a trade while waiting for the second bar to form, which follows the end of 20 days.

Categories
Forex Risk Management

How to Deal with Losing Streaks and Drawdowns

One of the aspects of being a professional trader for which many are unprepared is the depressing periods of drawdowns in forex. Losing streaks can shake you and wreak havoc on your emotions, levels of confidence, and feelings of self-esteem. If you’ve been operating for a while, you’ll know what we mean. Consecutive losses place you in a state of “panic,” which severely degrades your decision-making process.

So what can we do? How can you recover from a losing streak or even avoid it in the future? Forgive our frankness, but the reality is that you cannot completely avoid this kind of accumulation of lost trades, they are simply a fact in trading. That is why it is very important that you learn to prepare, anticipate, and deal with this inconvenience, so when the time comes, the mental and emotional impact will be reduced.

Don’t be one of those traders who thinks “this won’t happen to me” because the reality is that someday it will happen to you. Even the best trading system that can exist is not free from the occasional losing streak. Trading is a profession that focuses on statistics and probabilities, so it is very unhealthy to believe that you will never lose money. You should wait for the losses.

In the “heat” of a drawdowns period, your future as a forex trader will be determined by the way you handle yourself in that moment of hopelessness. Will you collapse under pressure and let your account disintegrate along with your emotions? Or will you remain strong, disciplined, and logical while maintaining a rational mindset and maximizing your chances of surviving the storm?

In today’s guide, we will share some tips to help you through those difficult times on your way to trading.

Drawdowns in Forex: Don’t Let Your Mind Fool You

Placing an operation is quite easy, perhaps excessively easy. It’s just a click on a button and in a matter of milliseconds, your operation is running. The ease of placing a transaction can make a trader act on impulse without really thinking about what he has done. This is especially true when you feel emotional, such as having had some consecutive losses.

When you plant an operation, you do it because you think the odds are in your favor, and you’re exploiting your advantage in the market. When you are suffering the effects of your emotional side due to a drawdown, it is easy to despair and have a sense of urgency to take another operation in an attempt to recover the recent losses. This happens even if there is no good operation to take. It is called revenge trading.

When you operate in despair, you make bad decisions, and the market uses those feelings against you. You will begin to convince yourself that there are good setups in front of you, like a person stranded in the desert who sees mirages in the distance. It’s just your mind playing tricks on you.

It is important that you maintain discipline, taking only high probability operations and not starting to operate setups of the 2nd or 3rd category just because you are eager to get your money back. Consistency is the key to success and will be a vital component in recovering from a losing streak.

Use a Trading Journal to Highlight Potential Problems

You must keep a diary designed not only to record your operations data but also contain the psychological components of your operations. This way you can track your “feeling” and “mental state” during the different phases of your trading.

Such psychological data can be used during losing streaks. Go back to your recent operations in your journal and compare all those that make up the drawdowns period. There’s a good chance you can do it to see a common problem or weakness in the way you felt at the time.

It’s very likely that all this escaped your attention in the heat of the moment when you pulled the trigger. Surely the only thing on your mind was the desperate thoughts of getting everything back with a big winning operation. The problem is that many traders will do almost anything to recover their losses in the market, but they are willing to do very little when it comes to improving their emotional and mental performance.

Before taking any surgery, you should check your diary and remind yourself what happens when you operate on impulse and without discipline.

Maintain Positive Risk-Benefit Ratios

Remember, forex is a business, and businesses need a return on investment. Every time you place an operation you are risking some of your capital with the intention of getting a return on the investment. You only risk that capital when your trading system tells you that the chances of getting a good return on your risk are in your favor.

Positive benefit-risk ratios are a mathematical concept that ensures you aim for a return greater than your risk in each of the positions. When you do the accounts you discover that the positive ratios allow you to have more operations with stops executed than those whose objective was reached and still maintain the ability to grow your account.

If you remain disciplined and focused, you will eventually begin to see your operations achieve their objectives. It is not uncommon for a properly planned operation to eliminate all losses from a slump. Maintaining strict money management is vital during difficult times, and positive risk-benefit ratios should be at the core of any sound money management system. If your money management strategy allows your losses to be greater than your profit goals, then discard them before they destroy your account.

Have Faith in Your Trading System

Losing streaks come and go. Operating with a system you can trust and put your faith in will be very important. Just as with a diet, if you don’t think it’s helping you, you won’t get attached to it and therefore never reverse your unhealthy habits. A trader needs confidence in his trading system to be able to stay in good mental and emotional condition. Trading is useless if you do not believe in the trading methodology you are practicing.

We know losing streaks will make you question your trading strategy and even tempt you to make those “in-flight adjustments” to your plan. Remember that the market is dynamic and goes through different phases. One or two of these phases may not work very well with your system. If you start changing your rules, you could turn your trading system into something useless during market conditions in which you would have experienced good profits.

Don’t try to fix something that isn’t broken: no strategy has a 100% success rate. One aspect that we find critical is that you understand the reasons why you take the operations that your system generates. Many traders blindly follow the alerts that come out of some “magic indicator” they have bought. The trader has no idea why he’s pulling the trigger, he only does it because the gauge tells him to.

How can you trust the system if you don’t even know where those operations come from? The focus should be on how the trading system sends the signals. It should be based on a logic that you can understand. This is one of the innumerable reasons why like price action trading. Operating with price action signals allows you to understand market movements and safely identify high probability situations in which you can pull the trigger without hesitation.

Refresh

No matter how long you’ve been trading forex, every day you face a major new psychological challenge. If a forex trader tells you he can operate without emotion, he’s lying. As a trader, you will always be struggling with your emotions, making sure they stay away from your trading decisions.

The periods of drawdowns caused by losing streaks will blow up your emotions and there is a good chance that they will start to bring out the worst in you. Most people take their trading performance personally, and these losing streaks become a reflection of how they see themselves as people, resulting in low self-esteem and periods of depression.

Whether you like it or not, you will experience emotional upheavals from time to time. The way you handle yourself in these situations will be what will strongly impact your chances of success. Sometimes a trader could bring to the trading screen the stress of his outer life, coming from a bad day at work or a family discussion.

The best thing you can do when you’re emotional is to get away from the graphics. This is so simple, but it can do wonders for you. Sitting in front of your trading screen in a negative state of mind is unhealthy.

Get up and go do something that takes your mind off trading. Go to the gym, it’s important to stay healthy; watch a movie, or organize something with your friends. Socializing with other people will be a refreshing experience of the solitude of your trading table. You will notice that once you have participated in some activity that you enjoy, you will return to the markets with a fresh and positive attitude.

Operates on Favourable Terms

One of the big problems of novice traders is that they tend to look at a single market and sometimes become obsessed with it. They tend to confuse bad price action signs with good ones, due to the lack of consideration of market conditions surrounding the signal. Trends are the place where you can make a lot of money, and consolidation periods are just “black holes” that work as traps for your money. Operating when the market is going nowhere is like whipping a dead horse and expecting it to do something.

Often traders are taken to stop loss on the first operation and then start “revenge operations” on the same market to try to recover the lost. It might be helpful to create a rule for yourself that you will stop operating for 24 or 48 hours if you have more than 2 missed operations on the same day. Market conditions should be the first check when you look at the charts; if there’s no movement, do yourself a favor and stay away from that market.

Don’t Give Up on Me!

Remember, losing streaks are not uncommon in trading. Each operation individually is completely independent of the previous one and the next one. Just because you’ve had eight losing operations doesn’t mean the next eight can’t be winners.

Don’t despair or get anxious, if you do this your money will flow into the pockets of traders who have confidence and discipline. Always keep money management positive-oriented, so your winning operations will outperform your losers, making drawdowns periods somewhat less likely.

Do not be prey to revenge trading or panic trading. You need to maintain confidence in your trading system, remain patient, disciplined, and always have realistic expectations of the forex market. If you are looking for a system that is logical and in which you can understand why you are placing each operation, then price action is our recommendation for you.

Categories
Forex Basic Strategies

Can You Earn Money on Forex Using Volume?

Unlike stock and futures traders, most retail Forex traders are not yet able to rely on volume data as an indicator to determine when to enter and when to exit operations. This is regrettable, as volume data can be much more predictive about future price movements than the same technical analysis based on pure price. There may be ways to get a better idea of where you are making the purchase and sale beyond what is already known.

There are three possible sources of volume information that a trader should be able to use in their operations. Let us take a look at how easy it is to access such information, going from the most difficult to the simplest.

Depth of Market (DOM)

Few Forex brokers offer this feature, although ECN brokers do offer it often. This function shows, at a given time, the outstanding orders to buy or sell an asset and at what price. It is usually a “staircase” chart, with the quantities shown against each price above and below the current market price. Some versions also include a “market profile“, which visualizes the quantity that has already been bought or sold so far during the session.

It is important to note that since there is no central market in the Forex spot, the data presented in the Depth of Market will logically be limited to the broker offering that function. It follows that the greater the volume handled by a given broker, the more accurate the data it presents. This is why many traders who use this information largely prefer to trade on major futures exchanges, where foreign exchange futures are traded in large quantities through a centralized entity. Usually, the Forex spot is not as liquid, but more reliable volume data is concentrated there.

So the Depth of Market is useful in Forex trading? Almost all professionals in the foreign exchange market will tell you that it is an essential tool in undertaking very short-term transactions. In fact, they will also tell you that it is much more useful than a typical technical graph. The reason is that you can very easily see, looking at how many orders have been placed at each price, which is moving the financial market at the moment: the buyers or sellers, or whether a market is finely balanced or simply relatively inactive.

What is expected for retail traders is to wait for larger orders to enter and enter as close to those orders as possible, on the backs of the big players. After all, prices are driven by high volume orders that inevitably come from big players, not from small traders. The best trading strategy for small traders is to track the flow of elephants who are winning the fight in the market at any time.

Let’s talk about the fundamentals of strategy:

When you see large sales orders a few ticks above and large purchase orders a few ticks below, you have a range for trading. Of course, it’s not as simple as that, because “false” orders can be entered and removed in the blink of an eye: not all incoming orders are executed. In theory, spoofing is illegal, but you don’t read in the news about a large number of successful prosecutions!

However, in general, looking at a Depth of Market staircase chart will give you valuable information on how a market really works, and, of course, can be used in conjunction with technical analysis, being the volume of orders a kind of confirmation that a technical tipping point or breaking level is actually having the expected effect on price.

Royal Volume

Every day more foreign exchange brokers design to offer real volume indicators in their graphics software. The information is not as accurate as the Depth of Market and, as I mentioned before, the bigger the broker the better, but it can be useful and is the second-best option. If the broker divides the volume indicated into purchase and sale, you can see in each individual time period not only the amount of purchase and sale but also check if more was sold or if more were purchased. So, for example, if the price is rising to the level at which you think you’re going to spin and see that the volume of sale becomes heavier than the volume of purchase, this can give you a short entry more likely.

Tick Volume

Most Forex brokers do not yet offer the Depth of Market or Real Turnover. So there’s always some substitute for data that could be useful and widely available? The answer is truly yes to both questions, but this is an area that needs to be addressed with extreme caution. This point needs to be re-emphasized: The signal volume is definitely NOT the same as the actual size volume! It is quite true that there have been some studies that suggest that there is a positive correlation between the two, but the theory is far from proven.

There are a number of indicators available on most chart platforms, for example, the volume indicator on balance. All of them are essentially variants of the Tick Volume, so we recommend the use of a pure Tick Volume indicator. If you are using Metatrader4, it is easy to find some useful Tick Volume indicators to download that color candles on the screen depending on whether they have relatively high or lower Tick volumes. Some of them can really do a lot more than that, as I will explain at the end of the article.

The Tick Volume is only the number of price movements made by the Tick graph in the period of time covered by the sail. It is not accurate and does not necessarily reflect the actual volume, but a large Tick volume on a support or resistance level provided can in fact give you a hint on the future direction of prices.

Many indicators for the widely used and extremely popular Forex Metatrader 4 platform have been developed and are in free circulation depending on signal volume. The best of these various colored indicators on each Japanese candle on a table depending on the volume of the signal that occurred while each candle was building. It calculates an average Tick Volume per instrument per unit time and marks particular candles as significant if the Tick Volume during that candle was at least a particularly positive multiple of the average Tick Volume over time.

Some of these indicators also include a way of recognizing particularly bullish or bassist candles based on the size of the range of candles, and when a particular candle has both an unusually large range and an unusually large Tick Volume, the candle gets a special mark which shows that it is likely to be the beginning of a great reversal. Of course, the correct selection of the beginnings and ends of major reversals must be a quick route to Forex gain, although these indicators are far from infallible.

Categories
Forex Basic Strategies

Trading Forex with the Market Gaps

A price gap can offer attractive trading opportunities, both up and down. What are the gaps and how are they traded? Today we will discuss trading with market gaps.

A gap is simply a level at which the price of a share or any other financial instrument moves strongly upward or downward, leaving a visible space on the price chart that denotes the lack of continuity in quotations. These moments can be used to trade with market gaps. A price gap can be observed in all types of periods, but operators usually focus on daily price charts.

“A gap occurs when news generates a strong wave of purchases or sales at a time when the market is not trading or liquidity is low.”

Price gaps are a strong driver for quotes and can occur for a variety of reasons. In general, a gap occurs when news generates a strong wave of purchases or sales at a time when the market is not operating or liquidity is low. In this way, a large number of purchase or sale orders produce a substantial movement in quotes.

Economic indicators or the political news of the day often generate price gaps in the main market indices. In the case of individual actions, performance reports, or important announcements – for example, approval of a key drug for a biotechnology business – are factors that usually impact on quotes and can generate price gaps.

In recent years with the online trading boom and high-frequency trading algorithms, it can be seen that the flow of orders in the markets is becoming faster and faster. This can speed up price movements and generate more gaps in both directions. This is perfect for trading with market gaps.

Some trading algorithms analyze the current order flow and tend to buy when the rest of the market buys and sells when the rest of the market also sells. There are also algorithms that analyze news headlines, for example, to quickly detect if a results report was above or below forecasts. In general, these algorithms accentuate price trends and tend to favour the creation of gaps in quotes. This is why trading with market gaps is increasingly common.

“Trading with market gaps is becoming more common.”

By way of illustration, we can see in the Facebook price chart (FB) a downward price gap recorded in July last year. Subsequently, the chart also offers an upward gap in quotes at the end of January 2019. In both cases, price gaps were due to market reaction following Facebook’s profit reports.

As for the relationship between the opening price and the previous day’s price, we can differentiate four different types of gaps:

  1. An bullish full gap occurs when the opening price is higher than the maximum price of the previous day.
  2. A bullish partial gap occurs when today’s opening price is higher than yesterday’s closing price, but not higher than yesterday’s maximum price.
  3. A bearish full gap occurs when the opening price is lower than the minimum price of the previous day.
  4. A bearish partial gap occurs when today’s opening price is lower than yesterday’s closing price, although it is not lower than yesterday’s minimum quotes.

“The greater the volume of quotes with which the gap occurs, the greater its relevance for operators.”

A full gap, whether bullish or bearish, is generally more important in terms of its significance on price trend than a partial gap. In addition, the higher the volume of quotations with which the gap is produced, the greater is also its relevance for operators.

How to trade with market gaps?

When operating with a price gap, it is important to analyze this gap within the general context of the price trend in the asset in order to position ourselves in an intelligent way.

“In a continuity behavior, prices move in the same direction as the gap in the medium term, while in a reversal scenario they move in the opposite direction.”

In the short term, it can happen that the price shows continuity or reversion behavior after a gap. In a continuity behavior, prices move in the same direction as the gap in the medium term, while in a reversal scenario they move in the opposite direction. It is vital to determine whether we are in a gap of continuity or reversal when trading with market gaps.

It is said that a gap is being filled when after showing the gap the price tends to cover the space that was uncovered. Once the gap began to fill, it is likely that the price will continue in that direction until it is fully filled, as there are no levels of support or resistance that can stop price movements within the gap. This is a way to trade with market gaps.

A typical case of reversal is exhaustion gaps. These occur when the market price has incorporated the news over time, and the gap marks a final boost before the trend change.

Suppose a company is experiencing difficulties and this negatively affects the course of business. In this context, prices are falling. Subsequently, the results report a bearish gap that marks exhaustion in the selling pressure. From there the trend begins to change, as sales orders reached a limit.

On the other hand, a gap in continuity can occur for example if the market expected good news – prices were rising – and business numbers exceeded even the most optimistic expectations. In this case, the results report adds more fuel to the bullish price movement, and a gap can anticipate explosive movements in quotes.

Categories
Forex Basic Strategies

Learning To Trade The ‘Make Your Wish’ Forex Trading Strategy

Introduction

The ‘make your wish’ strategy is based on one of the most popular candlestick patterns, i.e., the Shooting Star. As we all are aware that it looks similar to an inverted hammer, we try to develop a strategy that gives us the ability to capture small bearish reversal in the market. This pattern can prove to be a very “dangerous” pattern if developed at the right location.

Once we comprehend the importance of shooting stars, we discover that one candle pattern has such a power that it can signal the reversal of a strong bullish trend. Very few people take the risk of trading reversal, as this type of trading has badly hurt the trading accounts of many.

Today’s strategy will address this issue and will show how we can catch a falling knife without cutting off our fingers. The ‘make your wish’ can help us spot the top of the market and how to trade it properly. As Shooting stars are believed to make our wishes come true, we have named this strategy as ‘Make Your Wish,’ hoping that the strategy makes our wish of winning come true.

Time Frame

This strategy can only be traded on very short-term price charts such as 5 minutes or 1 minute. Hence, this is a perfect, intraday trading strategy.

Indicators

We make use of just one technical indicator in this strategy, and that is the Chaikin Oscillator.

Currency Pairs

The most suitable currency pairs are EURUSD, USD/JPY, GBP/USD, AUD/USD, GBP/AUD, USD/CAD, GBP/JPY, and CAD/JPY. Minor and exotic pairs should completely be avoided.

Strategy Concept

The ‘make your wish’ strategy is a very simple and effective technique to use in the forex market. Since most traders are interested in day trading and scalping, there isn’t a better strategy to use for that. The strategy is based on the simple concept that when the market moves sharply in one direction, it needs to ‘pullback’ at some of the time that will lead to a decent retracement in the price to the next technical level. The ‘shooting star’ helps us identifying the time when retracement will start.

Here, we take advantage of this retracement and try to particulate in the short-term reversal of the market. As this can involve high risk, we cannot solely rely on a candlestick pattern and use a technical indicator to give us the extra confirmation. We use the ‘Chaikin Oscillator, ’ which is designed to anticipate directional changes in the market by measuring the momentum behind the movements. Anticipating change in direction is the first step to identifying a change in the trend. But this also isn’t enough for forecasting a reversal, which we shall in detail in the future course of the detail.

The risk-to-reward (RR) of the trades will not be high as we are trading against the trend of the market, which may not be suitable for high ‘RR’ seekers. But at the same time, the probability of success is high for trades executed using this strategy.

Trade Setup

In order to execute the strategy, we have considered the 5-minute chart of where we will be illustrating a ‘long’ trade. Here are the steps to execute the strategy.

Step 1: Firstly, we identify the trend of the market by plotting a trendline. If the price bounces off from the trendline, each time it comes close to it, we can say that the market is trending. Here we should make sure that the price is not violating the trendline multiple times. This also means that there are no deeper retracements in the trend, which is desired for the strategy. The trendline is plotted by connecting the ‘highs’ and ‘lows’ of the market.

The below image shows that GBP/AUD is in a strong uptrend.

Step 2: Next, we wait for the ‘Shooting star’ candlestick pattern to appear in the trend. Once the pattern shows up on the chart, we look at the Chaikin oscillator and make a note of its reading. When this ‘rejection’ pattern appears in an uptrend, it indicates a reversal of the trend if the Chaikin oscillator starts moving lower and slips below the ‘0’ level.

When this ‘rejection’ pattern appears in a downtrend, it indicates a reversal of the trend if the Chaikin oscillator starts moving upwards and moves from negative to positive territory. When both these criteria are fulfilled, reversal is imminent in the market. But we cannot enter the market as yet.

The below image shows how the pattern emerges on the chart along with a falling Chaikin oscillator.

Step 3: It is important to note that we enter the market soon after the appearance of the pattern. After the formation of the pattern, it is necessary to wait for a ‘lower high’ in case of an uptrend reversal and a ‘higher low’ in a downtrend reversal.

The below image shows the formation of  ‘lower high’ after the appearance of the ‘shooting star’ pattern, which is the final confirmation for entering the trade.

Step 4: Now, let us determine the stop-loss and take-profit levels for the strategy. Setting the stop-loss is pretty simple, where it is placed above the ‘lower high’ in a ‘long’ trade and below the ‘higher low’ in a ‘short’ trade. The take-profit is set at a price where the distance of take-profit from the point of ‘entry’ is equal to the distance of ‘stop-loss.’ That means the risk-to-reward (RR) of trades executed using this strategy is not more than 1:1. The reason for low RR is because we are trading against the trend of the market. Hence there is a possibility that the market might start moving in its major direction.

Strategy Roundup

A lot of traders warn against reversal trading, but finding top and bottom in the market and trading reversal can be done successfully if we have a proven methodology like the ‘make your wish’ strategy. We need to take into consideration all the rules outlined in this strategy guide other than just looking for the ‘shooting star’ pattern.

Categories
Forex Basic Strategies

The Amazing Combination of ‘EMA & RSI’ While Trading The Forex Market

Introduction

Previously, we discussed several trading strategies that involved a combination of different indicators, but the number did not exceed two or three. In today’s article, we present a trading system that is based on five different Exponential Moving Averages, combined with the Relative Strength Index (RSI). This strategy will make a lot of sense to traders who are at an intermediate level of trading. It is totally mechanical in nature and requires a thorough understanding of technical indicators of MT4 or MT5.

Time Frame

The strategy can almost be used on any time frame, but a larger one is preferred, 1 hour or higher. This means the strategy is not suitable for trading during the day.

Indicators

As said, we will use five different Exponential Moving Averages and one Relative Strength Index (RSI). This is the reason we need to be well versed in the technical indicators.

Currency Pairs

This strategy can be used with any currency pair. Also, with few commodities as well. Liquidity will not be an issue here since we are trading on the higher time frames.

Strategy Concept

Firstly, we use 80-period EMA to identify the major trend of the market. If the price is above 80 EMA, we say that the market is in a bull market, while if it is below the 80 EMA, the market is in a bear market. Secondly, we use the 21-period and 13-period EMA to point out the current trend direction, meaning, the current minor trend within the major trend. If the EMA with a shorter period is above the one with the longer period, we have a minor bull trend, and vice versa.

Third, we use the other two EMAs with even shorter ‘periods’ in conjunction with the Relative Strength Index (RSI) to generate entry signals. These are the 3-period EMA and 5-period EMA. The crossing of these two EMAs supported by the appropriate value of RSI, tells us whether to go long or short in the currency pair.

However, a more conservative approach would be by ignoring the entry signals, which are in the opposite direction of the major trend. Therefore a ‘long’ entry signal would be generated when the 3-period EMA penetrates the 5-period EMA from below and starts moving higher. Also, the 80-period EMA must be below the price action discussed above, and RSI must have a value exceeding 50. We execute the trade once the signal bar closes beyond the 5-period EMA.

Conversely, a ‘short’ entry will be taken when the 3-period EMA penetrates the 5-period EMA from above and continues lower. This must be coupled with an RSI value below 50, and 80-period EMA be above the price action.

Trade Setup

In order to explain the strategy, we have considered the 4-hour chart of USD/CAD, where we will be applying the rules of the strategy to execute a ‘long’ trade.

Step 1

Since this a trend-based strategy, the first step is to identify the major direction of the market using the 80-period EMA. It is important that the price remains above the EMA for at least four consecutive higher highs and higher lows before we can call it an uptrend. Likewise, the price should be below the 80-period EMA for a minimum of 4 lower lows and lower highs.

The below image shows a clear uptrend visible on USD/CAD on the 4-hour chart.

Step 2

Once we have identified the trend, we need to wait for a price retracement that could give us an opportunity to enter the market and ride the trend. We need to evaluate if this a true retracement or the start of a reversal. In this step, we should wait until the price develops a ‘range’ or the 80-period EMA becomes flat. This partially confirms that the retracement is real, and the price could be making a new ‘high’ or ‘low.’

In the example we have taken, we can see how the price starts to move in a ‘range’ along with the flattening of the EMA. Next, let us discuss the ‘entry’ part of the strategy.

Step 3

We shall enter the market for a ‘buy’ when all the smaller EMAs cross the 80-period from below. The 3-period EMA should penetrate the 5-period EMA and start moving forward to generate a reliable ‘buy’ signal. Along with this, at the entry bar, the RSI should be above the 50 levels, and both the 3 and 5 periods EMA should cross the 13-21 EMA channel. Once all of these conditions are fulfilled, we can take a risk-free entry into the market. The same rules apply while taking a ‘short’ trade but in reverse.

The below image clearly shows the ‘entry’ where all the conditions mentioned above are met.

Step 4

Once we have entered the trade, we need to determine the stop-loss and take-profit levels. For this strategy, the take-profit and stop-loss are placed in such a way that the resultant risk-to-reward of the trade is 2.5. The RR is derived mathematically, where we have taken into consideration the possibility of a new ‘high’ or ‘low’ as we are trading in a strong trending environment.

Accordingly, we have set the take-profit and stop-loss in our example, as shown below.

Strategy Roundup

Combining two or more technical indicators has always proven profitable for traders. The above-discussed strategy considers the trend of the market, momentum, strength of the retracement, and shift of ‘highs’ and ‘lows,’ which makes it an amazing strategy to be used while trading part-time or full-time. Since there are many rules and requirements for the strategy, the probability of occurrence of trade-setup is less, but once formed, it can provide amazing results.

Categories
Beginners Forex Education Forex Basic Strategies

What is the “Averaging Down” Strategy?

Averaging down or down-averaging is a term that describes the process of buying additional amounts of shares of an asset or financial instrument (such as Forex or commodities) at prices lower than the original purchase price. This reduces the average price paid by the investor for all of their purchased assets. Therefore, it is a strategy used to reduce the average cost in a market that has fallen in price. Is averaging down a good strategy or just another way to lose money in the market?

The answer depends on several factors. First, let’s describe how it works. You buy 10,000 shares at $100 per share, but these shares fall to $92 per share. You then buy another 1000 shares at $92 per share, which reduces his average price to $96 per share. It is true that this is a simplistic example, but we will describe the concept in more detail later.

Although it may seem to make sense, and actually sometimes works, it presents a great deal of risk. The price has to go up after the averaging is done. How many times have we acquired a stock that started to go down, invested more money after it went down, and continued to put more and more money in with the hope that the price will go up? Eventually, the point comes when we surrender and throw in the towel, shortly before the stock starts to recover. This is a very common scenario and it causes the ruin of many traders.

Description of Averaging Down Strategy

Although averaging downwards offers the appearance of a strategy, it is more a state of mind than a legitimate investment strategy. In theory, if an investor likes a stock at $35 per share, and the share price drops, but the investor still finds the stock attractive at 35, then buying more shares at a lower price offers the appearance of a discount. While there may be an unrecognized intrinsic value, buying additional shares simply to reduce the average investment cost is not a good reason to buy a share or other asset in the market as its price drops.

Averaging down allows investors to reduce their cost base in a given market position, which can work well if the market starts to rise as it allows the operator to acquire more assets at a lower price and increase its future profits. However, if the market continues to fall, capital losses will only increase further. Proponents of this technique see averaging down as a cost-effective approach to wealth accumulation; opponents see it as a recipe for disaster. In leveraged products like Forex and CFD, this practice can lead to large losses in a short time.

The strategy is often favoured by investors who have a long-term investment horizon and a counter-investment approach, that is to say, contrary to market consensus. An opposite approach refers to an investment style that is against, or contrary to, the prevailing investment trend. Here again, averaging can be a general rule: buy when there’s blood on the streets.

Interestingly, over the years, some of the world’s smartest investors, including Warren Buffett, have successfully used the averaging down strategy over the years. What also gives the illusion that this technique is an investment strategy. However, investors like Buffet can buy additional shares of a company because they feel that the shares are undervalued, not because they want to «lower the average». In addition, they have large capital resources that allow them to withstand a market downturn lasting months or years.

Is that a great strategy or not? If we average in a market that’s down and suddenly the price starts to rise strongly, then we’ll say what we did was a great strategy. However, if the market continues to fall, we must make the decision to keep averaging down or close positions to limit losses. At this point, much depends on the analysis of the market in which we are operating. If we are applying averaging down to fight price stubbornly in a market whose fundamentals clearly indicate that it will continue to fall, it is simply a gamble and a sure recipe to disaster.

On the contrary, if we have conducted a thorough analysis of the market and this study tells us that there is a likelihood that the price will start to rise, the downward averaging may make sense as long as we apply it sensibly following monetary management rules. In any case, we must always have a limit of losses as the market can be unpredictable and it is always good to have a safety net.

Stock Example

To show the difference between applying averaging down without a solid foundation and using this strategy based on more logical analysis and methodology. Let’s use it as an example of the difference between investing in a stock and investing in the company behind the stock.

If we are investing in an action, taking into account only the action of the price, we look for signs of purchase and sale based on a series of indicators. The goal is to earn money in the short and medium-term and there is no real interest in the underlying company beyond how its action might be affected by the market, news, or economic changes.

In most cases, much is unknown about the underlying company to determine whether a price drop it’s temporary or we’re talking about a big problem. The best thing to do when investing in shares under this approach (as opposed to investing in a company) is to reduce losses by no more than 7%. When stocks fall to this point, positions are closed and new opportunities are expected.

Invest In a Company

If you are buying stocks from a company (as opposed to a share), the investor has carefully researched and knows what is happening within the company and its industry. You need to know if a drop in stock price is temporary or a sign of trouble.

If you really believe in the company, averaging down can make sense if you want to increase your holdings in the company. Accumulating more shares at a lower price makes sense if you plan to hold them for an extended period.

This is not a strategy that should be used lightly. If there is a large volume of sales against the company, the investor may want to ask if they know something he does not know. These investors, who are making massive sales, are almost certainly mutual funds and institutional investors. Swimming upstream can sometimes be profitable, but it can also cause an account to be lost in a short time.

Averaging Down in Other Markets

Any market this strategy should be employed very carefully or avoided altogether if the trader does not know what it does, especially in leveraged markets like Forex or CFDs where profits and losses are magnified. In fact, this is how many traders lose their accounts. They continue to buy in heavily bearish markets in the hope that the price will rise to the extent that the losses that have accumulated are such that the inevitable ‘margin call’ arrives.

Many traders, especially beginners, have the tendency to «fight» against the market and when it starts to move against, do not bother to investigate because the market behaves in this way and simply start to open up positions contrary to the trend. In a market like Forex, where trends can be very strong, these traders end up losing big sums in a short time.

For example, a change in the interest rate policies of a major central bank such as the Fed or the BoE, are capable of shaking the market strongly and changing long-term trends. A trader who stubbornly trades against these moves and continues to add positions is only committing suicide.

Very different is when a trader adds more positions in a market whose fundamentals favor him and where the price is against him temporarily, more for technical factors than anything else. For example, it may happen that a currency pair is in bullish trend and the trader bought during a bearish correction that spread more than expected. In this case, the trader can average, to a certain extent, since he knows that the price has high chances of going back up. As we see, much depends on how the trader applies the strategy.

Who Should Apply Averaging Down?

The following table shows which types of investors can apply the averaging, and how to reduce the risk in case the market continues to fall. Here are some definitions of the main types of strategies.

Buy and Hold: It is a strategy where a person or company invests in an asset, such as an action, often for years. They are not interested in speculating on the purchased assets and their short-term movements, as they expect them to have an increase in long-term value that they can take advantage of.

Position Trading: A position trader is willing to invest in a market for months and even years until the signs of a major change in trend become evident.

Swing Trading: Swing trading operators try to take advantage of the trend movements of the market by trying to enter near the trend lows or trend highs, to win with the bullish and bearish price swings of the short and medium-term. The period in which operations are kept open is short, often for weeks or months.

Day Trading: A day trading operator conducts short-term trades where each position is usually closed before the end of the trading day.

Trading style, is it convenient to use averaging down?

Buy and Hold

Yeah, but be careful in a bullish market. Check your investments to make sure the fundamentals are still in good shape and that the technical aspects are attractive. Fibonacci setbacks work well in these circumstances. Measure the previous price increase from the minimum to the maximum of the movement and if you want to apply averaging down make the additional purchase around the Fibonacci retracement of 61.8% of the previous bullish movement. In a bearish market, then it’s best to wait. Otherwise, it’s like catching a falling knife. It can be a pretty dangerous process. Why risk it? Wait for markets to appear.

Position Trading

Yes, but it must hold the positions long enough for the market to recover and it must only be used in a market with the right conditions, that is to say in a bullish market. Ensure that the sector is also growing and that the fundamentals favour it so that any downturn in the market is due to short-term factors (as in the case of a stock with a bad quarter in a company with promising projections for the next quarter).

Swing Trading

Probably not. If we go in too early, expecting a change in trend and the price continues to fall, we can average down if the market and the industry are going up, but we do this only once. If we are tempted to average a second time, it is best to close the losing position and accept the loss. Remember, you are supposed to be a professional. Admit your mistake, take the loss, and continue.

Day Trading

No. As a day trading trader, the trader must leave before the end of the day and we have no guarantee that the price will be recovered at closing. A day trading operation should never be allowed to become a multi-day position. It is common for a trader to quickly lose their funds that way.

Categories
Beginners Forex Education Forex Basic Strategies

The World’s Most Dangerous FX Trading Strategies

It is vital that you have a strategy when trading, the strategy is what lets you know how you can get in and out of your trades as well as containing the risk management for your account. So it is important that you have one, however, you need to consider what sort of strategy you are planning to use, the fact is that there are good strategies and there are bad strategies. A bad strategy does not necessarily mean that it will make you lose. Some of them can actually make you a lot of money. They are often considered bad because of the risks involved or the inflexibility that they have when things go against you

So we are going to be looking at some of the strategies that a  lot of people consider bad, remember, it doesn’t mean that they do not work, it just means that there are some very obvious flaws in them that the markets will not be afraid to exploit.

The Martingale Strategy

If you have been involved in trading or gambling or pretty much anything to do with investing then you most likely would have heard of the martingale strategy.. It first became popular casinos, specifically on the roulette tables and later on Blackjack tables. The idea behind it is simple, place a $1 bet and place it on red or black, if it wins, you double your money, if it is wrong you lose. If You lost, the next bet you put a $2 bet on the same color, if it wins you are -$1 + -$2 + $4 so $1 in profit, if it loses, you double again. So a $4 bet on the same colour, this method will continue until there is a win when you win, you will always be that $1 up.

Sounds good right? In principle you will always win that $1, there is no way that you cannot, well apart from the fact that you do not have unlimited money. Let’s say that you have a balance of $1,000, how many times do you think you can put a bet on using his strategy? 10? 20? 50? In fact, your $1,000 account could only manage to put on 8 trades, just 8, if all 8 lose then you will blow that account. The only way that the Martingale strategy works if you have $an unlimited amount of money. The thing is, people know what you are doing, the casino world got around it by limiting the maximum bet that you can make, so you can only get 4 or 5 bets on before it becomes unprofitable.

So how does this work with trading? It is pretty simple and works exactly the same way, you place a 0.01 lot long trade on EURUSD, it, unfortunately, moves against you, so you decide to open up another position, this time though it is at a 0.02 lot size. This means that the markets do not need to move as high in order to make the overall positions profitable. However, if it goes south, you now have 0.03 lots adding to drawdown. So you add another position, this time 0.04 lots, the markets gain you do not need to go as high to get you out. But as it continues the wrong way, you have 0.07 lots going against you. This can continue because when the markets go on a strong trend, and if they do, it will continue to drag you down. If you keep adding positions until your margin no longer available, your account will eventually be depleted. 

If it is so risky why do so many people use it It is simple really, it is by far the easiest strategy to get into and to learn. There is very little to learn at al. Some people can literally just stick a  random trade on, regardless of the markets and the direction doesn’t matter. It is a complete gamble to them as the market will eventually turn right? It is also the easiest trading robot to create, which is why there are so many of them out there for sale. If you go to any trading robot marketplace, a large percentage of them will be using a form of this strategy, simply because it is a quick and easy strategy to use, although it is also by far one of the most dangerous.

We would advise sticking clear of this strategy unless you love to gamble and do not mind losing all the money that is already in your account.

Grid Strategies

A grid strategy is actually very similar to the Martingale strategy, the main difference is that with a grid strategy, there is not an increase in the bet or lot size that is being used, they often also have a number of different ways of getting out of trades. While the drawdown and lot sizes do not increase quite as dramatically, it does post a lot of the same risks and is still considered as a very dangerous strategy to use.

The strategy takes a very similar pan as the Martingale strategy does, as things go against you, you open up additional trades in the same direction, the main difference between this and the Martingale strategy is that the size of the trade is consistent, it does not increase with each additional trade.

There are also some differences in the way that the trades close, the grid strategy will generally do this in one of two ways. It will wait until the markets change direction and will then close the entire basket of trades once it goes into profit. The other method will close off the most recent trade when in profit and then close off the oldest trade or part of it so that the overall position that is closed is profitable. This will slowly eat away at the first trades that were made, eventually closing them out.

Much like the Martingale strategy, this has a lot of potential for the drawdown to begin to grow exponentially depending on how many positions are open, this is another reason why many more experienced traders would advise you to steer clear of this strategy.

Mass Scalping

Not the official name for it, but this is a simple strategy when you are trying to grab as many 2 to 3 pip wins as you can, sounds easy right? The problem with this strategy is that it can get out of control very quickly. It’s only 3 pips, right? Easy, most trades move to that position at some point right? Wrong, trades can continue to move against you, but you haven’t planned for this so when do you decide to get out of the trades? They could be taking away the profits of the past 20 or 30 trades. As you are putting on so many, it can be quite hard to keep track of everything and this will only lead to complete disaster and ultimately a loss of your account.

Strategies Using too Many Pairs

Not a specific strategy, but there are a lot of strategies out there that tell you to diversify and to trade a lot of different currency pairs at the same time. It is far better to have a strategy that focuses on one of two different assets. You need to remember that different currency pairs and different assets all move differently, there are different elements and factors that dictate whether they go up or down. In order to trade all of them successfully, you need to have an understanding of them all, this is just nothing that is practically possible in the real world.

Do not use strategies that trade 20 different pairs, it will be confusing and you won’t be able to keep up, let alone know why you are making those trades. Stick to strategies that specialise on one or two strategies, you can then expand into other strategies that work with other pairs instead of using one that claims to work with them all.

So those are just a few of the strategies that you really should avoid, they may well work for a short time, but the risks that they bring and put on your account only means that at some time in the future, they will blow it, so try and stick to those less risky strategies, even if they are giving you slightly lower yet more realistic returns.

Categories
Beginners Forex Education Forex Basics

Learn to Trade Forex Based On Your Strengths

When it comes to Forex and trading, there is a lot to learn. In fact, there is so much that not one person will ever know everything that there is. There is no single database that contains all of the information that one would need, especially as Forex is always changing and the amount of information expanding.

Due to this, it is important to understand that you will not be able to learn everything. In fact, you will most likely never learn more than 10% of what there is to know. What is important is that you learn what is relevant to the trading that you are wanting to do, and that you learn it in a way that is relevant to the way that you learn and that will allow you to use your strengths to assist your trading.

Some people love to learn by simply reading, they love to sit down with a big book and just read, they take in the information as they go, sometimes re-reading what they have already gone over to help cement the information into their mind. Others will sometimes learn better by doing. Actually, trading is the best way that they can learn, whatever you are more suited to is how you should be trading and learning.

So let’s imagine that you learn best by doing things, reading is boring and can’t hold your attention for long, that is fine, a lot of people feel that way. So how can we learn when there is not much information? You can simply break down the information into bite-size chunks, you then take that information and try it out on a demo account, this way you are not getting stuck in reading page after page and you are actively trying out what you have been learning, cementing that information in and more importantly, doing it in a way that suits your own learning style.

In general, there are seven main learning styles, we will briefly look at each one and what they involve, this can help give you an idea of how you prefer to learn so you can adapt the way that you are learning to trade to better suit your own style.

Visual

Visual learning is all about what you see, you learn well by looking at images and pictures, have a spatial understanding of what is going on and simply watching someone else do something can be enough for you to pick up a lot of information. This sort of style is often accompanied by an audio explanation. However, images and pictures can often be enough to learn. There are plenty of places online that help you learn trading via images and examples.

Aural

This is all about what you hear, you learn by listening, one of the reasons audiobooks came out was to help those that do not like reading get into listening to books. The same can go for learning, you do not like reading but listening to the information helps you take it in and learn, this is all about sounds and music. Listening to YouTube or podcasts can be a good way to pick up information on trading that suits this style of learning.

Verbal

Verbal doesn’t just mean what someone is saying, it can also refer to written words. This means that you are able to learn through words, either reading them or having someone say them to you. This is the most common style of learning, it takes place in school, university, and training courses. It is also the most prevalent when it comes to learning to trade, there are hundreds of resources online that can help you to learn in this manner.

Physical

This is all about actually doing things, while trading is not actually a physical thing to do with your hands, you are actively taking part and having to do things in order to trade. A demo account is a perfect way to learn this way. If you have read or heard some information, try it out on a demo account, this will help you to see how it works and what was told in real-time and in a real-life scenario, doing is often a great way of learning, so demo demo demo.

Logical

Logical learning is all about using logic and finding the reason behind the things that you are doing, in regards to trading, it is working out why certain things move the markets or why you should be placing certain trades. This looks into each subject in a lot more detail, but it allows you to get a much more in-depth understanding of each subject matter. There are sites available that go into the real nitty-gritty details of trading and those are the sites that you would want to look out for.

Social

Some people love to learn in groups, be it one other person or a group of 10. These people thrive on relaying information between them and by discussing what is being learned. There are sites south here for learning in groups, forums are also available and offer great places to talk and learn with others. Team members often push each other to achieve and learn more.

Solidarity

The opposite of learning in a  group, learning by yourself can also be someone’s choice of learning style. You do not want the distractions that come from others, you want to be able to concentrate on what you are doing and are easily able to self-motivate yourself to get the learning and work down. Too many people mean too many distractions, this allows you to learn at your own pace. So those are some of the learning styles, there is one key part of learning that we have not mentioned yet, that is simply the learning that you can get from mistakes and losses.

When we are trading, there will be mistakes being made as well as losses being accrued. It is important that we use these opportunities as a new way to learn. If you think back to school, some of the knowledge that you have would be simply from making a mistake, as soon as that mistake was made, you learned what made it right and have most likely never forgotten it since. It is exactly the same as trading.

Every single time that you make a mistake or make a loss, take a look at why that loss occurred, what was the curse, you can then use what you have learned to better understand what happened and to help prevent it from happening again in the future. Doing this enables you to become a much better trader, prone to making far fewer mistakes. It can also give you an insight into subjects and topics that you would have never looked into otherwise.

So those are a few of the learning styles as well as the importance of learning to trade in a way that suits you. There is no point trying to follow the footsteps of someone that learns or tutors in a way that does not suit your own style, use your strengths to learn, you will then be able to learn a lot more and a lot quicker.