
Introduction
In the previous article, we saw how moving averages could be used to find potential trade setups that are essentially based on trend reversal. The next fascinating use of the moving average is that they act as crucial Support and Resistance levels. We know the importance of Support and Resistance levels in technical analysis, and we learned how many indicators can be paired with these levels to generate potential trades.
But in the case of moving averages, this indicator itself acts as a potential support and resistance areas. We need to remember that these levels keep changing as and when the market changes its direction. That is why these levels are known as dynamic support and resistance levels. In this article, let’s understand this concept clearly.
In the below chart, we can see that the market repeatedly takes support at 50-Period EMA and then continues its uptrend.
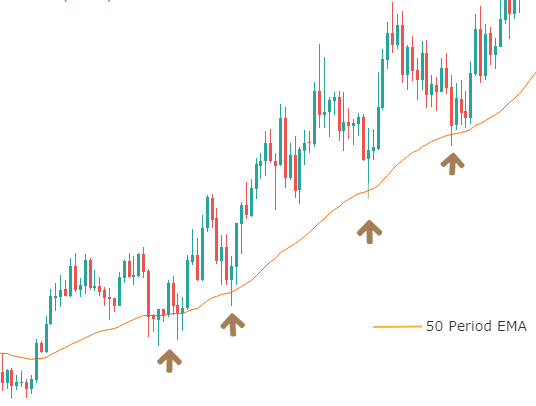
From the above chart, we can also notice that the price at times is going below the EMA before bouncing off. Also, some times, the price is not precisely touching the EMA. In some cases, it is also possible that the market can just crash downwards without respecting our EMA line.
To overcome this problem, we should plot more than one EMA on the chart and then buy or sell once the price is in the middle of the two moving averages. We can also refer to this as the ‘trading zone.’ Let us see how the above chart will look after plotting another EMA on it.
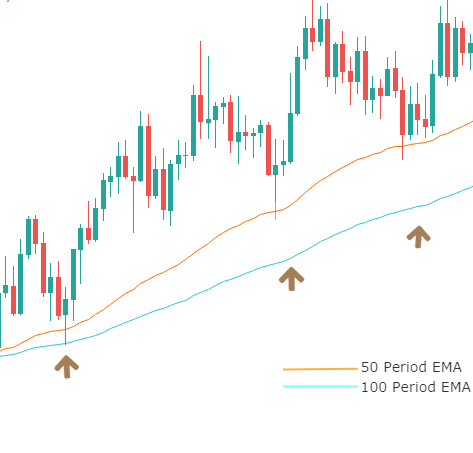
After plotting 100-period EMA on the chart, we can see the price entering the areas between two MAs before going up and does not even touch the second MA. This means moving averages should never be used as single line support and resistance levels; rather, it is a ‘zone’ from where the market has a high chance of reacting.
When we use the concept of ‘zones,’ we get a clear idea of where to put the ‘stop-loss’ and ‘target.’ For example, the ‘stop-loss’ can be placed below the second MA, and ‘target’ could be the new higher high. When we have such a wide area for our ‘stop-loss,’ there is less chance of us getting stopped out before the trade performs in our favor.
Role Reversal of moving averages as Support and Resistance
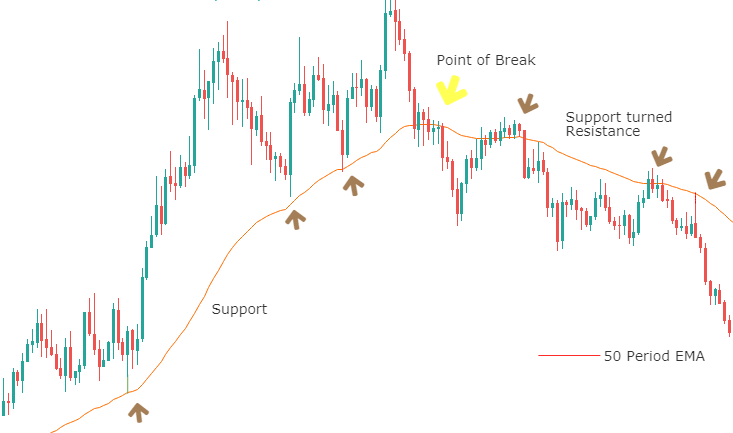
Now that we know how moving averages act as support and resistance levels, we need to check if follows all the rules of S&R. One of the most significant rules of S&R is support turning Resistance and vice versa. We shall see if MAs follow that.
Below is a chart that shows how the moving average turns into Resistance after it was previously behaving as support. The yellow-colored arrow marks the point where the price broke through and crashed. Later, it started acting as a dynamic resistance level.
Conclusion
Using moving averages as support and resistance levels can be highly profitable when done with proper trade management. Intraday traders mostly use this technique as they fear of getting stopped out due to spikes. The best part of this application of the moving average is that they’re dynamic, which means we just need to plot them and leave it on the chart. We don’t have to keep looking back to spot support and resistance levels. In the next article, we will summarize all that we have learned about the moving averages. Cheers. [wp_quiz id=”65911″]