Introduction
In the previous course lesson, we understood the first type of Moving Average, which is SMA. We also saw how spikes could distort the SMA. The solution to this distortion is the Exponential Moving Average (EMA); so, let’s discuss this type of MA in our lesson today.
The EMA gives more weightage to the recent change in prices and does not give much importance to previous data. Learning how to calculate and plot EMA on the chart will provide us with a clear understanding of which Moving Average should be used at different times of the market.
We shall take an example to explain the definition of EMA. This example will also show how the EMA overcomes a significant limitation of the SMA. In the below figure, we have plotted a 10-period SMA on the daily chart of a currency pair. Here we have chosen the USD/CHF currency pair as an example.
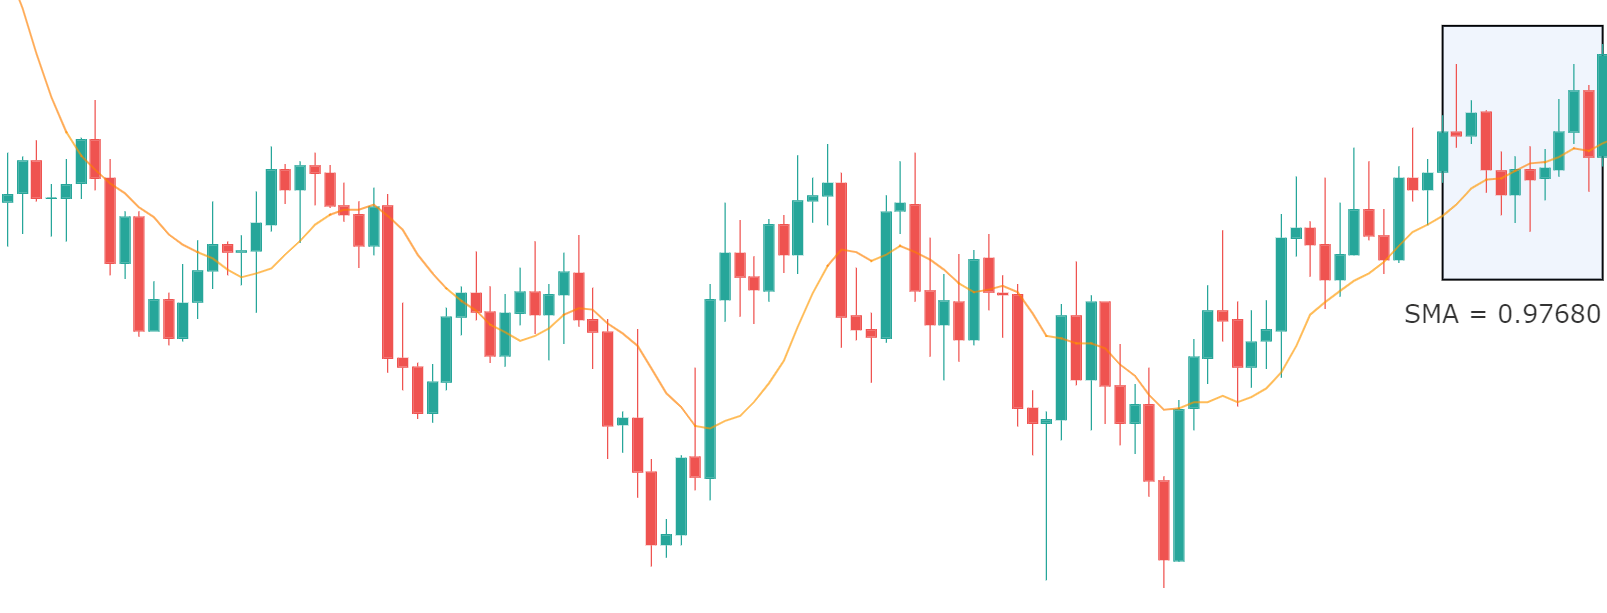
Since we are calculating the 10 ‘period’ SMA, we need first to note down the closing prices of the last ten periods days. The prices are as follows:
0.97806,0.97986,0.97528,0.97336,0.97536,0.97461,0.97536,0.97829,0.98156,0.97636.
The next step is to add the above-given numbers together and then divide the result by 10. This equals to 9.76804 / 10 = 0.97680. Therefore, the SMA for the last 10 days is 0.97680. The end of the orange SMA line in the above chart points exactly to the price 0.97860.
Now let us consider a case where, on the sixth day, dollar drops drastically due to a news event that was bad for the US economy. If the sixth candle drops to a price around 0.97000 (closing of all other remaining the same) due to the news release, the new SMA will now be calculated as follows:
(0.97806 + 0.97986 + 0.97528 + 0.97336 + 0.97536 + 0.97000 + 0.97536 + 0.97829 +
0.98156 + 0.97636) / 10 = 0.97654
The resultant SMA is lower than the SMA we had obtained in the previous step. This means when the price dropped on Day 6, it created a notion that the trend is going to reverse, but in reality, it was just a one-time event that was caused by news. We need a mechanism that will filter out these spikes so that we don’t get the wrong idea. This is where EMA comes to our help.
Taking the above example, EMA gives more stress on the recent price movements, such as the closing prices of the last four candles. This means the spike that happened on the sixth day will be of less value and wouldn’t have much effect on the moving average. It is always a smart and better idea to focus on what traders are doing recently rather than what happened long ago. Always remember that the past data is of less significance to us.
The below chart shows the difference between the two moving averages when they are plotted simultaneously.
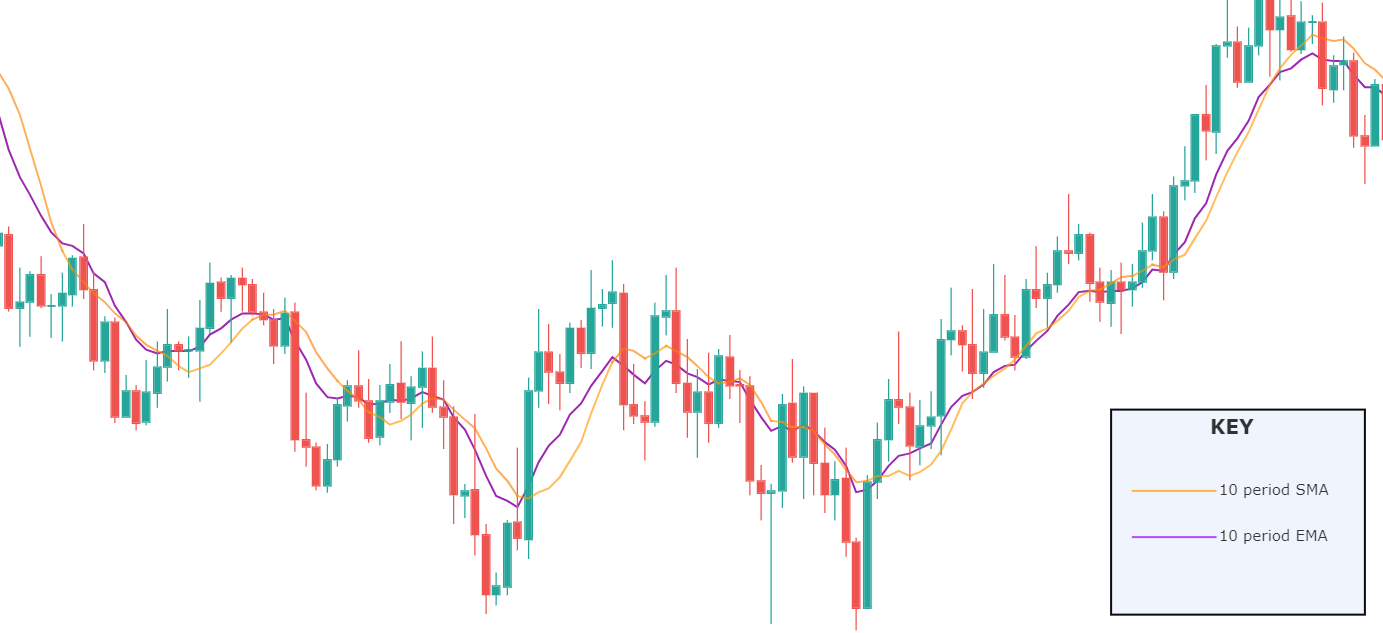
Notice that the purple line (10-period EMA) appears to be closer to the candles than the orange line (10-period SMA). This means the EMA is more accurate in representing the recent price action, and now we know why. So, the bottom line is to pay attention to the last few candles rather than candles of last week or last month.
Conclusion
That’s about the two types moving averages with their own advantages. The EMA is a better option to use when you are swing trading as it gives precise analysis than SMA due to the reasons mentioned above. EMA, too cannot be used standalone and should be paired with a trading strategy. In the next article, we will discuss the pros and cons of using SMA and EMA. [wp_quiz id=”65573″]