Categories
Forex Basic Strategies

Combining Moving Averages with Parabolic SAR To Generate Accurate Trading Signals

Introduction

Trend trading is a great way to earn money from the forex market. Any retail trading strategy based on a trend continuation pattern works well when it moves within a trend.  Therefore, in this trading strategy, we will take trades from minor corrections using the parabolic SAR towards the trend.

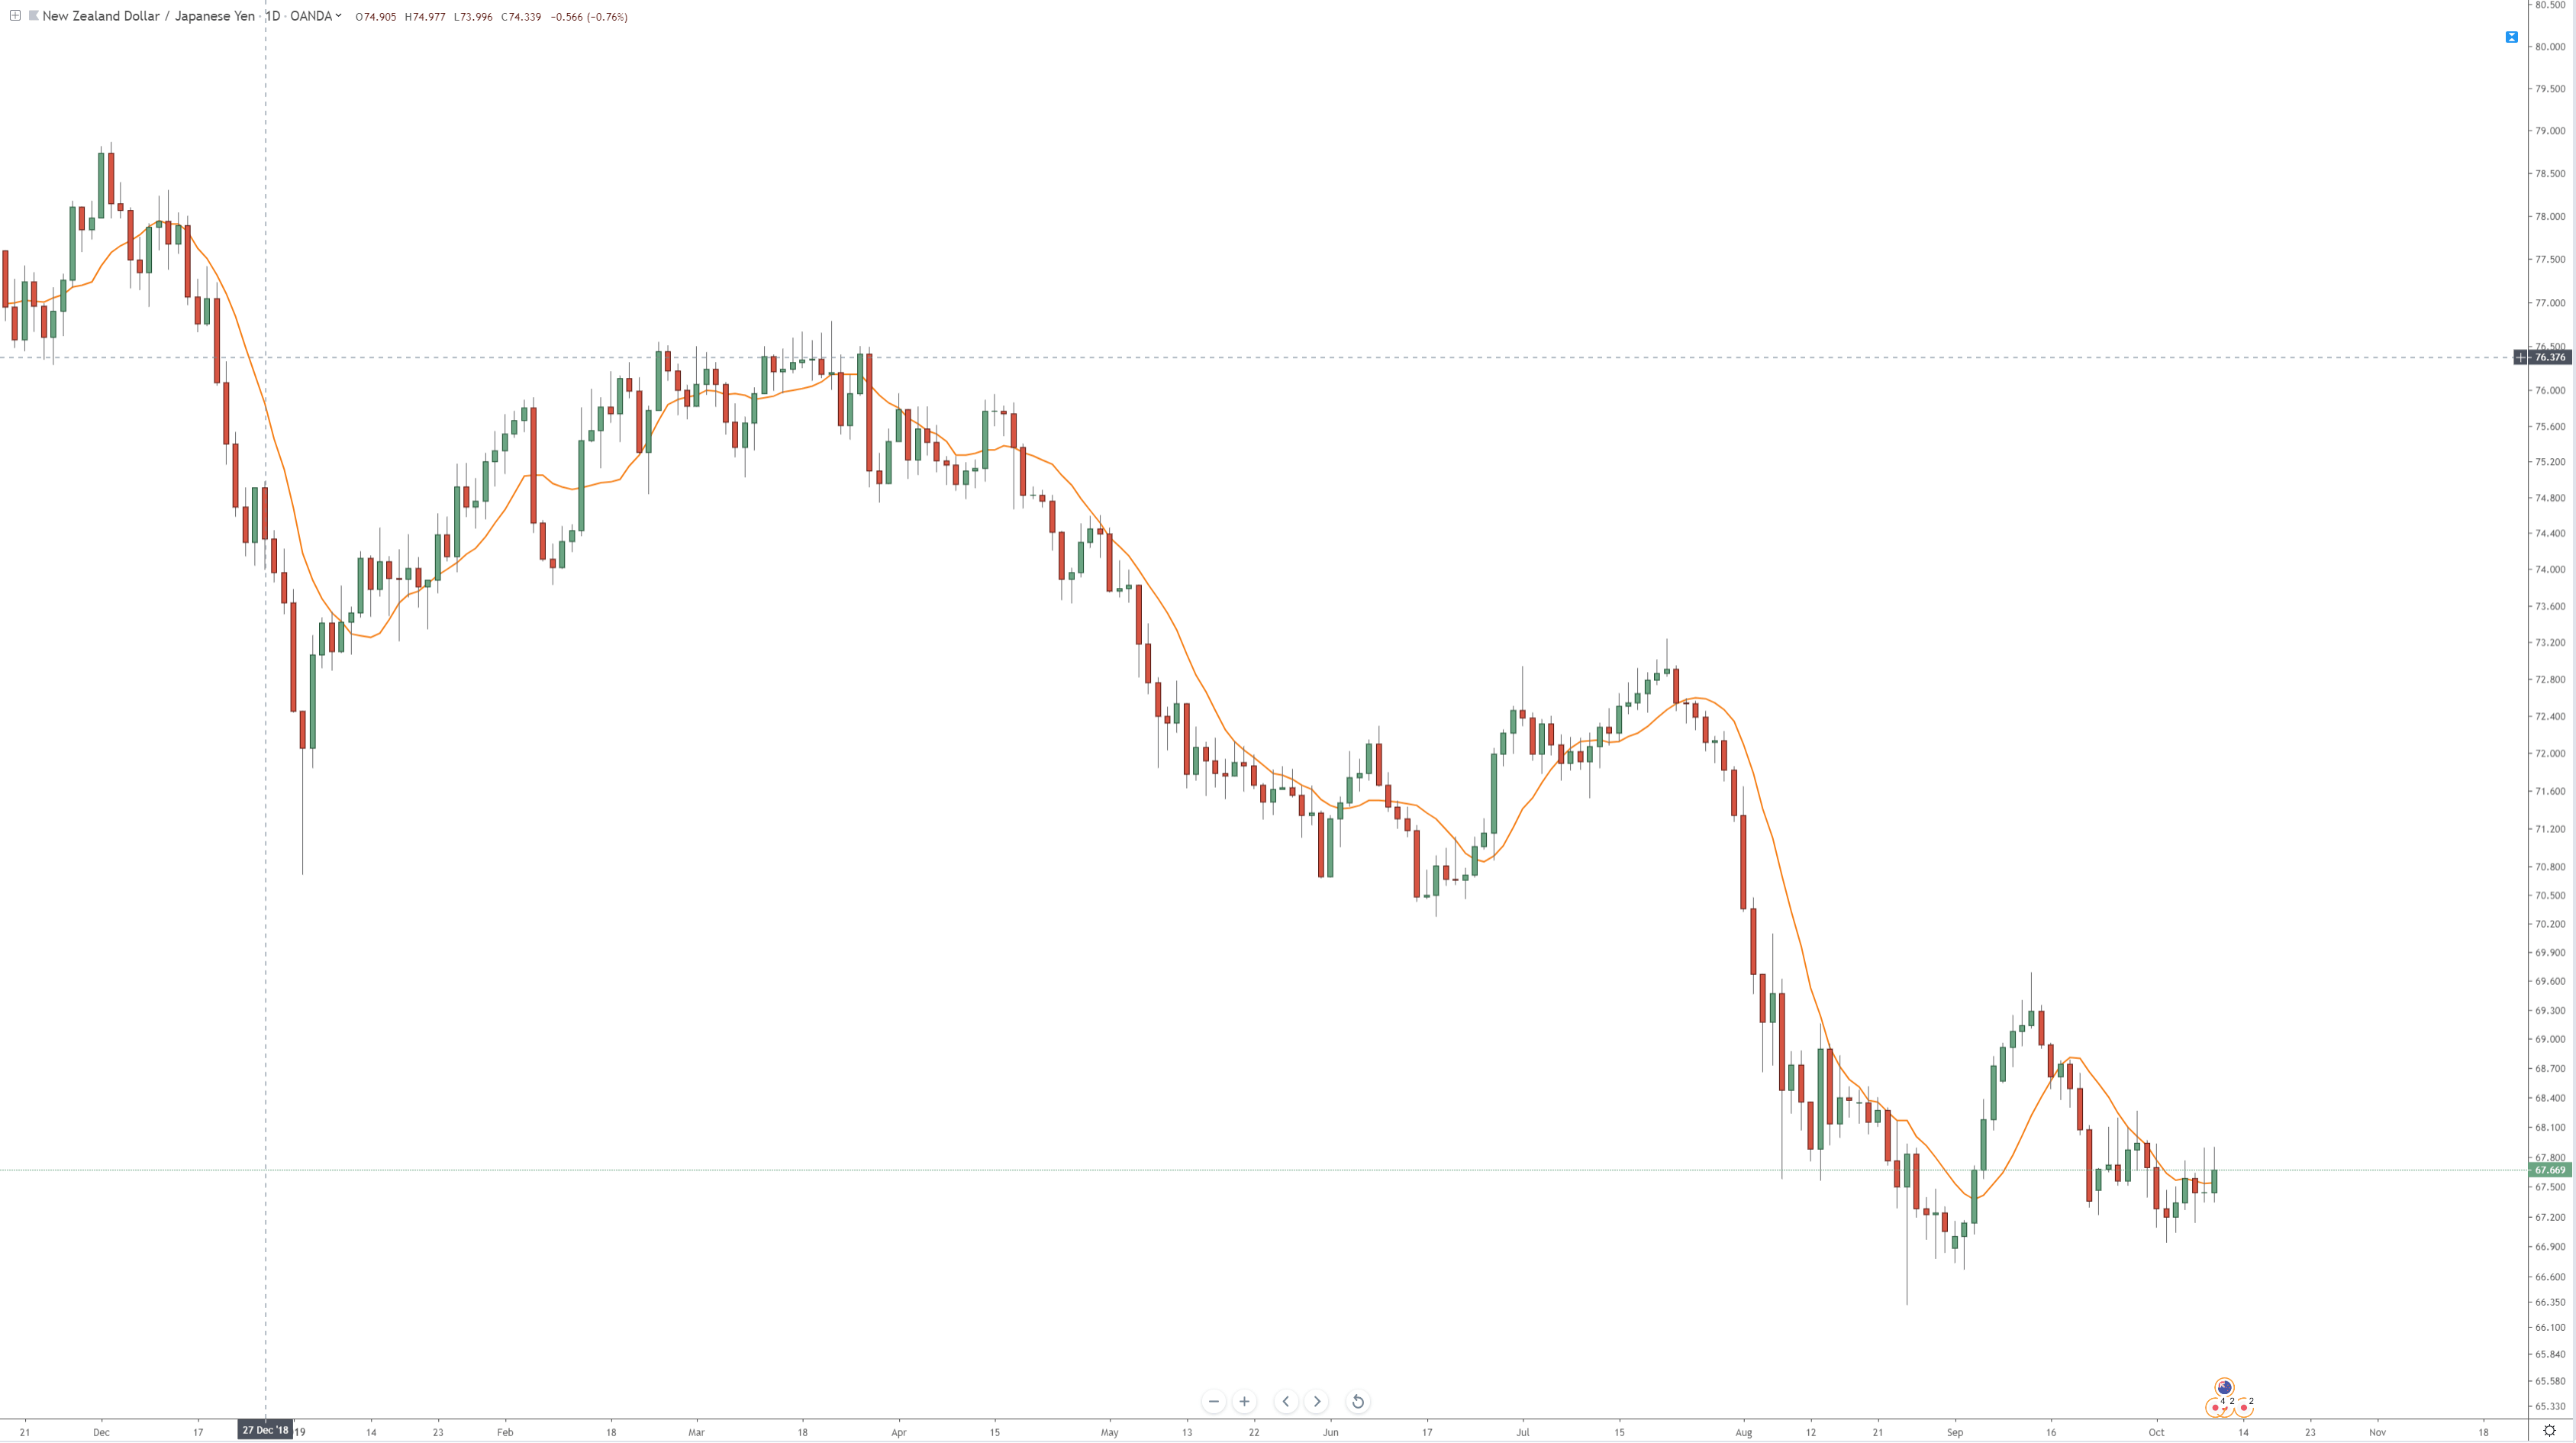
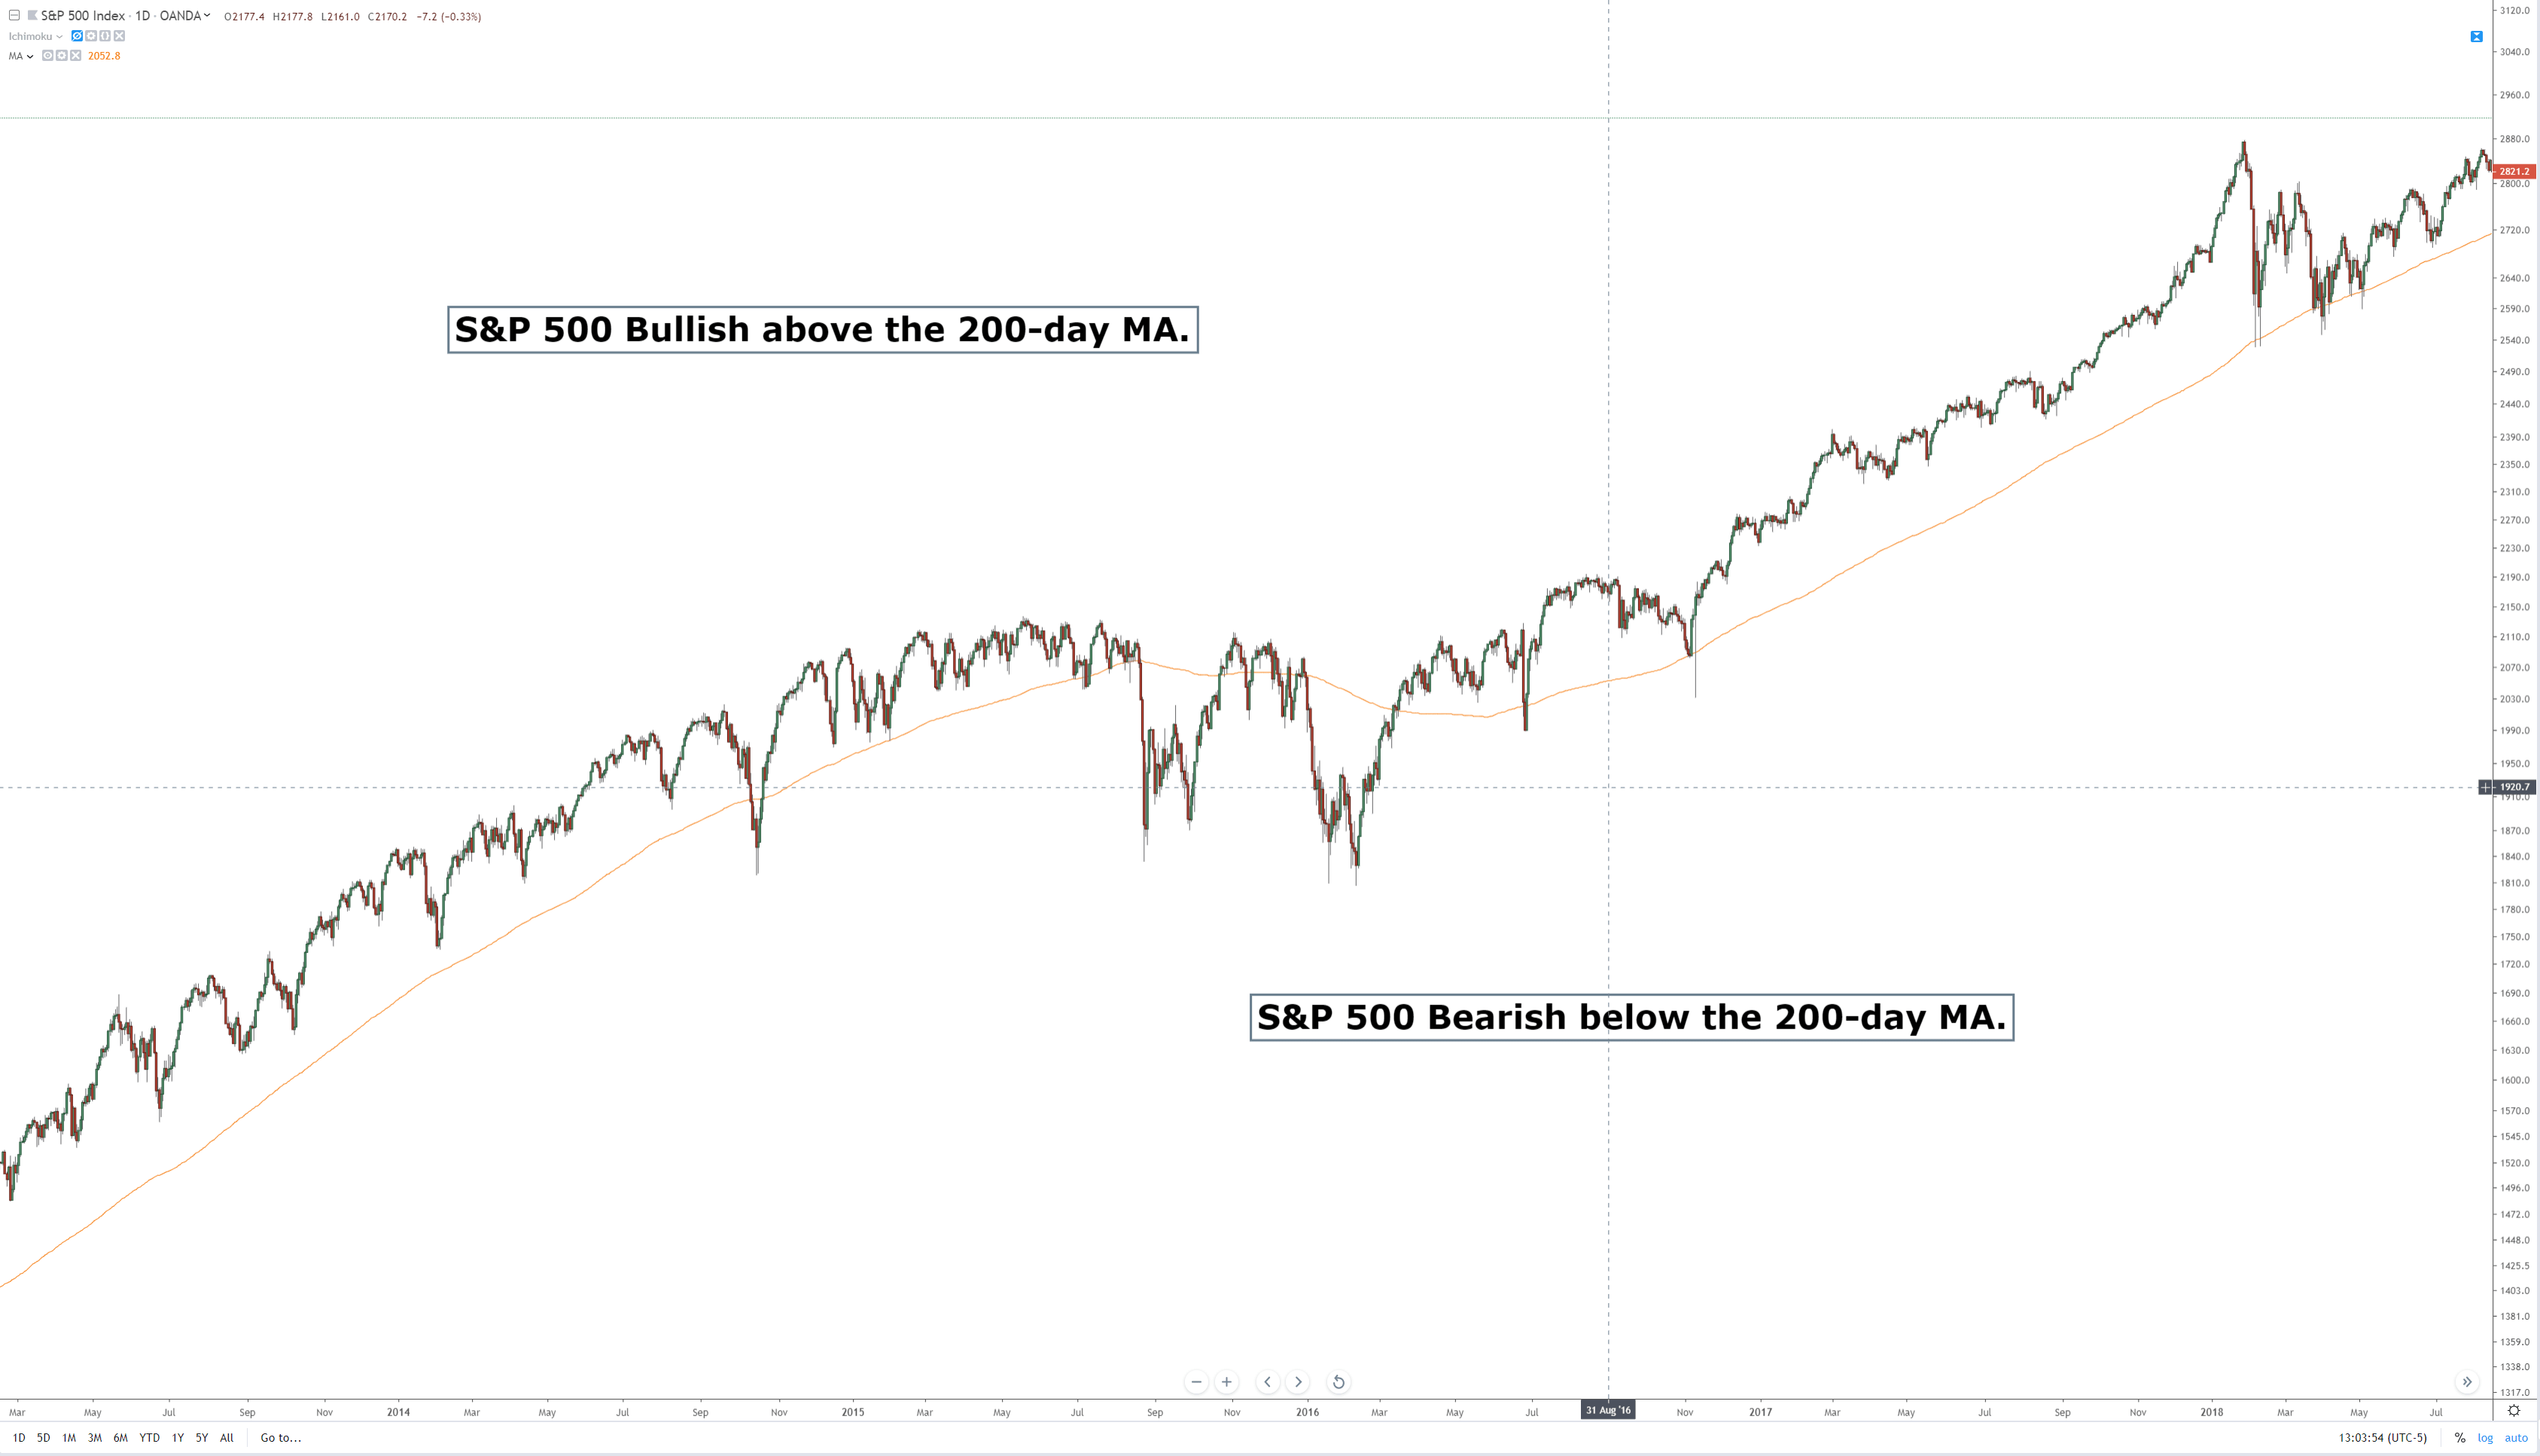
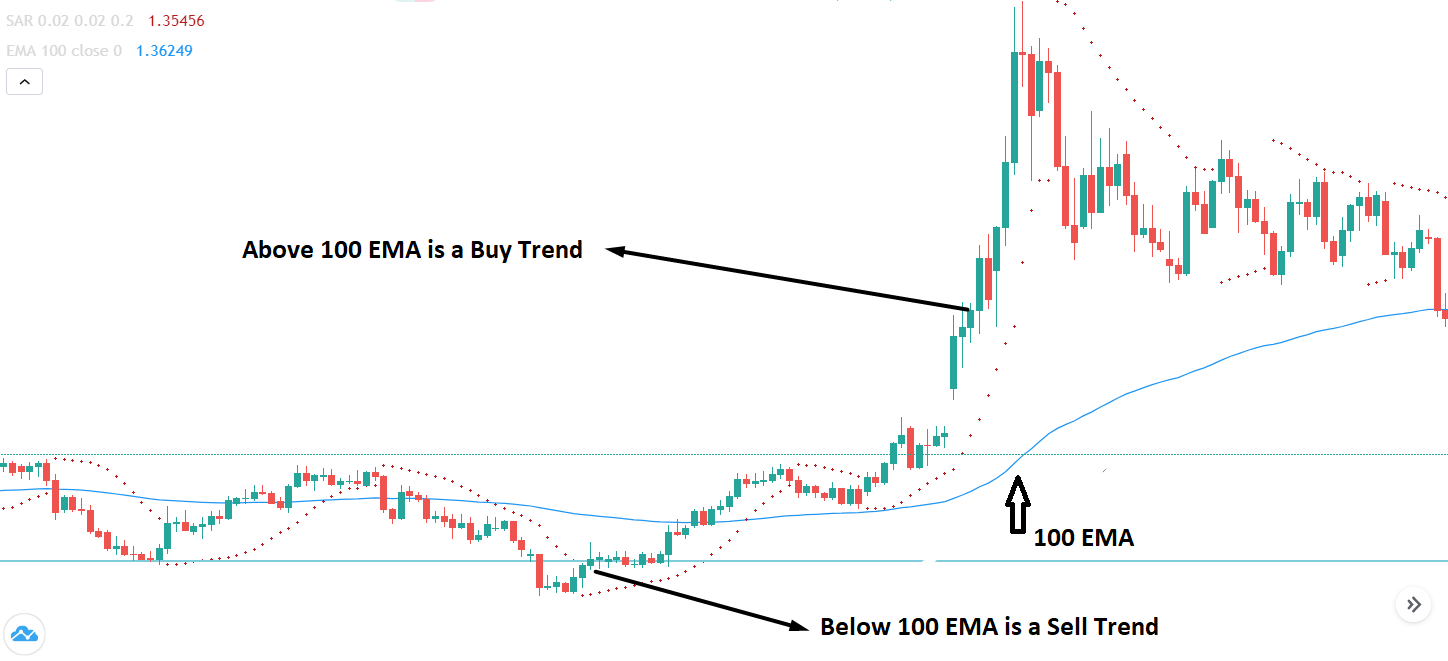
Furthermore, we will use a 100-period exponential moving average to determine the trend. If the price is trading above the 100 exponential moving average, we will consider the trend as an uptrend. If the price is trading below the 100-period exponential moving average, it will consider it a downtrend. We will follow a simple logic by considering buying trades when the market moves up and considering sell trades when the market is moving to drown.

However, there are no specific rules about the period of your moving average. Some traders are comfortable with 100 EMA, while some traders are compatible with 20 EMA or SMA. Therefore, if you’re trading in a lower timeframe, you can use any moving average from 20 to 100 periods. However, we will focus on 100 EMA as it provides good profitability based on swing trading ideas.

Why Should We Use Parabolic SAR?

Parabolic SAR is a forex trading indicator that stands for “stand and reverses.” This trading indicator was devised by J Welles, represented by some dots below and above the candlestick. In an uptrend, dots remain below the price and indicates a bullish pressure once the price is rejected from these dots. Similarly, in a downtrend, the dots form above the price, and the price starts to move once it gets rejected from the parabolic SAR.

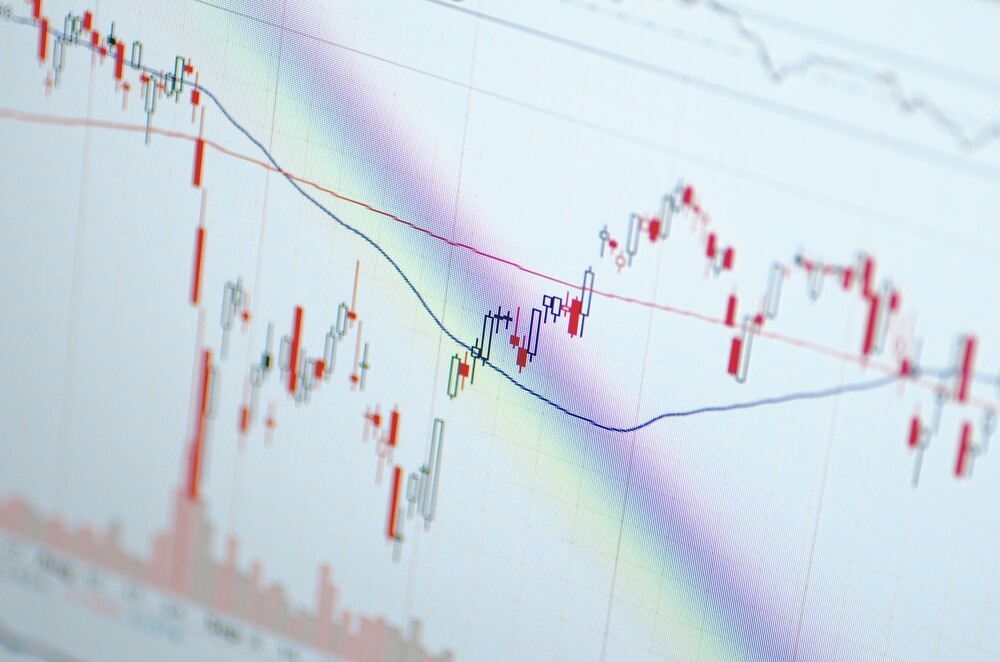
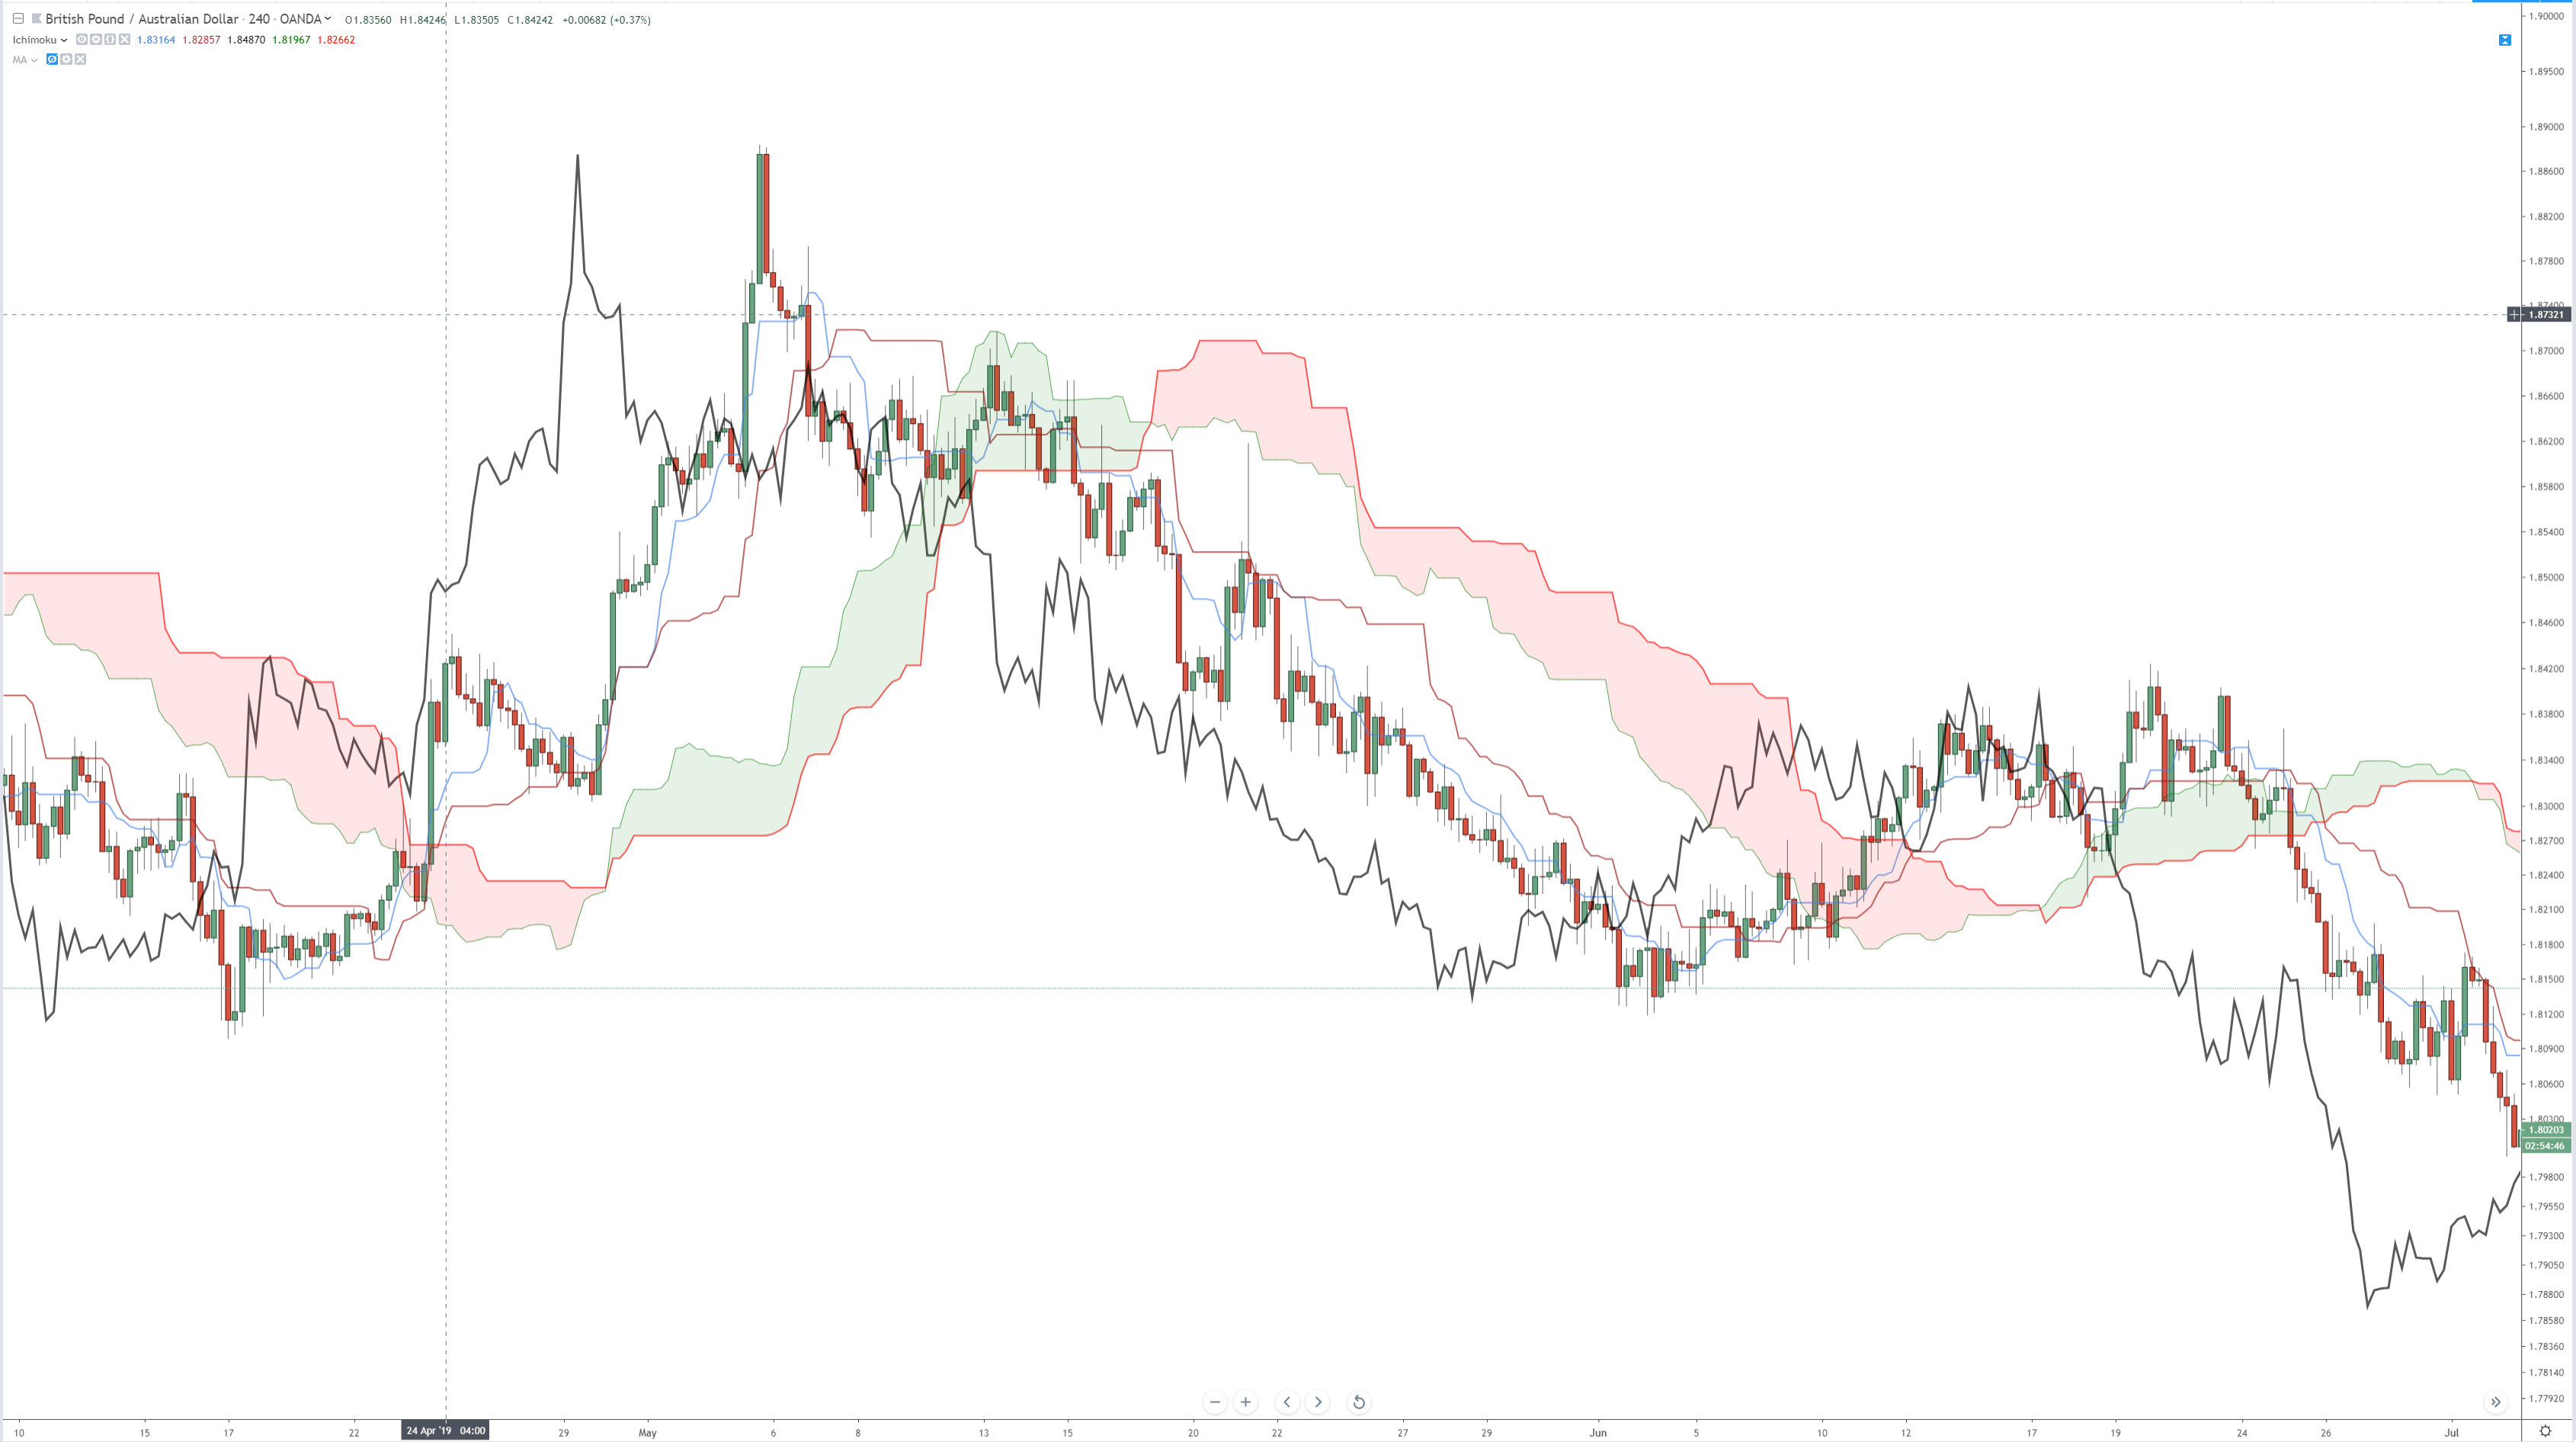
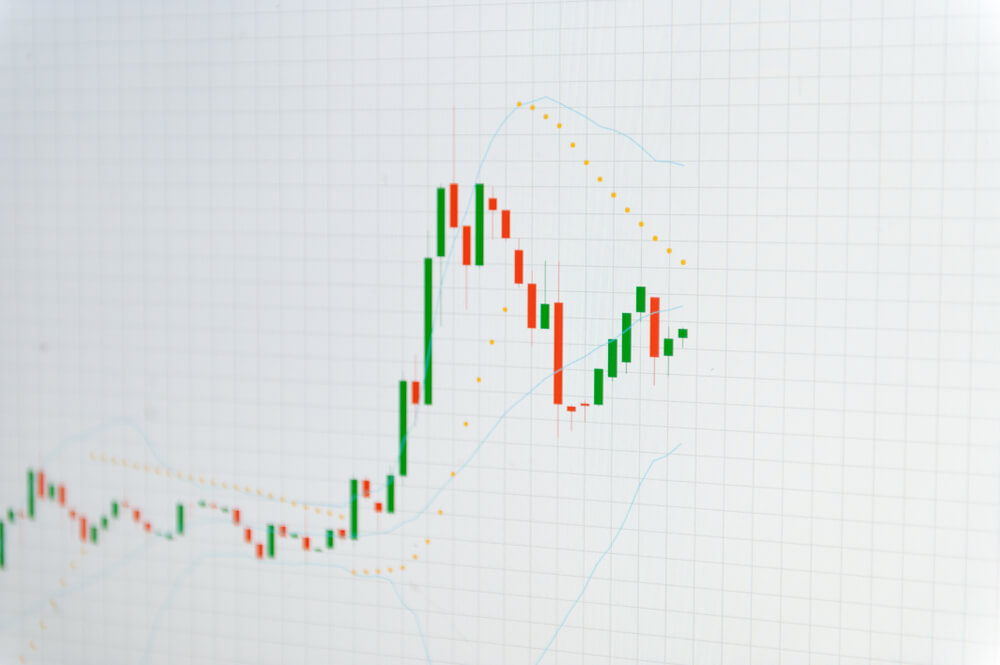
In the image below, we can see a clear chart of the candlestick pattern.

Let’s plot the parabolic SAR in the price chart and see how it looks like.

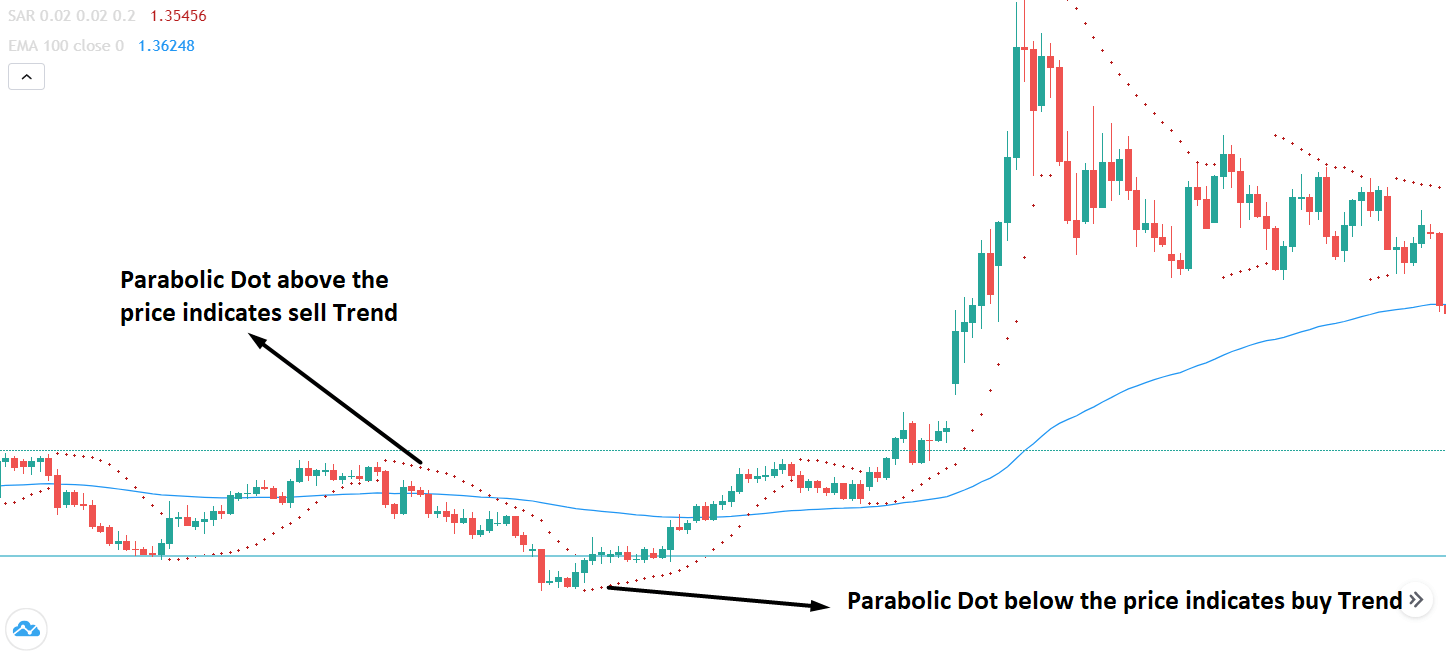
It is visible that in an uptrend, Parabolic SAR is below the price, and in a downtrend, the parabolic SAR is above the price. This is why the parabolic SAR is considered as a stop and reverse indicator.

Furthermore, the parabolic SAR has a built-in stop-loss function. Once the price moves up or down with a new candle, the parabolic SAR changes with the price. Therefore, you can move your stop loss once the price creates a new higher or lower low. Furthermore, you can edit the primary parameter of Parabolic SAR from the indicator’s setting, but in this trading strategy, we will use the default format.

Moving Average with Parabolic SAR

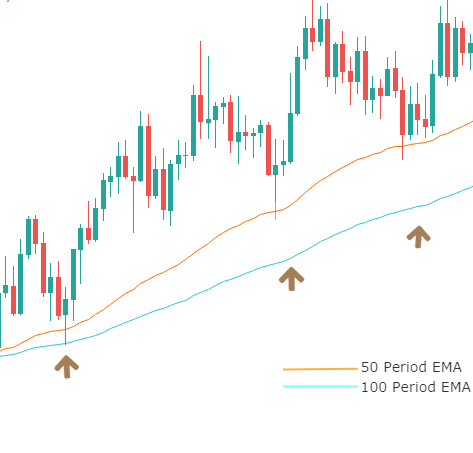
If we use a 100-period exponential moving average, we can catch the major trend direction from the minor correction. The forex market Moves Like a zigzag. Therefore, there is a minor correction in a major bullish trend and minor bullish correction in a major downtrend. If we know the major trend, we can quickly enter the trade from a correction to get the maximum reward from the minimum risk.

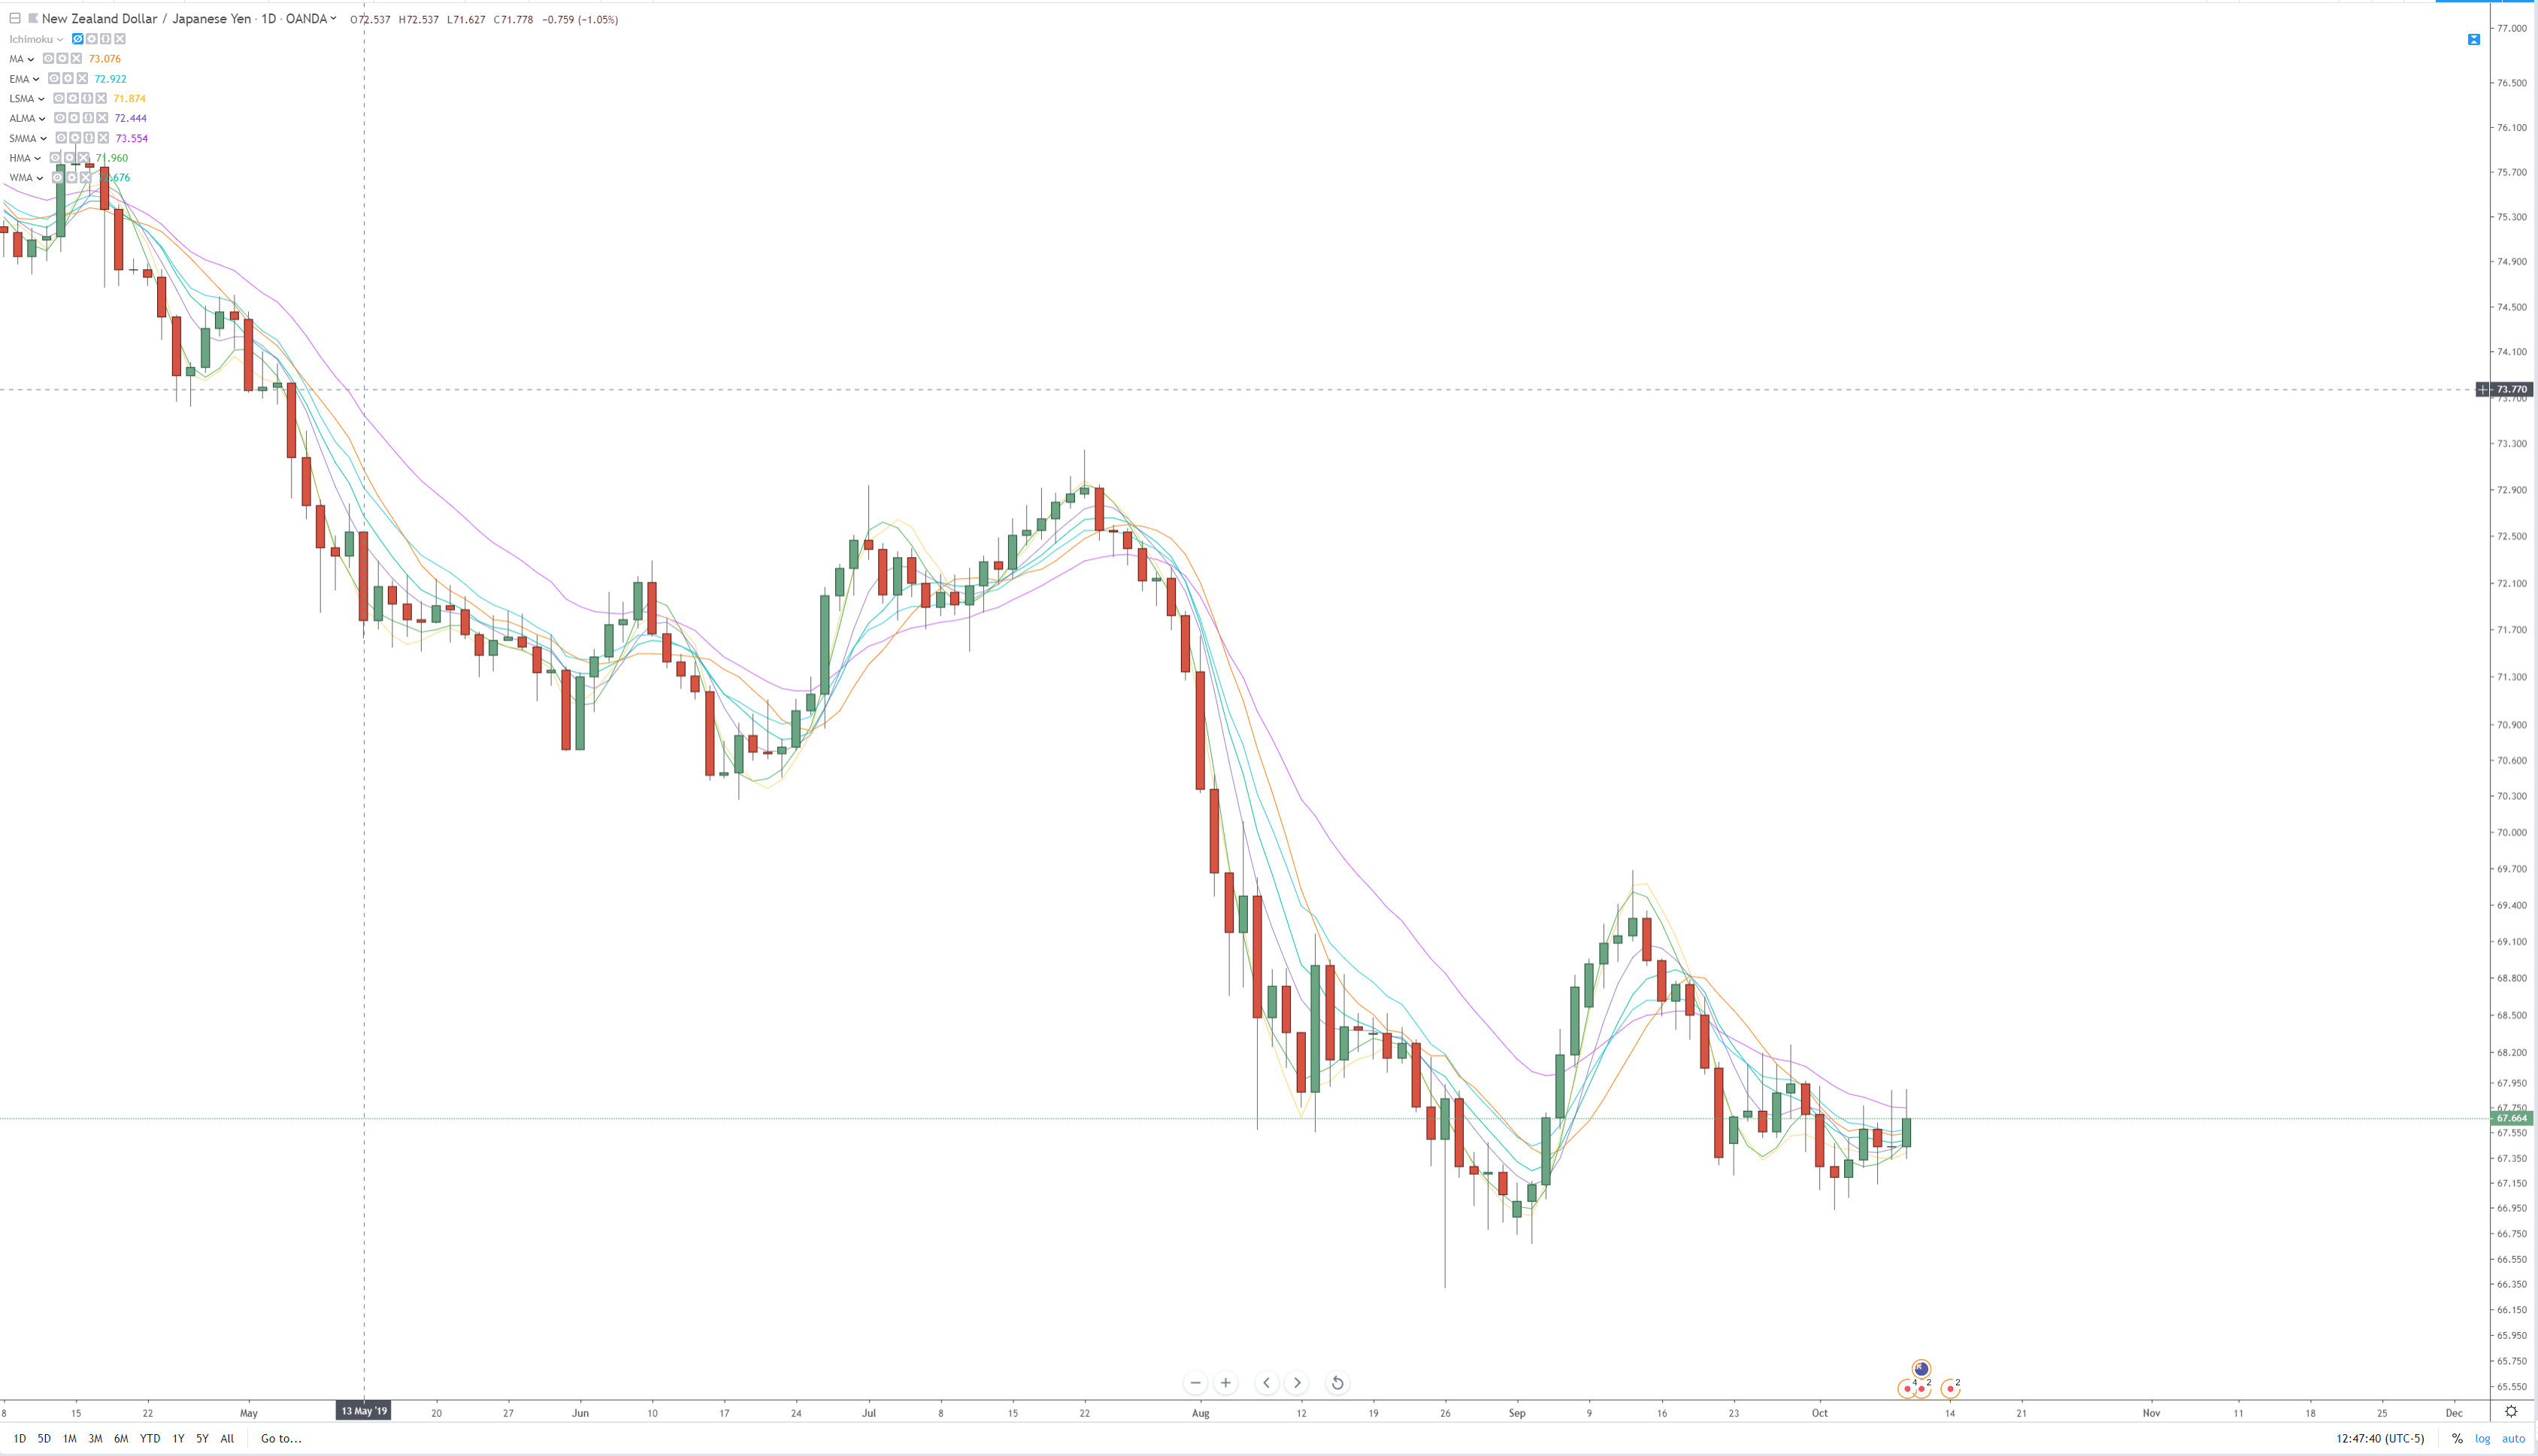
In the forex market, parabolic SAR usually provides trading signals earlier than expected, which might create a negative impact on your trading result. Overall, any trend following indicator does not provide a good result when the price moves within a range. In most of the cases, markets follow the trend of about 35% of the time. Therefore, it is essential to filter out the conditions where the market is moving within a range.

We can eliminate the unexpected market behavior by using the 100 moving average as it will provide a more significant trend that will prevent over-trading. In the image below, we can see how the parabolic SAR provides false trading signals when the market moves within a range.

In the ranging market, it would be difficult to make a profit using this trading strategy. Therefore, it is better to use the 100 moving average to get the overall direction of the trend.

Moving Average With Parabolic SAR Trading Rules

Every trading strategy has its unique rules. In the moving average with the Parabolic SAR trading strategy, our main aim is to follow the trend towards the direction of 100 EMA.

Overall, we will follow simple rules as Complex trading rules make it challenging to implement it on the chart. You can make good profits with a simple trading strategy if you can utilize it well with appropriate trade management and money management rules.

Timeframe

The moving average with the Parabolic SAR trading strategy works well in all timeframes from 5 minutes to weekly charts. The longer timeframe will provide better trading results. However, it is better to stick to the 1 hour to daily chart as it can cover fresh moves driven by banks and financial institutes.

Currency Pair

There is no obligation to use a currency pair. However, it is better to use a currency pair that does not remain within a range for a long time like EURCHF. Therefore, all major and minor pairs are good to go with this trading strategy.

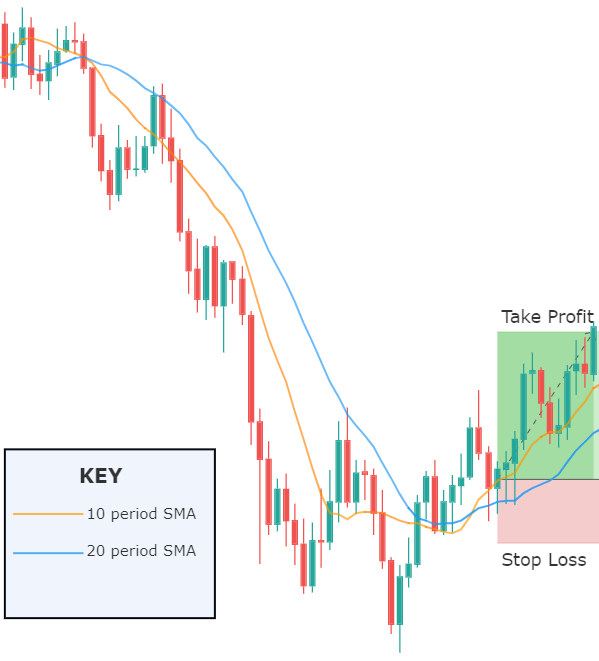
Buy Entry (Inverse for Sell Entry)

  • Identify the price above the 100 periods moving average. If the price is choppy at the 100 EMA, Ignore the price chart, and move to another market.
  • Identify the parabolic SAR to point dots below the candlestick, which will be a buy signal (above the candlestick is a sell signal).
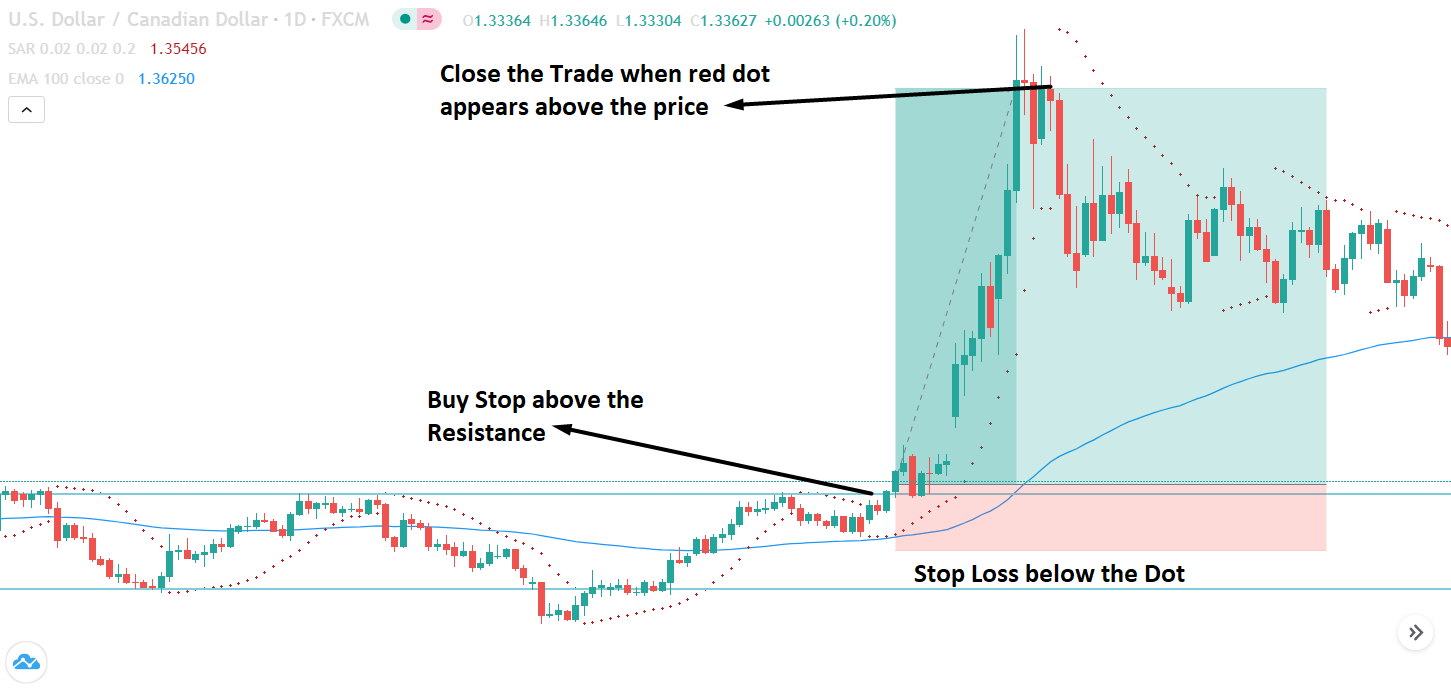
  • Later on, place a buy stop order above the candlestick high.
  • Put your stop loss below the printed dot with some buffer.

Example of Parabolic SAR Strategy

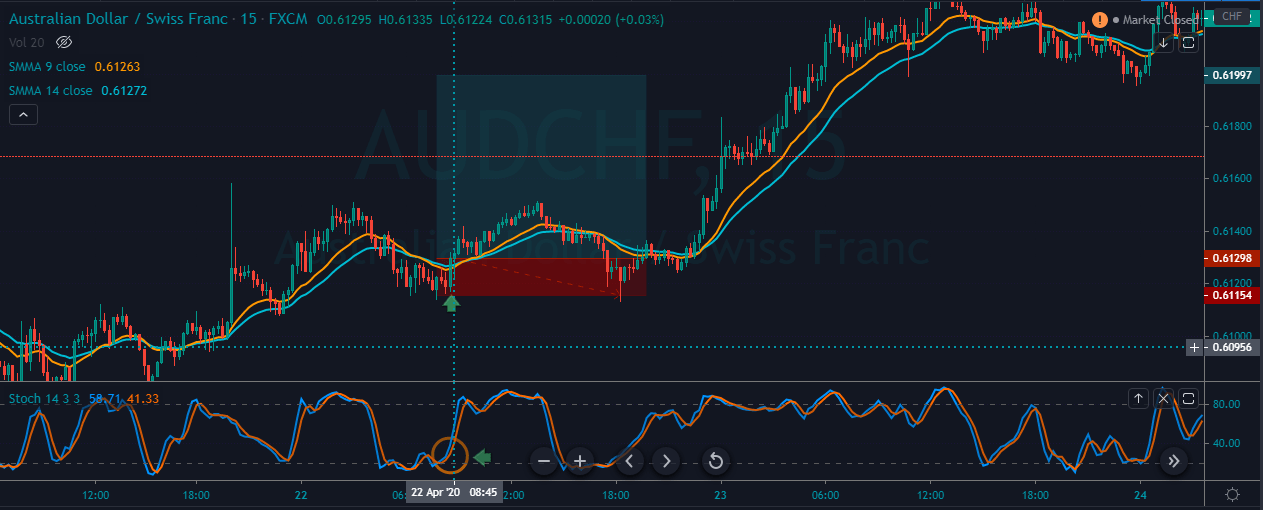
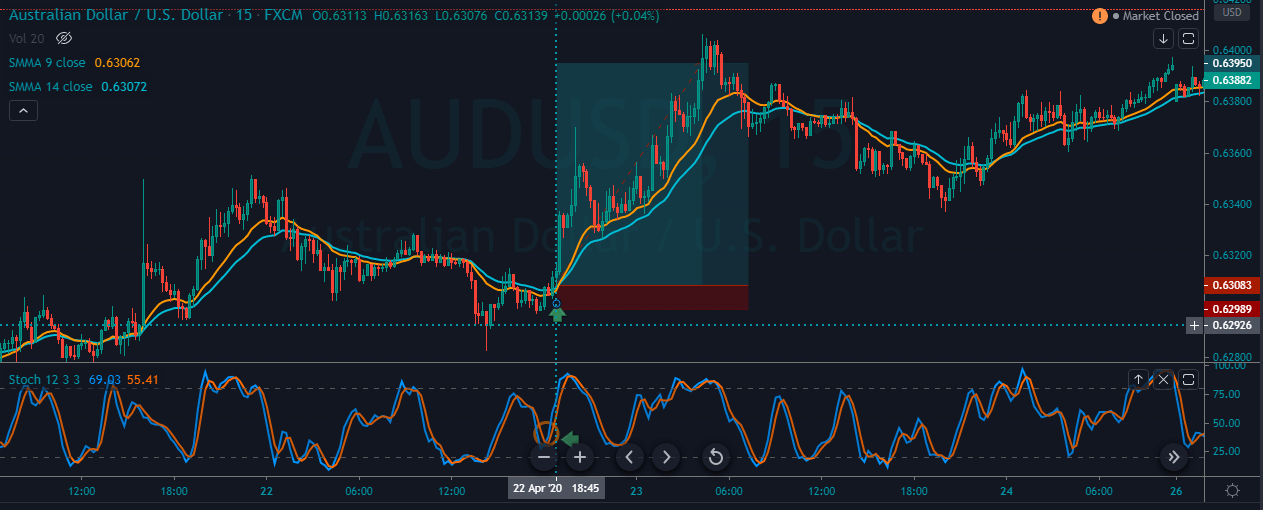
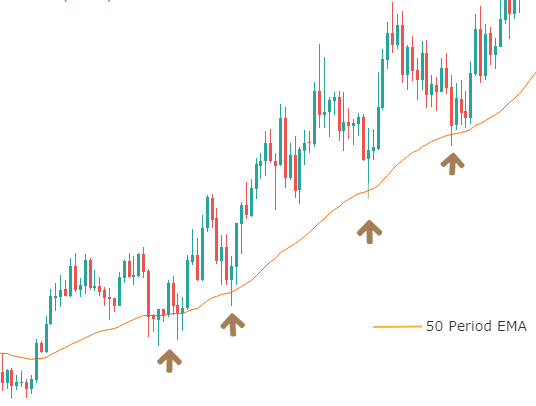
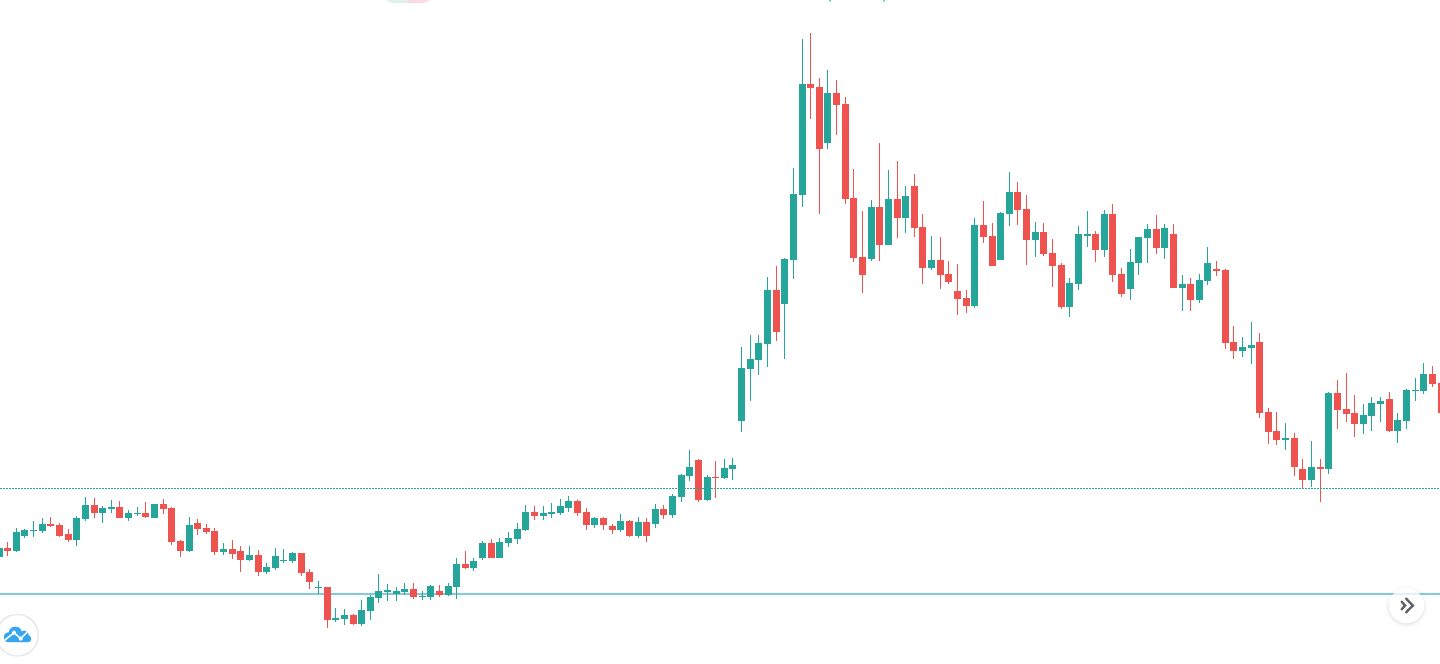
At the image below and see how parabolic SAR provided a buy trade setup.

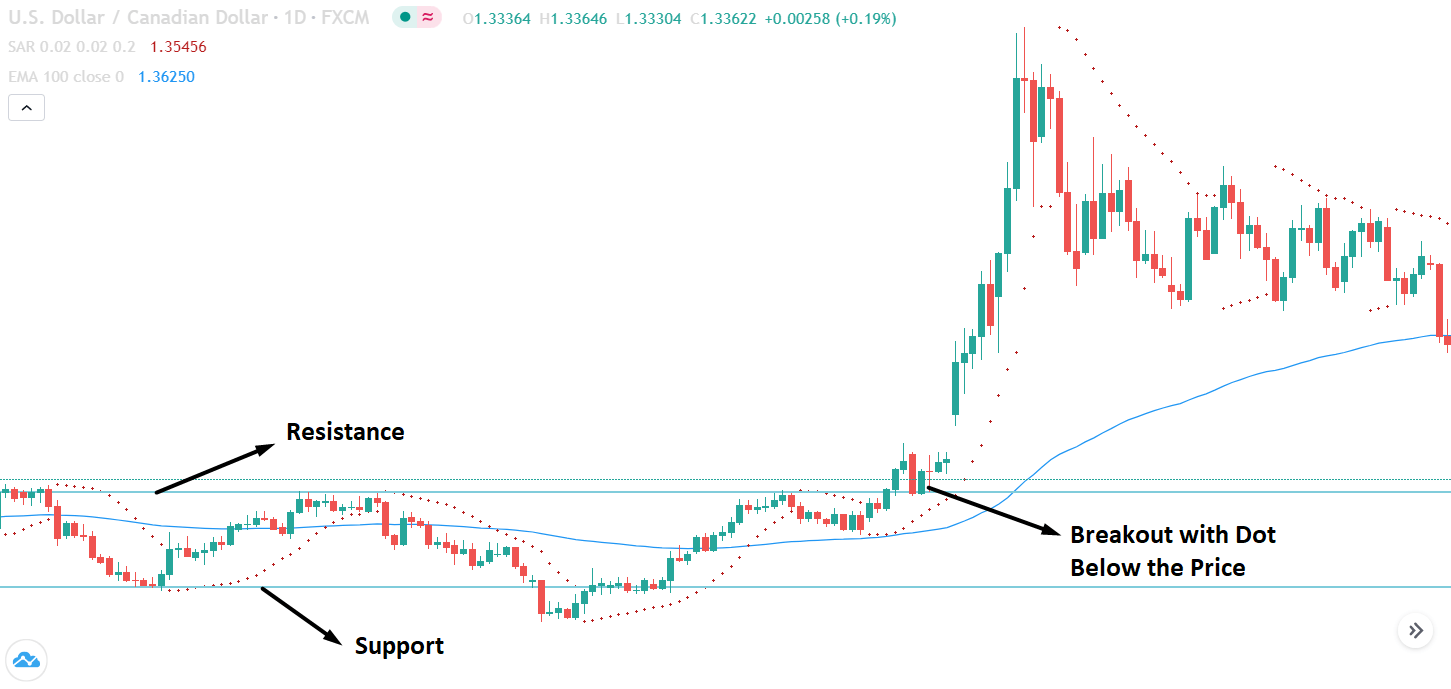
  • Notice that the price is moving in a range at the 100 EMA area with a violation. The blue horizontal line represents the support and resistance level, where the price is consolidating. In this consolidation, we will not take any trade.
  • If you look at the price structure, you can see the price is moving within a range from their resistance to support. On the price move above the 100 exponential moving average, you should put a pending order above the range, projecting that it will break out from the resistance level and create an impulsive bullish pressure.

Stop Loss and Take Profit Set

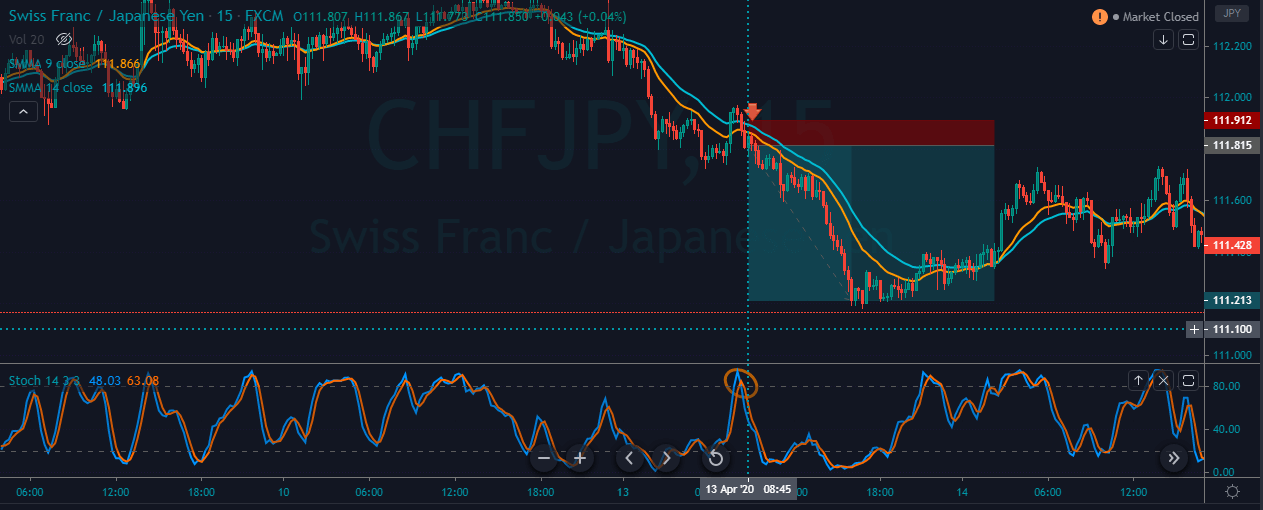
When you put the pending order above the resistance level, you should put a stop loss below red dots that have appeared below the candlestick. While setting the stop-loss, make sure to use some buffer of 10 to 15 pips.

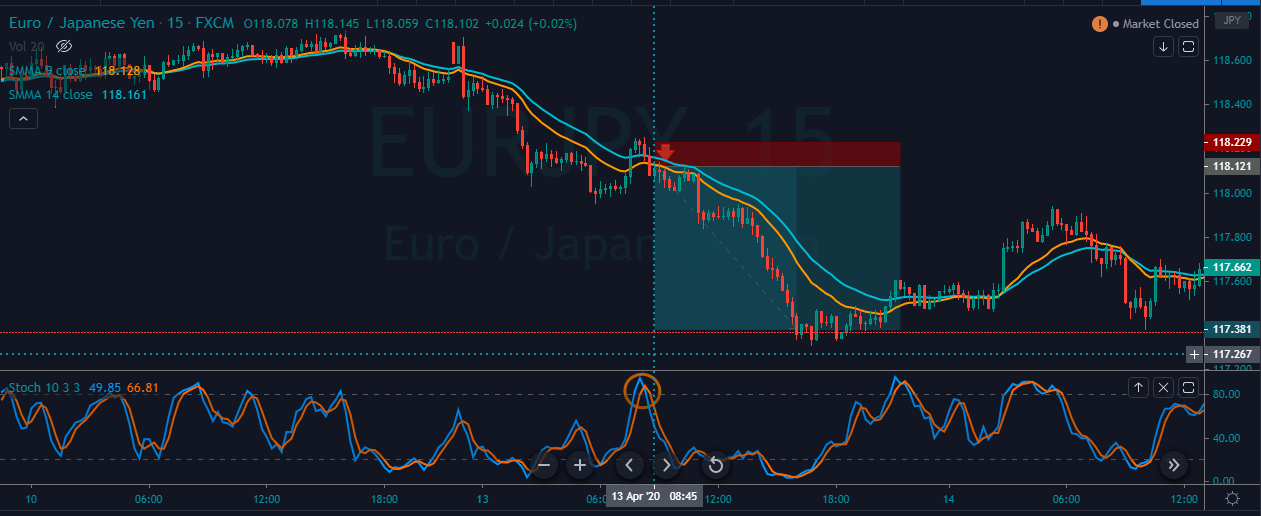
Later on, hold the price until it points red dots above the price. The red dot above the price will indicate that sellers are entering the market, and there is a possibility to create a new lower low. Furthermore, while sitting the stop loss and take profit, you should follow the basic rules of price action, including the breakout and pullback.

Summary

Let’s summarize the moving average with the Parabolic SAR trading strategy:

  • You should look for a fresh trending movement above or below 100 exponential moving average.
  • Parabolic dots below the price will provide buy-entry, and parabolic dots above the price will indicate sell-entry.
  • You should avoid ranging markets where the price might violate parabolic dots.

Moreover, trade management and good trading psychology are mandatory for every trading strategy. You cannot make a decent profit until you know how to minimize the risk to get the maximum benefit from trade.

Categories
Forex Basic Strategies

Restrict Your Losses To Only 10-Pips a Day With This Strategy

Introduction

Every trader loves the idea of winning on each trade they take. After all, winning is the sole purpose of trading. Various strategies in the market promise to offer profits every day, but none of them are good enough to make you win every single trade you take. In the end, almost all of the traders wish for a method that could reap them good profit every day. But as we all know, trading is less about making money and more about saving your capital. For this same purpose, we have created the 10 Pip Loss Strategy.

The strategy suggests that we must take two to three trades a day by placing only ten pips stop-loss and go for bigger targets. For instance, let’s consider that we took three trades in a single day. If we lose two trades and end up winning one, we will be losing only 20 pips, but the gains that are earned on the third trade can be more. By following this strategy, our primary focus should be on taking three potential trades in a day.

The Strategy – Pairing Double Moving Average & Stochastic Indicator

It is highly advisable to use this strategy in a strong trending market.

To Go Long (Buy Trades)

  • Firstly, identify an uptrend in any currency pair.
  • Apply the double moving average indicator to the price chart. Go with 9 and 14 periods.
  • Wait for the pullback to happen, and the price action must hold below the double moving average.
  • Look if the Stochastic is reversing at the oversold area.
  • Go long if all the above rules are met.
  • Place the stop-loss just ten pips below the entry. Take profit placement depends on the market state. If the buyer movement is strong, expect a brand new higher high; if the momentum is a slow, exit at the most recent higher high.

The image below represents our losing trade in the AUD/CHF forex pair. As you can see, both the indicators gave us a trading signal at around 08:45 AM. We activated our trade when the price of the asset is 0.6129. It went a bit up and suddenly dropped down to hit our stop loss. As a result, we ended up losing the trade.

The best thing is that we lost only ten pips. Hence, these smaller losses won’t influence our decision-making abilities.

The image below represents our winning trade in the AUD/NZD Forex pair. We took this trade on 22nd April at around 08:45 AM. When the moving average went below the price, the Stochastic gave a reversal at the oversold area, indicating us to go long in this pair. Right after we went long, the price action blasted to the north and printed a brand new higher high. We end up making 90 pips in this trade.

Overall, we lost ten pips till now, and hence we stand at 80 pips profit.

The below price chart represents our third trade on 22nd April. We took this trade at around 6:45 PM. Following our strategy, we made entry, and the price action has printed a brand new higher high. This trade gave us a profit of 80 pips.

To sum it up, we took three trades out of which we made 170+ pips profit and a loss of only ten pips. By following this strategy, we can make profits on every single trading day. Note: Use this strategy only when you see the potential of having at least three trades in a single day. Otherwise, there is no point in using this strategy.

To Go Short (Sell Trades)

  1. Firstly, identify a downtrend in any currency pair.
  2. Apply the double moving average indicator to the price chart. Go with 9 and 14 periods.
  3. Wait for the pullback to happen, and the price action must hold above the double moving average.
  4. Look if the Stochastic is reversing at the overbought area.
  5. Go short if all the above rules are met.
  6. Place the stop-loss just ten pips above the entry. Take profit placement depends on the market state. If the seller movement is strong, expect a brand new lower low; if the momentum is a slow, exit at the most recent lower low.

The image below represents a sell signal in the CHF/JPY Forex pair. This is the first trade we activated on 13th April at around 08:45 AM. Overall, the market was in a strong downtrend, and when it pulled back, both the indicators gave us a sell signal. After we went short, the price sharply goes down and prints a brand new lower low. This trade gave us 60+ pip profit.

We took the second trade relatively at the same time in the USD/JPY Forex pair. Overall, this pair was also in a strong downtrend, and we activated the trade when both the indicators gave us a sell signal. In this pair, the seller momentum was strong enough, and we ended up making 82+ pips. 

This is the third trade we took in the EUR/JPY Forex pair. When price action pulled back to the moving average, the Stochastic also gave us a reversal at the overbought area, indicating us to go short. By the time we have exited, we booked 64+ pips of profit.

In total, we took three trades, and all of them hit our take-profit. If you observe, even if we would have lost two trades and won only one, we would still have ended up on the winning side. In a strong trending market, it is easy to win all the trades we take. All you need to do is to follow the rules of the strategy very well. To sum it up, with minimum risk, we gained a profit of 206 pips from the market.

We hope you understood the strategy well. Please try and trade this strategy in a demo account before applying it to the live market. Cheers!

Categories
Forex Course

77. Moving Averages – Detailed Summary

Introduction

In the past few course articles, we have learned a lot about Moving Averages, their purpose, and various applications of this trading tool. So we just wanted to summarize everything we have discussed until now related to Moving Averages. This article will act as a quick guide for you to recall and remember the concepts better.

What Is A Moving Average?

A moving average is a tool that is used by the traders to identify the direction of the trend. It smoothens the price fluctuations by eliminating the temporary noise in the market. This will eventually help us in identifying the actual trend of the market. There are two types of moving averages, and both of them have different purposes. They are Simple Moving Average and Exponential Moving Average. There are different athematic calculations behind these averages, and we don’t have to know about them in detail. However, if you are interested in knowing, you can find the formula behind the averages here.

The length plays a significant role in the usage of a Moving Average. Lenght is nothing but the predetermined period of the moving average. Smaller MAs always reacts swiftly to the price movements where are longer MAs respond slowly to the price. For example, a 10-period MA always reacts quickly compared to a 20 or 30 period moving average.

SMA vs. EMA

Both SMA and EMA have their own applications to them. They can also be combined to produce more reliable trading signals. But those are sophisticated strategies that are used by some of the experienced traders. The basic approach is that the SMA should be used to protect yourself from the fake-outs that are produced by the market. We might miss out on the opportunity of being a part of the early trend, but we will be safe.

Contrarily, Exponential Moving Average quickly predicts the trend and help us in being a part of the early trend. However, it carries the risk of not identifying the fake-outs. Hence one must use these MAs depending on the market situations. We have also discussed the ways through which we can identify the market trend and taking trades using moving averages.

Applying the Moving Average Indicator On The Price Charts

With the advent of technology, most of the Forex charting platforms these days provide advanced MA indicators. MT4 has all of the moving average indicators by default. However, if you want to download a customized MT4 indicator, you can download it here. If you are a TradingView user, you can plot different period MAs on the price charts just by accessing the toolbar and choosing the MA indicator. You can change the period setting before plotting the MA on the charts.

Conclusion

Moving Average is one of the most basic technical tools but is sturdy. The usefulness of this indicator is increased when we use different period moving averages on the same chart. Also, this indicator can be combined with various other technical indicators to improve the reliability of our signals. If you have been following our strategy series, you would have seen us combining moving averages with other technical tools to filter out fake trading signals. That’s about the basics of moving averages and their applications. In the upcoming lessons, we will be learning about various indicators and their use cases. So stay tuned! Cheers.

Categories
Forex Course

76. Using Moving Average As Dynamic Support & Resistance

Introduction

In the previous article, we saw how moving averages could be used to find potential trade setups that are essentially based on trend reversal. The next fascinating use of the moving average is that they act as crucial Support and Resistance levels. We know the importance of Support and Resistance levels in technical analysis, and we learned how many indicators can be paired with these levels to generate potential trades.

But in the case of moving averages, this indicator itself acts as a potential support and resistance areas. We need to remember that these levels keep changing as and when the market changes its direction. That is why these levels are known as dynamic support and resistance levels. In this article, let’s understand this concept clearly.

In the below chart, we can see that the market repeatedly takes support at 50-Period EMA and then continues its uptrend.

From the above chart, we can also notice that the price at times is going below the EMA before bouncing off. Also, some times, the price is not precisely touching the EMA. In some cases, it is also possible that the market can just crash downwards without respecting our EMA line.

To overcome this problem, we should plot more than one EMA on the chart and then buy or sell once the price is in the middle of the two moving averages. We can also refer to this as the ‘trading zone.’ Let us see how the above chart will look after plotting another EMA on it.

After plotting 100-period EMA on the chart, we can see the price entering the areas between two MAs before going up and does not even touch the second MA. This means moving averages should never be used as single line support and resistance levels; rather, it is a ‘zone’ from where the market has a high chance of reacting.

When we use the concept of ‘zones,’ we get a clear idea of where to put the ‘stop-loss’ and ‘target.’ For example, the ‘stop-loss’ can be placed below the second MA, and ‘target’ could be the new higher high. When we have such a wide area for our ‘stop-loss,’ there is less chance of us getting stopped out before the trade performs in our favor.

Role Reversal of moving averages as Support and Resistance

Now that we know how moving averages act as support and resistance levels, we need to check if follows all the rules of S&R. One of the most significant rules of S&R is support turning Resistance and vice versa. We shall see if MAs follow that.

Below is a chart that shows how the moving average turns into Resistance after it was previously behaving as support. The yellow-colored arrow marks the point where the price broke through and crashed. Later, it started acting as a dynamic resistance level.

Conclusion

Using moving averages as support and resistance levels can be highly profitable when done with proper trade management. Intraday traders mostly use this technique as they fear of getting stopped out due to spikes. The best part of this application of the moving average is that they’re dynamic, which means we just need to plot them and leave it on the chart. We don’t have to keep looking back to spot support and resistance levels. In the next article, we will summarize all that we have learned about the moving averages. Cheers.

[wp_quiz id=”65911″]
Categories
Forex Course

75. Using Moving Average Crossovers To Take Trades

Introduction

In the previous article, we learned how to use the moving average for determining the direction trend. The Moving Average lines not only helps us in identifying the direction of the market but also tells us when a trend is about to end and potentially reverse. In today’s lesson, we will see how the moving averages can be used to enter trades at the reversal of a trend.

The principle of the strategy is to discover the crossover of the two moving averages on the chart. When the moving averages crossover, it is a sign of market reversal halting the existing trend. So at this point, we need to find a suitable ‘entry.’

Moving Average Crossover Strategy

Let us consider an example to explain the above-discussed strategy. Below, we have a daily chart of USD/CHF on which we have plotted the two moving averages (10-Period & 20-period). We can see the market being in a strong downtrend, and it is also confirmed by the two moving averages, where the ‘faster’ MA is below the ‘slower’ MA.

The next step is to find the overlap of ‘faster’ MA with the ‘slower’ MA from above, which is also known as the crossover of MAs. Once the crossover happens, there is a higher chance of the trend reversing. The below chart shows precisely how the crossover takes place, which means the trend can potentially reverse anytime now.

But, we shouldn’t be directly going long soon after the crossover. We need to confirm the trend reversal. A ‘higher low’ after the crossover validates the trend reversal, and this could be the perfect setup for going ‘long’ in this currency pair.

The below chart shows the ‘higher low,’ which is formed exactly after the crossover. Therefore, we now have confirmation from the market, so we can take some risk-free positions.

As we can see, in the below chart, the trade goes in our favor and hits our initial target. However, aggressive traders can aim for a higher ‘take-profit‘ as the new uptrend can reverse the entire downtrend, which is seen on the left-hand side. The reversal is also confirmed by moving averages where the ‘faster’ MA is above the ‘slower’ MA. The stop-loss for this trade is placed below the identified ‘higher low’ with a take-profit at a new high or significant S&R area.

Conclusion

The crossover strategy works beautifully in both volatile and trending markets, but they do not work that well in ranging markets. This is because the crossover takes place multiple times in the ranging market, and this leads to confusion about the market direction. To find high probability trades, one can also combine the strategy with other technical indicators to get additional confirmation of the trend reversal. In the next article, we shall see how moving averages can act as key support and resistance levels.

[wp_quiz id=”65842″]
Categories
Forex Indicators

The Truth About Moving Averages

Moving Averages

Of all the technical indicators that exist, moving averages are probably the most well known. Moving averages are also one of the only technical indicators ever used by market news broadcasters. Moving averages are generally one of the first types of indicators that new analysts and traders will learn about because they simple to calculate and simple to interpret. But are moving averages useful for trading? Are they appropriate for trading?

Dangers of Moving Averages

I want to preface any further commentary on moving averages by saying I am strictly opposed to their use. Outside of any singular purpose for their use, I will never advocate for their use of an analytical tool or a trading tool. The reasons for this opinion are my own trading experience, and the experience of teaching students – who have all (myself included) fell into the old trap of moving average crossover systems and the lies that are sold about their usefulness and profitability. That is not to say they are not helpful, useful, or profitable – but the temptation to believe in their positive expectancy and profitability is often too hard to avoid.


Moving Averages: A simple visual representation of data

20-period Simple Moving Average

The orange line on the chart above is a moving average — specifically, a Simple Moving Average (SMA). A Simple Moving Average is a line that is plotted, showing the average close of a defined number of periods. On the chart above, it is a 10-period moving average. Meaning it is taking the last ten candlestick closes, adding them up, dividing that number by ten, and then displaying it as a line. But a Simple Moving Average is just one type of average. There is an enormous amount of various moving averages, each with their specific calculations. The chart below shows only some of those different moving averages, all with a 10-period average.

Various moving averages

From the image above, you can probably say that, depending on the moving average used, some averages are more responsive to price changes than others. Some move a lot; some move just a little. There is a myriad of different reasons why one moving average would be used over another, and there are specific moving averages that to be used only with particular trading systems and methods. Now, after I’ve bashed moving averages, I think it’s essential that I do show some examples of moving averages positively. The first would be using a long period moving average on a higher time frame. For example, a standard method of determining whether a stock is bullish or bearish is to use a 200-period on a daily chart. If a stock is trading above the 200-day average, it is considered bullish; if it is trading below, it is bearish.

200-day Moving Average of S&P500

Another example of a trading system using moving averages effectively would be Goichi Hosada’s Ichimoku Kinko Hyo system. This system will be discussed in much greater detail in another article, but the Ichimoku system is based almost entirely on moving averages. There is a significant difference between Western moving averages and Japanese moving averages. The Tenkan-Sen and Kijun-Sen in the Ichimoku system are calculated using the mid-point of the default periods. The utilization of the mid-point is particular not to just the Ichimoku system but is indicative of a large amount of Japanese analysis, which focuses on ‘balance’ and ‘equilibrium.’ So while I do rail against the use of Western moving averages, the use of the Ichimoku system’s moving averages is undoubtedly a significant exception due to it being a full trading system and one of the few trading systems that are a proven and profitable system.

Ichimoku Kinko Hyo