Categories
Forex Signals

EUR/NZD: Heading towards the South


EUR/NZD has been in a bearish correction on the daily chart. However, the H4 chart shows that the price has been heading towards the South upon finding its resistance around 1.73200. The price consolidated within 1.71900-1.71390. The H4 chart has produced a bearish inside bar at 1.71900. Thus, if the price heads towards the South and makes a breakout at today’s lowest low, it may head towards the South by offering a short entry. The price may find its next support around 1.70500, where it had a bounce earlier. If the price makes an H4 breakout at the level of 1.70500, the pair may remain bearish in the coming days.

Trade Summary:

Entry: 1.71262

Stop Loss: 1.71882

Take Profit: 1.70582

The risk of the trade per standard lot is $ 899.06, $ 89.906 for a mini-lot, and $ 8.99 for each micro-lot. The risk-reward is 1:1.10. Thus, the reward per standard lot is $ $ 988.96, for Mini lot $ 98.89, and for Micro lot $ 9.88.

Categories
Forex Basic Strategies

Restrict Your Losses To Only 10-Pips a Day With This Strategy

Introduction

Every trader loves the idea of winning on each trade they take. After all, winning is the sole purpose of trading. Various strategies in the market promise to offer profits every day, but none of them are good enough to make you win every single trade you take. In the end, almost all of the traders wish for a method that could reap them good profit every day. But as we all know, trading is less about making money and more about saving your capital. For this same purpose, we have created the 10 Pip Loss Strategy.

The strategy suggests that we must take two to three trades a day by placing only ten pips stop-loss and go for bigger targets. For instance, let’s consider that we took three trades in a single day. If we lose two trades and end up winning one, we will be losing only 20 pips, but the gains that are earned on the third trade can be more. By following this strategy, our primary focus should be on taking three potential trades in a day.

The Strategy – Pairing Double Moving Average & Stochastic Indicator

It is highly advisable to use this strategy in a strong trending market.

To Go Long (Buy Trades)

  • Firstly, identify an uptrend in any currency pair.
  • Apply the double moving average indicator to the price chart. Go with 9 and 14 periods.
  • Wait for the pullback to happen, and the price action must hold below the double moving average.
  • Look if the Stochastic is reversing at the oversold area.
  • Go long if all the above rules are met.
  • Place the stop-loss just ten pips below the entry. Take profit placement depends on the market state. If the buyer movement is strong, expect a brand new higher high; if the momentum is a slow, exit at the most recent higher high.

The image below represents our losing trade in the AUD/CHF forex pair. As you can see, both the indicators gave us a trading signal at around 08:45 AM. We activated our trade when the price of the asset is 0.6129. It went a bit up and suddenly dropped down to hit our stop loss. As a result, we ended up losing the trade.

The best thing is that we lost only ten pips. Hence, these smaller losses won’t influence our decision-making abilities.

The image below represents our winning trade in the AUD/NZD Forex pair. We took this trade on 22nd April at around 08:45 AM. When the moving average went below the price, the Stochastic gave a reversal at the oversold area, indicating us to go long in this pair. Right after we went long, the price action blasted to the north and printed a brand new higher high. We end up making 90 pips in this trade.

Overall, we lost ten pips till now, and hence we stand at 80 pips profit.

The below price chart represents our third trade on 22nd April. We took this trade at around 6:45 PM. Following our strategy, we made entry, and the price action has printed a brand new higher high. This trade gave us a profit of 80 pips.

To sum it up, we took three trades out of which we made 170+ pips profit and a loss of only ten pips. By following this strategy, we can make profits on every single trading day. Note: Use this strategy only when you see the potential of having at least three trades in a single day. Otherwise, there is no point in using this strategy.

To Go Short (Sell Trades)

  1. Firstly, identify a downtrend in any currency pair.
  2. Apply the double moving average indicator to the price chart. Go with 9 and 14 periods.
  3. Wait for the pullback to happen, and the price action must hold above the double moving average.
  4. Look if the Stochastic is reversing at the overbought area.
  5. Go short if all the above rules are met.
  6. Place the stop-loss just ten pips above the entry. Take profit placement depends on the market state. If the seller movement is strong, expect a brand new lower low; if the momentum is a slow, exit at the most recent lower low.

The image below represents a sell signal in the CHF/JPY Forex pair. This is the first trade we activated on 13th April at around 08:45 AM. Overall, the market was in a strong downtrend, and when it pulled back, both the indicators gave us a sell signal. After we went short, the price sharply goes down and prints a brand new lower low. This trade gave us 60+ pip profit.

We took the second trade relatively at the same time in the USD/JPY Forex pair. Overall, this pair was also in a strong downtrend, and we activated the trade when both the indicators gave us a sell signal. In this pair, the seller momentum was strong enough, and we ended up making 82+ pips. 

This is the third trade we took in the EUR/JPY Forex pair. When price action pulled back to the moving average, the Stochastic also gave us a reversal at the overbought area, indicating us to go short. By the time we have exited, we booked 64+ pips of profit.

In total, we took three trades, and all of them hit our take-profit. If you observe, even if we would have lost two trades and won only one, we would still have ended up on the winning side. In a strong trending market, it is easy to win all the trades we take. All you need to do is to follow the rules of the strategy very well. To sum it up, with minimum risk, we gained a profit of 206 pips from the market.

We hope you understood the strategy well. Please try and trade this strategy in a demo account before applying it to the live market. Cheers!

Categories
Chart Patterns

Chart Patterns: Flags and Pennants

Flags and Pennants

If you’ve ever traded a chart and you’ve seen what looks like a reversal in the trend, but as soon as you enter the trend seems to continue, odds are you were trading against a continuation pattern. Flags and pennants are titles given to patterns that show up as small countertrend moves that ultimately trap participants and then use their momentum to keep the price moving in the direction of the trend. Flags are represented as rectangular channels, and pennants are represented as triangles.

Before a flag or pennant can be identified, we first need a flag pole. A flag pole is any clear trending price action that, well, looks like a pole. See below:

Flags and Pennants
Flags and Pennants


The images above show examples of bearish flags and bearish pennants, as well as bullish flags and bullish pennants. If you are unfamiliar with how to trade triangles or rectangles, refer to the articles that discuss the various triangle patterns. But we can review the basics of entering these great continuation patterns.

Bearish Pennant
Bearish Pennant
Bear Flag
Bear Flag
Bullish Pennant
Bullish Pennant
Bull Flag
Bull Flag


Learning how to trade flags and pennants is one of the most useful and enjoyable things that you can learn – especially as a new trader. Flags and pennants help train your brain to get used to buying dips during bull runs and shorting rallies during bear moves. If you get to a point where you can profitably trade flags and pennants, then you have transitioned into a trader who is very near outperforming the vast majority of your peers. It may seem like an easy thing to do – but it is an entirely different thing to execute. Analyzing and identifying a flag or pennant is easy; trading it is difficult.

I can not stress enough how profitable these patterns can be – and how easily you can miss them even in plain sight. The problem resides with your brain – that ‘lizard’ part that kicks in when you are are fearful of your account. When you begin to feel the fear of your account losing money, that triggers a powerful part of your brain known as the limbic system. The limbic system controls fear and pleasure. And when your fear sense is triggered, it hyper focuses the synapsis across your brain. Things that you would passively identify like flags and pennants are tertiary in their importance when the limbic system is acting in your defense. You need to find ways to ‘pause’ the process with things like alerts. On the images above, you saw horizontal lines above prior swing highs and below prior swing lows. Placing alerts at those points may be enough to interrupt your primary fear response and allow you to make money on your emotions.

Because if you are feeling it, so is everyone else.


Sources:

Kirkpatrick, C. D., & Dahlquist, J. R. (2016). Technical analysis: the complete resource for financial market technicians. Upper Saddle River: Financial Times/Prentice Hall.

Bulkowski, T. N. (2013). Visual guide to chart patterns. New York, NY: Bloomberg Press.

Bulkowski, T. N. (2008). Encyclopedia of candlestick charts. Hoboken, NJ: J. Wiley & Sons.

Bulkowski, T. N. (2002). Trading classic chart patterns. New York: Wiley.

Categories
Chart Patterns

Chart Patterns: Symmetrical Triangles

Symmetrical Triangles

Out of all the triangle patterns, symmetrical triangles are perhaps the most common and the most common and the most subjective. Symmetrical triangles have a standard neutral bias; however, symmetrical triangles most often form after a prior trend, because they most commonly form after a prior move. The preference of their trading direction is determined by the direction from the previous move. If the preceding move was bullish, then the symmetrical triangle is viewed as a bullish continuation pattern. Like all triangle patterns that form after a trending move, they are known as pennants.

The construction of a symmetrical triangle is like any other triangle: it requires to trendlines that intersect: one upward sloping angle and one downwards sloping angle. Price action should touch both the upper and lower trendlines at least twice – but ideally three times. A lack of open space within the triangle is ideal. Breakouts often occur in the final 1/3rd of the triangle. Volume typically falls before the breakout.

I believe that understanding the psychology of how this pattern forms is essential. The symmetrical triangle is the result of a condition that is very common in any traded market: consolidation. It’s not just common; it’s normal. Consolidation is representative of two things: equilibrium on the part of buyers and sellers and indecision by active speculators. The psychology of price action inside a symmetrical triangle is different than what occurs in an ascending or descending triangle, which both have a marked bias during the construction. Symmetrical triangles are the epitome of indecision, and traders can very quickly fall victim to whipsaws.

Symmetrical triangles, while the most common, are also the most confusing. Take the image below:

Symmetrical Triangle

The symmetrical triangle on the daily chart for the AUDJPY is a bearish pennant – a bearish continuation pattern. While any triangle that forms after an established trending move has a high probability of pushing the price in the direction of the trend, it doesn’t always happen that way. As I wrote above, symmetrical patterns are inherently neutral – so it is important to watch them. We can see that this symmetrical triangle did not cause a continuation move south – it reversed. Regardless of the direction of the breakout, some rules should be applied when entering a trade based on a breakout of a symmetrical triangle.

Symmetrical Triangle - Long Entry
Symmetrical Triangle – Long Entry

First, unlike the ascending and descending triangles, we don’t enter on the break. We want to enter when price breaks the prior high (or low). For the chart above, we would enter long above the previous swing high that touched the downtrend line.

Symmetrical Triangle - Short Entry
Symmetrical Triangle – Short Entry

The short entry from a breakout below a symmetrical triangle is the inverse of the bullish entry. On the chart above, the short entry is when price moves below the prior swing low that tagged the uptrend line – not on the initial breakout.

Pullbacks and throwbacks occur 59% of the time. Symmetrical triangles are notorious for many false breakouts, so look for frequent wicks/shadows to pierce the trendlines. Dahlquist and Kirkpatrick wrote that volume that increases on the breakout increases the performance of the pattern, but it is otherwise below average in its performance.


Sources:

Kirkpatrick, C. D., & Dahlquist, J. R. (2016). Technical analysis: the complete resource for financial market technicians. Upper Saddle River: Financial Times/Prentice Hall.

Bulkowski, T. N. (2013). Visual guide to chart patterns. New York, NY: Bloomberg Press.

Bulkowski, T. N. (2008). Encyclopedia of candlestick charts. Hoboken, NJ: J. Wiley & Sons.

Bulkowski, T. N. (2002). Trading classic chart patterns. New York: Wiley.

Categories
Forex Course

39. Understanding the Concept of Spreads in Forex

Introduction

Ever wondered how brokers make money from their clients? Well, it is through a simple concept of Spreads.

In the previous course, we discussed the terminologies such as pip, pip value, bid price, ask price, etc. In this lesson, we shall be extending our discussion and touch base on ‘Spreads’ in Forex.

What is Spread in Forex?

The difference between the ask price and the bid price is called the spread.

The “bid” is the price displayed by the broker at which one can Sell a currency pair. Similarly, the “ask” is the price offered by the broker at which one can Buy a currency pair. In both, “bid” and “ask,” Buying and Selling happen on the base currency.

So, the difference between these two prices yields some pips. And these pips become the profit of the brokers. This is how brokers make money without any commission.

In Forex, clients need not pay any additional fee to make a trade, as all the charges are built into the buy and sell prices itself. So, people must not get carried away by brokers who claim that they charge “Zero commission,” because traders will indirectly be paying commission in the form of spread.

How is spread calculated?

In the forex market, the spread is typically measured in pips, which is the smallest unit of price movement in a currency pair.

For example, let us say the current price of EUR/USD is 1.1500 / 1.1504. Here, the left quoted price is called the bid price, and the right quoted price is called the ask price.

Now, to calculate the spread, we just find the difference between the two prices.

So, Spread = ask price – bid price = 1.1504 – 1.1500 = 0.0004

Hence, the spread for this currency pair is 4 pips.

Note: Always subtract the lower price with the higher price.

Moving forward, let us say a trader wants to buy one mini lot of EUR/USD at this price. So, to do the buy, he/she will be paying the ask price (1.1504). And, to close the trade, he/she will be given the bid price (1.1500).

Assuming that they bought and closed (sold) immediately, they would be in a loss of 4 pips. Now, to obtain the loss in terms of cost, we need to multiply the cost of one pip by the number of lots they are trading.

Assuming that the value per pip is $1 for every mini lot, the total cost would sum up to $4. Total cost = 4 pips * 1 mini lot * $1 (per mini lot) = $4

Similarly, if they were trading eight mini lots, the total transaction cost would turn out to be $32. Total cost = 4 pips * 8 mini lots * $1 (per mini lot) = $32

Hence, this brings us to the end of this lesson. And in the next lesson, we shall elaborate more on this topic by understanding the types of spreads in forex.

[wp_quiz id=”54428″]
Categories
Forex Trading Guides Ichimoku

Ichimoku Kinko Hyo Guide – A walk through a trade.

Ichimoku Kinko Hyo Guide – A walk through a trade.

I want to preface this guide with a screenshot of my account.

Trade History
Trade History

The screenshot is a series of some of the trades I’ve made in early April 2019. I do this because this guide on trading with Ichimoku will target the trade that is highlighted. Additionally, I think it is important that if I am showing you an example of a trade for a guide, I should show that I had skin in the game. There are a great many guides and strategies that authors, analysts, and traders suggest, but few will share if they took the trade. The highlighted trade for the EURGBP is the trade I will be using for this guide. It is a great example of the trading methodology I use with the Ichimoku System.


Multiple Timeframe Analysis – Daily, 4-Hour, and 1-Hour

The Ichimoku Kinko Hyo system is most effective when utilizing multiple timeframes. It is the only way that I use the Ichimoku system. In my trading, I use the Daily, 4-hour, and 1-hour time frames. Multiple timeframes are extremely useful in filtering your trade entries and ensuring higher probability trade setups. The process below will go through the process I used to take the trade.

Step One – Daily Chart Check: Price greater than Kijun-Sen, NOT inside the Cloud.

Step One - Check Daily Cloud
Step One – Check Daily Cloud

The very first thing I check is the daily chart. If the price is inside the Cloud on the daily chart, I skip the chart. It’s dead to me. If the price is not inside the Cloud, I then look for where the price is in relation to the Kijun-Sen. The daily chart determines my trading direction. If the price is above the Kijun-Sen, I only take long trades. If the price is below the Kijun-Sen, I only take short trades.

Step Two – 4-Hour Chart Check: Price above the Cloud, Chikou Span above candlesticks.

Step Two - Check 4-hour chart.
Step Two – Check the 4-hour chart.

If the daily chart determines the direction of my trading, the 4-hour provides the filter for the entry chart (the 1-hour chart). The only things I am concerned about with the 4-hour chart is that the Chikou Span is above the candlesticks, and that price is above the Cloud. Preferably, the Chikou Span would also be in ‘open space’ – but I don’t use it as a hard rule. I have not found the open space to be as important during the change of a trend or corrective move.

(a note about ‘Open Space’ – Open Space is a condition where the Chikou Span won’t intercept any candlesticks over the next five to ten trading periods. When the Chikou Span is in open space, this represents ease of movement in the direction of the trend with little in the form of resistance (or support) ahead.)

The EURGBP trade we are analyzing is a good example of why, at the current position, I don’t consider the open space as strict as I would on the hourly. I want to refer you back to the daily chart. If, on the daily chart, both price and the Kijun-Sen are below the daily cloud, but price moves above the Kijun-Sen – I don’t consider the open space variable as important on the 4-hour chart.

Step Three – 1-Hour Chart Check

Step Three - 1-hour Entry
Step Three – 1-hour Entry

The 1-Hour chart is my entry chart. As long as Step One and Step Two are true, the 1-hour chart is where the bread and butter of the trading occurs. My entry rules are this:

  1. Future Span A is greater than Future Span B.
  2. Chikou Span above the candlesticks and in ‘open space’ – for five periods.
  3. Tenkan-Sen is greater than Kijun-Sen
  4. Price is greater than the Tenkan-Sen and Kijun-Sen.

I generally look for a profit target of 20-40 pips, depending on the FX pair. For example, on the NZDUSD, I would look for 20 pips, and on the GBPNZD, I would look for 40 pips. But there are some hard technical reasons to leave a trade before that profit target is hit. The list below represents my exit rules on the 1-hour Chart – I exit the trade if any of these conditions occur.

  1. Exit if Chikou Span below candlesticks for more than three consecutive candlesticks.
  2. Exit if price enters the 1-hour Cloud.
  3. Exit if Tenkan-Sen below the Kijun-Sen for more than five candlesticks.

Step Four – Reentry Rules

Step Four - Reentry
Step Four – Reentry

Entry rules are fine, but the problem isn’t always finding the entry. One of the hardest problems is creating rules for re-entering a trade. Mine are as follows:

  1. Tenkan-Sen and Kijun-Sen must be above the Cloud.
  2. Chikou Span above the candlesticks.
  3. Price greater than Kijun-Sen and Tenkan-Sen.

A quick summary of steps taken

  1. Checked the daily chart, the price was above the daily Kijun-Sen. The trade direction is long/buy.
  2. Check the 4-hour chart, the price was above the Cloud, and the Chikou Span was above the candlesticks.
  3. All 1-hour rules confirmed an entry; profit taken at 40 pips.
  4. Re-entered trade on 1-hour chart, exited when price entered the 1-hour Cloud.


Sources: Péloille, Karen. (2017). Trading with Ichimoku: a practical guide to low-risk Ichimoku strategies. Petersfield, Hampshire: Harriman House Ltd.

Patel, M. (2010). Trading with Ichimoku clouds: the essential guide to Ichimoku Kinko Hyo technical analysis. Hoboken, NJ: John Wiley & Sons.

Linton, D. (2010). Cloud charts: trading success with the Ichimoku Technique. London: Updata.

Elliot, N. (2012). Ichimoku charts: an introduction to Ichimoku Kinko Clouds. Petersfield, Hampshire: Harriman House Ltd.


Categories
Forex Ichimoku strategies Ichimoku

Ichimoku Strategy #1 – The Ideal Ichimoku Strategy

The Ideal Ichimoku Strategy is the first strategy in my series over Ichimoku Kinko Hyo. There are two sides to a trade, and so there will be two different setups for long and short setups. This strategy comes from the phenomenal work of Manesh Patel in his book, Trading with Ichimoku Clouds: The essential guide to Ichimoku Kinko Hyo technical analysis. Buy it, don’t pirate.

Patel identified this strategy as the foundational strategy. Because it uses all of the components of the Ichimoku system, I believe that this is the strategy that people should be able to know so well, that they can glance at a chart and understand what is happening. You should see this strategy and be ready to trade it profitably before you transition into trying other Ichimoku strategy. If you don’t, you can run the risk of being disenfranchised with the system and believe that it is another trading system that doesn’t work.

Moving on to the other strategies without mastering this strategy first is very dangerous to your trading development and your understanding of the Ichimoku Kinko Hyo system.

Ideal Ichimoku Bullish Rules

  1. Price above the Cloud.
  2. Tenkan-Sen above Kijun-Sen.
  3. Chikou Span above the candlesticks.
  4. The Future Cloud is ‘green’ – Future Senkou Span A is above Future Senkou Span B.
  5. Price is not far from the Tenkan-Sen or Kijun-Sen
  6. Tenkan-Sen, Kijun-Sen, and Chikou Span should not be in a thick Cloud.
Bullish Ideal Ichimoku Strategy Entry

Ideal Ichimoku Bearish Rules

  1. Price below the Cloud.
  2. Tenkan-Sen below Kijun-Sen.
  3. Chikou Span below the candlesticks.
  4. The Future Cloud is ‘red’ – Future Senkou Span A is below Future Senkou Span B.
  5. Price is not far from the Tenkan-Sen or Kijun-Sen.
  6. Tenkan-Sen, Kijun-Sen, and Chikou Span should not be in a thick Cloud.
Bearish Ideal Ichimoku Strategy Entry


Sources: Péloille, Karen. (2017). Trading with Ichimoku: a practical guide to low-risk Ichimoku strategies. Petersfield, Hampshire: Harriman House Ltd.

Patel, M. (2010). Trading with Ichimoku clouds: the essential guide to Ichimoku Kinko Hyo technical analysis. Hoboken, NJ: John Wiley & Sons.

Linton, D. (2010). Cloud charts: trading success with the Ichimoku Technique. London: Updata.

Elliot, N. (2012). Ichimoku charts: an introduction to Ichimoku Kinko Clouds. Petersfield, Hampshire: Harriman House Ltd.


Categories
Ichimoku

Ichimoku Strategy #2 – K-Cross, The Day Trading Strategy

The Kijun-Sen Crossover (Crossunder) Strategy is the second in my series over Ichimoku Kinko Hyo. There are two trades setups provided for the long and short side of a market. This strategy also comes from Manesh Patel’s book, Trading with Ichimoku Clouds: The essential guide to Ichimoku Kinko Hyo technical analysis.

Patel called this the day-trading strategy. He warned that this trading strategy has the lowest risk factor out of all of his strategies. The positive expectancy rate is lower, and so being stopped out of trades is a normal consequence of this strategy. He also indicated that the win/loss ratio could be extremely high.

Kijun-Sen Cross Bullish Rules

  1. Price crosses above the Kijun-Sen.
  2. Tenkan-Sen greater than the Kijun-Sen.
    1. If the Tenkan-Sen is less than the Kijun-Sen, then the Tenkan-Sen should be pointing up while the Kijun-Sen is flat.
  3. Chikou Span in open space.
  4. Future Senkout Span B is flat or pointing up.
    1. If Future Senkou Span A is less than Future Senkou Span B, then Future Senkou Span A must be pointing up.
  5. Price, Tenkan-Sen, Kijun-Sen, and Chikou Span should not be in the Cloud. If they are, it should be a thick cloud.
  6. Price not far from the Tenkan-Sen or Kijun-Sen
  7. Optional: Future Cloud is not thick.
K-Cross Strategy Bullish Entry


Kijun-Sen Cross Bearish Rules

  1. Prices cross below the Kijun-Sen.
  2. Tenkan-Sen less than the Kijun-Sen.
    1. If the Tenkan-Sen is less than the Kijun-Sen, then the Tenkan-Sen should be pointing up while the Kijun-Sen is flat.
  3. Chikou Span in open space.
  4. Future Senkou Span B is flat for pointing down.
    1. If Future Senkou Span A is greater than Future Senkou Span B, then Future Senkou Span A must be pointing down.
  5. Price, Tenkan-Sen, Kijun-Sen, and Chikou Span should not be in the Cloud. If they are, it should be a thick Cloud.
  6. Price not far from the Tenkan-Sen or Kijun-Sen
  7. Optional: Future Cloud is not thick.
K-Cross Strategy Bearish Entry


Sources: Péloille Karen. (2017). Trading with Ichimoku: a practical guide to low-risk Ichimoku strategies. Petersfield, Hampshire: Harriman House Ltd.

Patel, M. (2010). Trading with Ichimoku clouds: the essential guide to Ichimoku Kinko Hyo technical analysis. Hoboken, NJ: John Wiley & Sons.

Linton, D. (2010). Cloud charts: trading success with the Ichimoku Technique. London: Updata.

Elliot, N. (2012). Ichimoku charts: an introduction to Ichimoku Kinko Clouds. Petersfield, Hampshire: Harriman House Ltd.

Categories
Forex Harmonic

The Alternate Bat Pattern

Harmonic Pattern Example: Alternate Bat Bullish

The Alternate Bat Pattern

The Alternate Bat Pattern is another pattern by Scott M. Carney. This pattern comes from his second Volume Two in his Harmonic Trading series of books. He discovered this pattern roughly two years after (2003) his discovery of the Bat Pattern (2001). Carney wrote that ‘the origin of the alternate Bat pattern resulted from many frustrated and failed trades of the standard framework. The standard Bat pattern is defined by the B point that is less than a 0.618 retracement of the XA Leg.’ Essentially, with the Alternate Bat Pattern we observe an extension beyond the 88.6% level at D, where D moves slightly below X (in a bullish Bat) or above X (in a bearish Bat). I view Alternate Bats as classic and powerful bear traps and bull traps. And they are just plain nasty if you find yourself thinking that a new low means further downside movement and a continuation lower – but instead to you get whipsawed by a massive reversal.


Alternate Bat Elements

  • Whereas the 88.6% retracement is nearly singular to the Bat Pattern, the Alternate Bat Pattern utilizes the 113% retracement of XA to determine the endpoint.
  • B must be a 38.2% or less retracement of XA.
  • Minimum projection of 200%
  • The AB=CD pattern must be an extended AB=CD and often is a 161.8% level.
  • The pattern is potent when using a form of divergence detection, such as the Composite Index, to confirm the pattern.


Sources: Carney, S. M. (2010). Harmonic trading. Upper Saddle River, NJ: Financial Times/Prentice Hall.  Gilmore, B. T. (2000). Geometry of markets. Greenville, SC: Traders Press.  Pesavento, L., & Jouflas, L. (2008). Trade what you see: how to profit from pattern recognition. Hoboken: Wiley.

Categories
Forex Basic Strategies

Trade Breakouts Like A Pro With This ‘Breakout Trading Strategy’

Introduction

In previous strategies article, we have discussed the ‘Turtle Soup Strategy by fading the Donchian channel.’ We hope you tried that strategy. In today’s article, let us discuss how to trade breakouts. We will also cover some of the best strategies used by professional traders to trade breakouts. Aggressive traders prefer trading this Breakout strategy compared to the conservative ones.

What is breakout trading?

To understand breakout trading, it is necessary to know the two important types of breakouts.

Defining a breakout

Breakout trading is an effort to enter the market when price moves outside a defined price range. The price range could be between support and resistance or between swing high and swing low. It is good if the breakout is accompanied by high volume.

Breakout of support and resistance

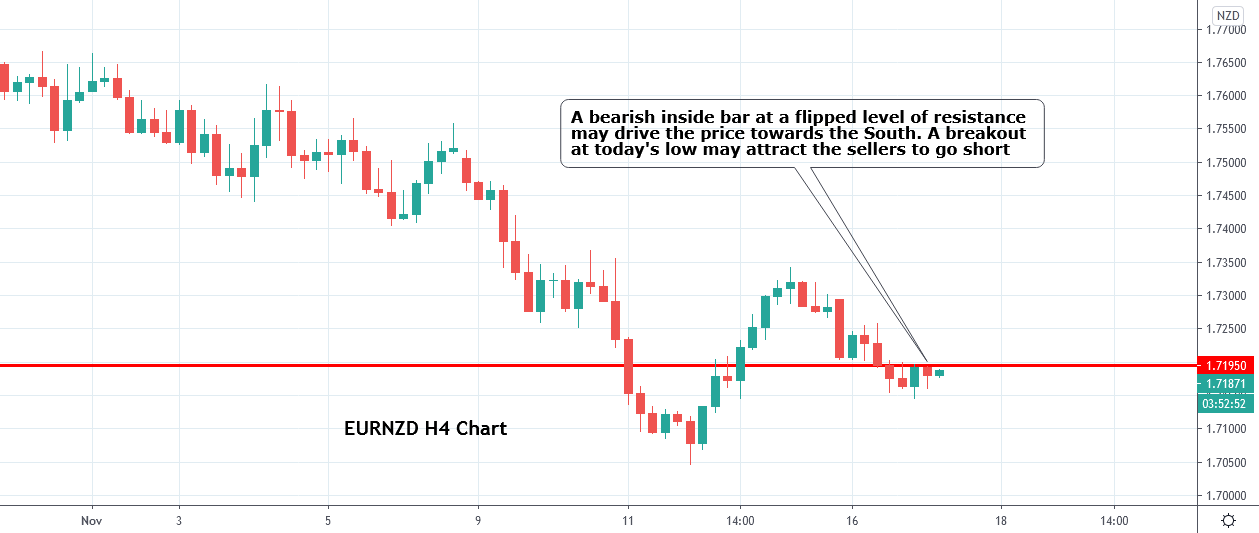
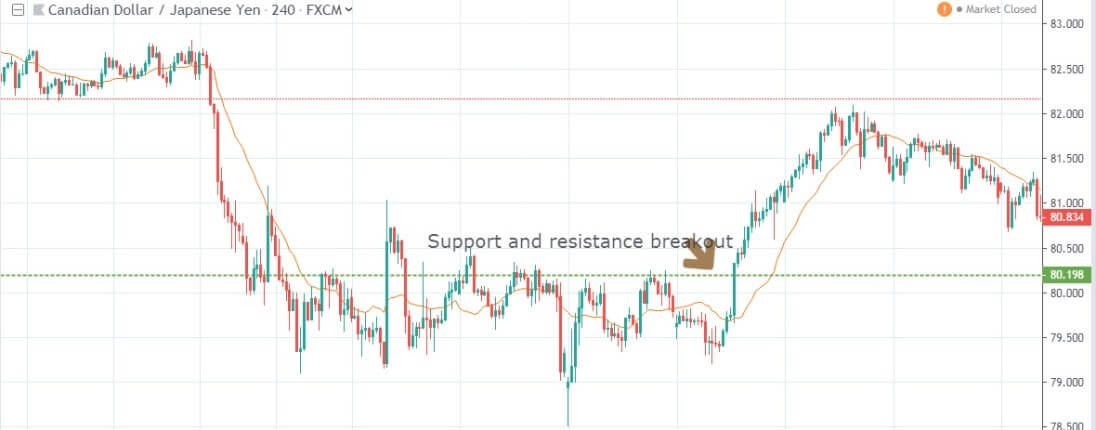
This type of breakout is quite simple and straight forward. The breakout of support and resistance should ideally happen with a big and bold candle. Because that shows the genuineness of the breakout. In the below chart, the candle closes well above the support and resistance level. In the below figure, it can be noticed instantly. A rule of thumb is that the bigger the breakout candle, the better it is.

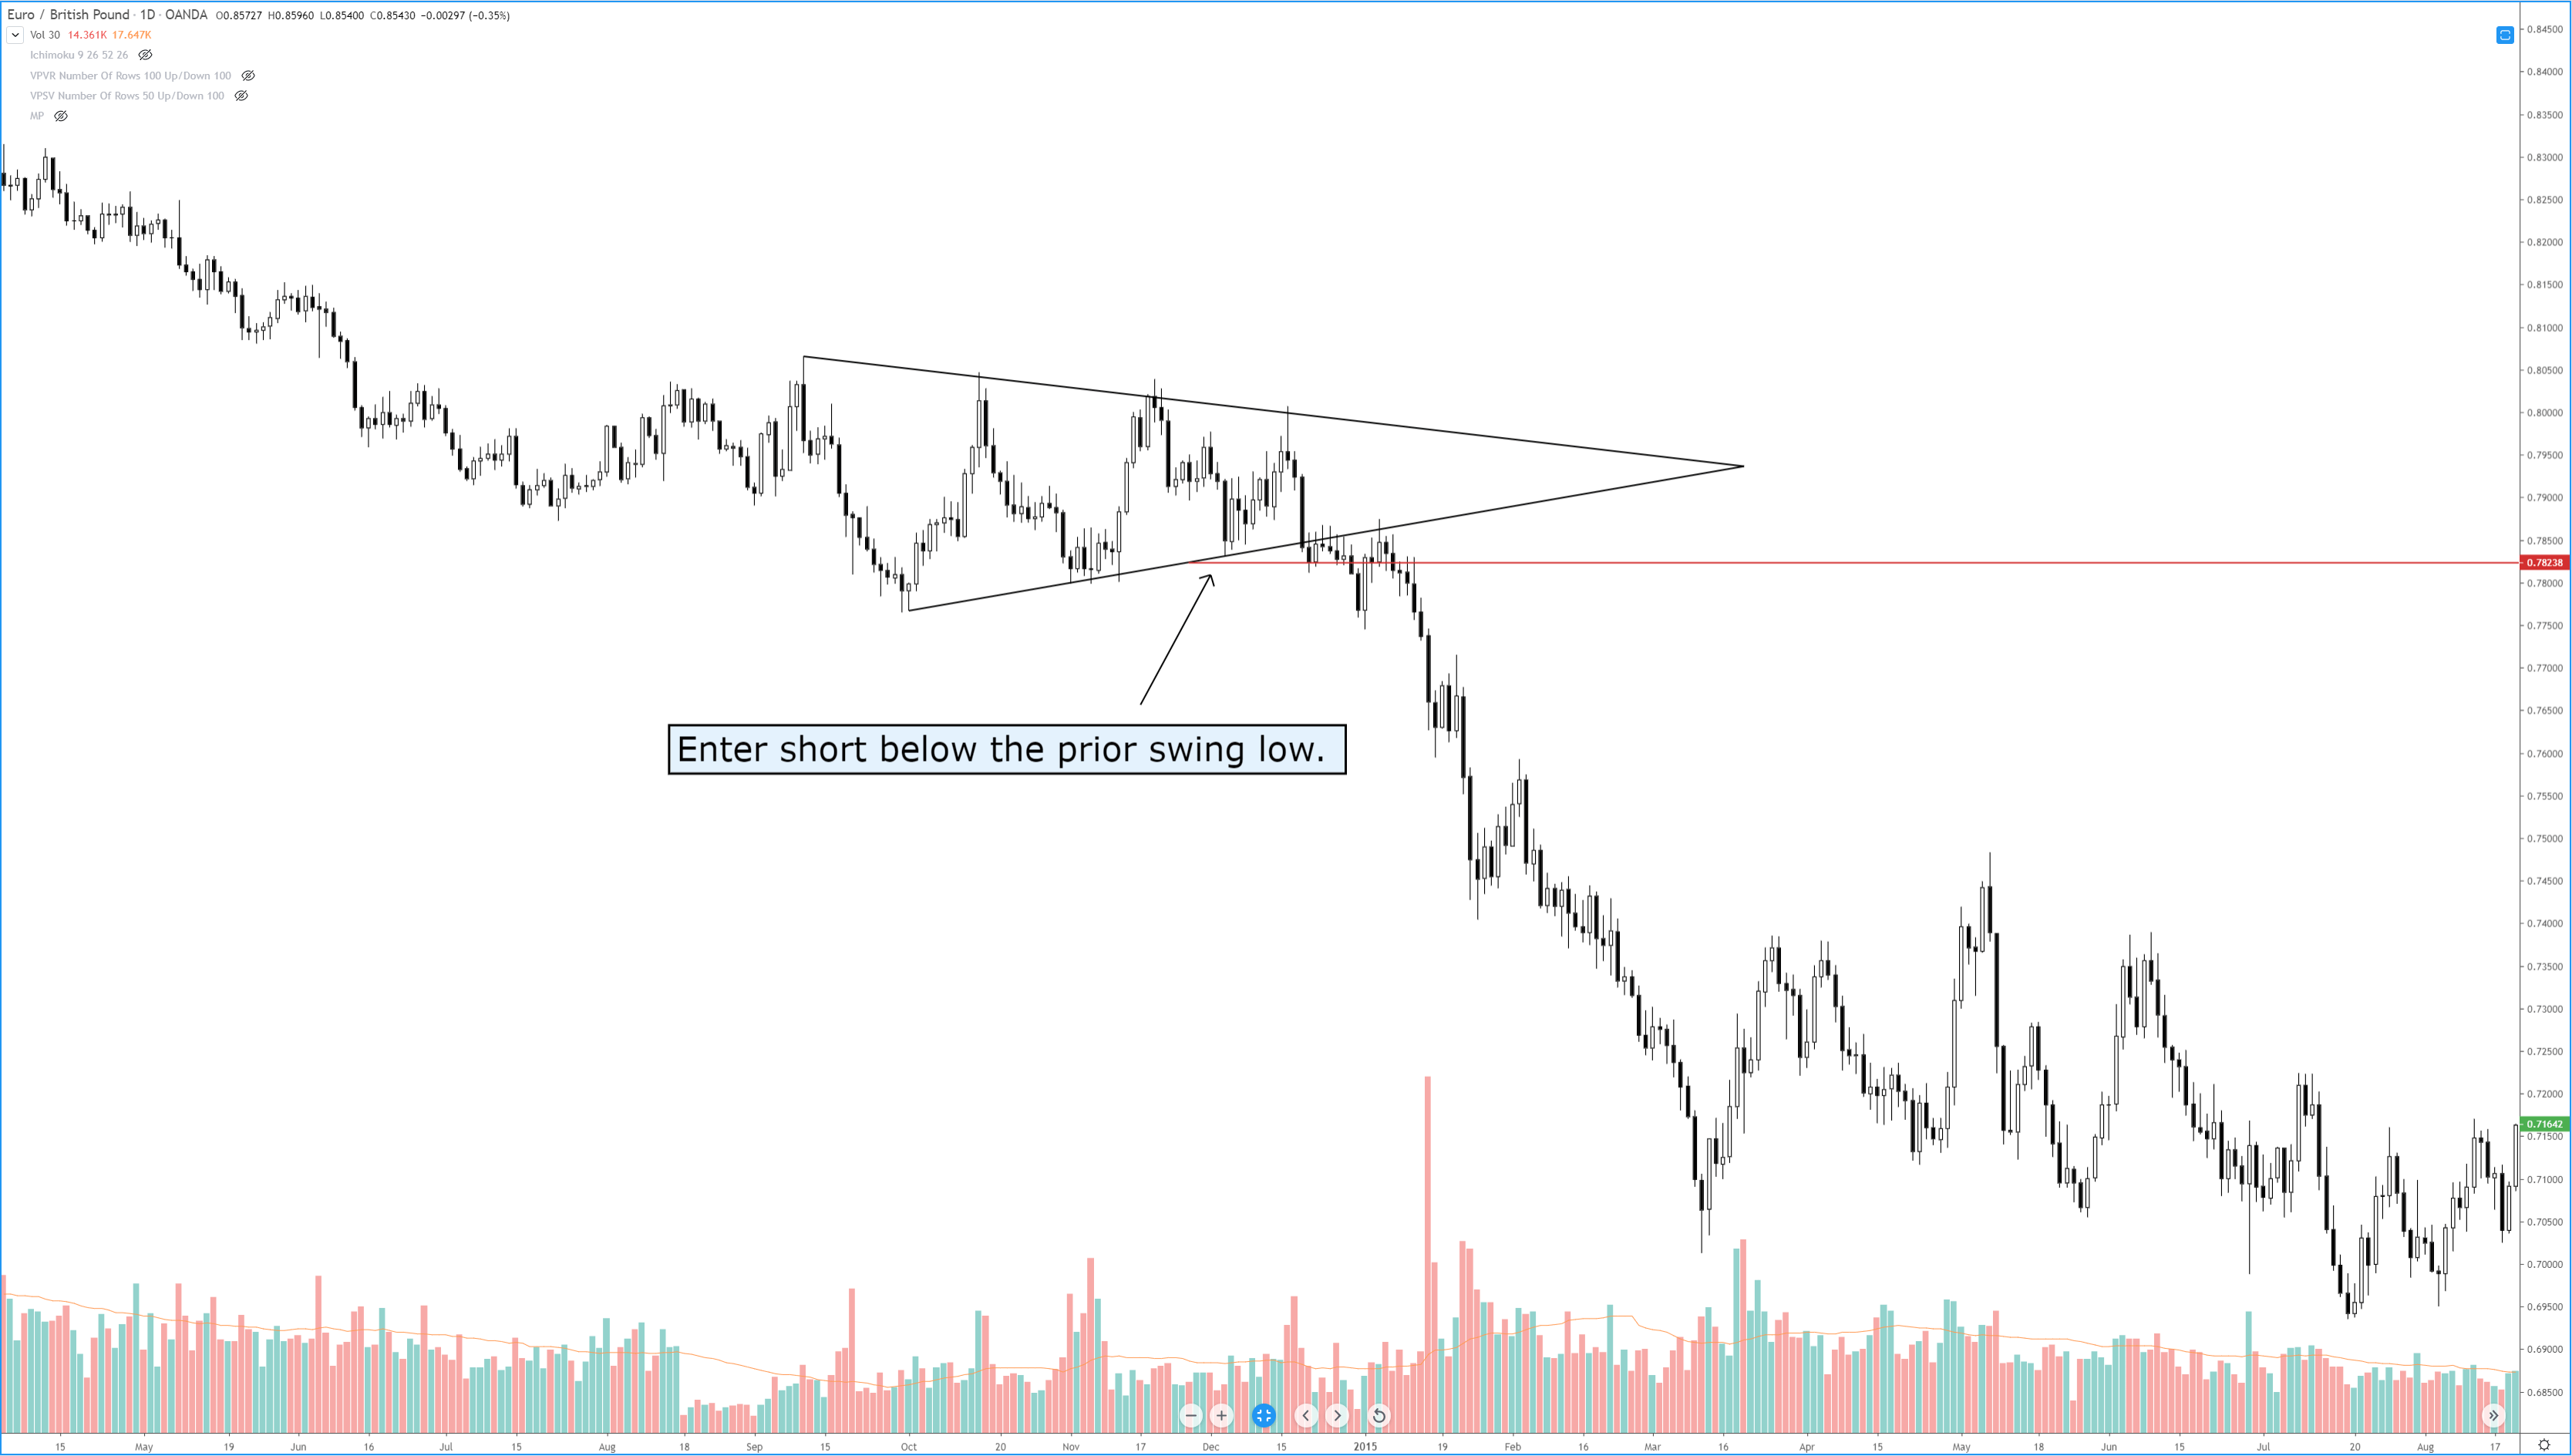
Breakout of swing high and swing low

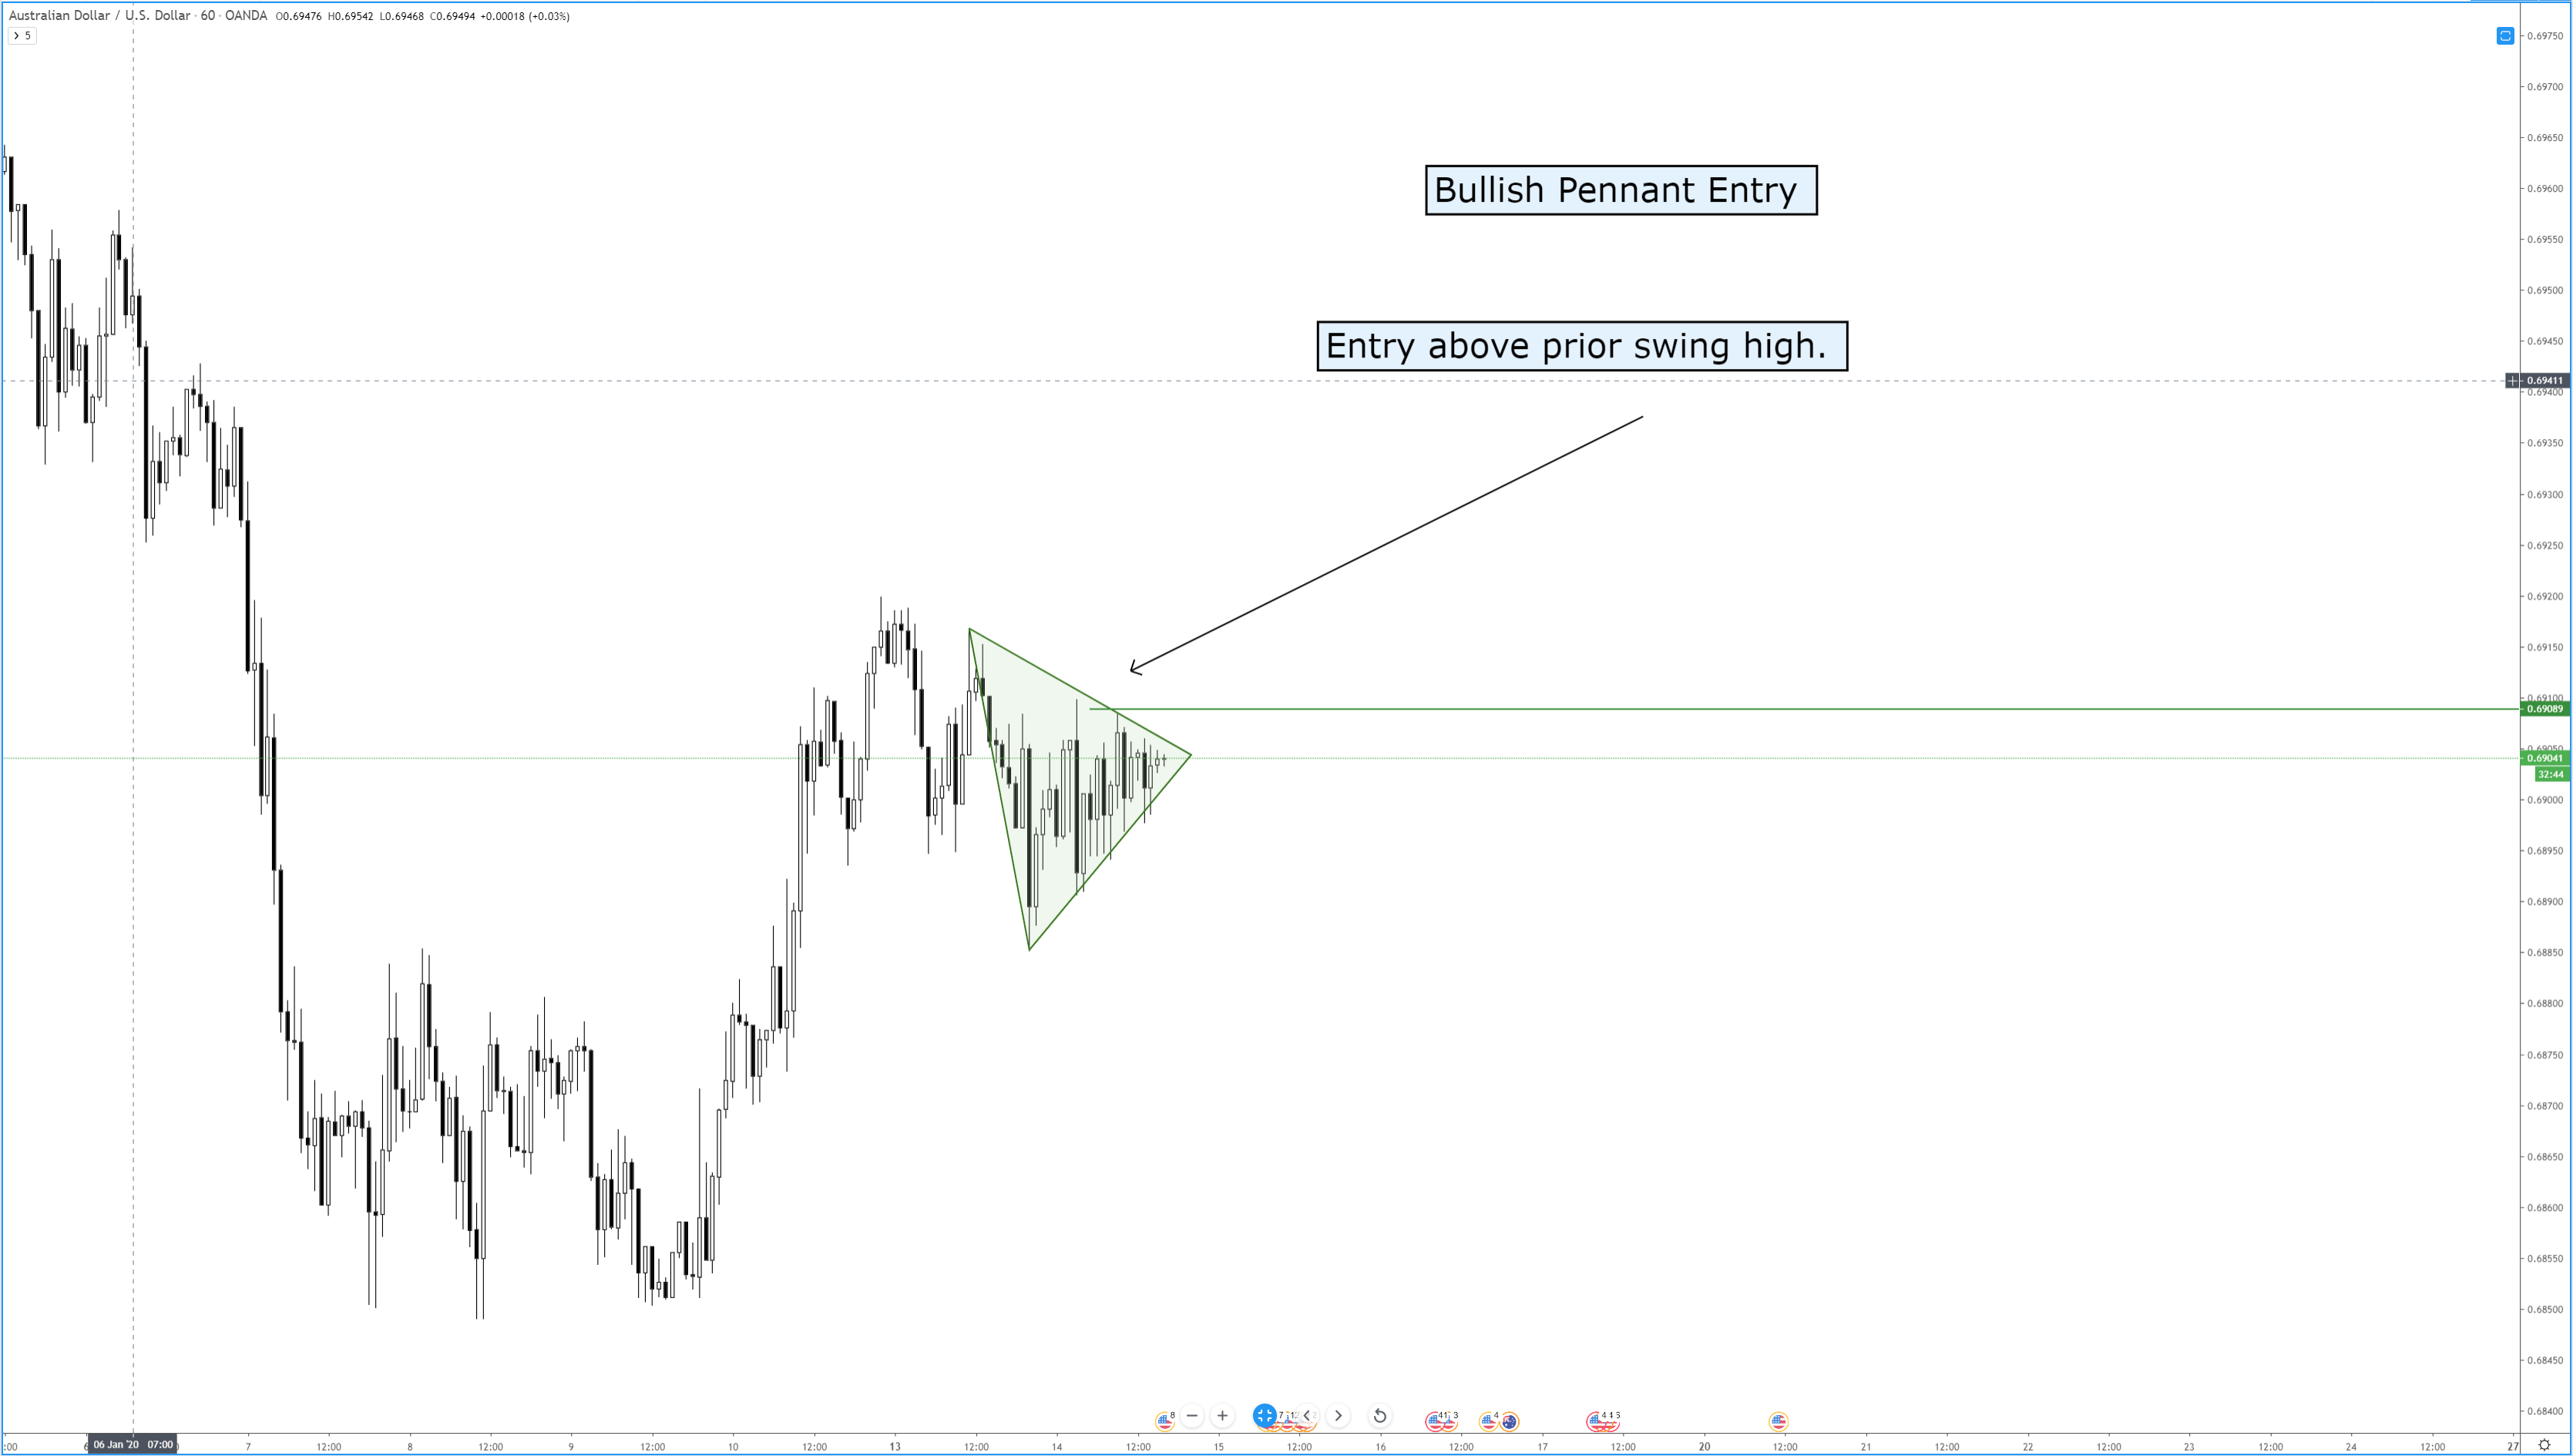
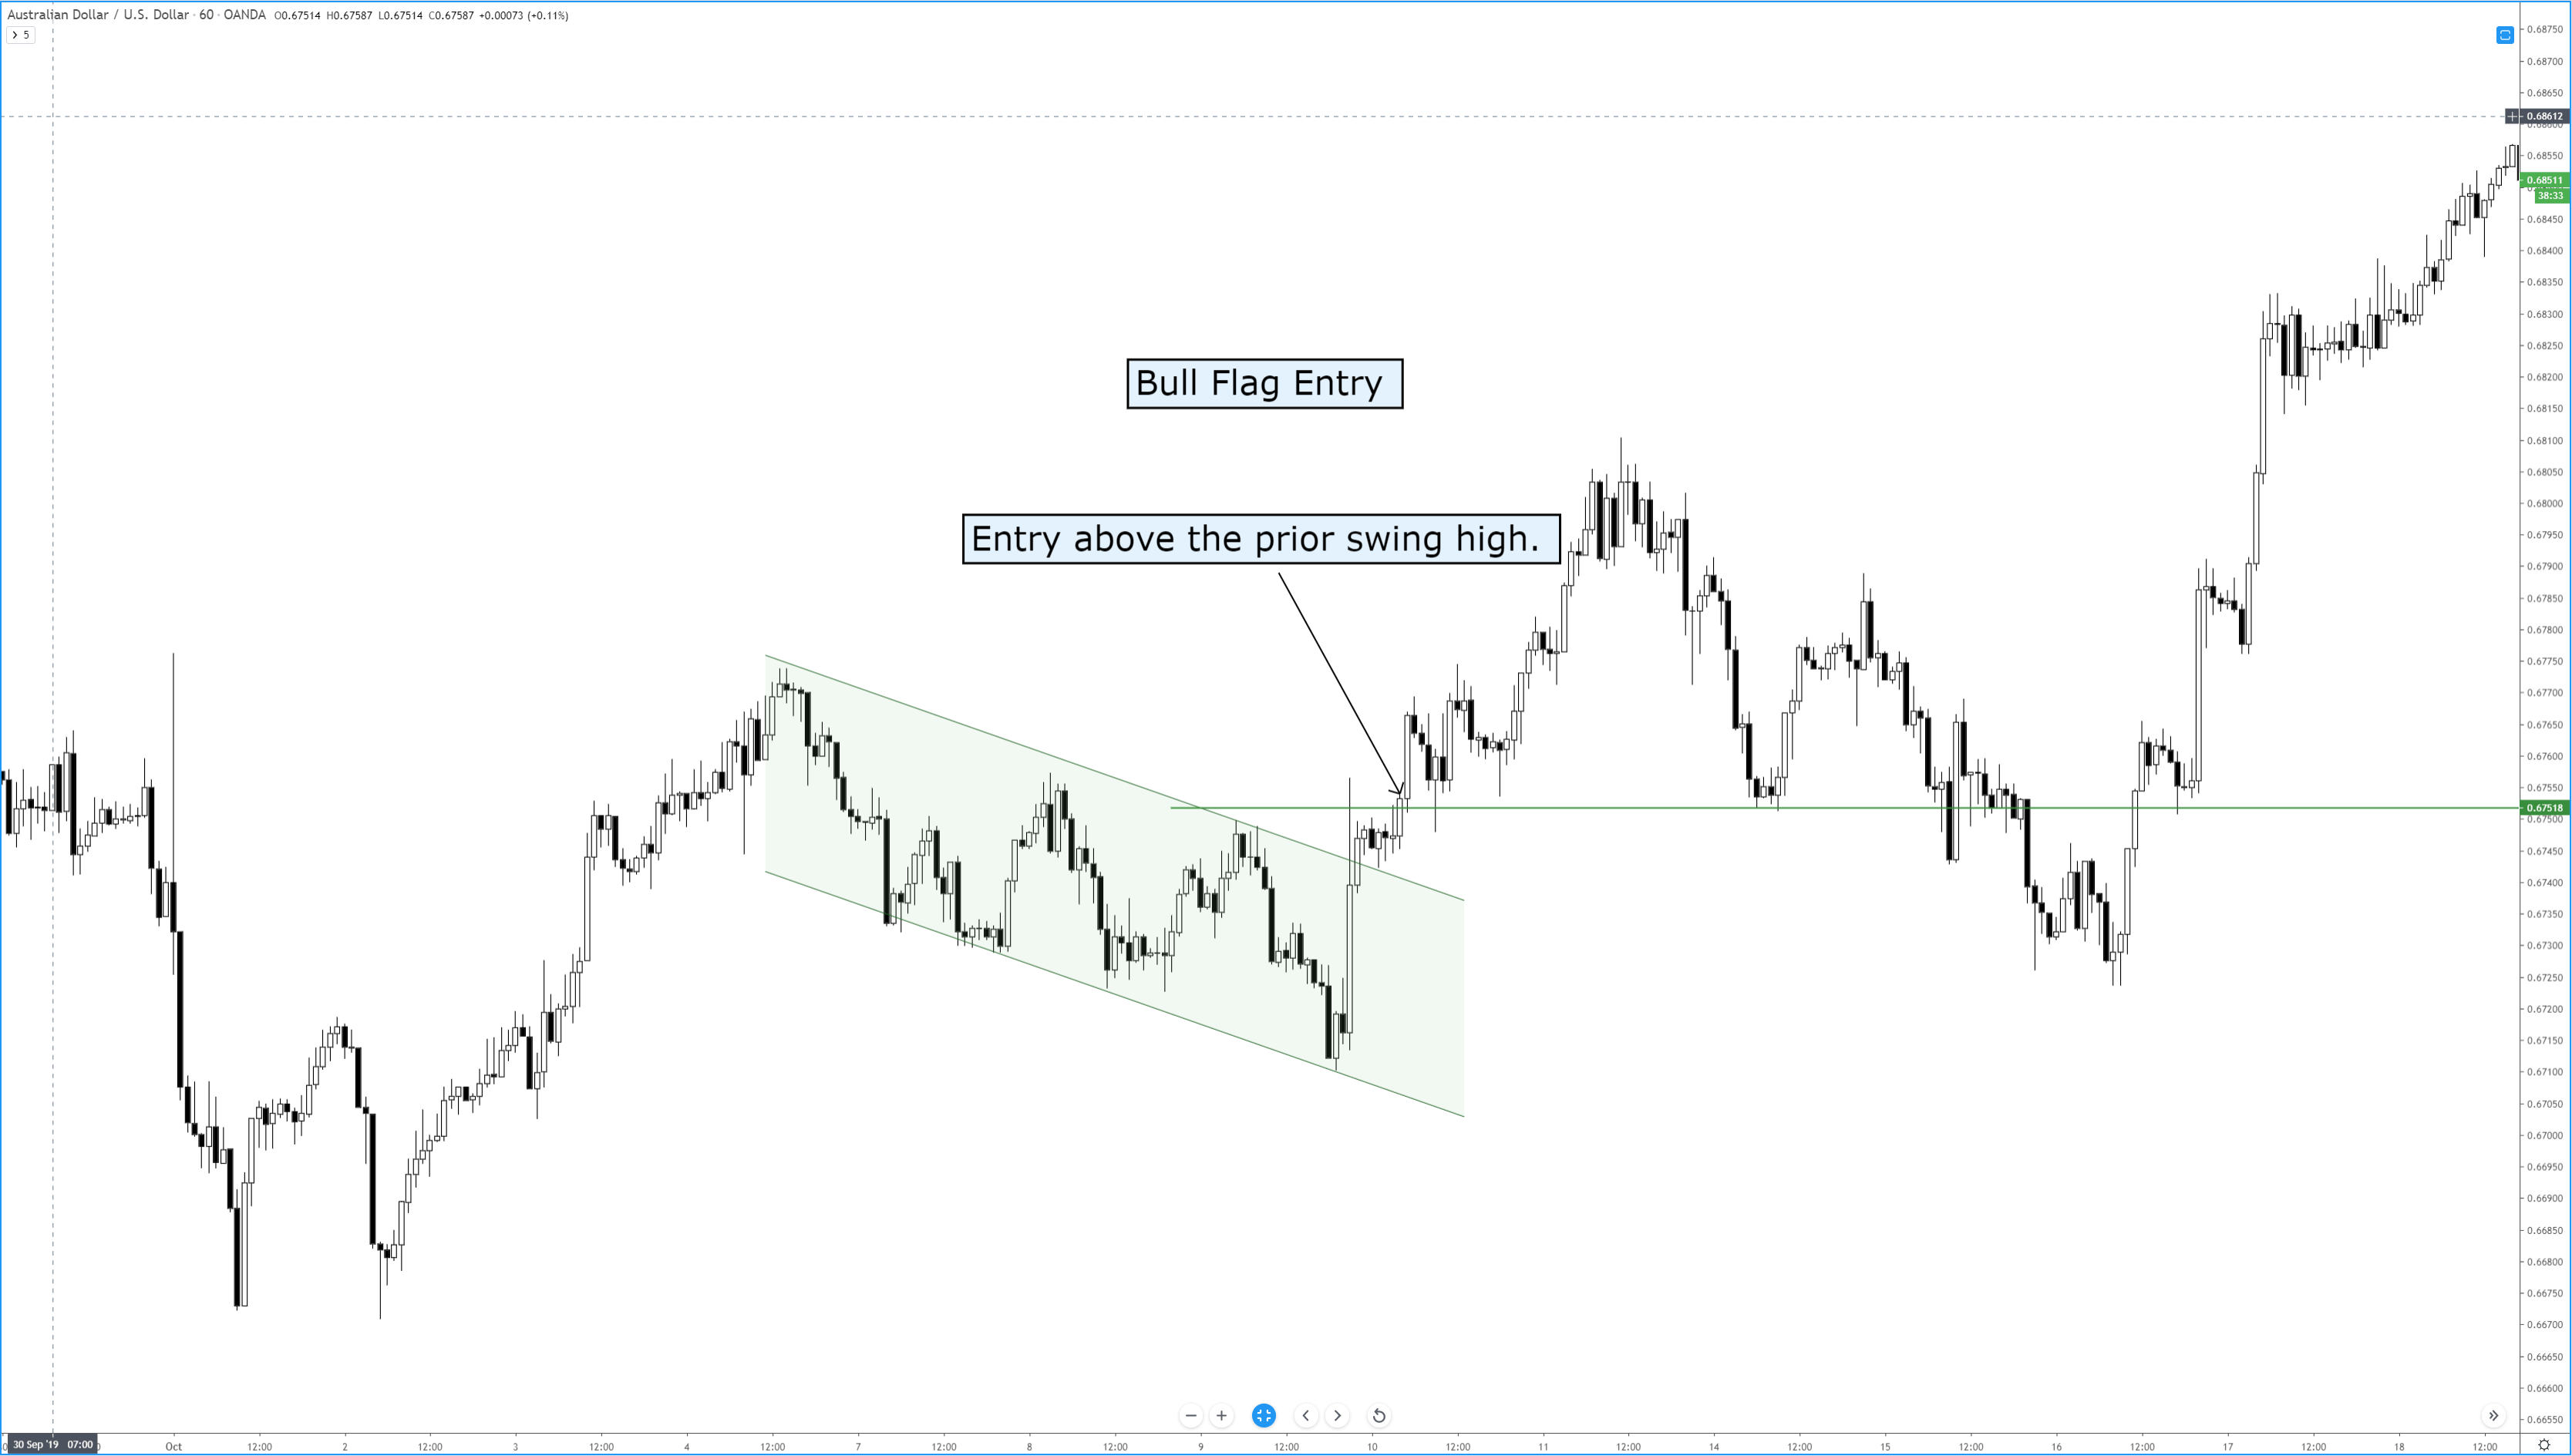
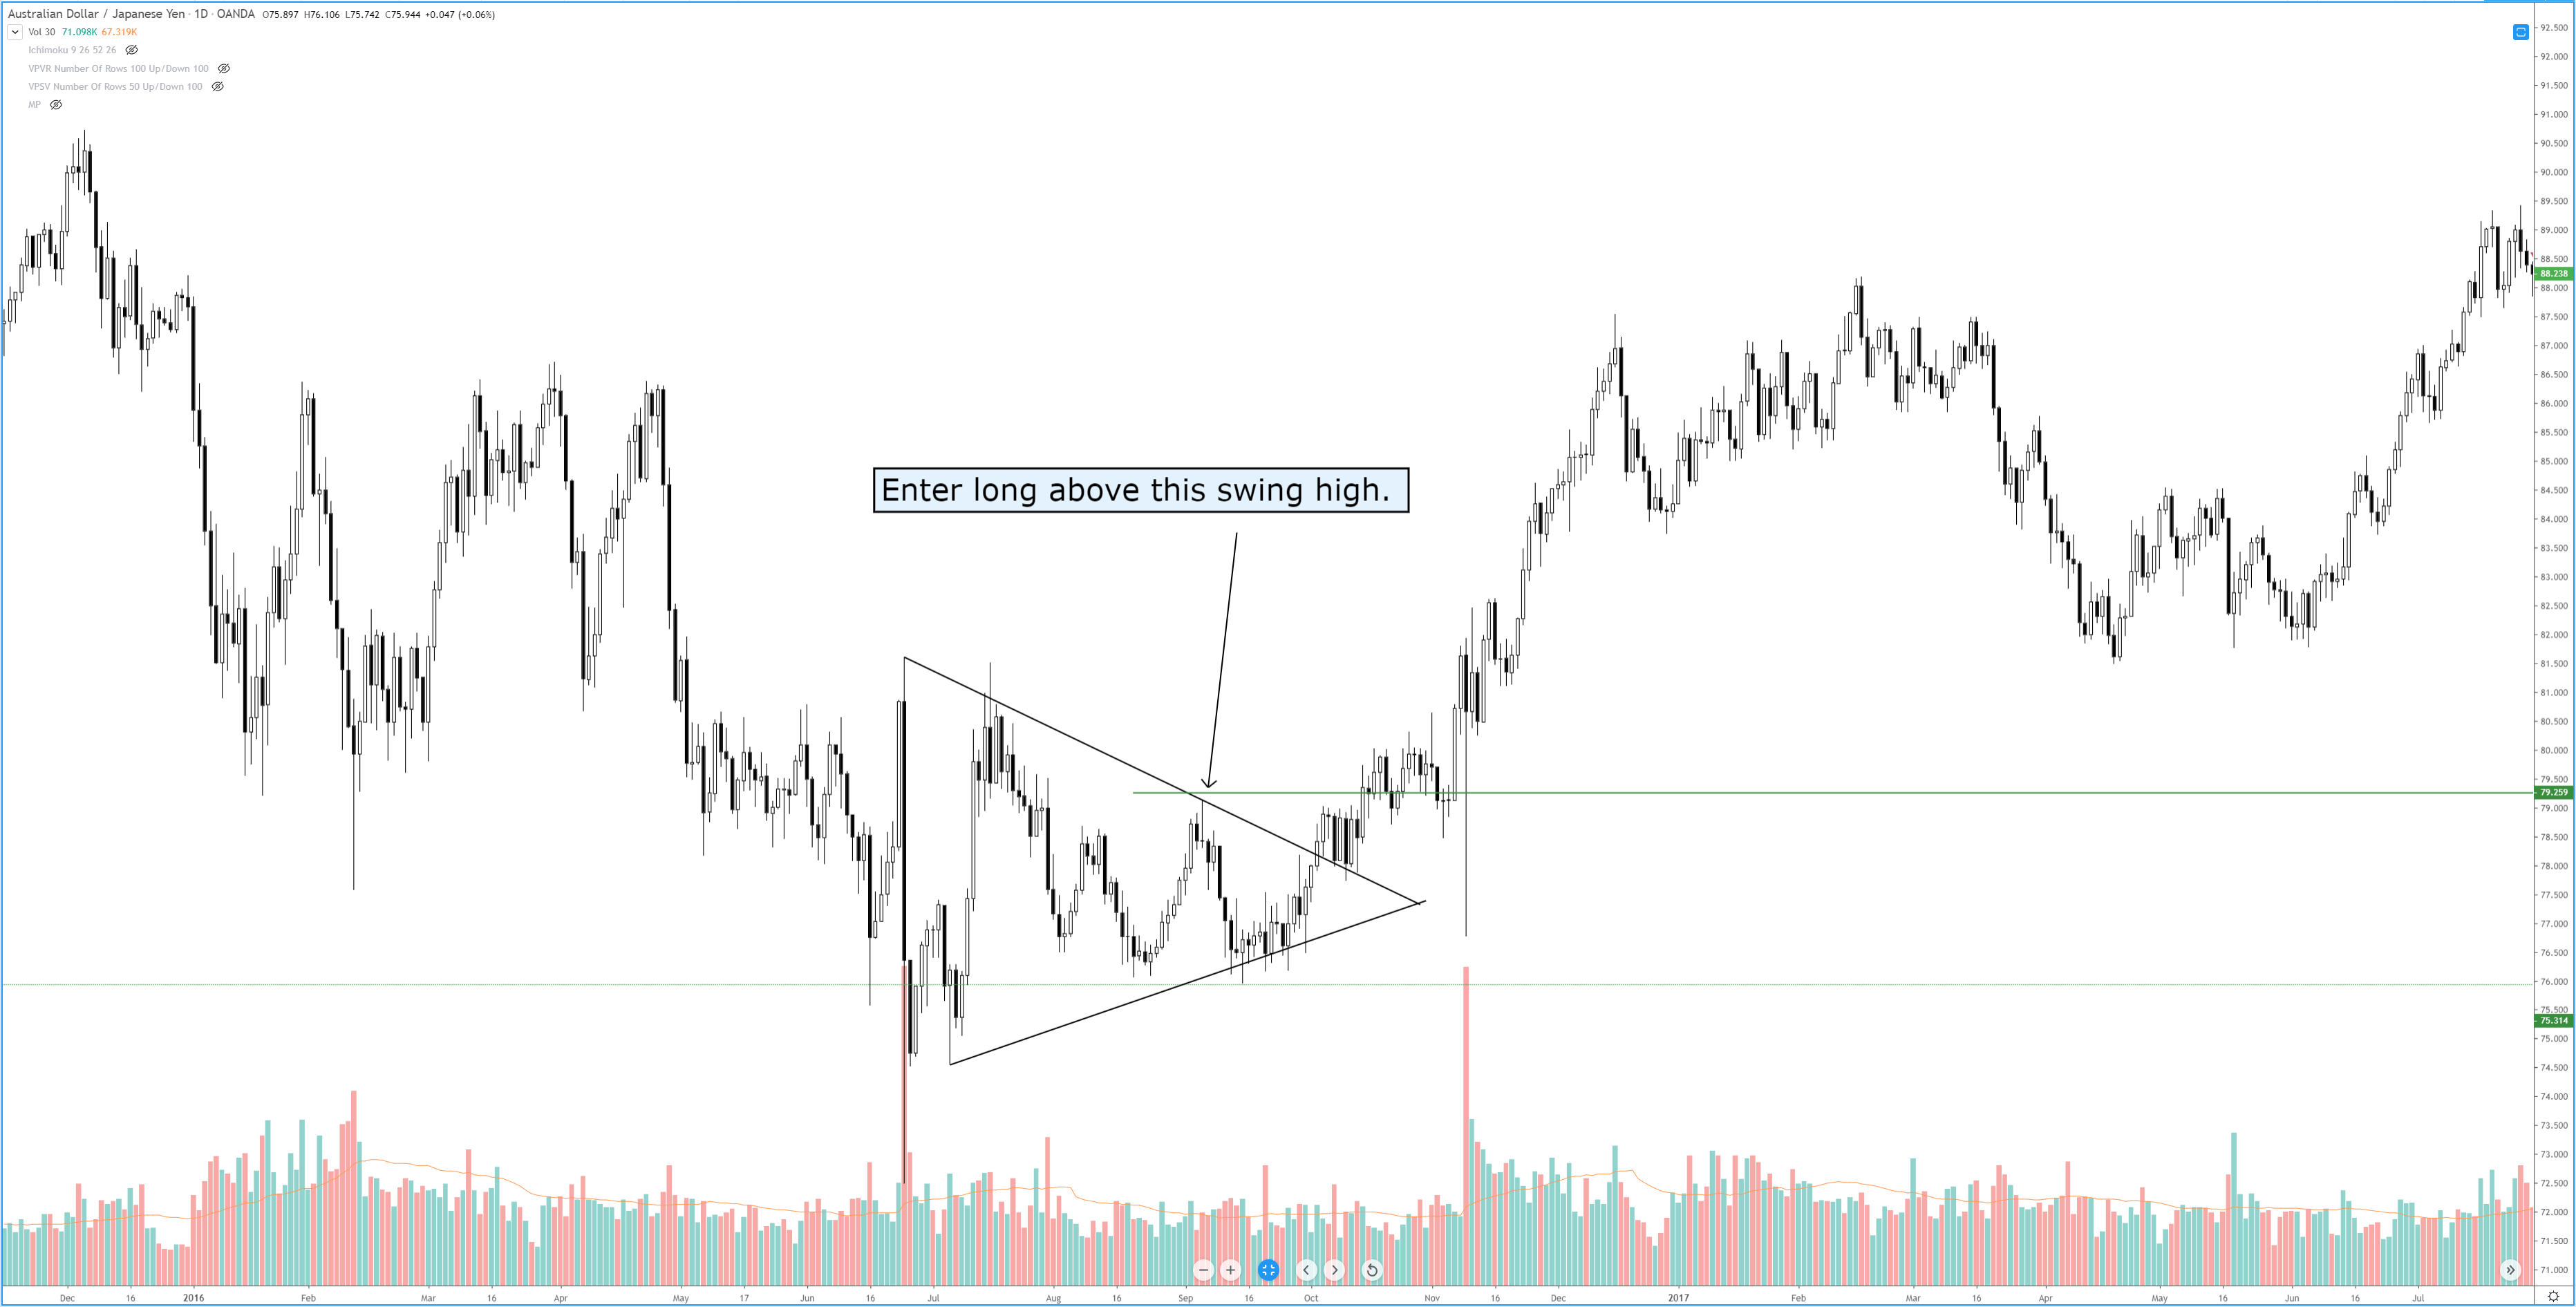
Very similar to the support and resistance breakout, this type of breakout has an additional filter. The filter is nothing but to trade the setups that offer the best outcome. In a swing high and swing low breakout, we enter the market after the price crosses a long-time high (1hr or 4hr high). That high should be followed by a strong sell-off. Conversely, the same is true for a swing low.  A trader must backtest their strategy before applying them to the live markets.

Best Breakout Strategy

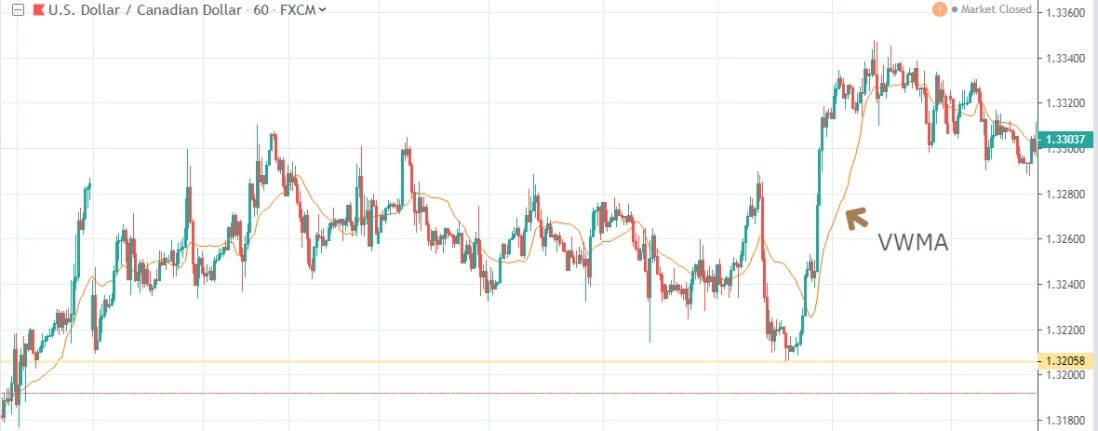
To increase the accuracy of the signals generated by this strategy, we use an indicator known as Volume Weighted Moving Average (VWMA). It is a very simple technical indicator that is used for volume analysis. It resembles a moving average but is based on volume. It gives extra information than just the price of an asset. This indicator can be found on most of the trading platforms by default, and when plotted, it looks something like this.

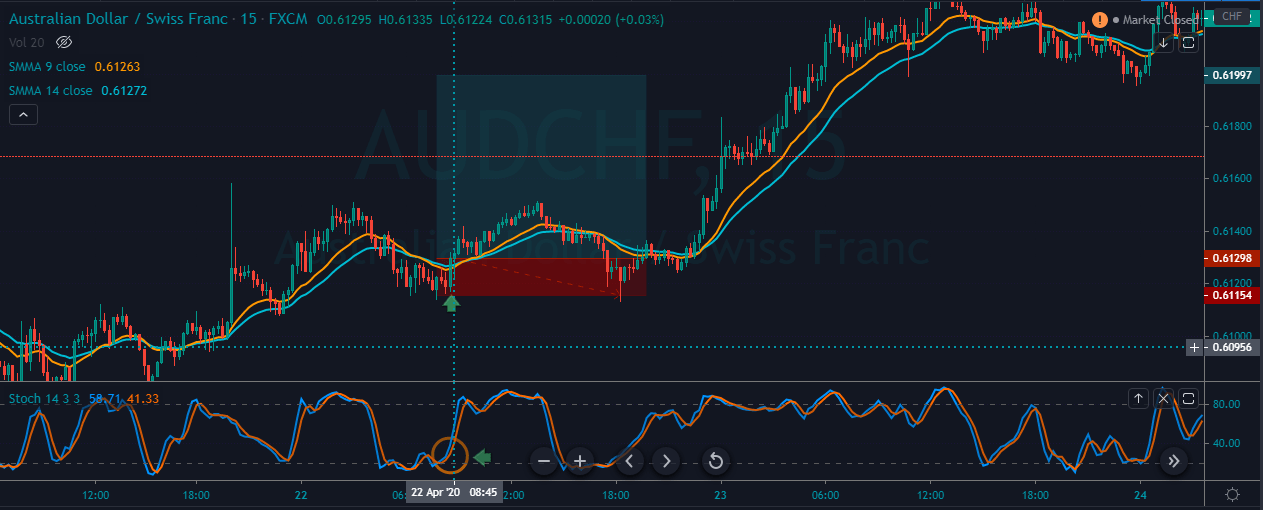
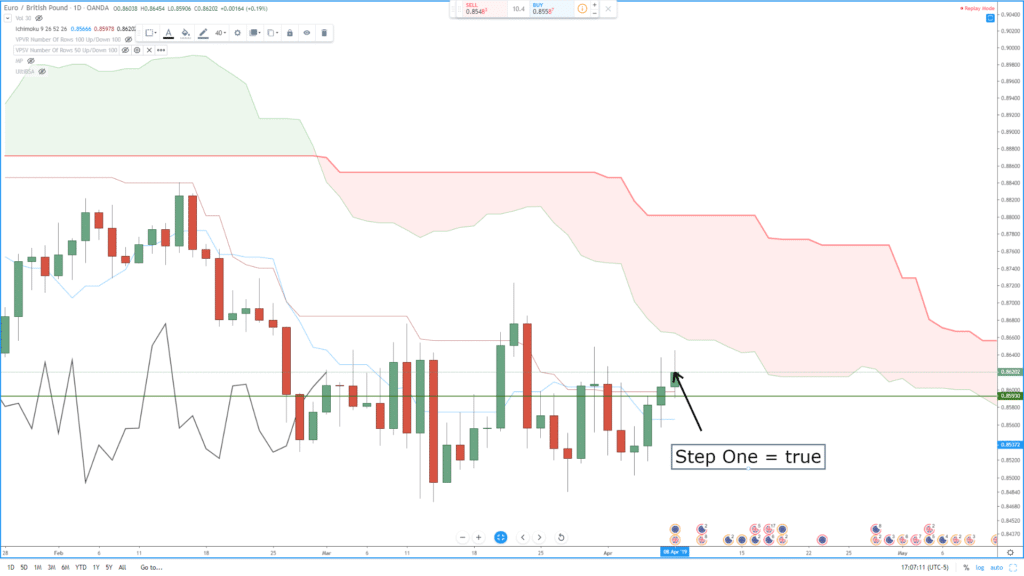
Step 1: Identify the swing highs from where the market sold off very strongly and traveled a fair amount of distance. Mark that price on the chart.

The first step of a breakout strategy is to identify those levels and mark them as breakout trading levels. This step is important because we should pay attention to only significant and clear levels.

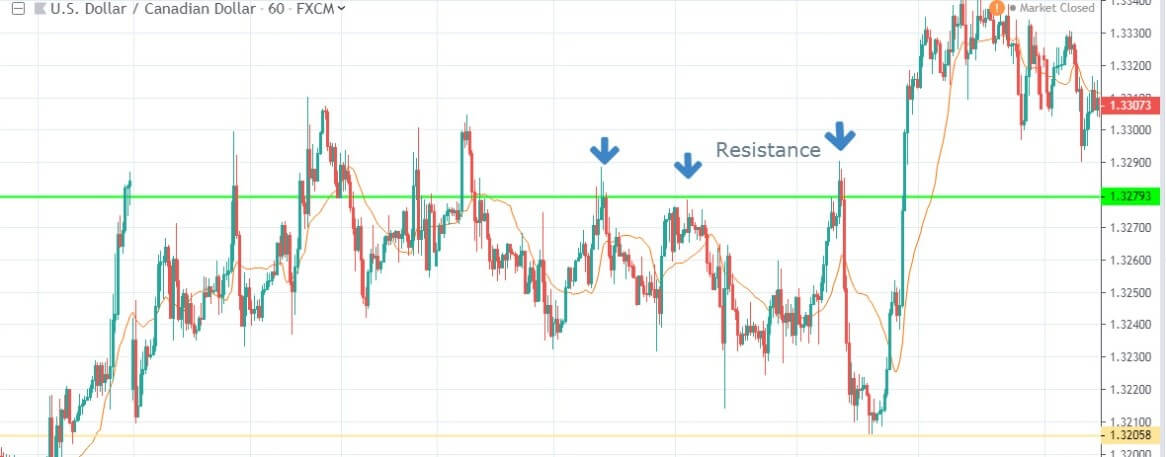
The resistance level we have identified in the above figure is a significant level. If you look closely, you will see rejection off the resistance level took the price down three times. Whenever there was a rally, the swing high stopped the price.

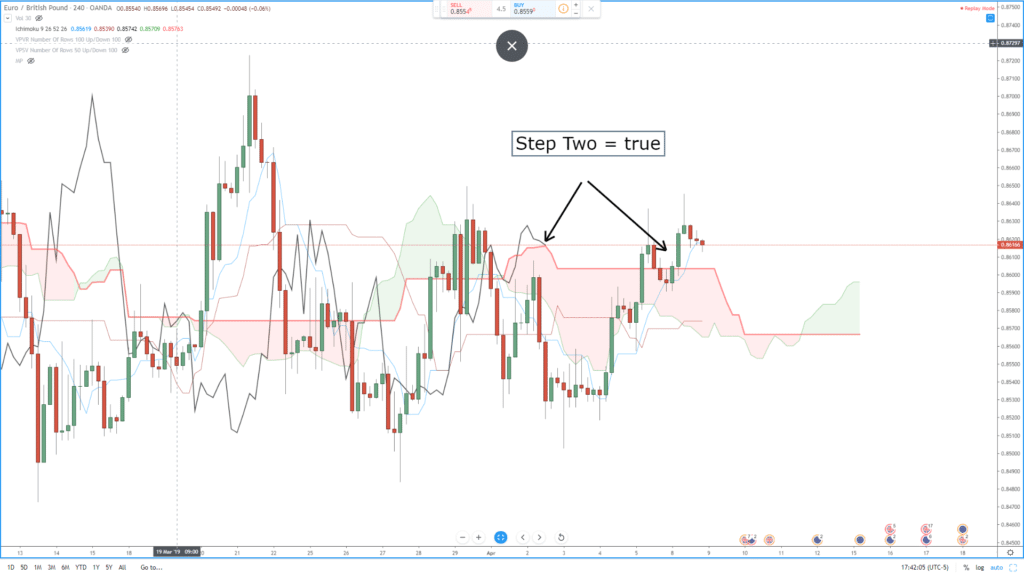
Step 2: Wait for a break and close above the resistance level

Once we have identified the swing highs, it’s just a game of patience and waiting. Next, we need a breakout candle to close above our resistance level. This is a sign that bulls are in full power.

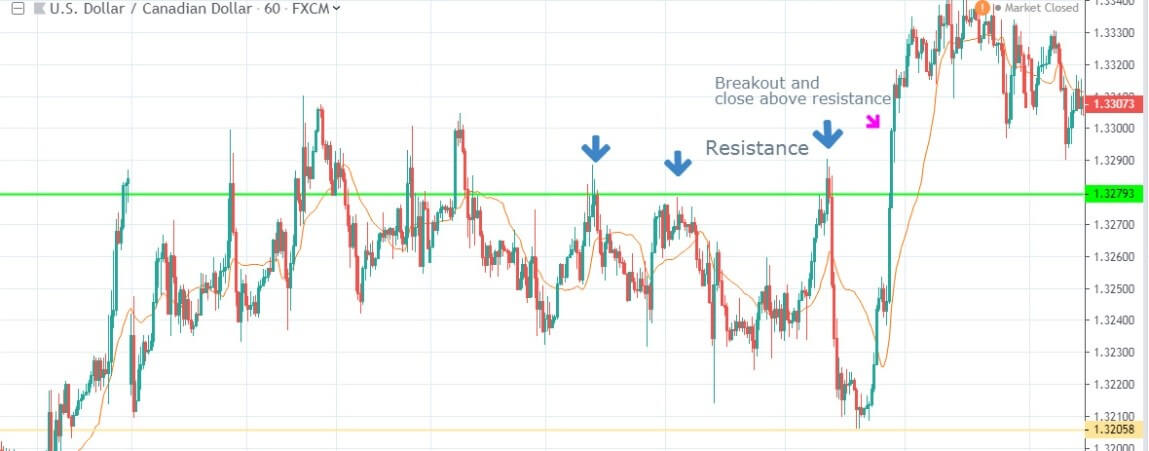
It is not the end yet. We need confirmation from the VWMA indicator. This will give us the green signal to enter the trade in this breakout.

Step 3: Buy when the price closes above the VWMA

The final step of the breakout strategy is confirmation from the VWMA indicator. You should buy only if the VWMA is stretching above the close of the breakout candle. Visually, the VWMA should look stretched up. It is better if the moving average inclination is towards the upside.

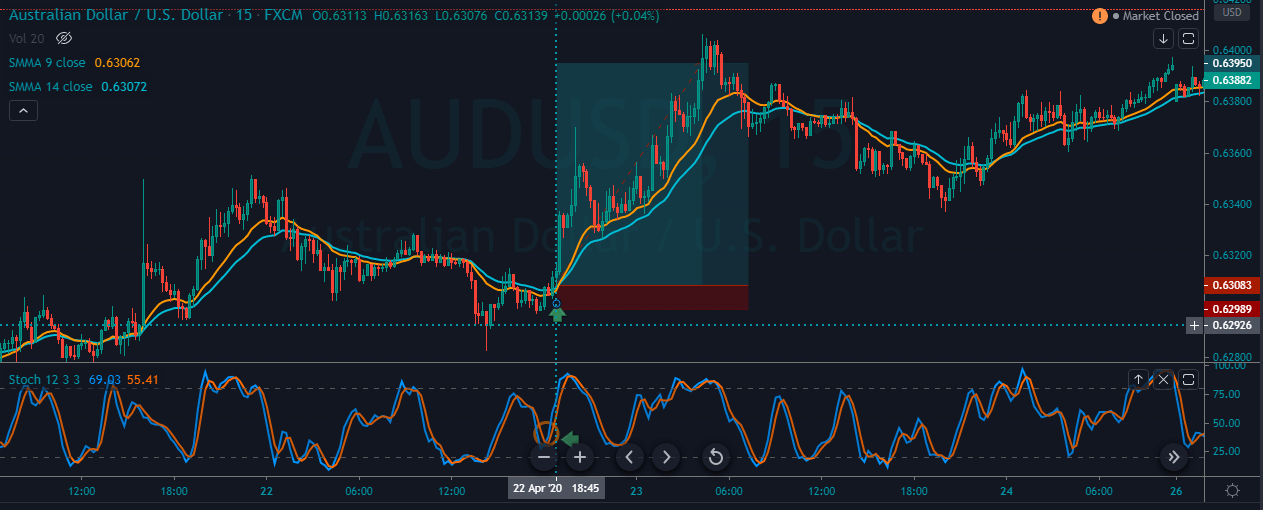
Let’s understand this more clearly with the help of a chart.

In the above chart, prior to the breakout, the VWMA moved gradually higher, and after the breakout happened, the VWMA moved aggressively higher. This shows a strong presence of volume behind the breakout.

We haven’t still talked about placing our stop loss, which is crucial to reduce your losses in a trade. We also need to know where to book profits. This brings us to the final step of the strategy.

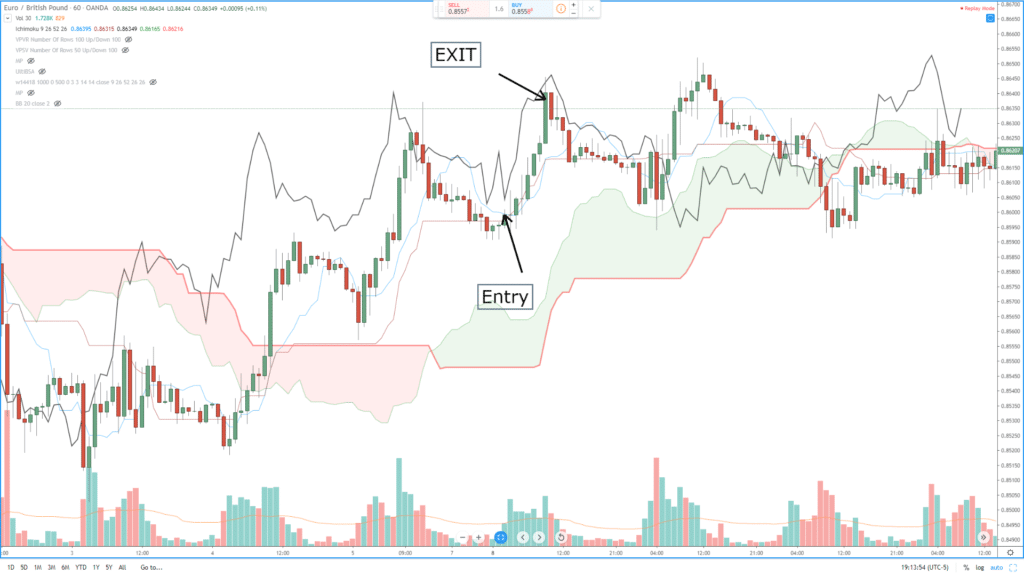
Step 4: Put stop loss below the breakout candle and take profit when you see a break below the VWMA

It is obvious to place the protective stop loss below the breakout candle. Because, if the price breaks below the candle that initiated the breakout, it will quickly tell that it was a false breakout.

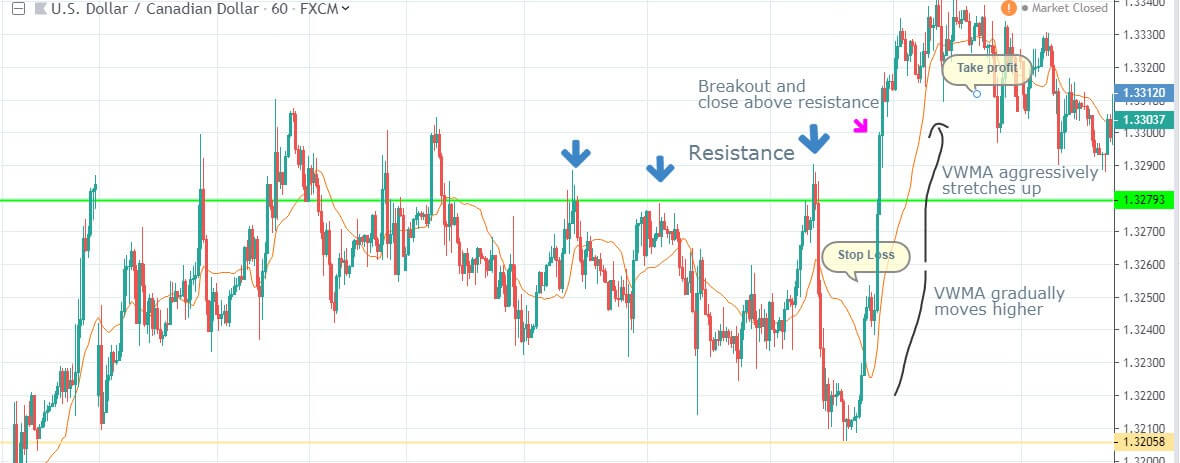
Our take profit technique is automatic because a break below the VWMA suggests no more buyers are willing to participate in the current rally. We want to book profit at the early sign of market rollover.

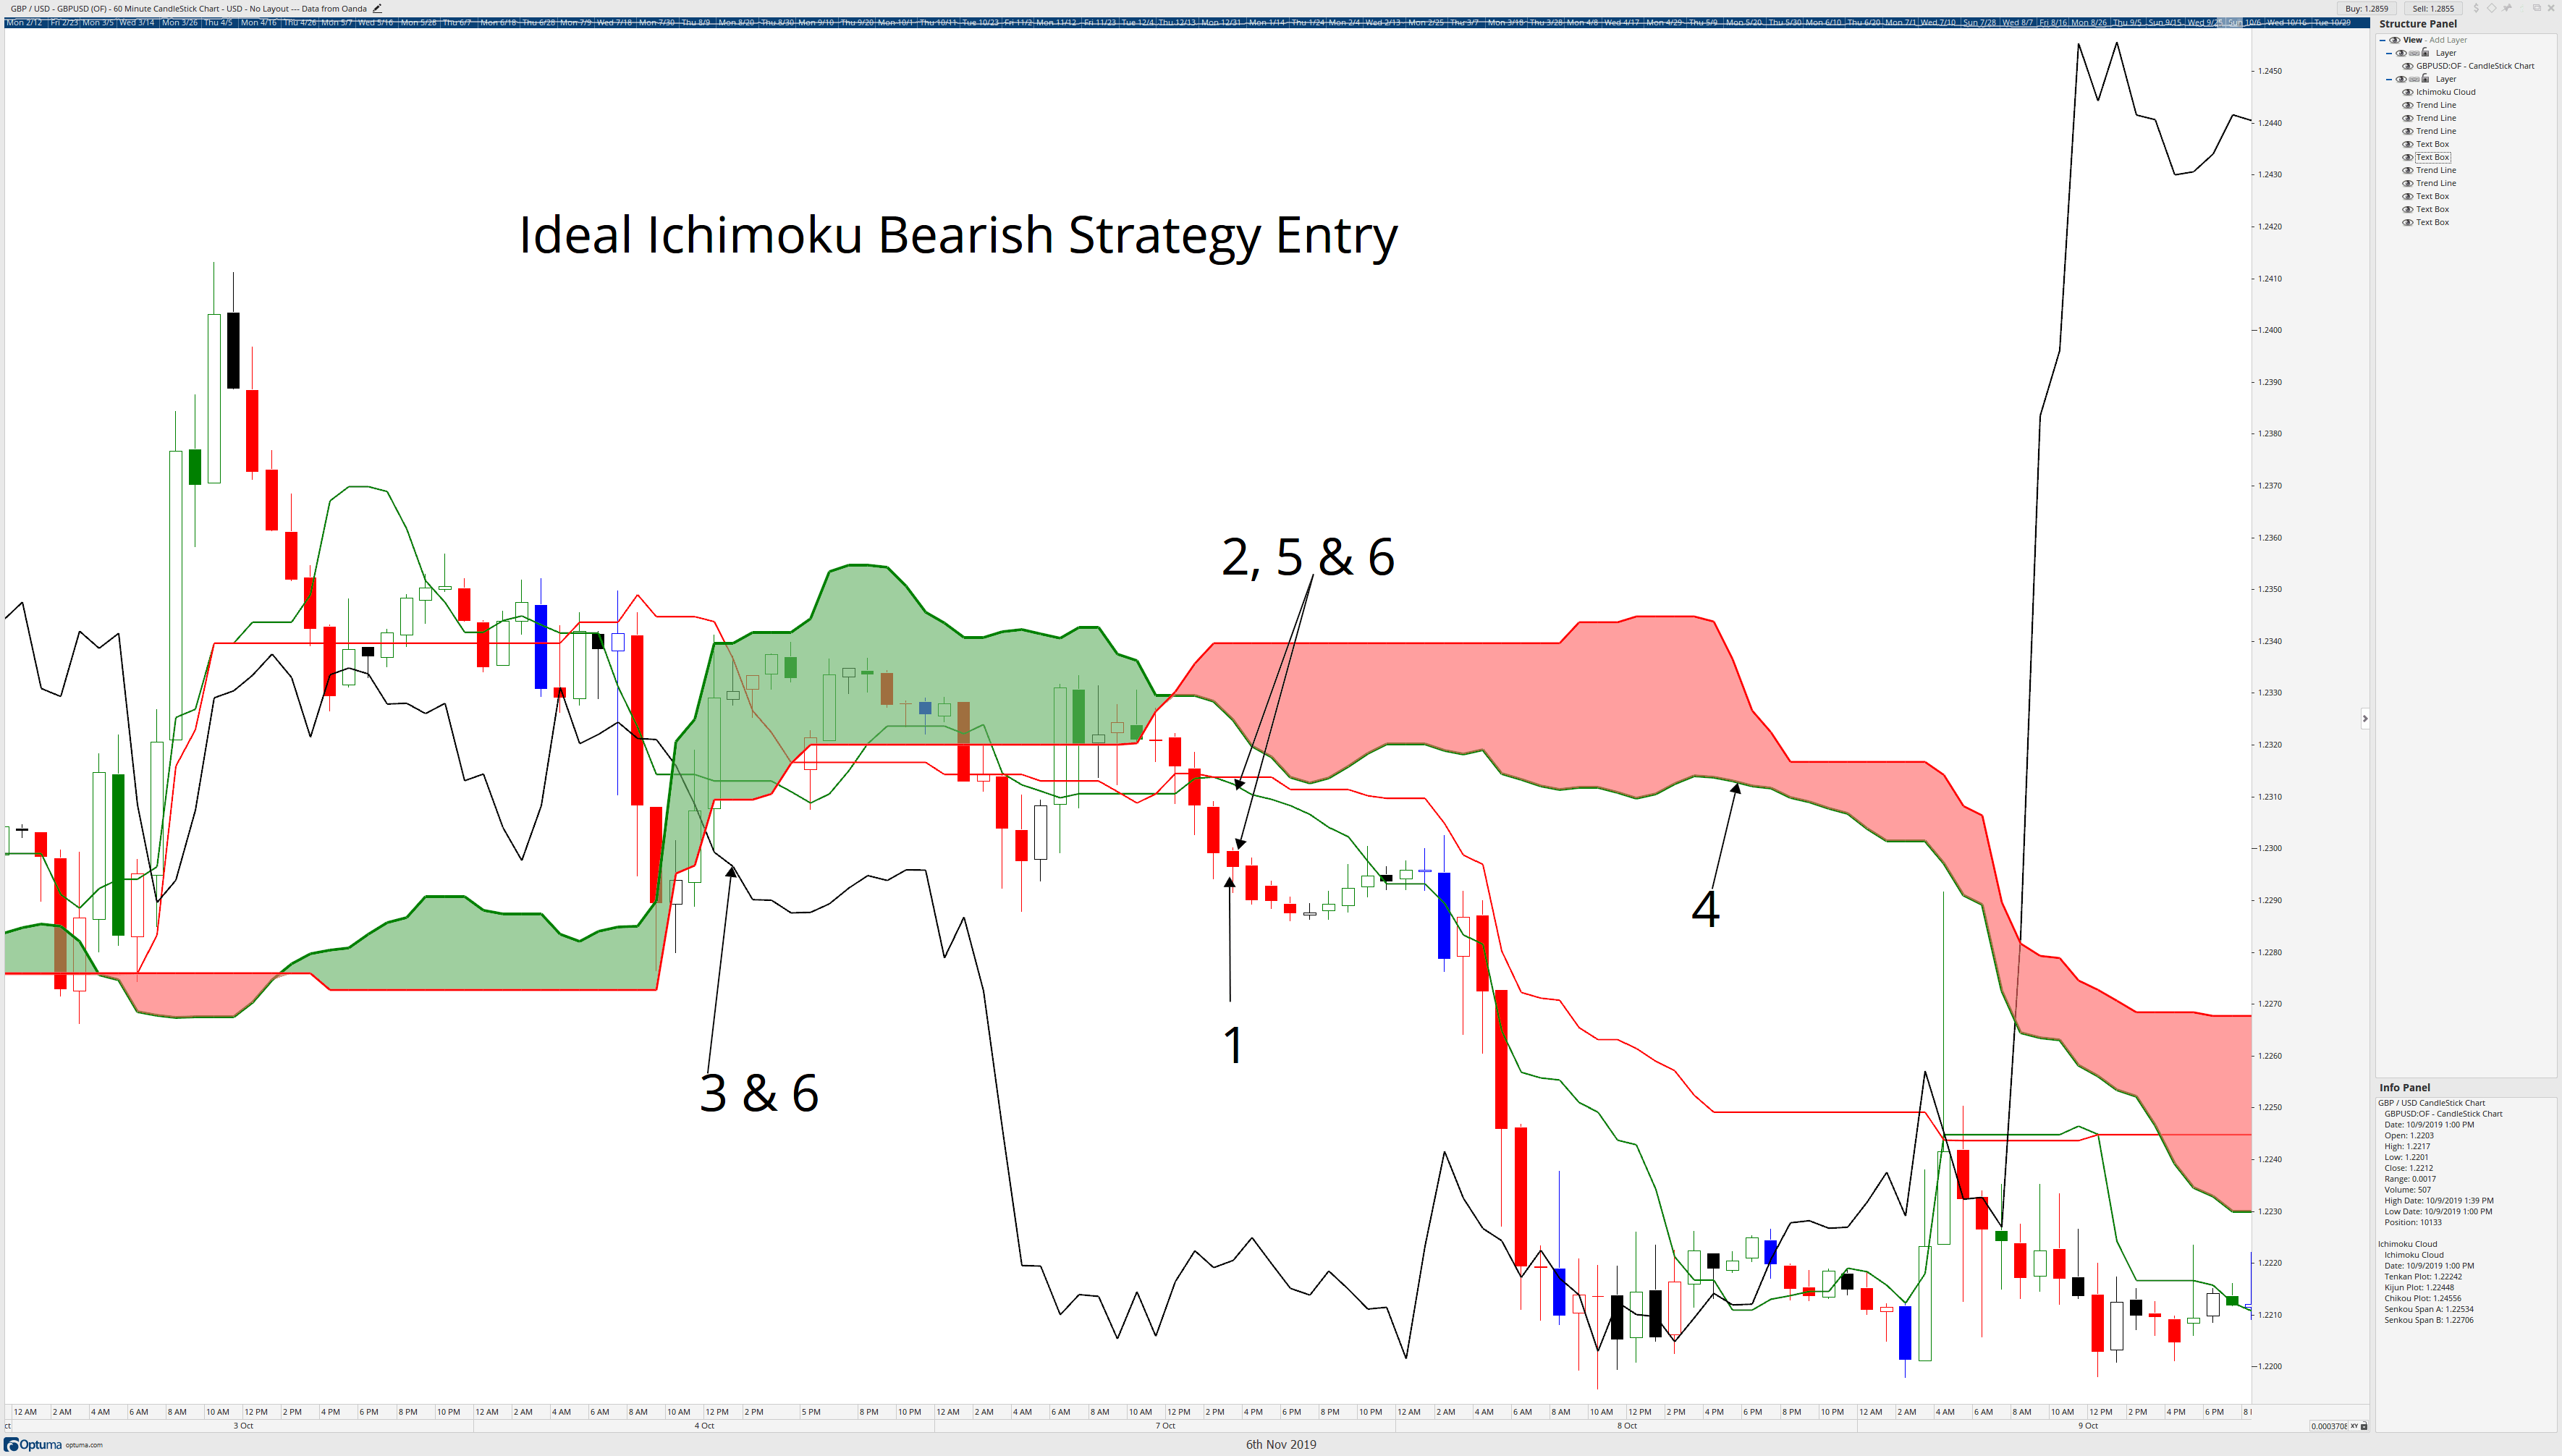
We have taken the example of a buy trade. The same rules apply for a sell trade but in reverse. The best breakout strategy can be used in all market trends, whether up or down.

Bottom line

One of the advantages of our breakout trading strategy is that you’re trading with the momentum of the price. A final tip for all the traders while using this strategy is that, if the breakout happens after a big news event, then it is likely that big institution money is behind this breakout. When both fundamentals and technicals are working for you, the probability of success increases. We hope you find this strategy useful. If you have any questions, please let us know in the comments below. Cheers!

Categories
Forex Course

4 – Understanding The Mechanism In Buying And Selling Of Currency Pairs

Introduction

The mechanism of the forex market is quite different when compared with other markets like stocks and commodities. In the stock market, we essentially consider a company’s stock to trade. But in the foreign exchange market, we cannot trade a single currency. Instead, we must trade them in pairs.

In the previous lessons, we understood the meaning of base and quote currencies and also the right way to read the symbols. In this lesson, let’s explain how exactly this buying and selling happens in the Forex market.

The working principle

Before getting into the topic, let us understand a few common terms to grip the concept much better.

Long – It is a basic term in trading, which refers to the ‘buying of security.

Short Selling – This term refers to the ‘borrowing’ of security from the broker and selling it at the current market price. You can assume this to be the right opposite of long. Note that Shorting security and selling security are two different terms.

For example, let’s say you went long on a security, and now you wish to close it. To close it, you will have to ‘sell’ it. Here, you are ‘selling’ and not ‘shorting’ the security.

Now, with this on our back, let us get into the working of buying and selling currency pairs.

Going Long on a Currency Pair

When you go long on a currency pair, you actually buy the base currency, and short sell the quote currency. For example, if you go long 100,000 units on EUR/USD, you are buying 100,000 Euros and short selling 100,000 US Dollars.

Short Selling a Currency Pair

Short selling in the forex market is quite different from that of the stock market. In the forex market, when you short sell a currency pair, you will be selling the base currency and buying the quote currency. Hence, shorting in forex is the same as placing a regular sell order.

However, the main motive remains that the prices must decline from the point you executed the short position to generate a profit. For example, if you short 10,000 units of USD/CAD, you are actually selling 10,000 US Dollars and buying the same number of Canadian Dollars. Hence, here, you’re not borrowing a certain amount of currency to go short.

What next?

With the concept of the long and short sell, let us understand how to make a profit from it.

To profit from a long trade, you need the currency pair prices to increase.

To profit from a short trade, you need the currency pair prices to decline.

This also implies that, in a long trade, an increase in the base currency prices will put you in profit, and in a short trade, a decrease in the base currency prices will give you profits.

Example

Consider the current market price of USD/CHF to be 0.9850. Let’s say you went long on this currency pair. The buy/sell mechanism here is simple – you bought the USD (the base currency) and simultaneously short sold the CHF (the quote currency). Hence, to make a profit from this, you need currency pair prices to increase, which in turn means that you need the value of the base currency (USD) to increase or the value of the CHF to decrease because you’ve bought the USD.

This is how the buying and selling of currency pairs work internally. However, since all of this is managed by the broker, all you need to know is if the prices should rise or fall according to the position you took.

In the next article, we will be discussing the sheer size and liquidity of the Forex market along with the perks involved. For now, check if you can get the below questions right.

[wp_quiz id=”42315″]
Categories
Forex Course

2 – Preface To The Forex Market

Introduction

Forex AKA Foreign exchange is the largest market in the world where all the global currencies are traded. It can also be considered as a place where individuals, companies, and banks convert one currency into another. The entire Forex market is decentralized and is maintained by the banks across the globe. On average, the daily trading volume of the whole Forex market is more than $5 trillion. This explains the sheer size and liquidity of this market. Forex market is an essential part of the global economy and is active 24/5 (From Monday to Friday)

The Purpose

Typically, the exchange of goods and services happens for money, and this money is nothing but currency. The respective country’s governments determine the value of that currency. Hence the value of one country’s currency is never equal to that of another. This is the reason why we need foreign exchange to exchange one country’s currency to others. Forex market is essential for any of the global imports/exports to happen, for any employer who needs to pay salaries to their overseas employees, for a tourist who is traveling abroad, etc.

Forex trading

It refers to the buying and selling of currencies that belong to different countries. In Forex trading, the buying and selling of currencies happen at the same time. That is, if a trader is trading EURUSD pair, he/she is essentially selling the USD he has in order to buy Euros. Traders make a profit when they sell a currency at a higher price than the cost they paid to buy that particular currency. This entire process was complicated even a decade ago. But now, with the advent of technology, anyone can start trading by using a lot of online trading systems.

Currency Pairs

As discussed above, the buying and selling of currencies happen in pairs. There are three types of Forex currency pairs. They are Majors, Minors, and Exotics.

Major currency pairs are those where the USD is involved. These are the most frequently traded pairs in the market, and they make up to ~85% of the Forex transactions that happen in a day.

Examples: EUR/USD, USD/JPY, GBP/USD etc.

Minor currency pairs are those that don’t contain USD. They are also known as cross pairs. Euro, Pound, and Yen are the most popular currencies that make up the minor currency pairs.

Examples: EUR/CHF, AUD/JPY, GBP/CAD etc.

Exotic pairs are the ones where one is a major currency, and the other is a small or emerging currency.

Examples: USD/PLN, GBP/MXN, EUR/CZK etc.

Types of Forex markets

Spot market – The physical exchange of the currency pair takes place at the point of trade, i.e., as soon as the price is fixed between buyer and seller. The transaction is settled on the spot or at least within a short period of time.

Forward market – Here, a contract is made between the buyer and seller, where they agree upon a price to exchange the currency pair. This contract will be settled at a date in the future or within a range of future dates.

Futures market – Even in this type of market, a contract is fixed between the buyer and seller. A price is set on a future date delivery. The difference between Forward and Futures market is that in the latter, the contract is legally bonded between the parties.

That’s about the introduction to the Forex market. We hope you had a good read. In the next article, we will talk about some important Forex terms and phrases. Now, let’s see if you can get the below questions right.

[wp_quiz id=”41271″]