Categories
Forex Course

120. Introduction To Harmonic Patterns

Introduction

In the previous course articles, we have been discussing a lot of concepts related to Technical Analysis. In that journey, we have learned the trading of some of the most significant chart patterns like Head & Shoulders, Triangle, Wedge, etc. The extension to the learning of these concepts is to know the process of identifying and trading of Harmonic Patterns. We want to mention that learning this part is a bit tricky as the concepts are advanced and require a lot of practice to master them. Let’s get into details.

Brief History

The discovery of these Harmonic patterns dates back to the 1930s. H.M.Gartley, an American author and technical analyst, mentioned the trading of these unique patterns in his book ‘Profits In The Stock Market.’ Later these patterns were highly improvised by ‘Larry Pesavento’ by adding Fib ratios to identify and confirm these patterns. Finally, ‘Scott Carney’ discovered more Harmonic patterns and published them in his most famous book ‘Harmonic Trading.’

What Are Harmonic Patterns?

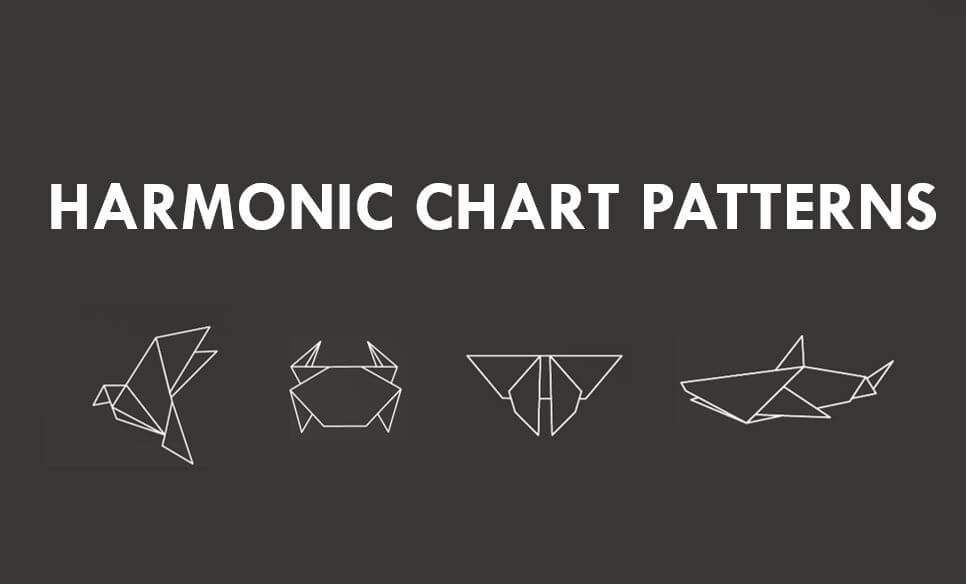
Harmonic Chart Patterns are nothing but the same kind of Forex chart patterns that we have learned in our previous lessons. But the shapes of these patterns look similar to the real-life birds and animals. For instance, one of the very well known harmonic chart patterns is the Butterfly pattern. That is, when this pattern is complete, we will be able to see a butterfly-like structure on the price charts formed by the price action.

All the Harmonic patterns are both bullish and bearish in nature. That is, these patterns can be identified and traded in both up trending & down trending markets. Also, some of the Harmonic patterns indicate that the current market trend is going to continue, and some of them indicate a market reversal. Hence we can consider Harmonics as both trend continuation and reversal patterns.

Why is it important to know them?

The harmonic patterns levels-up the pattern-based trading as it involves an additional technical tool to confirm and trade them. And that tool is none other than the well known Fibonacci levels. The harmonic patterns can only be confirmed by analyzing at what levels the price action turning its directions. Only if these levels are in line with the predefined Fibonacci levels, we can confirm and trade these patterns. The harmonic trading enables traders in predicting the future price movements of an asset more accurately than any other form of trading.

How many Harmonic Patterns are there?

In total, there are nine Harmonic patterns out of which six are used frequently by the traders to trade the Forex market. The ideology behind trading any of these patterns is the same; we must wait for a particular Harmonic pattern to form completely on the price chart and then take long or short positions accordingly. In the upcoming course lessons, we will be discussing the six Harmonic patterns that we have mentioned below.

The other three less used Harmonic patterns are Shark Pattern, Cypher Pattern, and the ABC Pattern. Stay tuned to learn the trading of these patterns in the easiest way possible. Cheers!

Categories
Chart Patterns

Chart Patterns: Flags and Pennants

Flags and Pennants

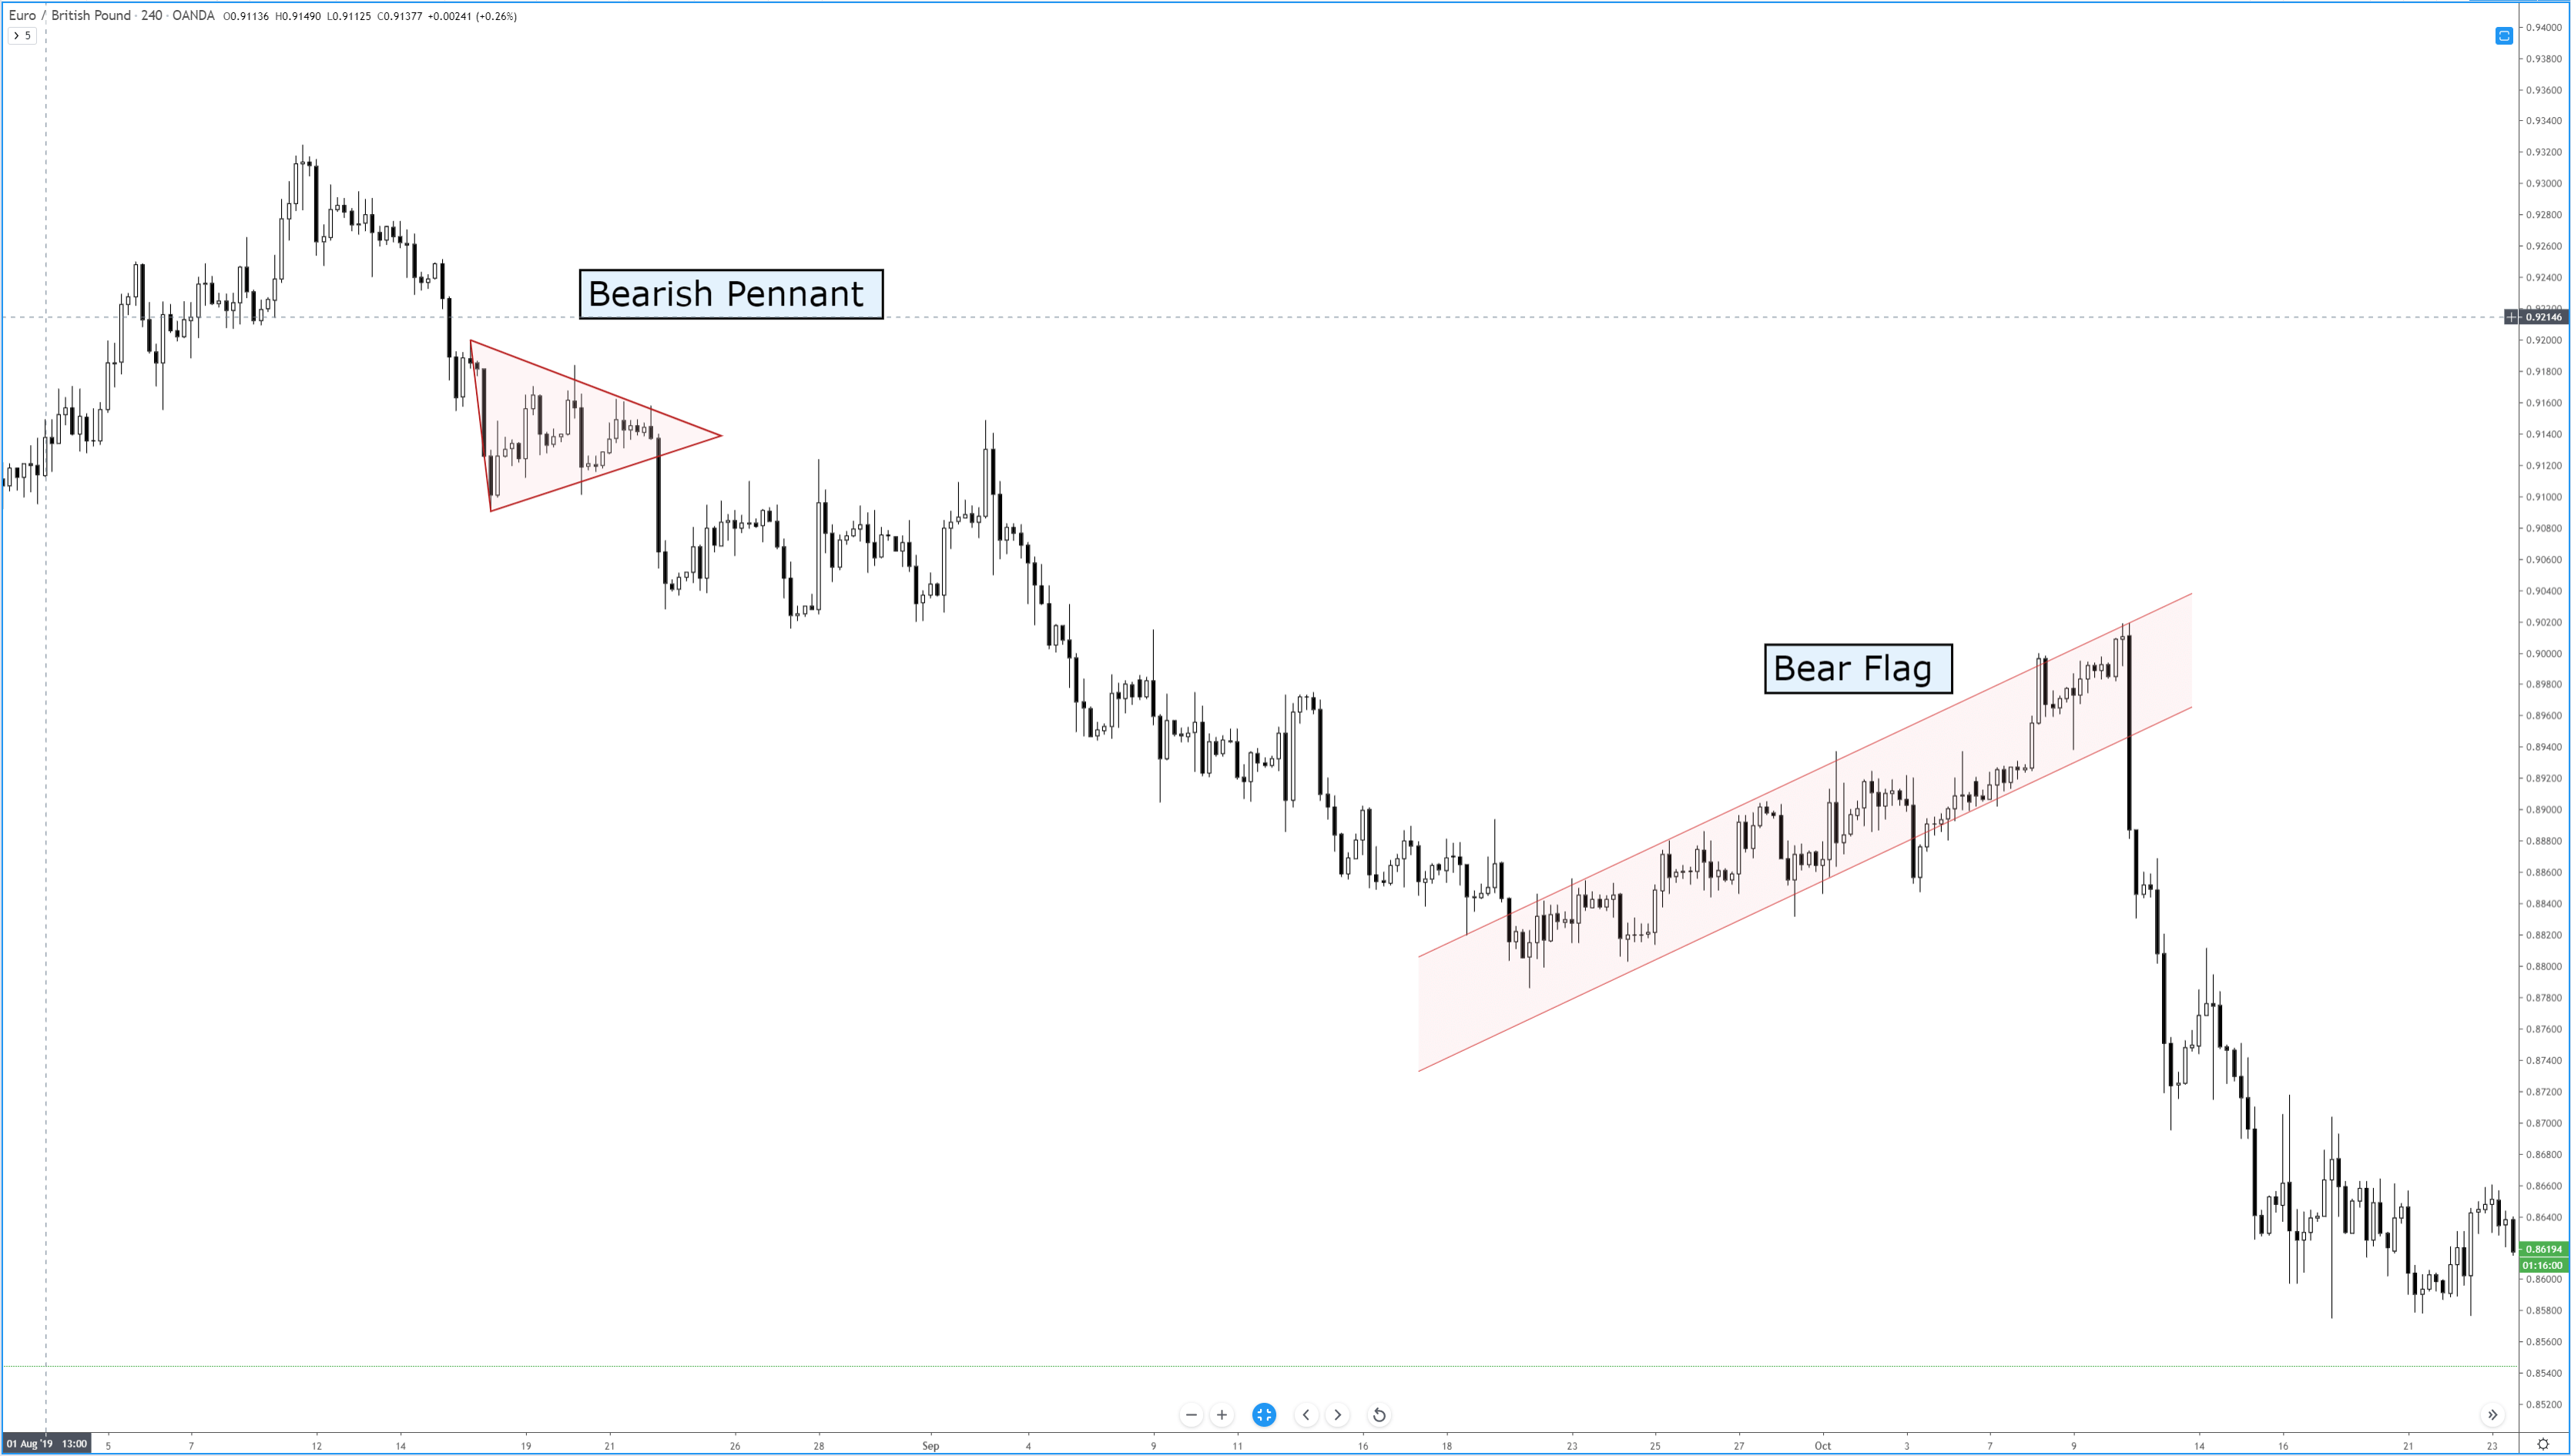
If you’ve ever traded a chart and you’ve seen what looks like a reversal in the trend, but as soon as you enter the trend seems to continue, odds are you were trading against a continuation pattern. Flags and pennants are titles given to patterns that show up as small countertrend moves that ultimately trap participants and then use their momentum to keep the price moving in the direction of the trend. Flags are represented as rectangular channels, and pennants are represented as triangles.

Before a flag or pennant can be identified, we first need a flag pole. A flag pole is any clear trending price action that, well, looks like a pole. See below:

Flags and Pennants
Flags and Pennants


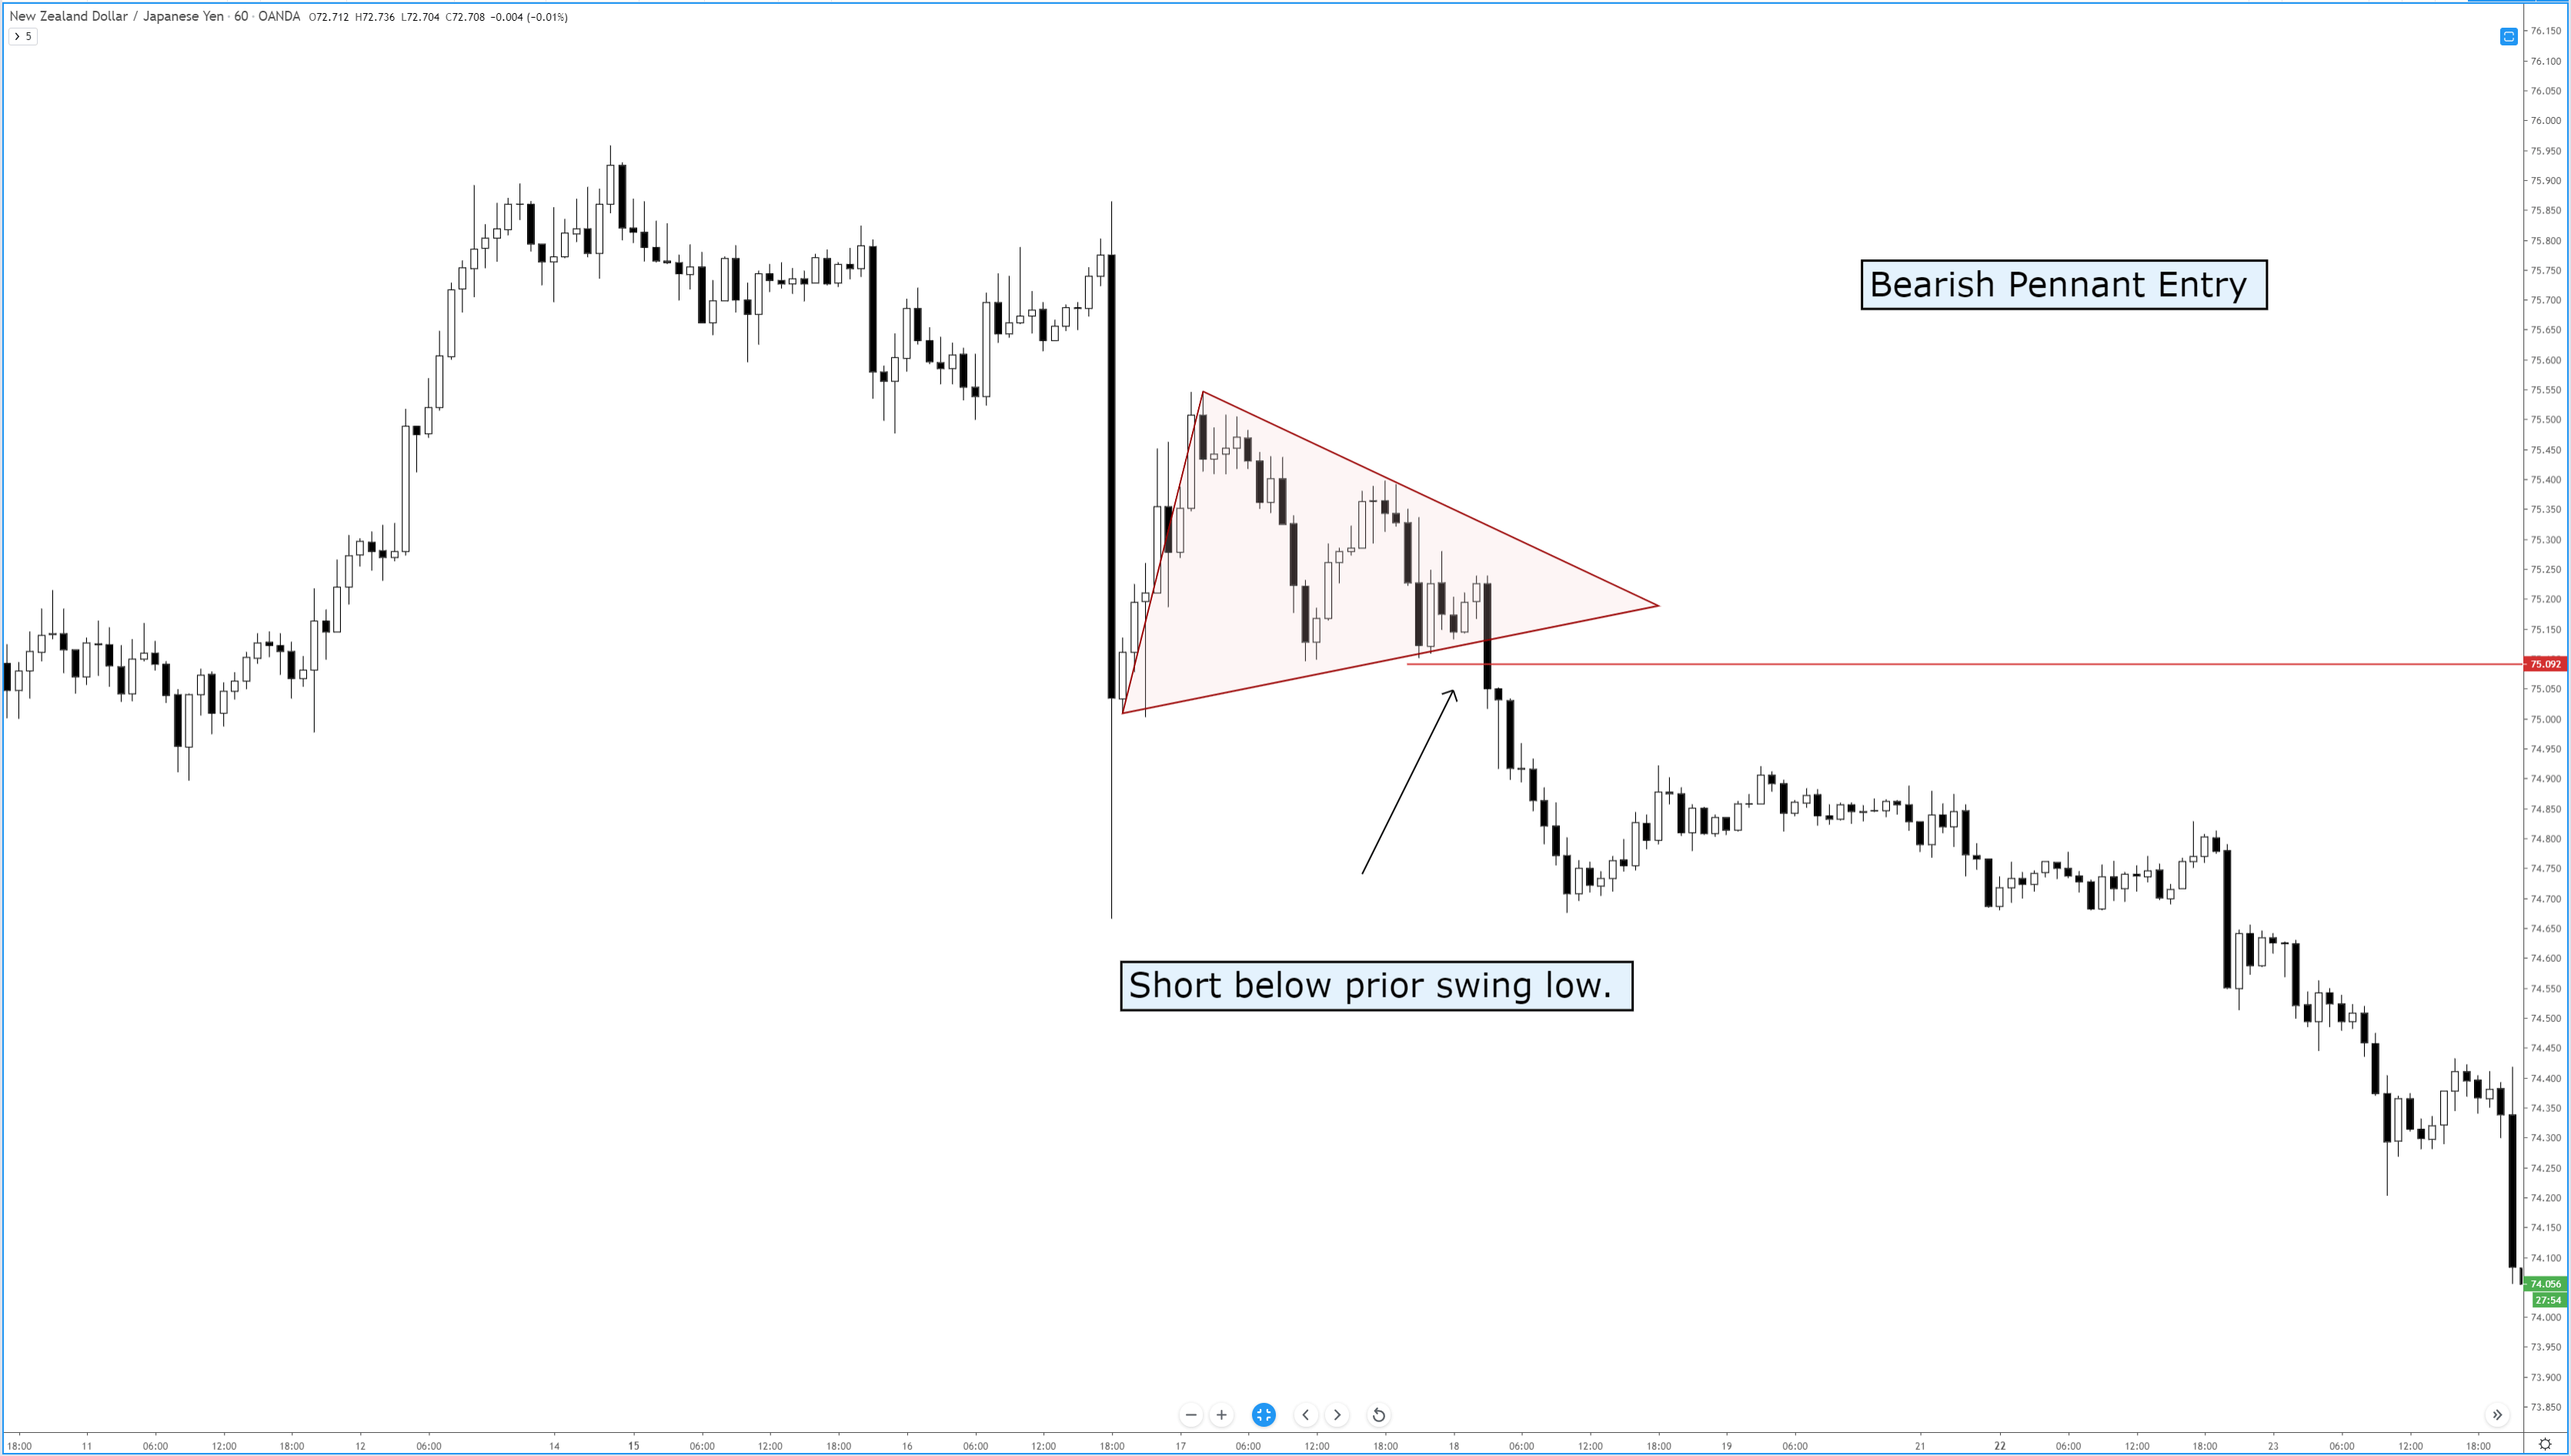
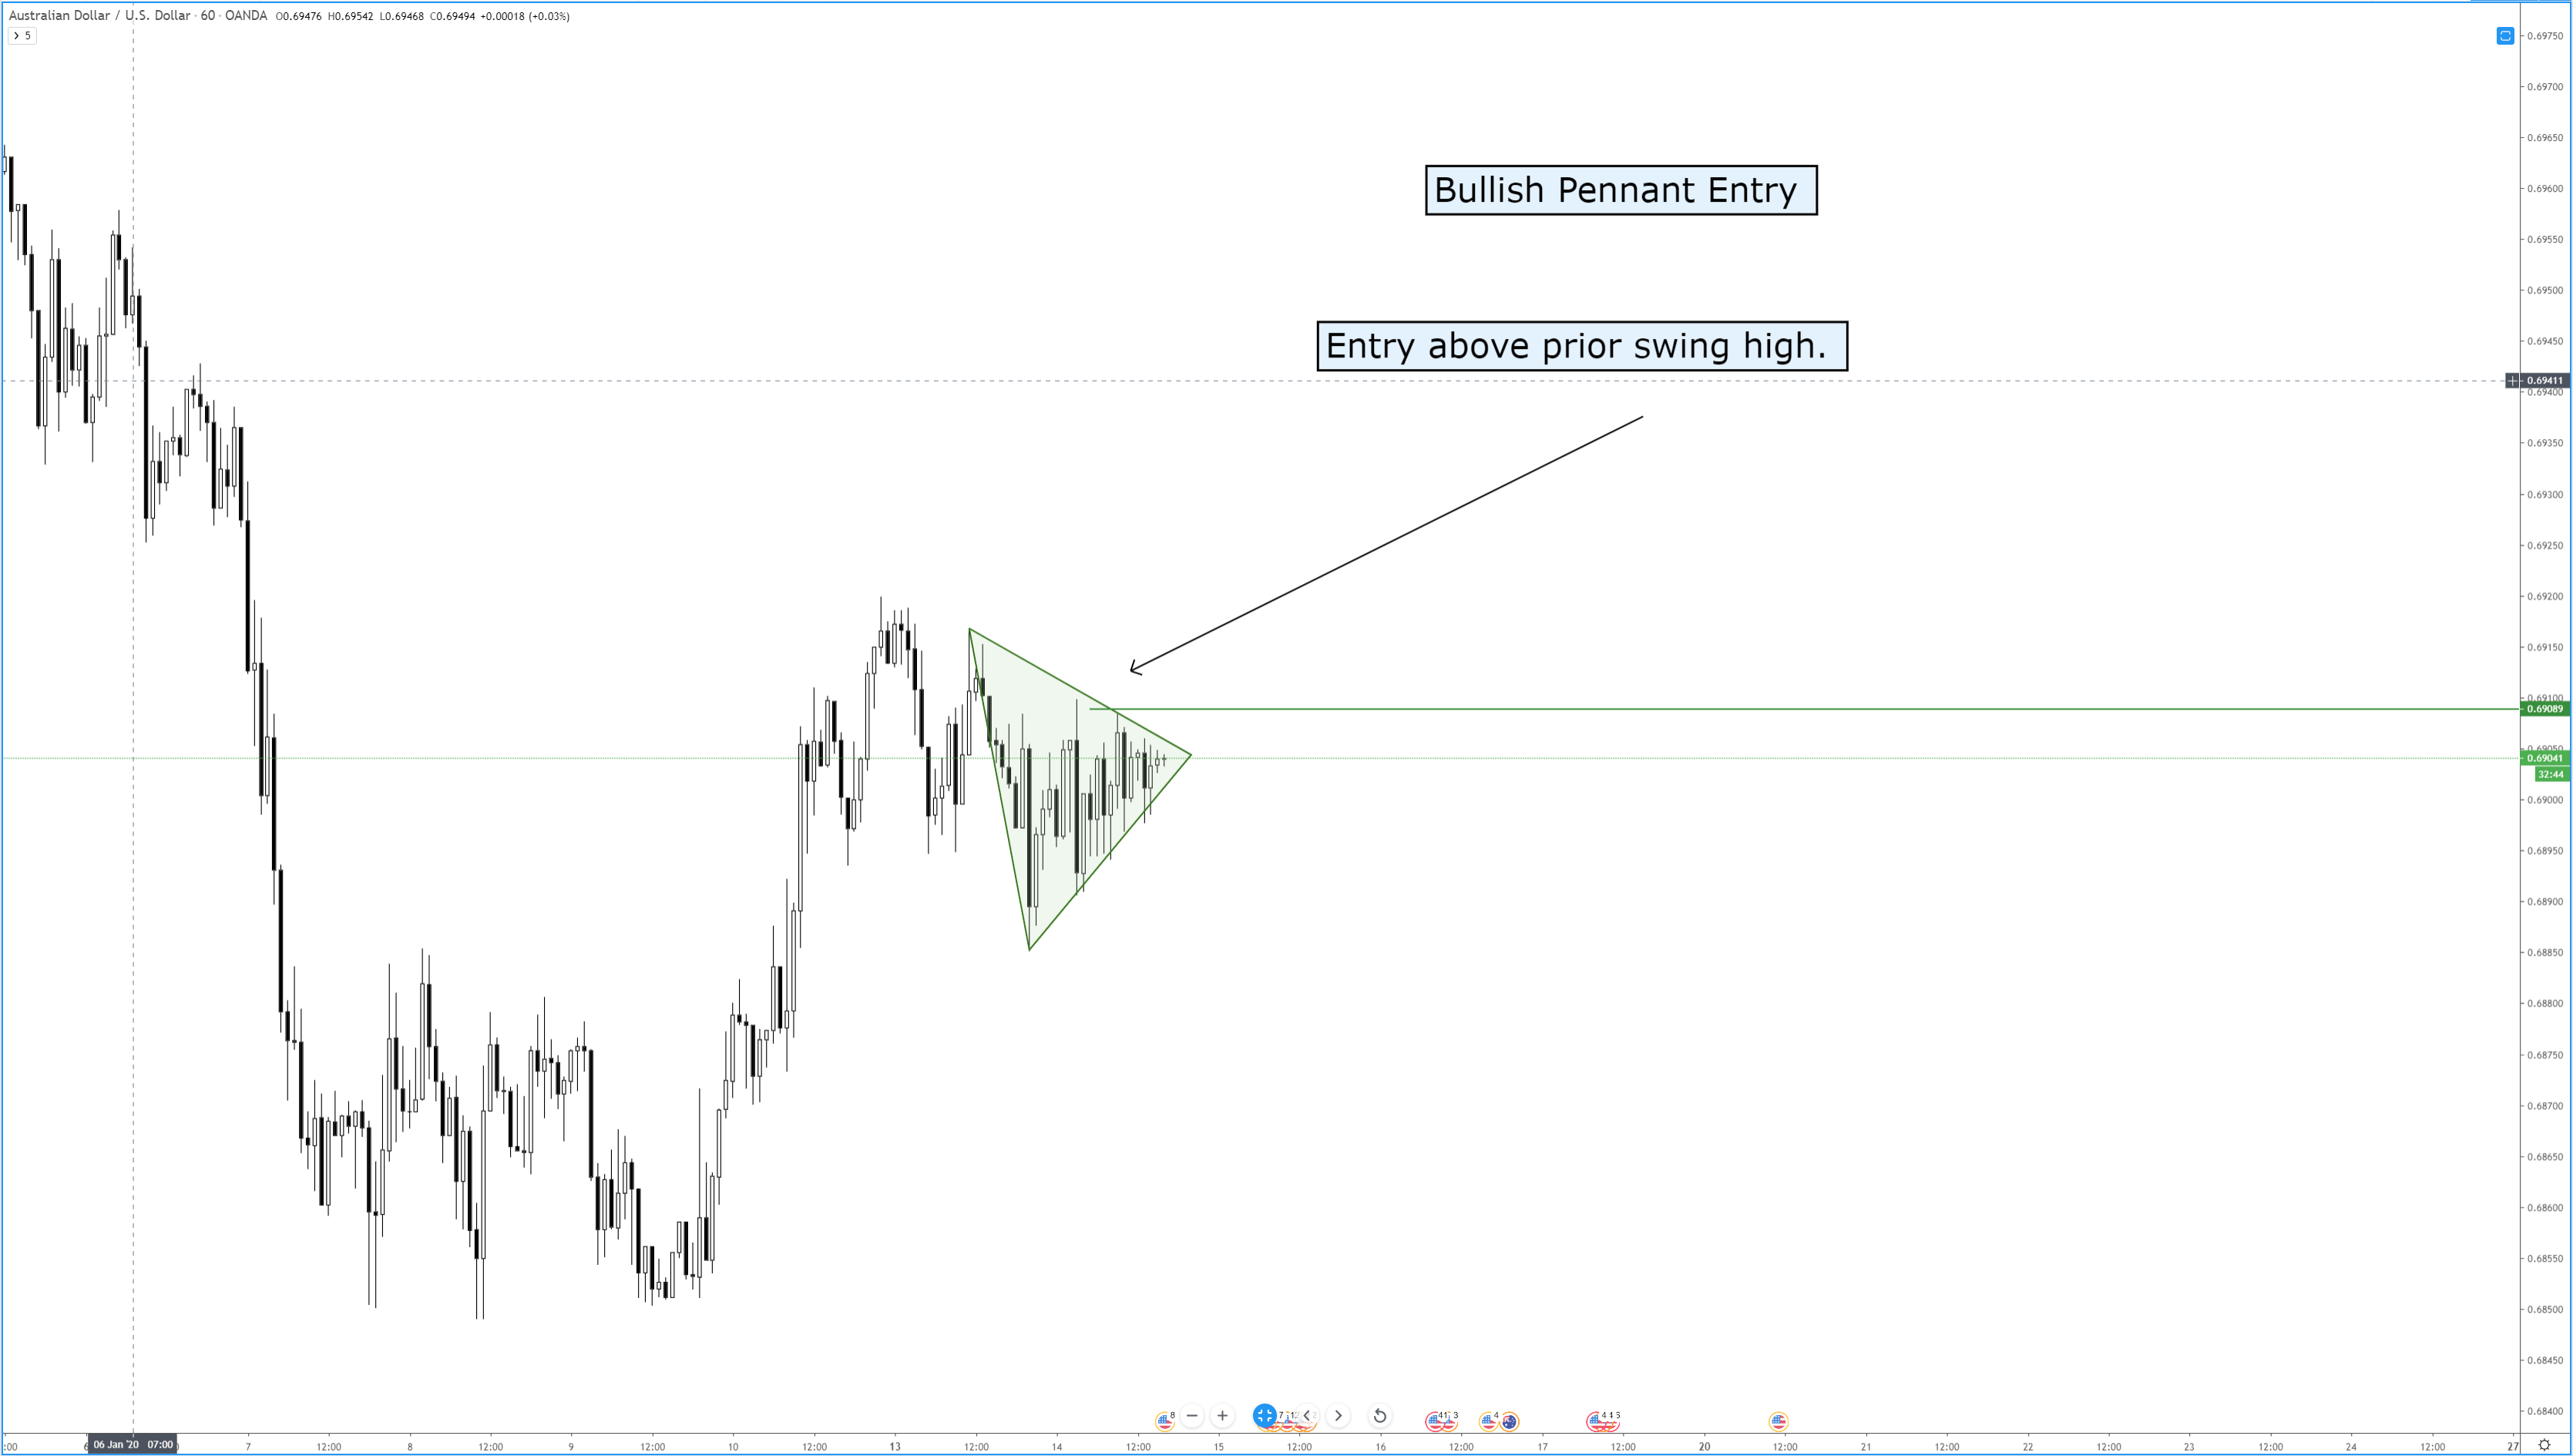
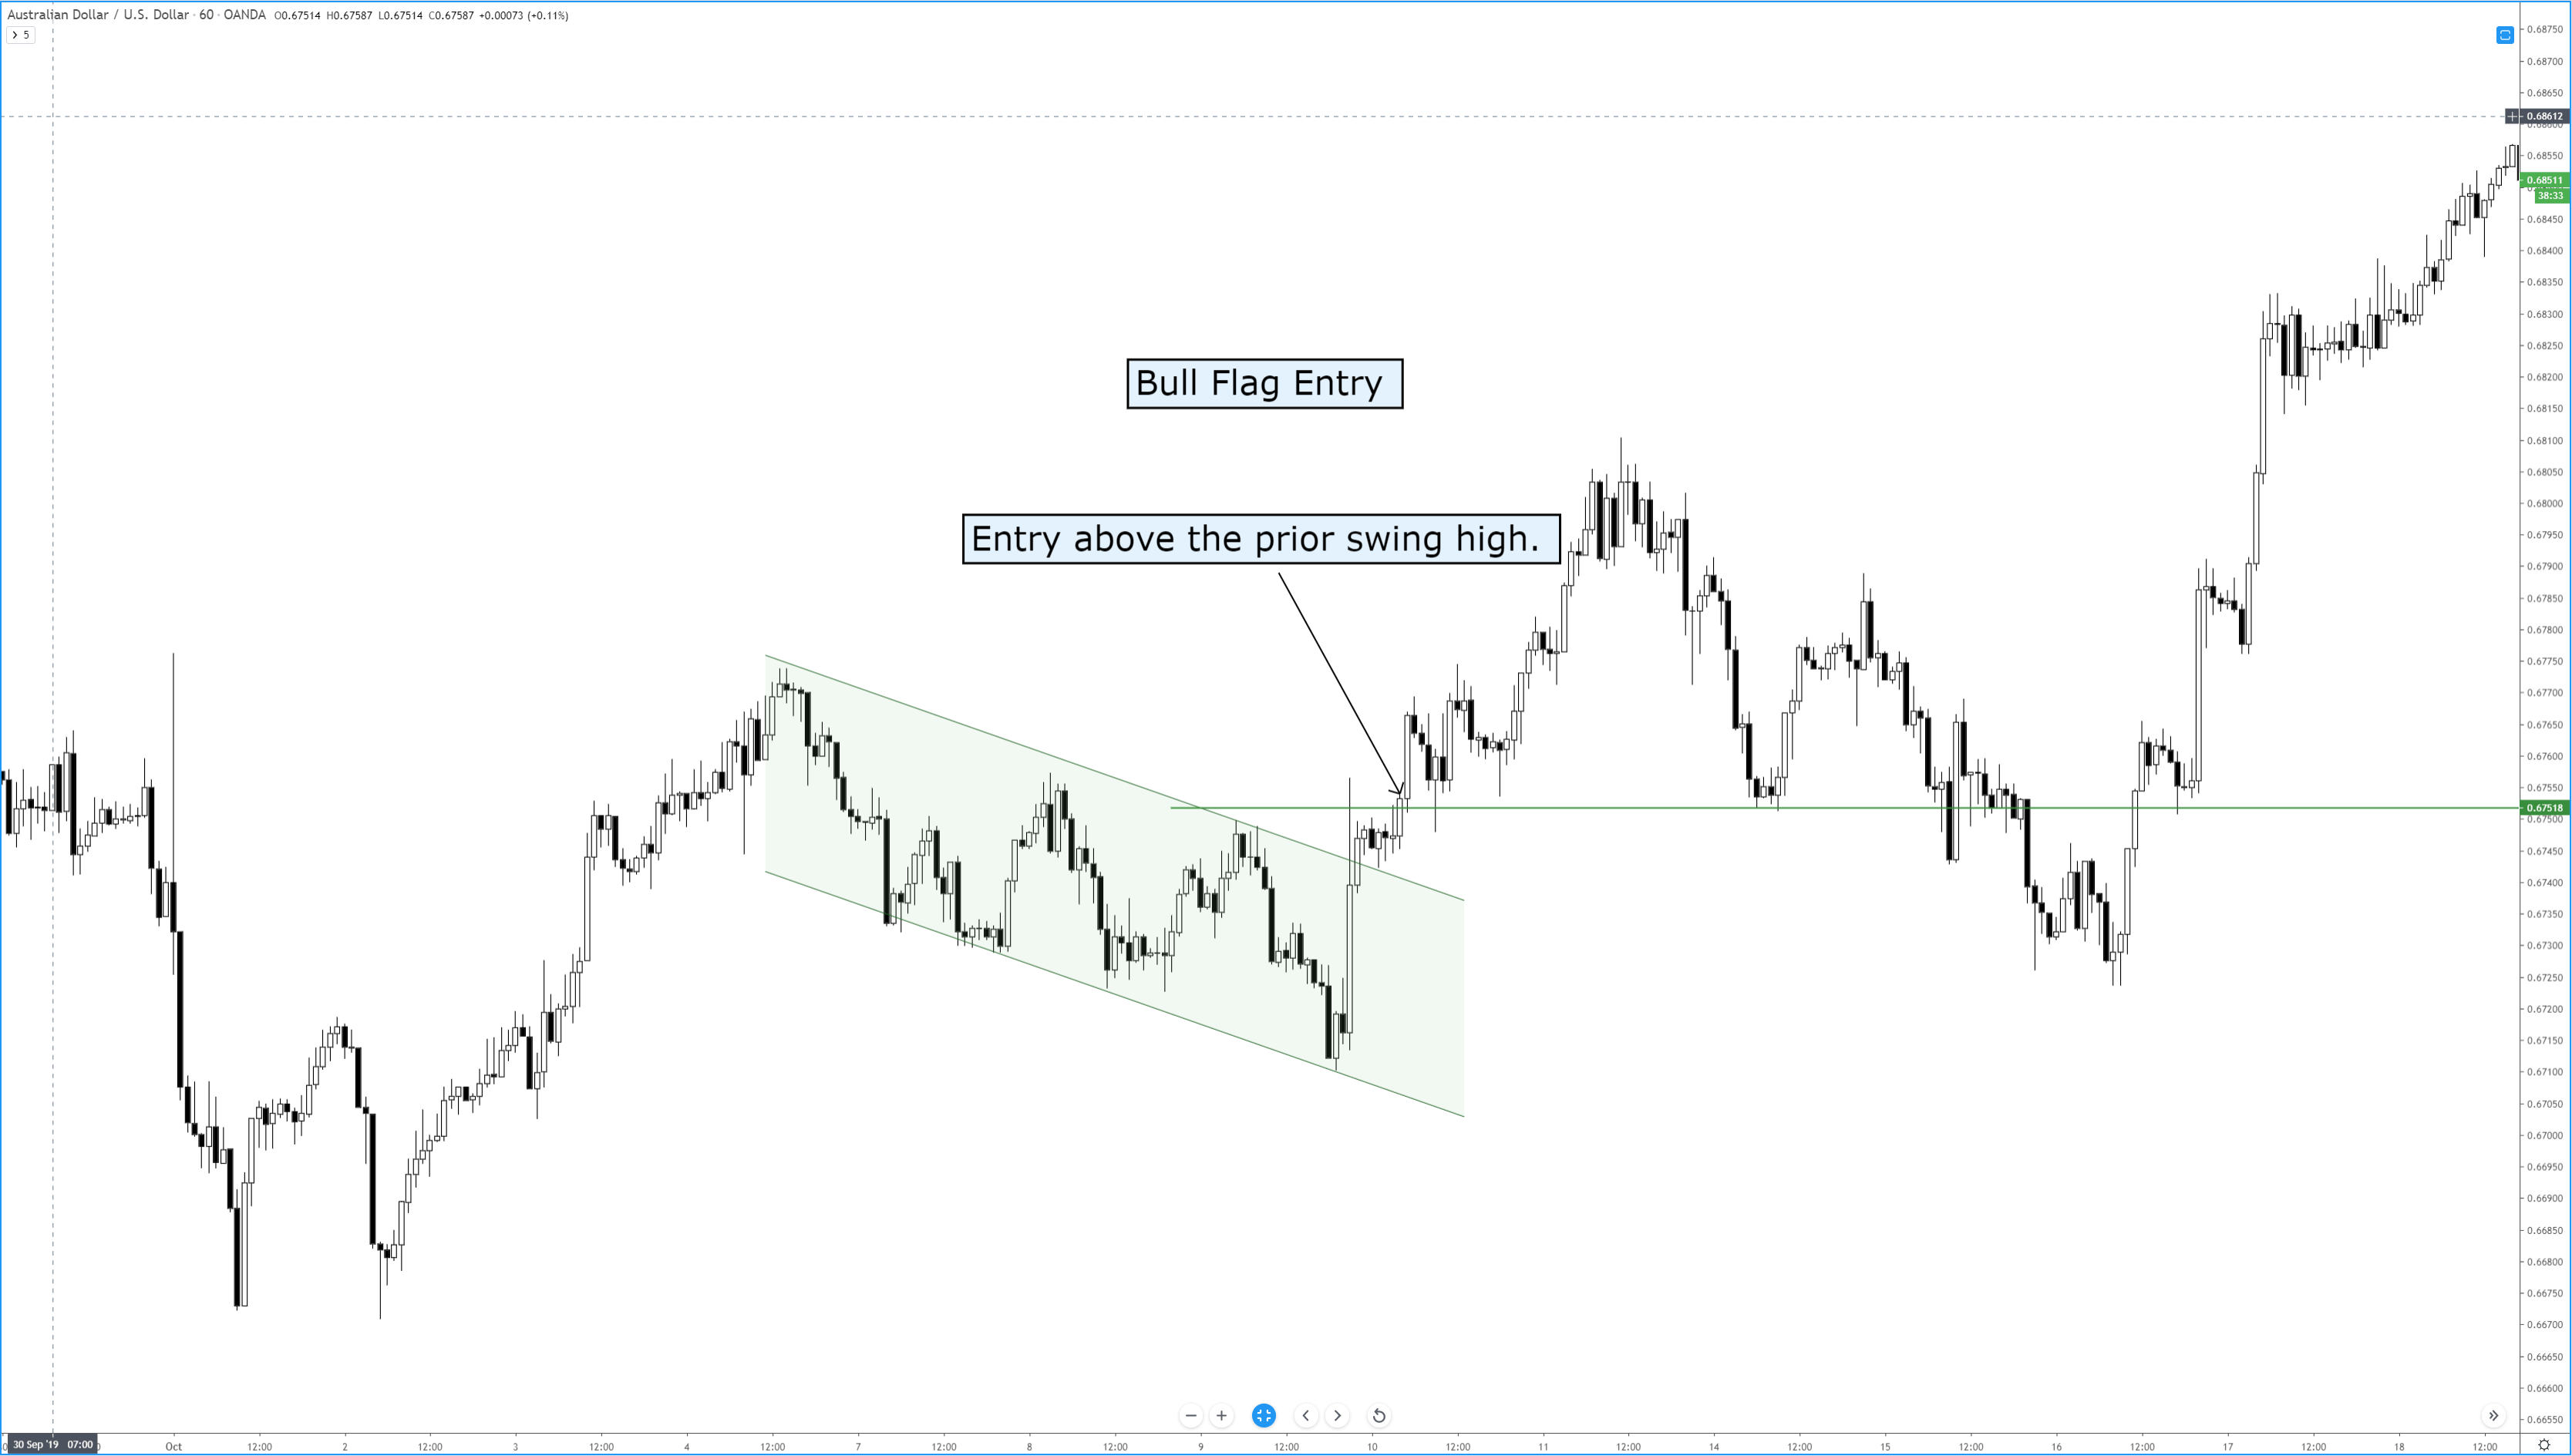
The images above show examples of bearish flags and bearish pennants, as well as bullish flags and bullish pennants. If you are unfamiliar with how to trade triangles or rectangles, refer to the articles that discuss the various triangle patterns. But we can review the basics of entering these great continuation patterns.

Bearish Pennant
Bearish Pennant
Bear Flag
Bear Flag
Bullish Pennant
Bullish Pennant
Bull Flag
Bull Flag


Learning how to trade flags and pennants is one of the most useful and enjoyable things that you can learn – especially as a new trader. Flags and pennants help train your brain to get used to buying dips during bull runs and shorting rallies during bear moves. If you get to a point where you can profitably trade flags and pennants, then you have transitioned into a trader who is very near outperforming the vast majority of your peers. It may seem like an easy thing to do – but it is an entirely different thing to execute. Analyzing and identifying a flag or pennant is easy; trading it is difficult.

I can not stress enough how profitable these patterns can be – and how easily you can miss them even in plain sight. The problem resides with your brain – that ‘lizard’ part that kicks in when you are are fearful of your account. When you begin to feel the fear of your account losing money, that triggers a powerful part of your brain known as the limbic system. The limbic system controls fear and pleasure. And when your fear sense is triggered, it hyper focuses the synapsis across your brain. Things that you would passively identify like flags and pennants are tertiary in their importance when the limbic system is acting in your defense. You need to find ways to ‘pause’ the process with things like alerts. On the images above, you saw horizontal lines above prior swing highs and below prior swing lows. Placing alerts at those points may be enough to interrupt your primary fear response and allow you to make money on your emotions.

Because if you are feeling it, so is everyone else.


Sources:

Kirkpatrick, C. D., & Dahlquist, J. R. (2016). Technical analysis: the complete resource for financial market technicians. Upper Saddle River: Financial Times/Prentice Hall.

Bulkowski, T. N. (2013). Visual guide to chart patterns. New York, NY: Bloomberg Press.

Bulkowski, T. N. (2008). Encyclopedia of candlestick charts. Hoboken, NJ: J. Wiley & Sons.

Bulkowski, T. N. (2002). Trading classic chart patterns. New York: Wiley.

Categories
Chart Patterns

Chart Patterns: Descending Triangle

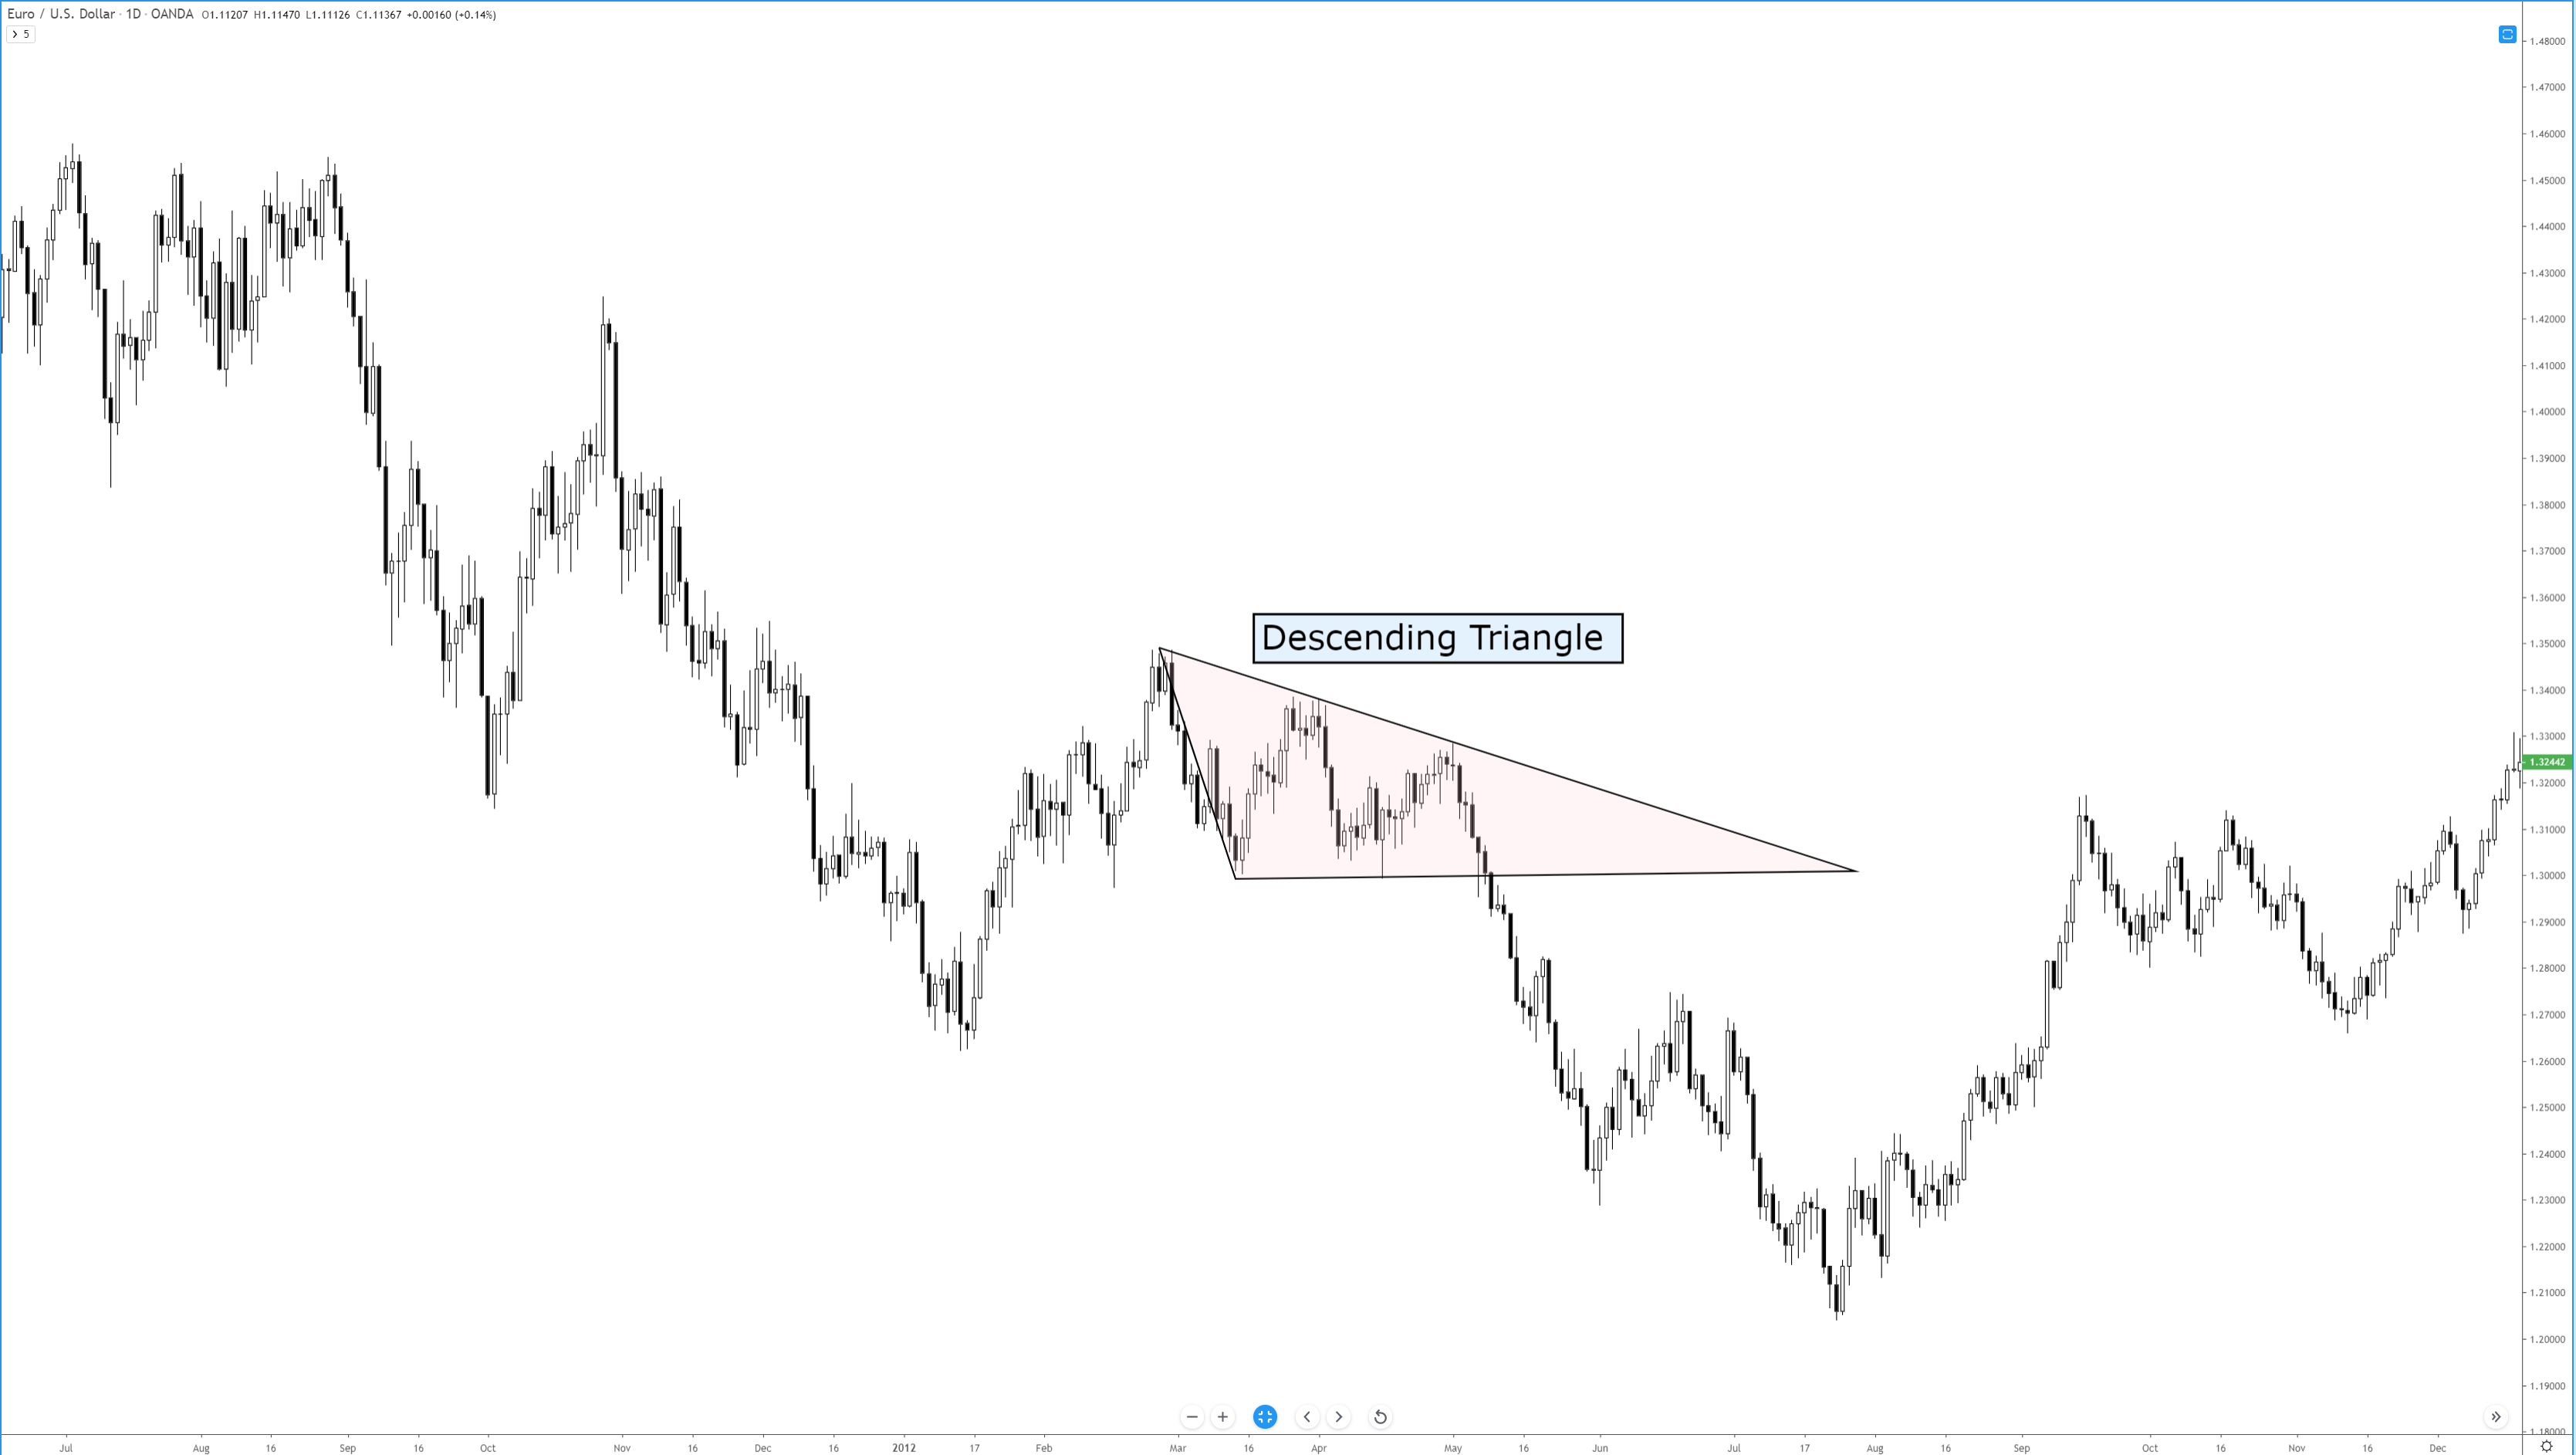
Descending Triangle
Descending Triangle

The descending triangle is another version of the many triangle patterns in technical analysis. It is the opposite of the ascending triangle. This pattern is overwhelmingly bearish and is one of the more common bearish continuation patterns. If you’ve read Dahlquist and Kirkpatrick’s Technical Analysis, you will find that this pattern is treated with some considerable positivity. It was one of the best-performing patterns. But there is a caveat to why this is.

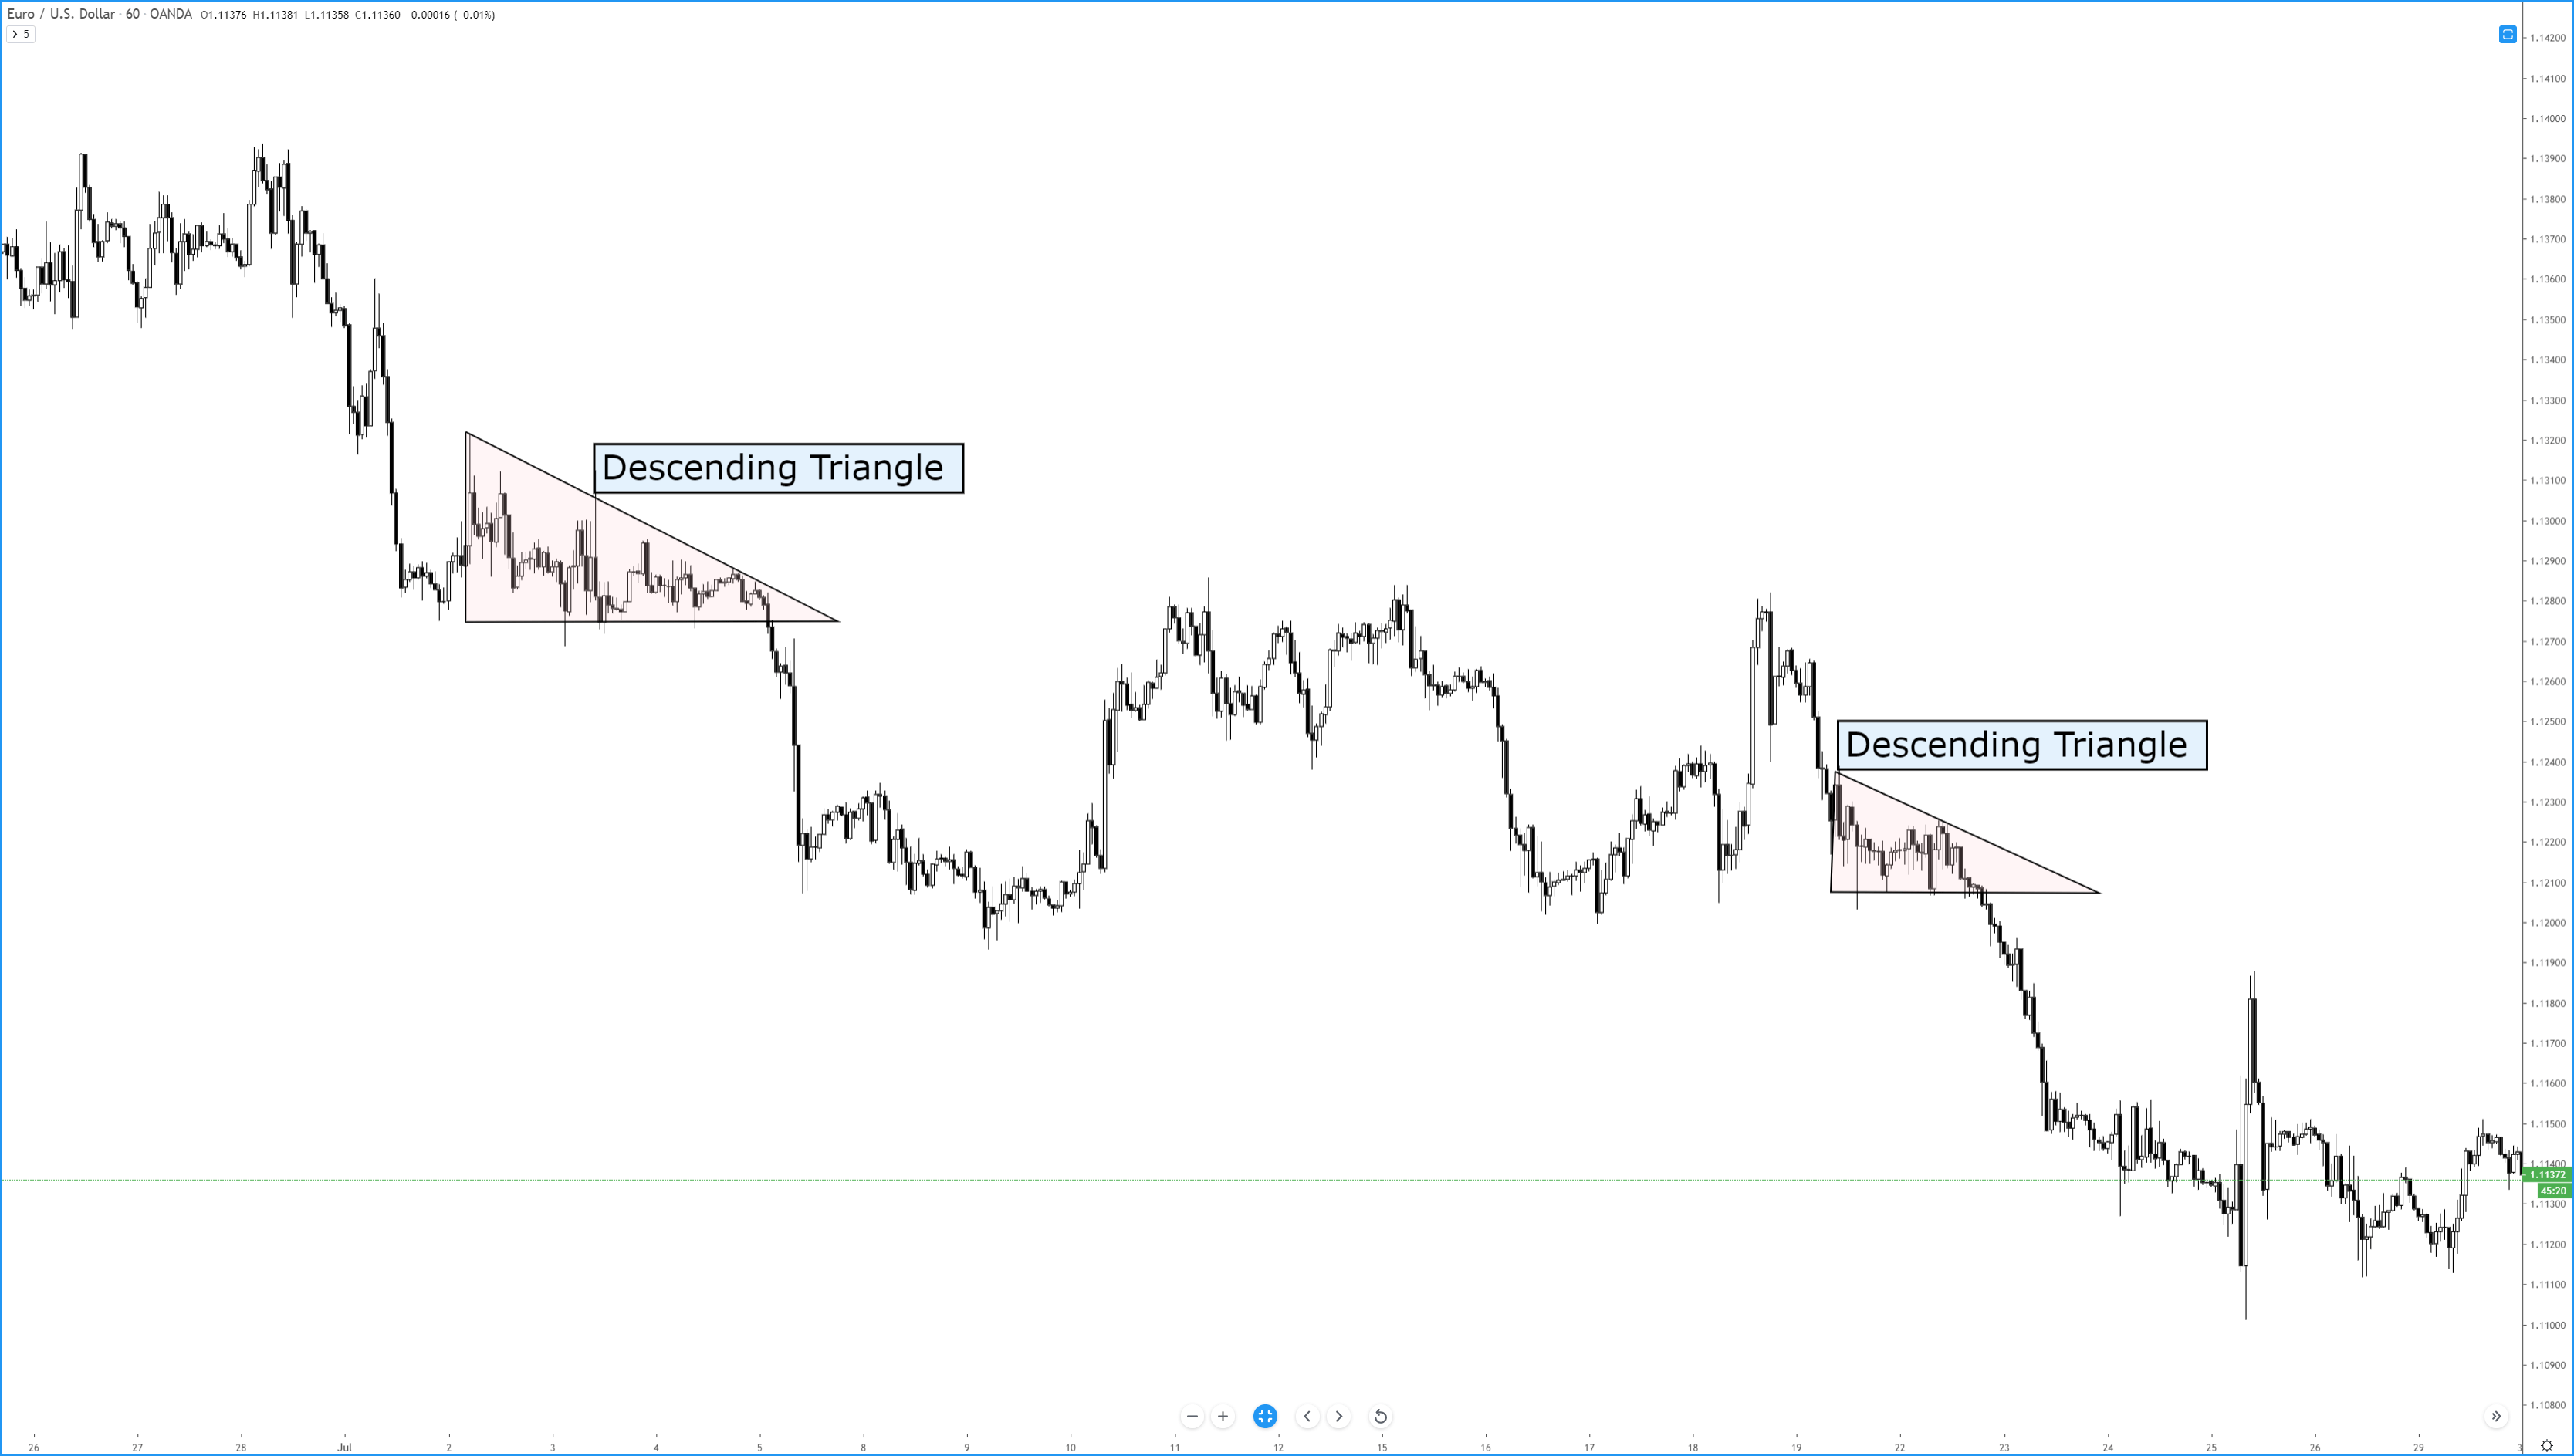
Descending Triangle
Descending Triangle

The two trendlines required for the formation of a descending triangle are a flat, horizontal trendline that acts as support with a downward sloping trendline that acts as resistance. Ideally, price should touch both the upper and lower trendlines twice. Volume typically decreases as price gets closer to the apex. Breakouts occur within the final 1/3rd of the pattern. Dahlquist and Kirkpatrick report that increasing volume is actually more favorable for this pattern. The most common breakout is lower at 64% of the time.

I’ve written in prior articles about the dangers of putting to much stock into technical analysis books where the initial testing of patterns and results have been in traditional equity markets (stock markets). I believe that one of the reasons that Dahlquist and Kirkpatrick have reported such powerful and swift moves with a downward breakout is due to the nature of bear moves in equity markets. Because markets like the stock market are exceedingly long-biased, any dramatic drop below crucial support will have an exceedingly more dramatic move when compared to the forex markets – which are primarily range bound. Another factor that may attribute to the overperformance of this pattern in stock markets vs. forex markets is the ease of shorting in forex vs. the stock market.

Sources:

Kirkpatrick, C. D., & Dahlquist, J. R. (2016). Technical analysis: the complete resource for financial market technicians. Upper Saddle River: Financial Times/Prentice Hall.

Bulkowski, T. N. (2013). Visual guide to chart patterns. New York, NY: Bloomberg Press.

Bulkowski, T. N. (2008). Encyclopedia of candlestick charts. Hoboken, NJ: J. Wiley & Sons.

Bulkowski, T. N. (2002). Trading classic chart patterns. New York: Wiley.