Categories
Forex Fundamental Analysis

Understanding The Impact Of ‘Corporate Tax’ On The Forex Price Charts

Introduction

The Corporate Tax is one of the most poorly understood economic indicators when it comes to fundamental analysis of currency pairs and the broader stock market. Most economists have concluded that the Corporate Tax is among the least efficient and least defensive Tax. Although, there is an ongoing debate among economists about the efficiency of Corporate Tax collection from various companies. Beurocrats have agreed that it causes significant distortions in economic behavior.

The common person on the street believes that the Tax is directly paid by Corporations, which is not true. Owners and Managers of corporations often assume that the Tax is simply passed along to consumers—the vagueness about who actually pays the Tax accounts for its continued popularity among officials.

What is Corporate Tax?

The Federal Corporate Tax differs from the individual income tax in two ways. First, the Tax is levied on the net income and not on gross income. This means the profit of the organization is also included in the net income with permissible deductions of business costs. Second, it applies only to businesses that as registered as Corporations and not as partnerships or sole proprietorships.

The Corporate Tax is levied at different rates for different brackets of income. For example, in the U.S., 15% on taxable income under $50,000, 25% on income between $50,000 – $75,000 and rates varying from 34% to 39% on income above that. The federal government has kept the rates low for small corporates with a lower turnover as it can benefit companies to a greater extent. However, lower rates have little economic significance. More than 90% of all the Corporate Tax revenue came from 1.5% of corporations with assets higher than $10 million.

States levy further income taxes on these corporations, the rates ranging from 3 to 12 percent. One of the main reasons behind low State Corporate Tax is that the states can easily relocate out of states that impose unusually high taxes.

Effect on Capital Flow due to Corporate Tax

Today, economists are of the opinion that the burden of Corporate Tax falls entirely on the owners of capital. The latest research says that, since capital is mobile, it will flow to investments that produce the highest after-tax returns. High Corporate Tax raises the cost of capital and reduces after-tax returns in the corporate sector, thus leads to relocation of capital into Tax-exempt sectors of the economy.

When governments reduce the rates under various tax brackets, it has two major effects. Firstly it increases the supply of capital available to corporations, and secondly, it increases the rate of return on investments in the non-corporate sectors as capital becomes more plentiful there.

The major drawback of the relocation of funds due to higher tax rates is that the burden of Tax ultimately shifts to workers and employees. The workers, over time, become less productive and earn lower real wages.

The Economic Reports

The Economic Reports of Corporate Tax are announced on a yearly basis for most of the countries. However, during economic emergencies, changes to the Tax rates will be made by the Finance Ministry to stabilize the money flow into the companies. In the U.S., the Corporate Tax data is published and maintained by the Internal Revenue Service (IRS), which is the government agency responsible for the collection of taxes and enforcement of tax laws. The IRS also handles corporate, excise and estate taxes, including mutual funds and dividends. People in the U.S. refer to the IRS as the “tax man.”

Analyzing the Data

Corporate Tax plays a vital role in the long term growth of a country. Most investors pay close attention to the Corporate Tax rate of a nation as it determines the development of the Manufacturing sector and GDP as a whole. Institutional traders compare the Corporate Tax rates of different economies and invest in those countries where the Taxes are low. They feel that lower tax rates lay down the path of growth for companies, and they will also be able to pay dividends to their shareholders.

Impact on the currency

When the government reduces tax rates, companies will be able to retain their profits, and hence this will lead to reinvestment in the company. This directly leads to the expansion of the business and will be able to increase production. When the Manufacturing sector starts to perform well, investors will be prompted to invest in the economy either by purchasing shares of a company or in the currency. When large investors invest, smaller fund houses also start buying the currency, which leads to an appreciation in the currency.

Sources of information on Corporate Tax

Corporate Tax data is available on the official website of every country’s Finance department, which also provides a comprehensive analysis of the same. Here are the Corporate Tax rates of some of the major countries of the world.      

Sources to find more information on Corporate Tax 

GBP (Sterling)AUD | USD | CAD | NZDJPY

There are many arguments in favor of the removal of Corporate Tax, but this is from the perspective of industries. When we think from the government’s point of view, the Corporate Tax is said to increase the revenue of the government, which is very much needed for running the nation. Executives believe that ‘an old tax is a good tax’ holds validity even today. Any major change in the tax regime imposes new costs and complications during the transition period.

Impact of Corporate Tax rates news release on price charts

We understood in the previous section of the article, the meaning of Corporate Tax, and the role it plays in an economy. In the following section, we will see how the Corporate Tax announcement impacts the value of a currency and cause volatility in the pair. The data of this economic indicator is keenly watched by long term investors and representatives of the manufacturing sector. In the below image, we can see that the Corporate Tax rate announcement has a moderate to high impact on the currency, and in most cases, the announcement is made by the Deputy Governor.

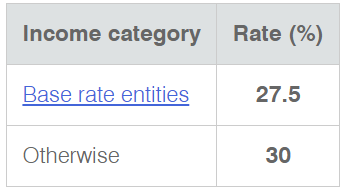
Today we will be analyzing the Corporate Tax rate of Australia, which shall be imposed on the companies for the current financial year. It is published on the official website of the Australian Taxation Office, which gives statistics of previous data as well. The below image shows that the Base Rate was fixed at 27.5%, while for the general category, the Tax rate was fixed at 30%. There were no changes in the Tax rate as compared to the previous year. Let us see how the market reacts to this data.


EUR/AUD | Before The Announcement

We shall first look at the EUR/AUD currency pair, where the above image signifies the state of the chart before the announcement is made. What we see is that the overall trend is up, and recently, the price has been moving within a range. We should be cautious before taking any sell trades in such chart patterns, as the price is at the bottom of the range, and the major trend is up. Depending on the news data, we shall trade the currency pair.

EUR/AUD | After The Announcement

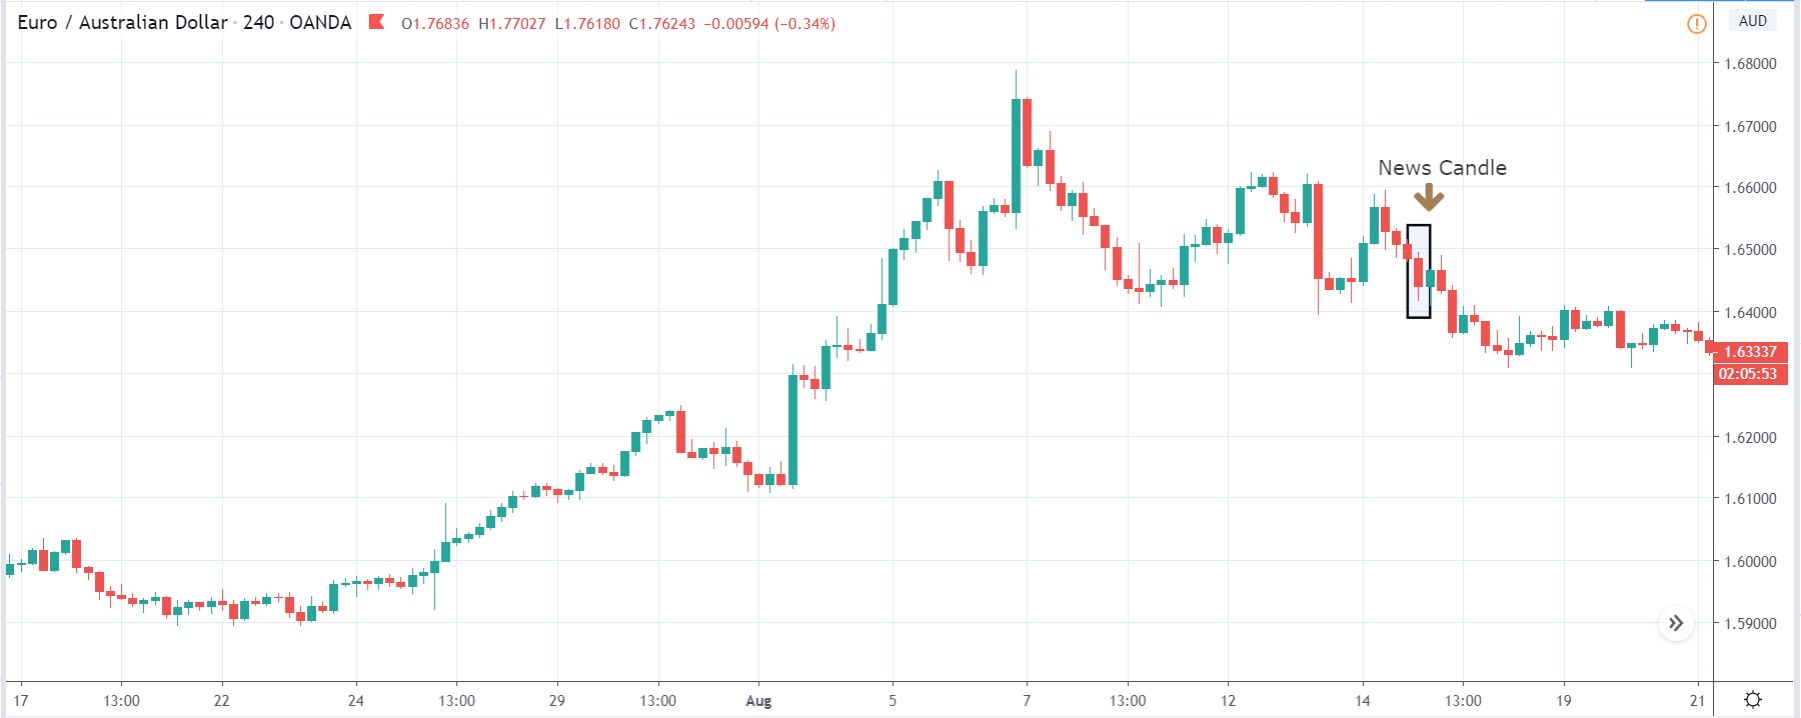
After the Corporate Tax announcement is made, market crashes below, and we witness selling a fair amount of pressure, which takes the price lower, thereby strengthening the Australian dollar. One of the reasons behind the sudden downfall is that the Corporate Tax rates were maintained at the same level as before, which is said to be good the economy (due to overhead costs of changing rates). At this point, we cannot immediately go ”short” in the market as the price is the key ”support” level. Therefore, we should wait for the price to break the ”support” and then take a ”breakdown trade.” In such trades, the ”take profit” should be small based on the overall trend.

AUD/CAD | Before The Announcement

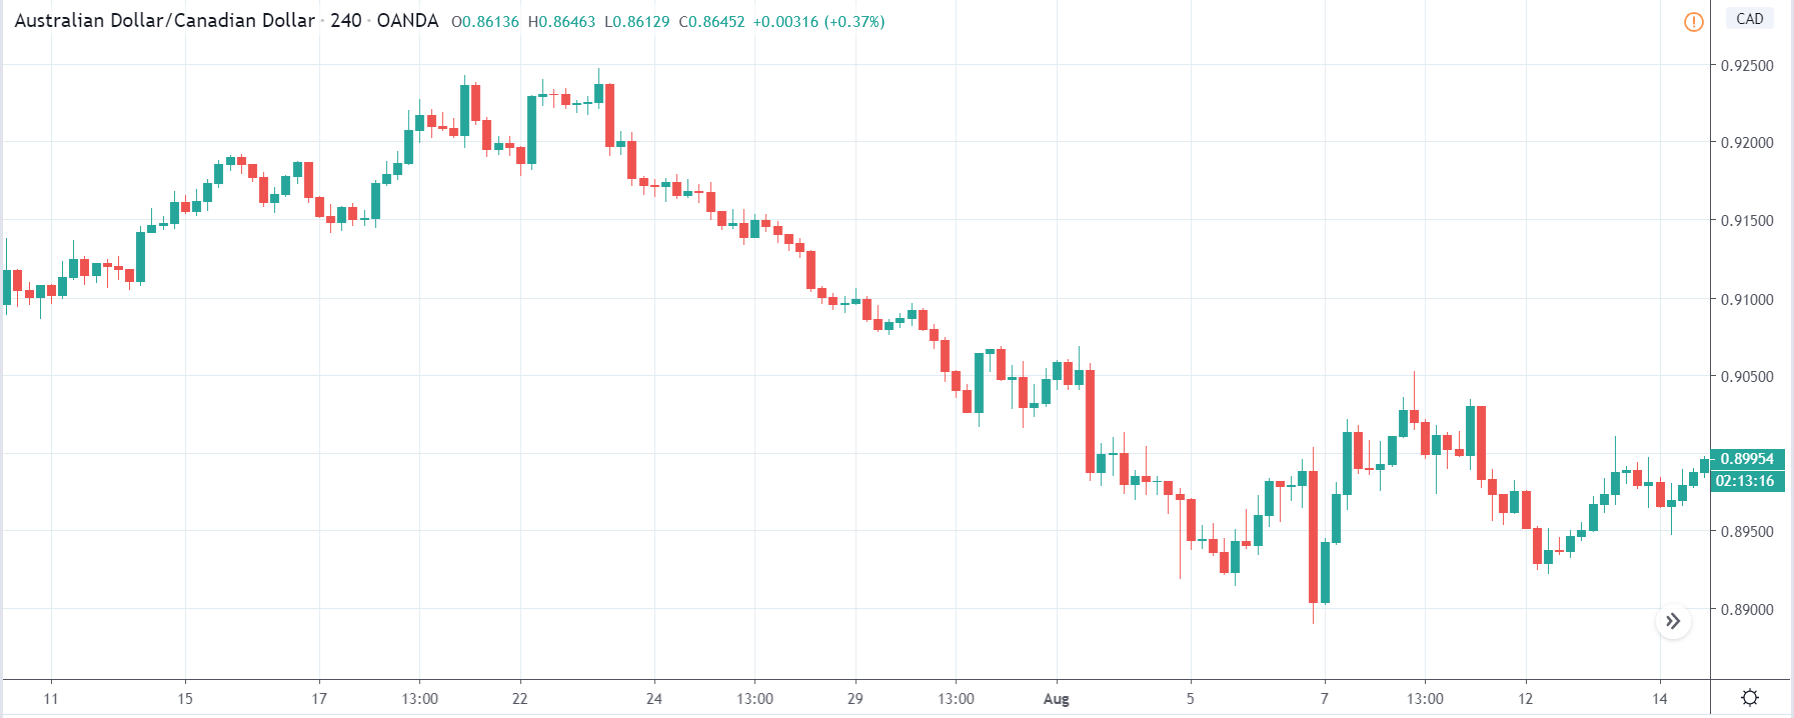
AUD/CAD | After The Announcement

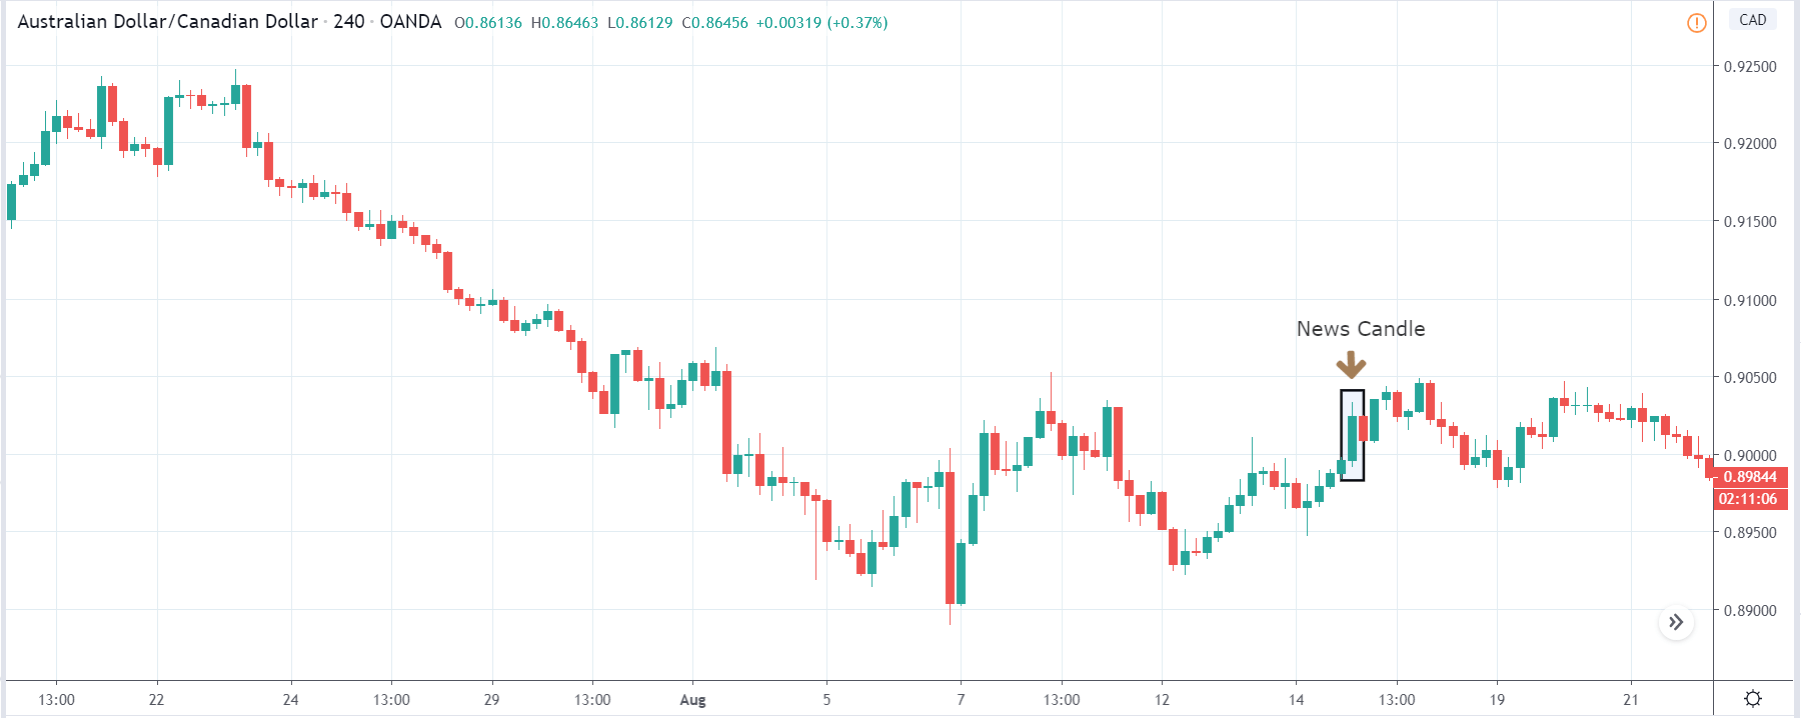
The above images represent the AUD/CAD currency pair, and in the first image, we see that the overall trend is down, suggesting weakness in the Australian dollar, and now the price seems to be retracing the down move. If the data were to be positive for the Australian economy, we need to be extra cautious before attempting a buy trade as the trend is down, and there is a high chance that it might get sold into. However, bad news can work in our favor and might result in a further down move. After the news announcement, we see an increase in volatility to the upside, and the price closes with a bullish ”news candle.” Traders buy Australian dollars after they realize that the Corporate Tax rate was unchanged, which is good news for the manufacturing sector, particularly. One should be trading the pair on the long side, only after suitable reversal patterns are seen in the market.

AUD/CHF | Before The Announcement

AUD/CHF | After The Announcement

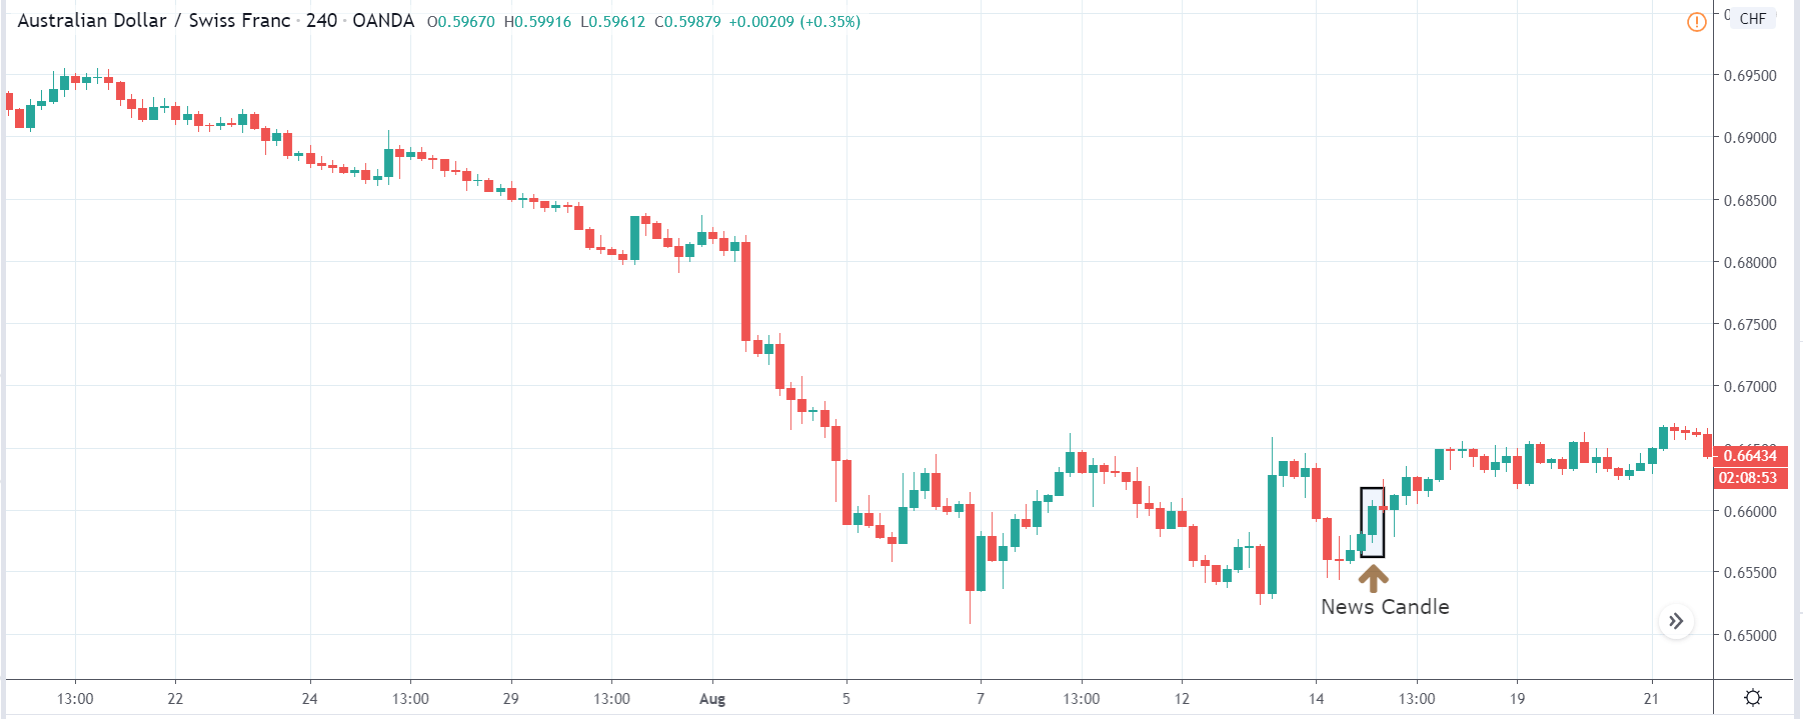
This is the AUD/CHF currency pair, where the chart characteristics appear to be similar to the AUD/CAD currency pair. Also, here the market has recently formed a range and currently at the bottom of the range. In this pair, positive news data can prove to the ideal case for going ”long” in the market as the price is at a point from where some buyers can pop up anytime. In any case, it is advised to analyze the data and then trade. After the Corporate Tax rate announcement, the market again moves higher, and volatility increases on the upside, which strengthens the Australian dollar by little. The sudden surge in price is because of the positive Corporate Tax data, and thus traders turn bullish on the currency. One can go ”long” in the market with a ”take-profit” at the ”resistance” of the range and stop-loss below the ”support.

That’s about Corporate Tax rates and the impact of its new release on the price charts. Let us know if you have any questions in the comments below. Cheers.

Categories
Forex Economic Indicators

What Is Gross Domestic Product (GDP) & How Is It Useful For The Forex Traders?

Introduction

Gross Domestic Product, also known as GDP, is one of the main Microeconomic Indicator in Forex. It is the total amount of money spent on final goods and services. GDP is expressed in percentage terms and is calculated across different time periods. The time period is usually from one quarter to another.

It is a standard measure for the value added to the country’s economy through the production of goods and services during a specific time period. GDP is published by the International Monetary Fund (IMF), and information on the same can be found on their official website.

What does GDP measure?

Just as explained in the beginning, GDP measures the health of an economy. If the GDP of a country is high, it means it is receiving capital flows from central banks and institutions, which is a big positive for that country. However, if the GDP numbers are declining quarter on quarter, it means the economic growth of the country is shrinking. When GDP falls, unemployment in the country rises, and output in production drops.

GDP is important because it gives a birds-eye view of how the economy is doing. It is a sign of people getting more jobs, getting better pay, and businesses feeling confident about investing more.

Calculation of GDP

The GDP of a country can be calculated by using the below-mentioned formula

GDP = C + I + G + (X-M)

Where C is the spending made by consumers

I is the investment by businesses

G is the government spending

(X-M) is the net exports

How do Forex traders use GDP?

GDP is an indicator that is used by both technical and fundamental traders. It is one of the most critical drivers of the economy and is closely monitored by all. GDP is important because it can affect how the financial markets can behave, both positively and negatively. Strong GDP growth translates into higher corporate earnings, which directly appreciates the currency value. Conversely, falling GDP means the economy is weakening, which is negative for the currency and, therefore, stock prices. According to economists, a recession is said to occur when there are two consecutive quarters of negative GDP growth.

One should not forget that GDP is a lagging indicator, meaning it shows what the economy did in the past. It does not predict the state of the economy in the near future. Hence, if the GDP data of a country is not good, traders view this as an opportunity to buy the currency and make a profit in the long term.

Summary

Understanding the Gross Domestic Product and its growth rate is essential for investors and traders as it affects the decision-making process of policymakers of the country. When the GDP growth rate is high, the central banks raise interest rates and encourage investment. High-interest rate is said to attract foreign investors and financial institutions. With the improvement in research and quality of data, statisticians and governments are trying to find measures to strengthen GDP and make it a comprehensive indicator of national income.

Categories
Forex Course

4 – Understanding The Mechanism In Buying And Selling Of Currency Pairs

Introduction

The mechanism of the forex market is quite different when compared with other markets like stocks and commodities. In the stock market, we essentially consider a company’s stock to trade. But in the foreign exchange market, we cannot trade a single currency. Instead, we must trade them in pairs.

In the previous lessons, we understood the meaning of base and quote currencies and also the right way to read the symbols. In this lesson, let’s explain how exactly this buying and selling happens in the Forex market.

The working principle

Before getting into the topic, let us understand a few common terms to grip the concept much better.

Long – It is a basic term in trading, which refers to the ‘buying of security.

Short Selling – This term refers to the ‘borrowing’ of security from the broker and selling it at the current market price. You can assume this to be the right opposite of long. Note that Shorting security and selling security are two different terms.

For example, let’s say you went long on a security, and now you wish to close it. To close it, you will have to ‘sell’ it. Here, you are ‘selling’ and not ‘shorting’ the security.

Now, with this on our back, let us get into the working of buying and selling currency pairs.

Going Long on a Currency Pair

When you go long on a currency pair, you actually buy the base currency, and short sell the quote currency. For example, if you go long 100,000 units on EUR/USD, you are buying 100,000 Euros and short selling 100,000 US Dollars.

Short Selling a Currency Pair

Short selling in the forex market is quite different from that of the stock market. In the forex market, when you short sell a currency pair, you will be selling the base currency and buying the quote currency. Hence, shorting in forex is the same as placing a regular sell order.

However, the main motive remains that the prices must decline from the point you executed the short position to generate a profit. For example, if you short 10,000 units of USD/CAD, you are actually selling 10,000 US Dollars and buying the same number of Canadian Dollars. Hence, here, you’re not borrowing a certain amount of currency to go short.

What next?

With the concept of the long and short sell, let us understand how to make a profit from it.

To profit from a long trade, you need the currency pair prices to increase.

To profit from a short trade, you need the currency pair prices to decline.

This also implies that, in a long trade, an increase in the base currency prices will put you in profit, and in a short trade, a decrease in the base currency prices will give you profits.

Example

Consider the current market price of USD/CHF to be 0.9850. Let’s say you went long on this currency pair. The buy/sell mechanism here is simple – you bought the USD (the base currency) and simultaneously short sold the CHF (the quote currency). Hence, to make a profit from this, you need currency pair prices to increase, which in turn means that you need the value of the base currency (USD) to increase or the value of the CHF to decrease because you’ve bought the USD.

This is how the buying and selling of currency pairs work internally. However, since all of this is managed by the broker, all you need to know is if the prices should rise or fall according to the position you took.

In the next article, we will be discussing the sheer size and liquidity of the Forex market along with the perks involved. For now, check if you can get the below questions right.

[wp_quiz id=”42315″]
Categories
Crypto Market Analysis

Surge in Crypto-Coin Capitalization

General overview

Market Cap: 311,391,250,022$

24h Vol: 25,736,521,327$

BTC Dominance: 42.6%
In the last 24 hours, cryptocurrency market capitalization went from 268,960,000,000$ to 311,391,259,000 where is now sitting.

As you can see from the chart, the momentum was strong, and it broke the resistance which is now serving as support around $299B.

Crypto-Coin Market Cap News

Mainly, cryptocurrency market capitalization news that came out in the last 24 hours are mostly about the crypto surge market experienced.

Cryptocurrency Market Cap Clips $300 Billion as Bear Trap Liquidates Shorts

>Analysts largely attributed the precipitous surge to a “bear trap,” which occurs when futures and margin traders attempt to short an asset but have their positions liquidated due to a price increase, forcing them to buy at market prices to cover their position. Source: Josiah Wilmoth, April 12. 2018, ccn.com

Future Gains! Bitcoin Has Bottomed Out, Says Pantera Capital in a Bold Cal

>Now’s the time to get long bitcoin, a leading cryptocurrency hedge fund says. Not only is bitcoin out of the doldrums, but it’s onward and upward from here. Source: Gerelyn Terzo April 12. 2018, ccn.com

However, there was some significant regular news as well.

Bank Of America Seeks Patent On Blockchain-Based Data Storage System

>On April 12, the US Patent and Trademark Office published Bank of America’s application for a patent on a Blockchain-based storage system with automated data authentication. Source: Ana Alexandre April 13. 2018, cointelegraph.com

UAE Government Launches Blockchain Strategy 2021

>Sheikh Mohammed bin Rashid, Vice President and Prime Minister of the UAE and Ruler of Dubai, has launched the ‘UAE Blockchain Strategy 2021’ with the goal of becoming a world leader in adopting this technology, the Dubai Media Office reported April 11. Source Ana Alexandre April 13. 2018, cointelegraph.com

Australian Power Company to Reopen Coal Power Plant to Mine Bitcoin

>An Australian power company have signed a contract with a cryptocurrency mining firm to provide them with cheap off-grid power. The IOT Group will be building a digital currency mining hub that’s actually inside a disused coal-fired power station in the Hunter Valley region. Source: Rick D. April 12. 2018, newsbtc.com

Analysis

BTC/USD

In the last 24 hours, Bitcoins price went up from 6770$ to 8030$ at one point. Since then, the price was pulled back slightly to around 7800$ where is now sitting. Overall the price of Bitcoin rose up 13.67% making it breach the falling wedge in which the price was since December 17 last year.

cryptocurrency market capitalization chartThe current sentiment for Bitcoin is slightly positive, meaning only 69,89% of total 356 mentions on the web are positive.

Source: sentiment.io

Zooming into its hourly chart, we can see that price has formed a bull flag and is now is sitting at a pivot point, testing those levels for support, before it can proceed forward.

Overall hourly chart signals a buy.


Pivot points:

S3        4773.3
S2        5857.9
S1        6375.2
P          6942.5
R1       7459.8
R2       8027.1
R3       9111.7

ETH/USD

Ethereum’s price has risen 16,46% in the last 24 hours. From 430$ to 505$ at the highest point and is now sitting around 487$. Looking at the daily chart, we can see that the price has breached out the falling wedge, like in the case of Bitcoin.

positive cryptocurrency market sentimentThe current market sentiment for this cryptocurrency is positive, meaning  71.3% positive mentions on the web out of a total of 115.

Source: sentiment.io


Looking at the hourly chart, we can note that price has formed two bull flags on the way of forming a cup and handle. That is an extremely bullish sign, and if you look back at the daily chart, this formation was also the bottom last time the price surged all the way up to above 1000$

Overall the hourly chart signals a buy.

Pivot points:

S3        266.92
S2        326.80
S1        355.48
P          386.68
R1       415.36
R2       446.56
R3       506.44

XRP/USD

Ripple was the first among three pairs that are covered in this report who’s price broke out of the correctional channel yesterday. The breakout resulted in a staggering 32% price increase in the last two days to its highest point of about 0.66$ per Ripple.

Ripple - Surge In Cryptocurrency Market Capitalization

The current sentiment for this crypto is very positive. However, there are only 47 mentions in total recorded by sentiment.io


Zooming into its hourly chart we can see that price formed two bullish flags after the cup-and-handle was completed, and after price tested the 0.38 Fibonacci level for support.

Overall the hourly chart signals a buy.


Pivot points:

S3        0.29764
S2        0.39765
S1        0.44120
P          0.49766
R1       0.54121
R2       0.59767
R3       0.69768

Conclusion

What happened yesterday in cryptocurrency market is another great example to observe the strong correlation of all assets in this market. We’ve seen how all three major currencies experience the same condition – breaching out of theirs corrective channels and creating bull flags. I think we are still going to experience a couple of days in a sideways movement before the uptrend is established, but one thing’s for sure – “crypto recession” is over.