The Ideal Ichimoku Strategy is the first strategy in my series over Ichimoku Kinko Hyo. There are two sides to a trade, and so there will be two different setups
Bearish Ideal Ichimoku Strategy Entry
The Ideal Ichimoku Strategy is the first strategy in my series over Ichimoku Kinko Hyo. There are two sides to a trade, and so there will be two different setups
The Ideal Ichimoku Strategy is the first strategy in my series over Ichimoku Kinko Hyo. There are two sides to a trade, and so there will be two different setups for long and short setups. This strategy comes from the phenomenal work of Manesh Patel in his book, Trading with Ichimoku Clouds: The essential guide to Ichimoku Kinko Hyo technical analysis. Buy it, don’t pirate.
Patel identified this strategy as the foundational strategy. Because it uses all of the components of the Ichimoku system, I believe that this is the strategy that people should be able to know so well, that they can glance at a chart and understand what is happening. You should see this strategy and be ready to trade it profitably before you transition into trying other Ichimoku strategy. If you don’t, you can run the risk of being disenfranchised with the system and believe that it is another trading system that doesn’t work.
Moving on to the other strategies without mastering this strategy first is very dangerous to your trading development and your understanding of the Ichimoku Kinko Hyo system.
Tenkan-Sen, Kijun-Sen, and Chikou Span should not be in a thick Cloud.
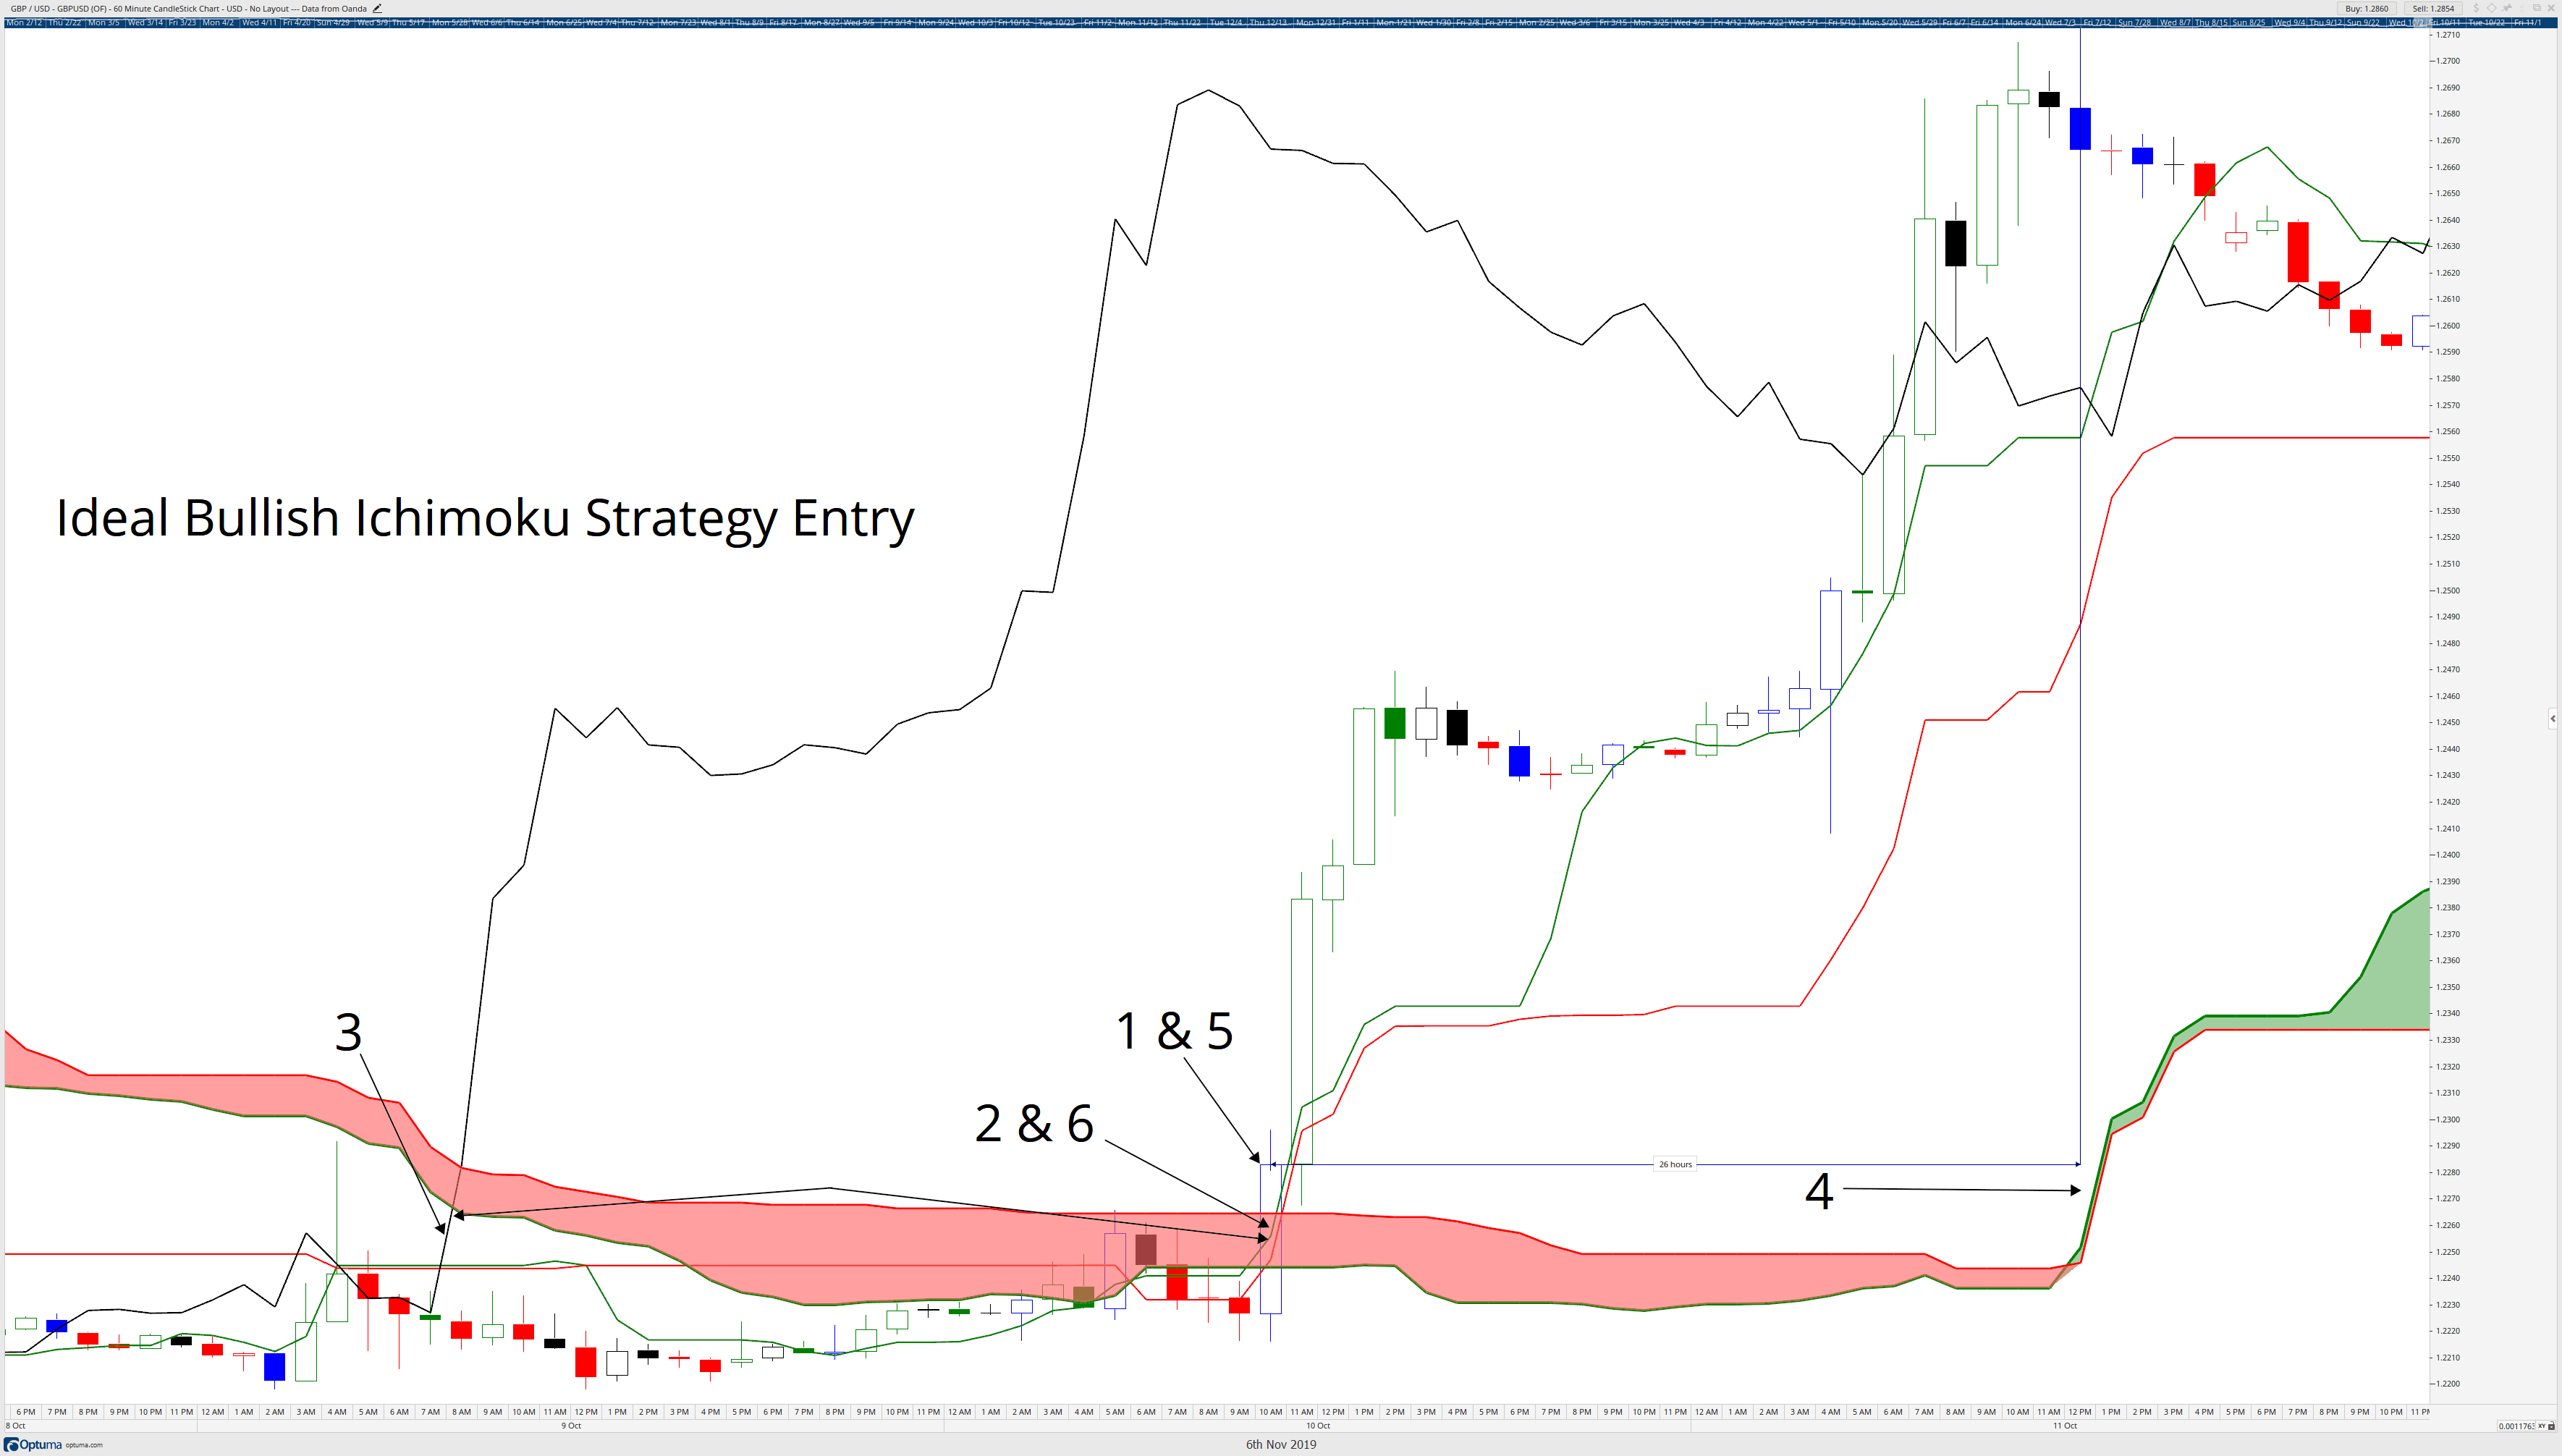
Bullish Ideal Ichimoku Strategy Entry
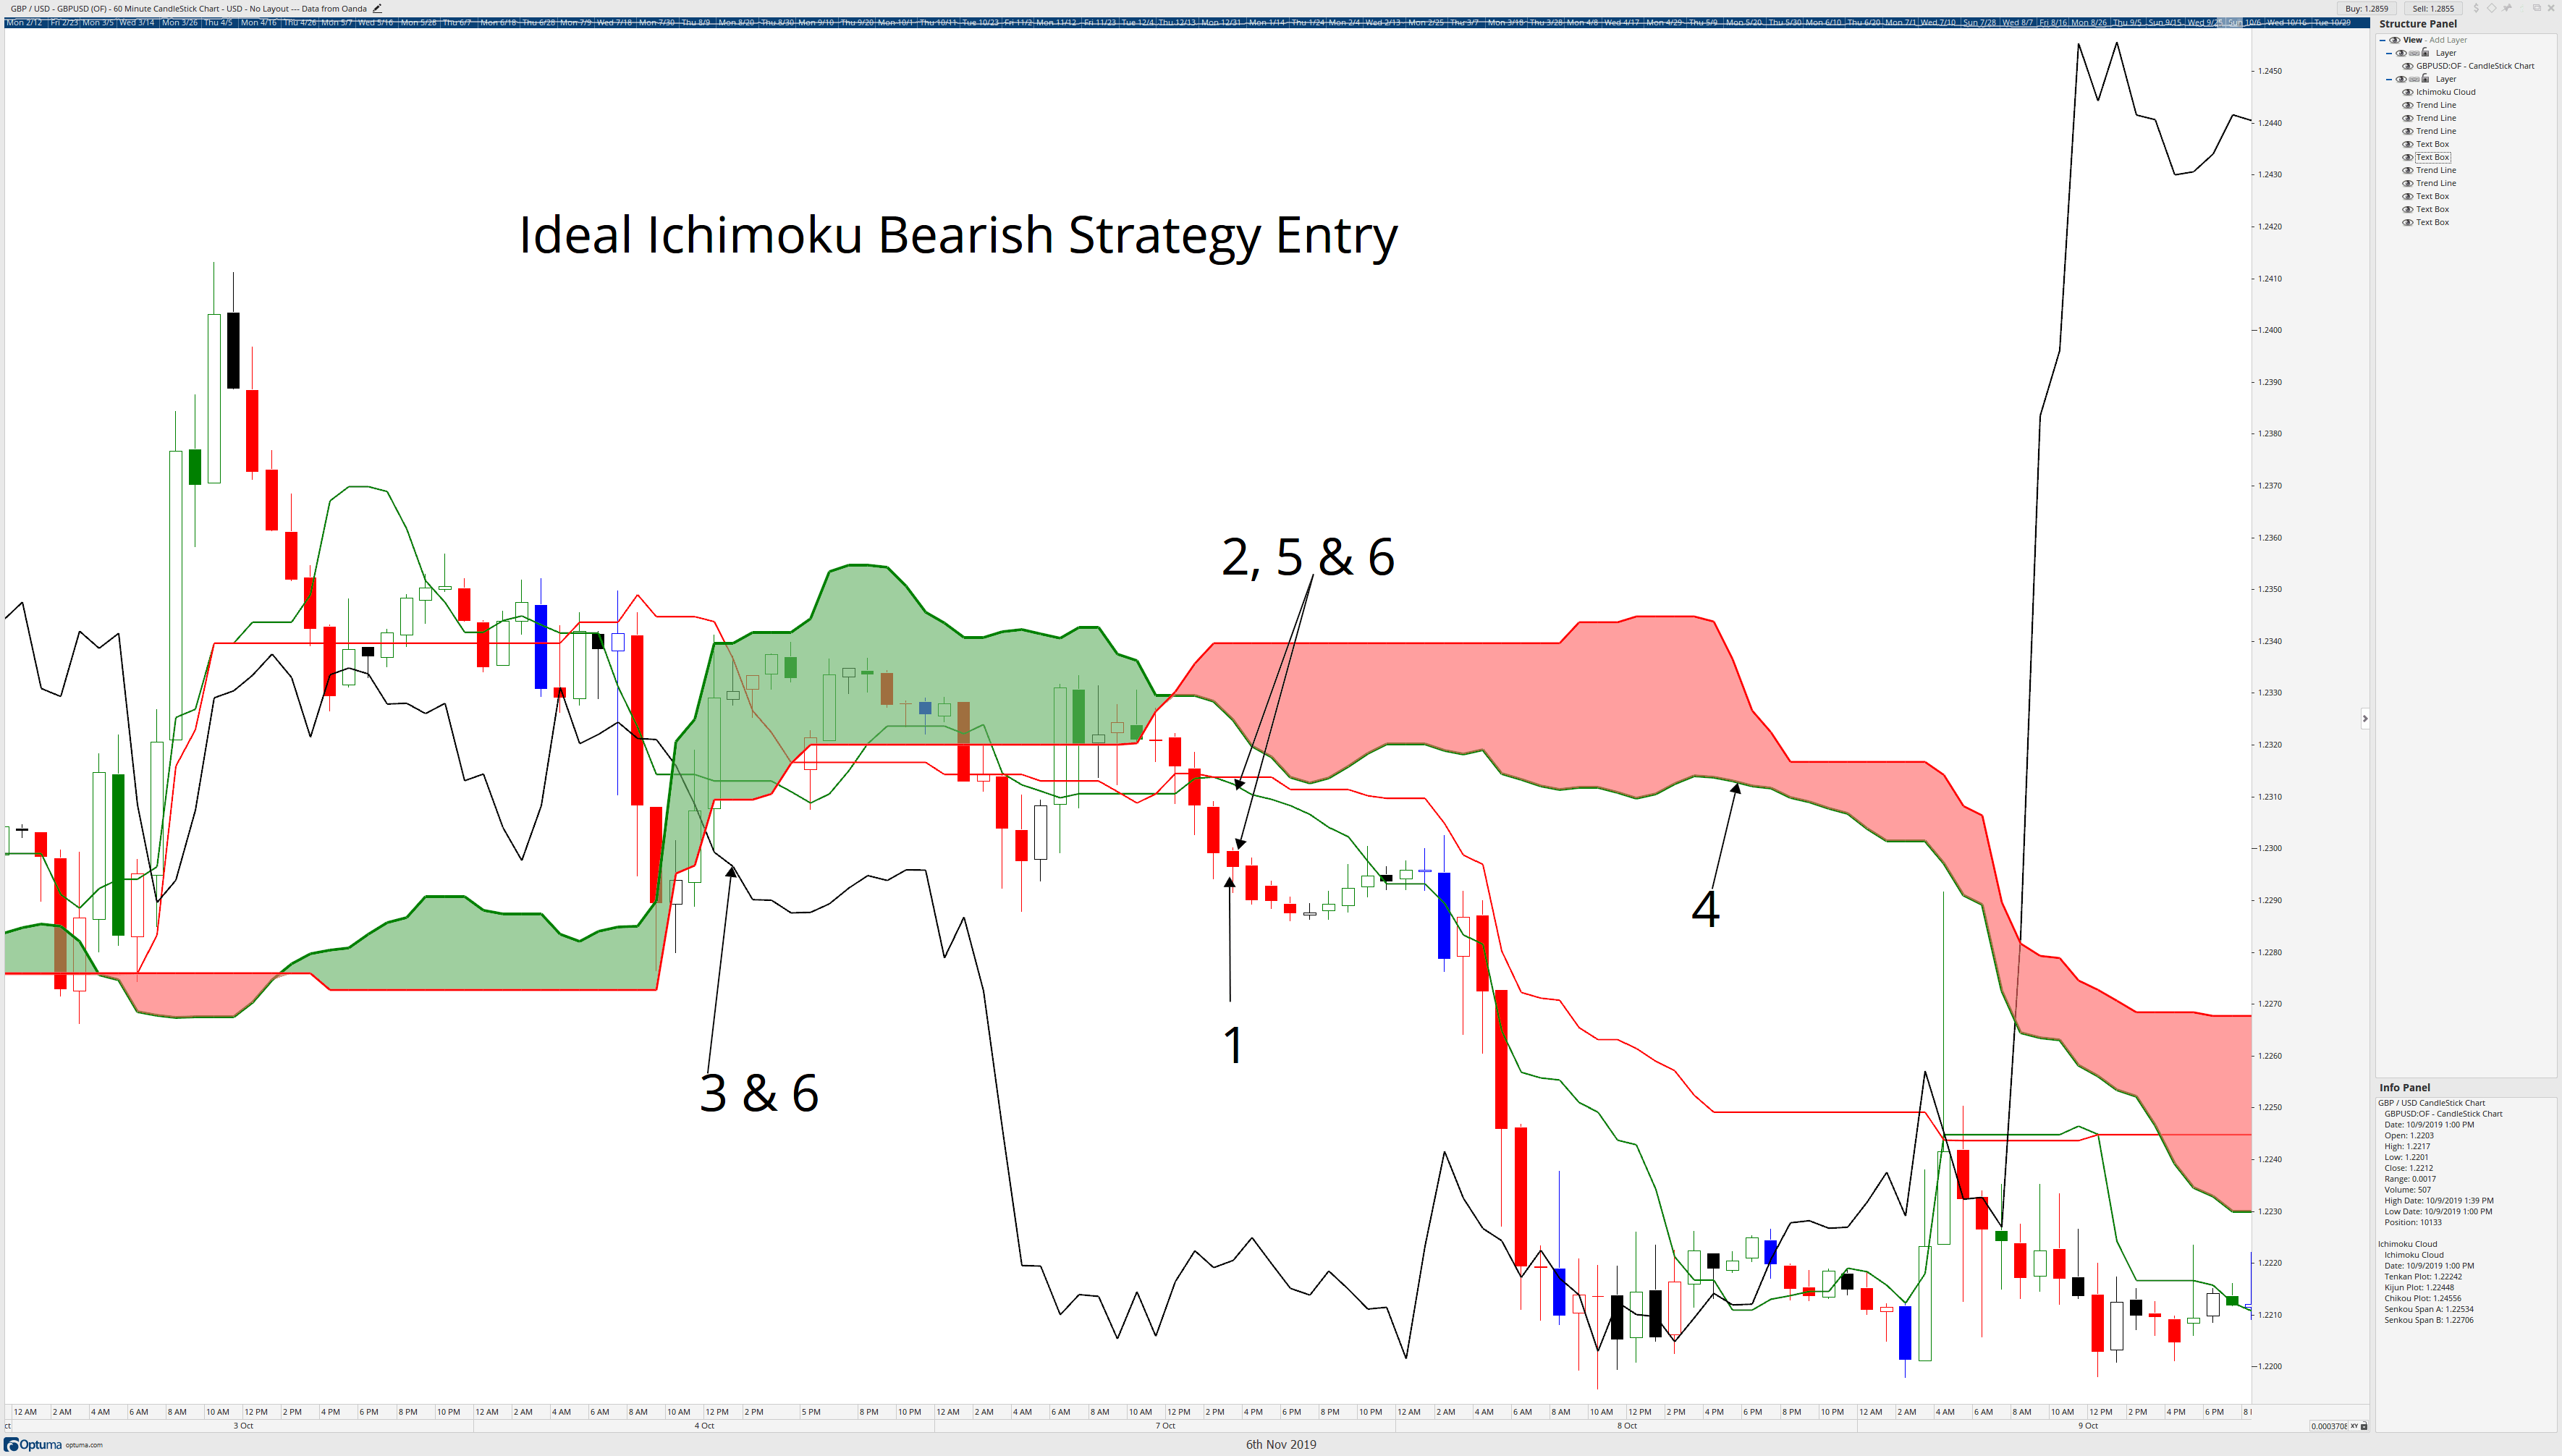
Ideal Ichimoku Bearish Rules
Price below the Cloud.
Tenkan-Sen below Kijun-Sen.
Chikou Span below the candlesticks.
The Future Cloud is ‘red’ – Future Senkou Span A is below Future Senkou Span B.
Price is not far from the Tenkan-Sen or Kijun-Sen.
Tenkan-Sen, Kijun-Sen, and Chikou Span should not be in a thick Cloud.
Bearish Ideal Ichimoku Strategy Entry
Sources: Péloille, Karen. (2017). Trading with Ichimoku: a practical guide to low-risk Ichimoku strategies. Petersfield, Hampshire: Harriman House Ltd.
Patel, M. (2010). Trading with Ichimoku clouds: the essential guide to Ichimoku Kinko Hyo technical analysis. Hoboken, NJ: John Wiley & Sons.
Linton, D. (2010). Cloud charts: trading success with the Ichimoku Technique. London: Updata.
Elliot, N. (2012). Ichimoku charts: an introduction to Ichimoku Kinko Clouds. Petersfield, Hampshire: Harriman House Ltd.
The Ichimoku Kinko Hyo System
When I use the Ichimoku Kinko System in my trading, I can look at a chart and immediately know whether a trade can be taken
Ichimoku Kinko Hyo system
The Ichimoku Kinko Hyo System
When I use the Ichimoku Kinko System in my trading, I can look at a chart and immediately know whether a trade can be taken
The Ichimoku Kinko Hyo System
When I use the Ichimoku Kinko System in my trading, I can look at a chart and immediately know whether a trade can be taken in less than a minute. Ichimoku means, at a glance. Use this system enough, and you will be able to glance at a market and know if a trade is viable or not. What is singularly fascinating about this trading system more than any other is that it encompasses nearly every element of Japanese and Technical Analysis in a single system with just five components. The system measures momentum, volatility, breadth, depth, and even incorporates things we associate with the later part of the 20th century Western analysts like ATR (average true range) and the Bollinger Squeeze (see Bollinger Bands by John Bollinger).
This lesson will be an introduction to the components of the Ichimoku Kinko Hyo system. While Ichimoku is often listed as an indicator in much charting software, it is not an indicator. It is a trading system. It is a trading system made up of 5 indicators.
Books you should own
I loathe the illegal dissemination and downloading of technical analysis literature. One of the significant deterrents for expert traders and analysts in our field from publishing their work is that it is to easily copied and pirated. Additionally, there is a substantial amount of incorrect, incomplete, and false information regarding the Ichimoku system. I am recommending that the books below be on your trading bookshelf. The authors are experts in the field of technical analysis and traders themselves. I am very grateful that they have risked the fruit of their labors from being stolen so that they can share their knowledge for a fair price in a medium that will last for many, many years.
Trading with Ichimoku: a practical guide to low-risk Ichimoku strategies. – Karen Peliolle
Trading with Ichimoku Cloud: the essential guide to Ichimoku Kinko Hyo technical analysis – Manesh Patel
Cloud Charts: trading success with the Ichimoku technique – David Linton
Ichimoku Charts: An introduction to Ichimoku Kinko Cloud – Nicole Elliot
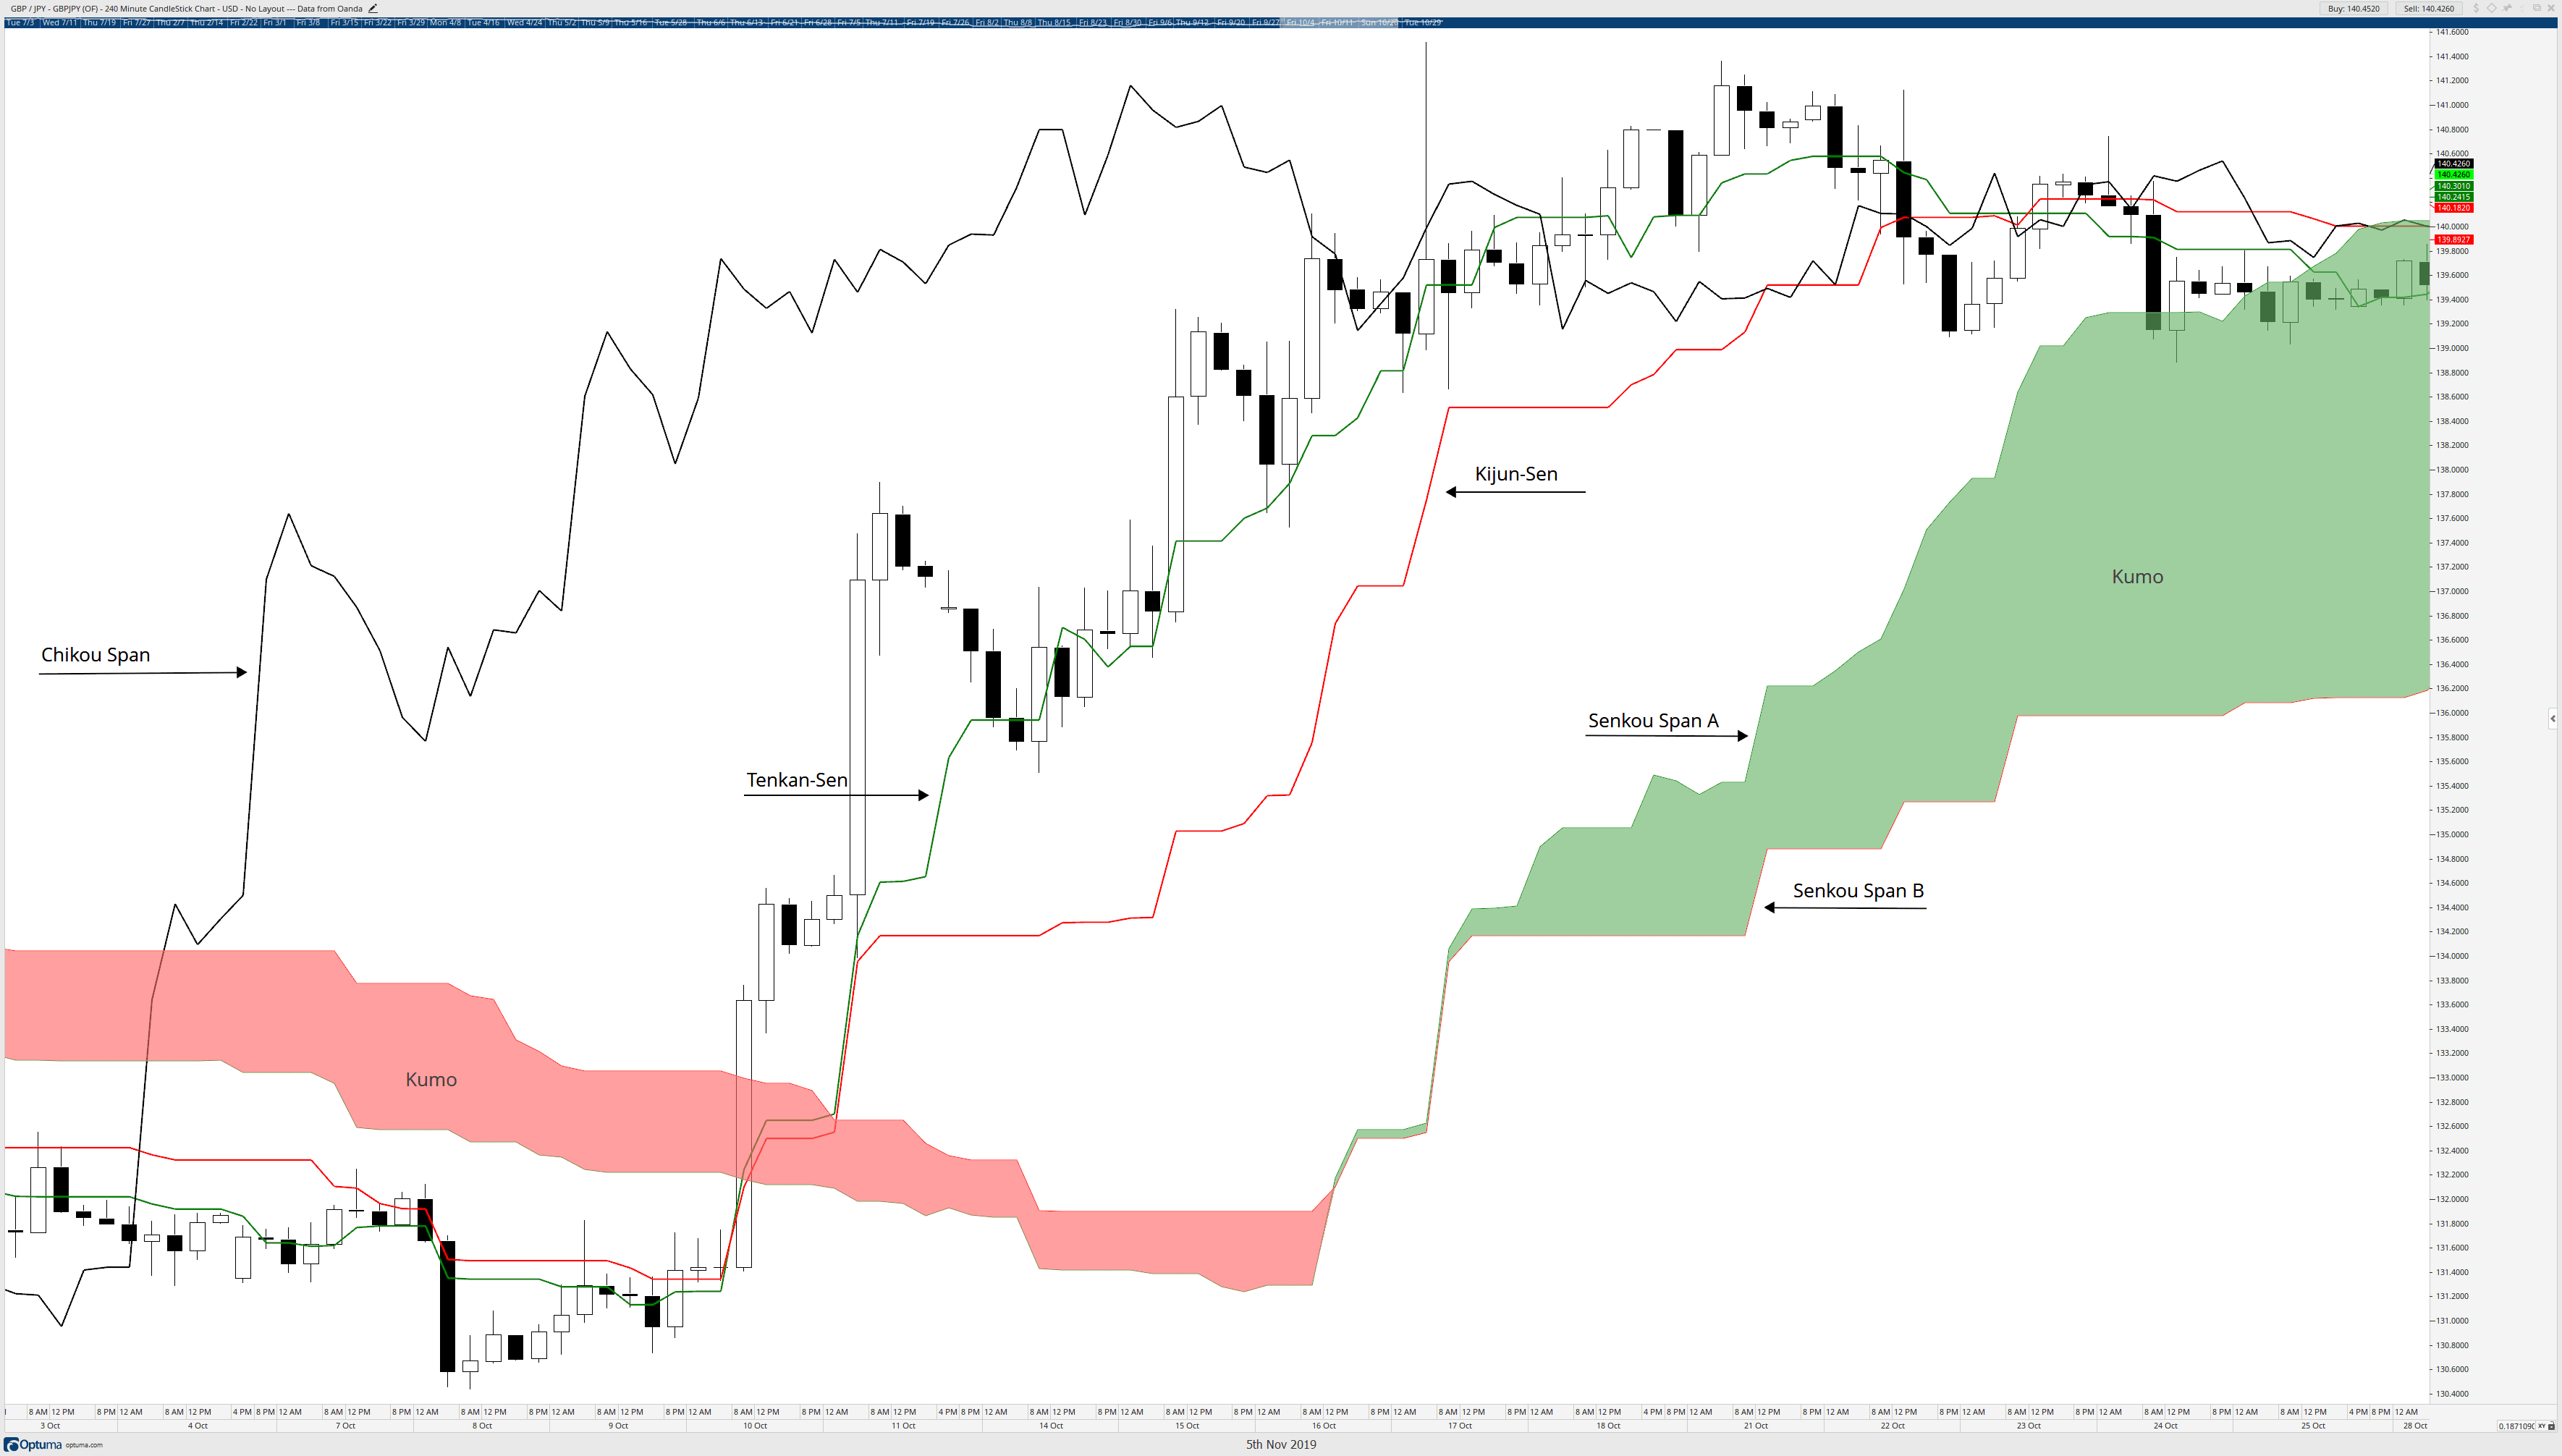
The 5 Components that make up the Ichimoku system
Ichimoku Kinko Hyo system
You will more than likely observe that the system appears to made up of several moving averages. And you would be correct. While I a staunch opponent of the use of any moving average based trading system, the Ichimoku system is an exception. If you remember the first article in this series, I ended it by pointing out the importance of ‘balance’ and ‘equilibrium’ in Japanese technical analysis. This system is a pure form of equilibrium in a market. The moving averages that you will first learn about are the Tenkan-Sen and Kijun-Sen. These are not moving averages calculated using the close of a candlestick. Instead, these moving averages are calculated by determining the highest high and lowest low of a period and then dividing that number by two. The moving average then plots the average of that line. Equilibrium, balance, and the mean is a consistent behavior in this system.
A quick note regarding the nomenclature of this system: Depending on the charting software you are using, the labels for the components will be in Japanese or your native language. For traders utilizing the beginners trading software of TradingView, TradingView utilizes the non-Japanese labels. I will be using the Japanese names. I believe it is essential that you learn to use the Japanese titles for these five components.
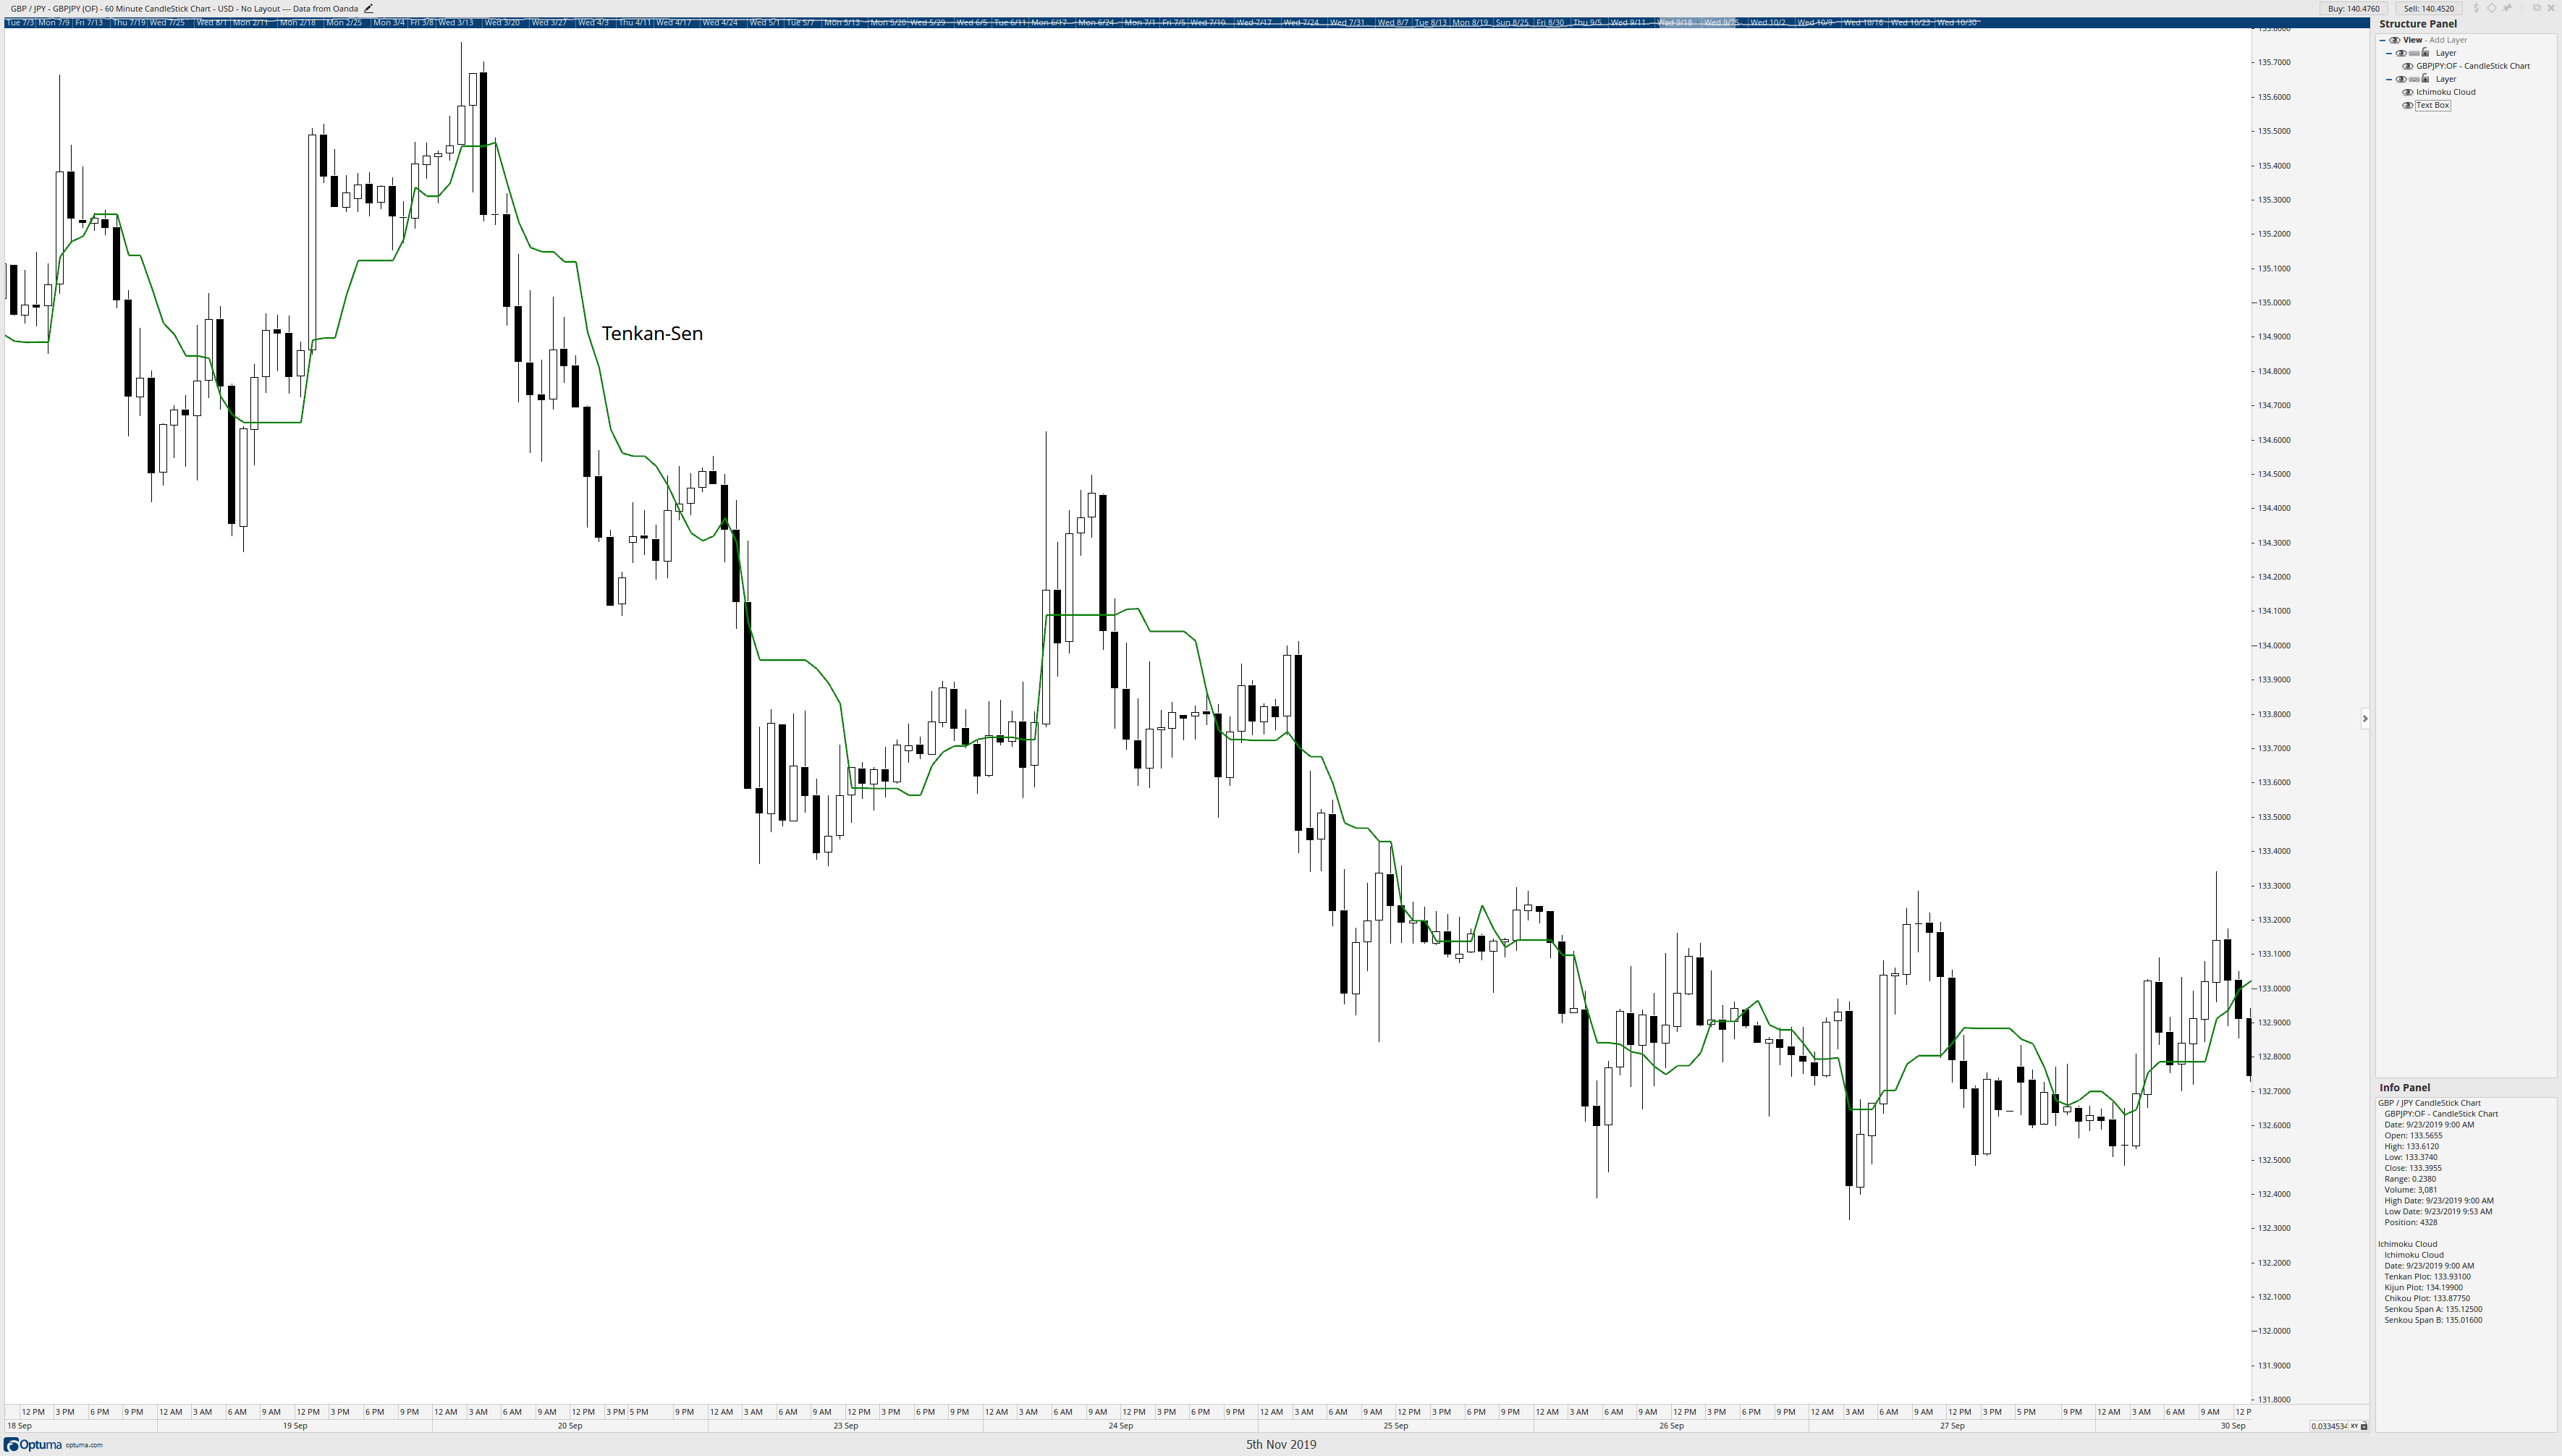
The first component of the Ichimoku Kinko system is the Tenkan-Sen. The Tenkan-Sen is the fastest and weakest line of the Ichimoku system. It is a 9-period moving average that is plotted by adding the highest high and lowest low of the last 9-periods and then dividing that number by two.
Key Points
Price should not be very far away from the Tenkan-Sen.
If price and the Tenkan-Sen are both moving close together (up or down), then this means there is little volatility, and the move may be very persistent. Do not trade against an instrument that is displaying this behavior.
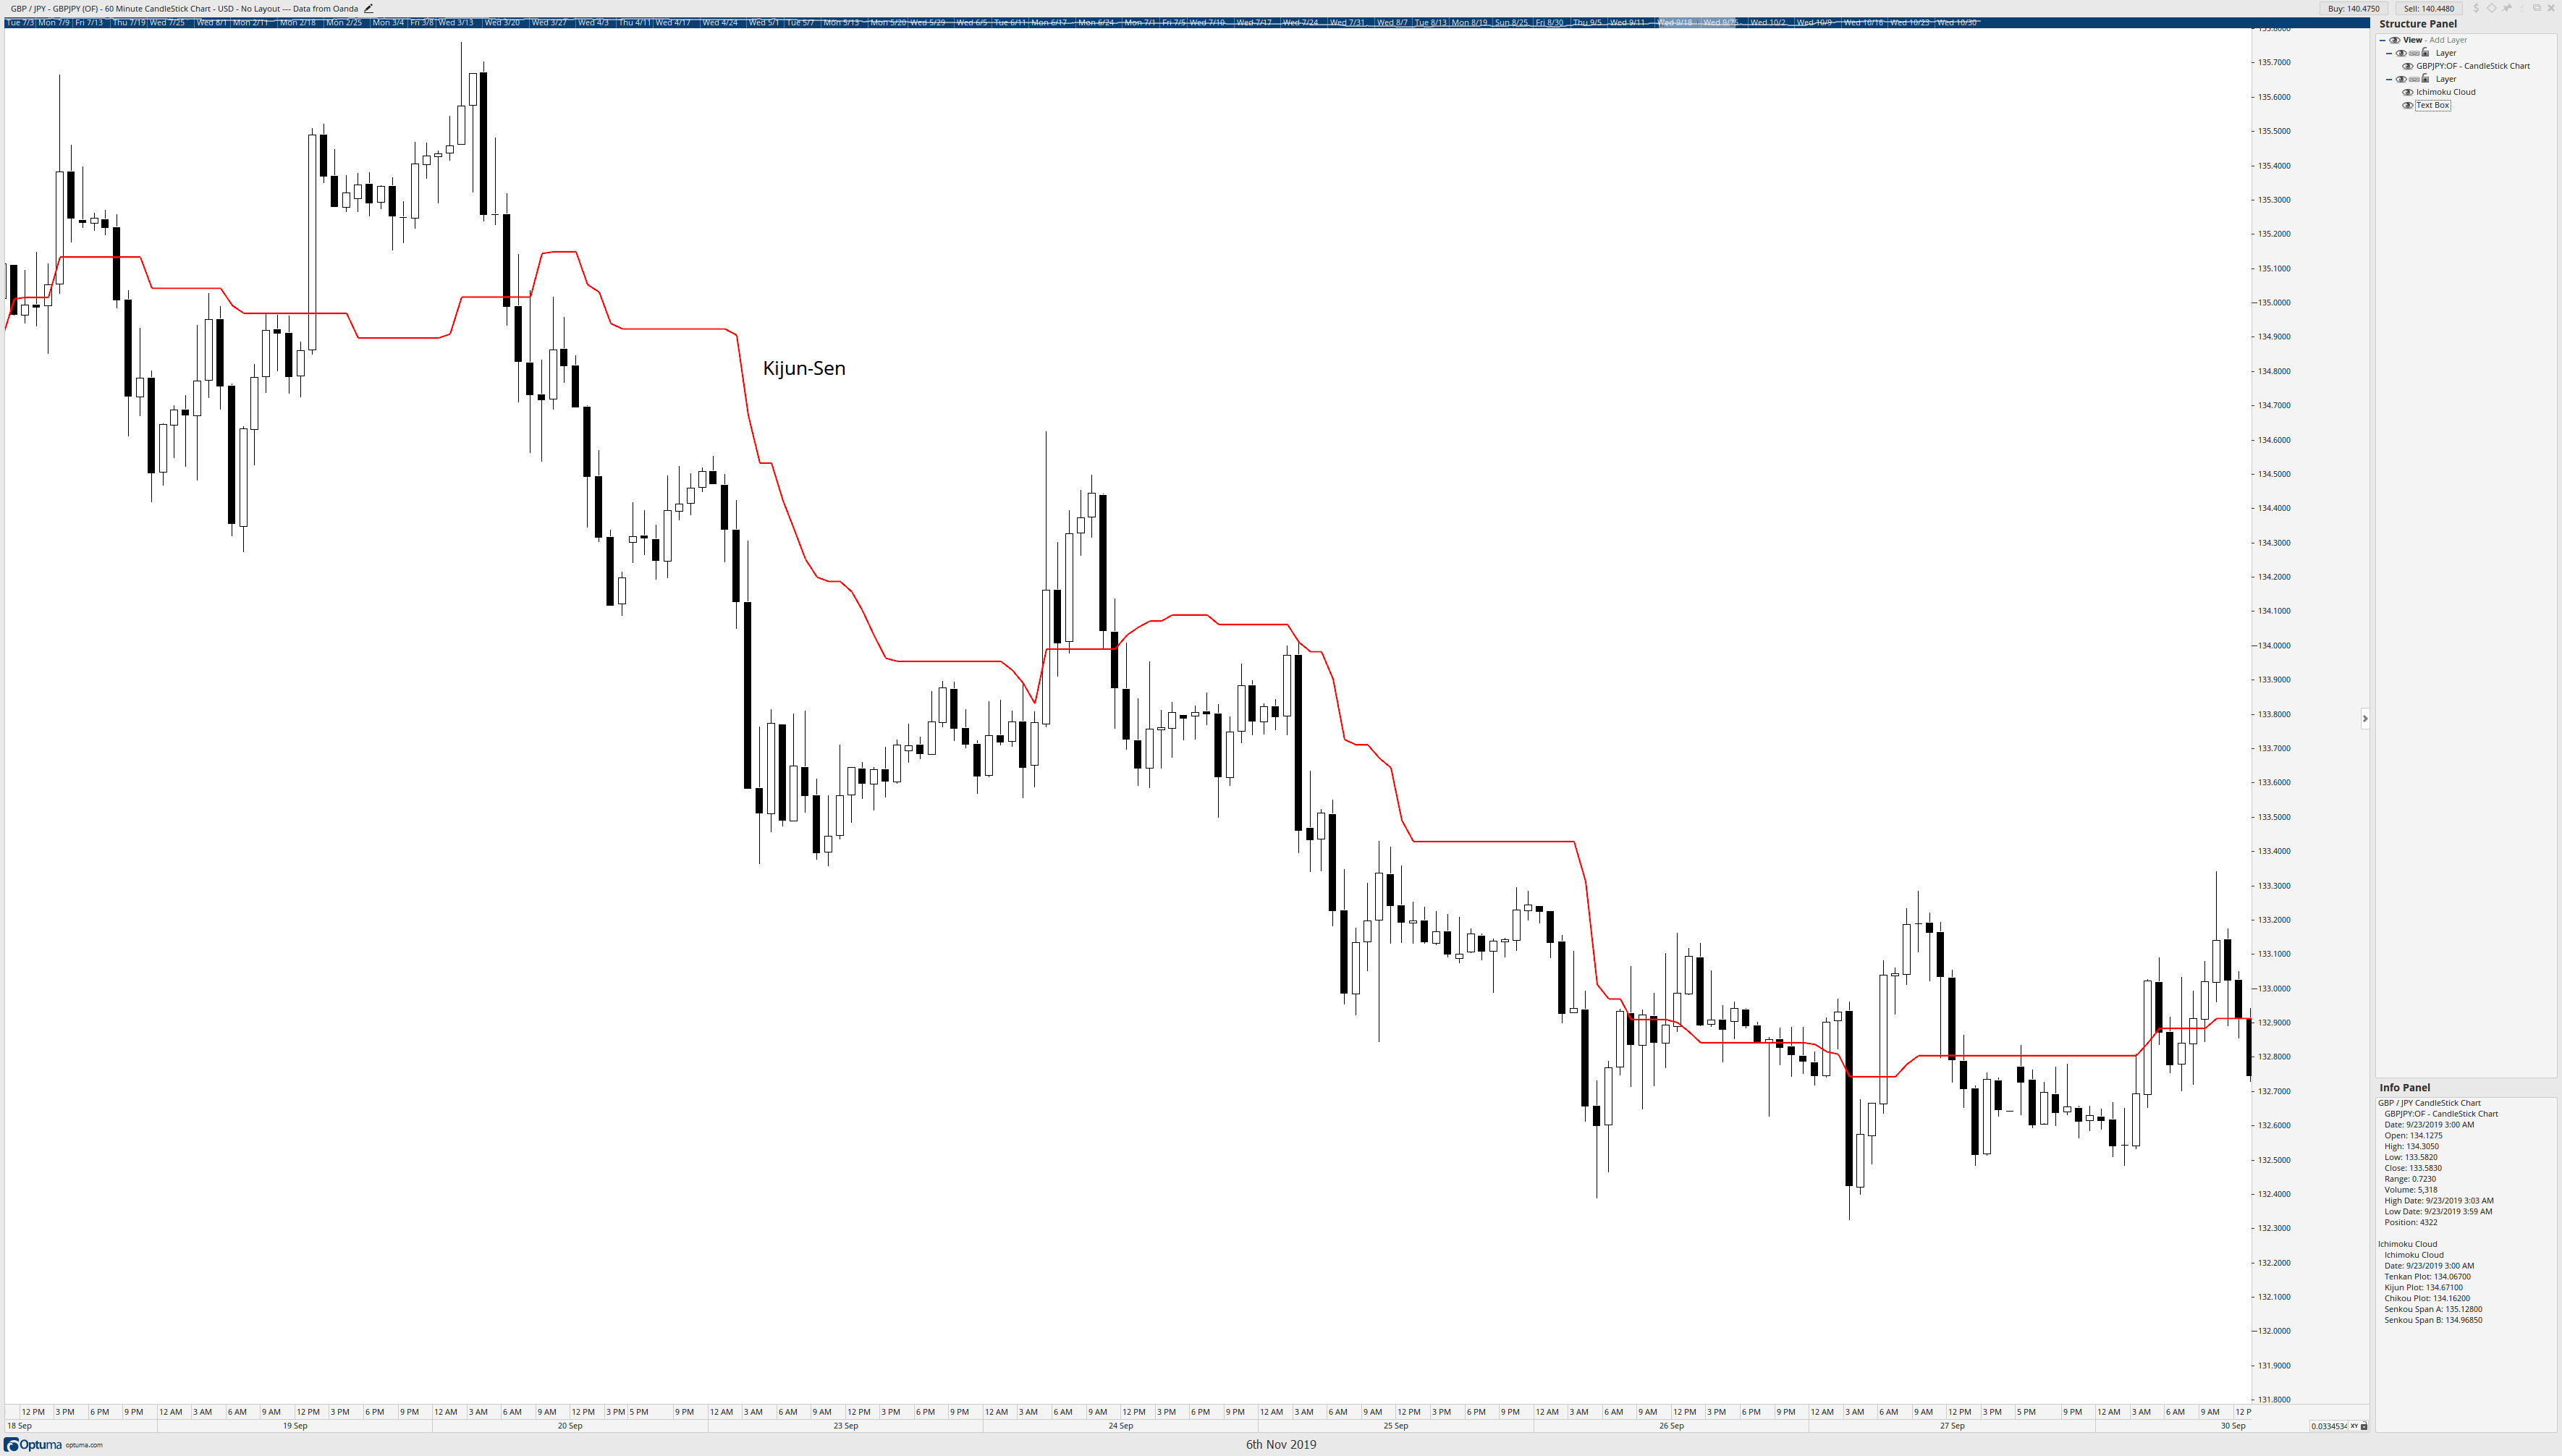
Kijun-Sen (Base Line)
Kijun-Sen
The second component of the Ichimoku Kinko Hyo system is the Kijun-Sen. The Kijun-Sen represents medium-term movement and equilibrium. It is a 26-period moving average that is plotted by adding the highest high and lowest low of the last 26-periods and then dividing that number by two.
Key Points
Many entry and exit signals are derived from the Kijun-Sen (Peliolle).
Price should not be very far away from the Kijun-Sen
Use an ATR x2 to gauge how far is ‘too far.’ (Patel)
Ichimoku trader Jon Morgan suggests identifying what calls ‘max mean.’ This is done by recording the last 17 major highs and lows away from the Kijun-Sen, adding those values together, and then divide by 17. If price gets close to that number of pips/ticks/points away from the Kijun-Sen, it will more than likely snap back to the Kijun-Sen or range until the averages catch up. (Morgan)
The T-K Cross and the relationship of the Tenkan-Sen with the Kijun-Sen
The Tenkan-Sen and Kijun-Sen represent the market’s pulse. The Tenkan-Sen indicates price volatility and the strength of a given movement through its slope. The Kijun-Sen establishes levels upon which equilibrium occurs, calling back prices when a state of disequilibrium can no longer sustain itself. (Peliolle)
Key Points
Crosses of the Tenkan-Sen and Kijun-Sen are not a signal.
In Forex markets, Morgan suggests that crosses may be an essential signal but only on daily and higher charts (3-day, Weekly, Monthly, etc.). This is especially true if there has been a significant amount of time since the last T-K Cross occurred. It can be an early warning sign of an impending corrective move or trend change. (Morgan)
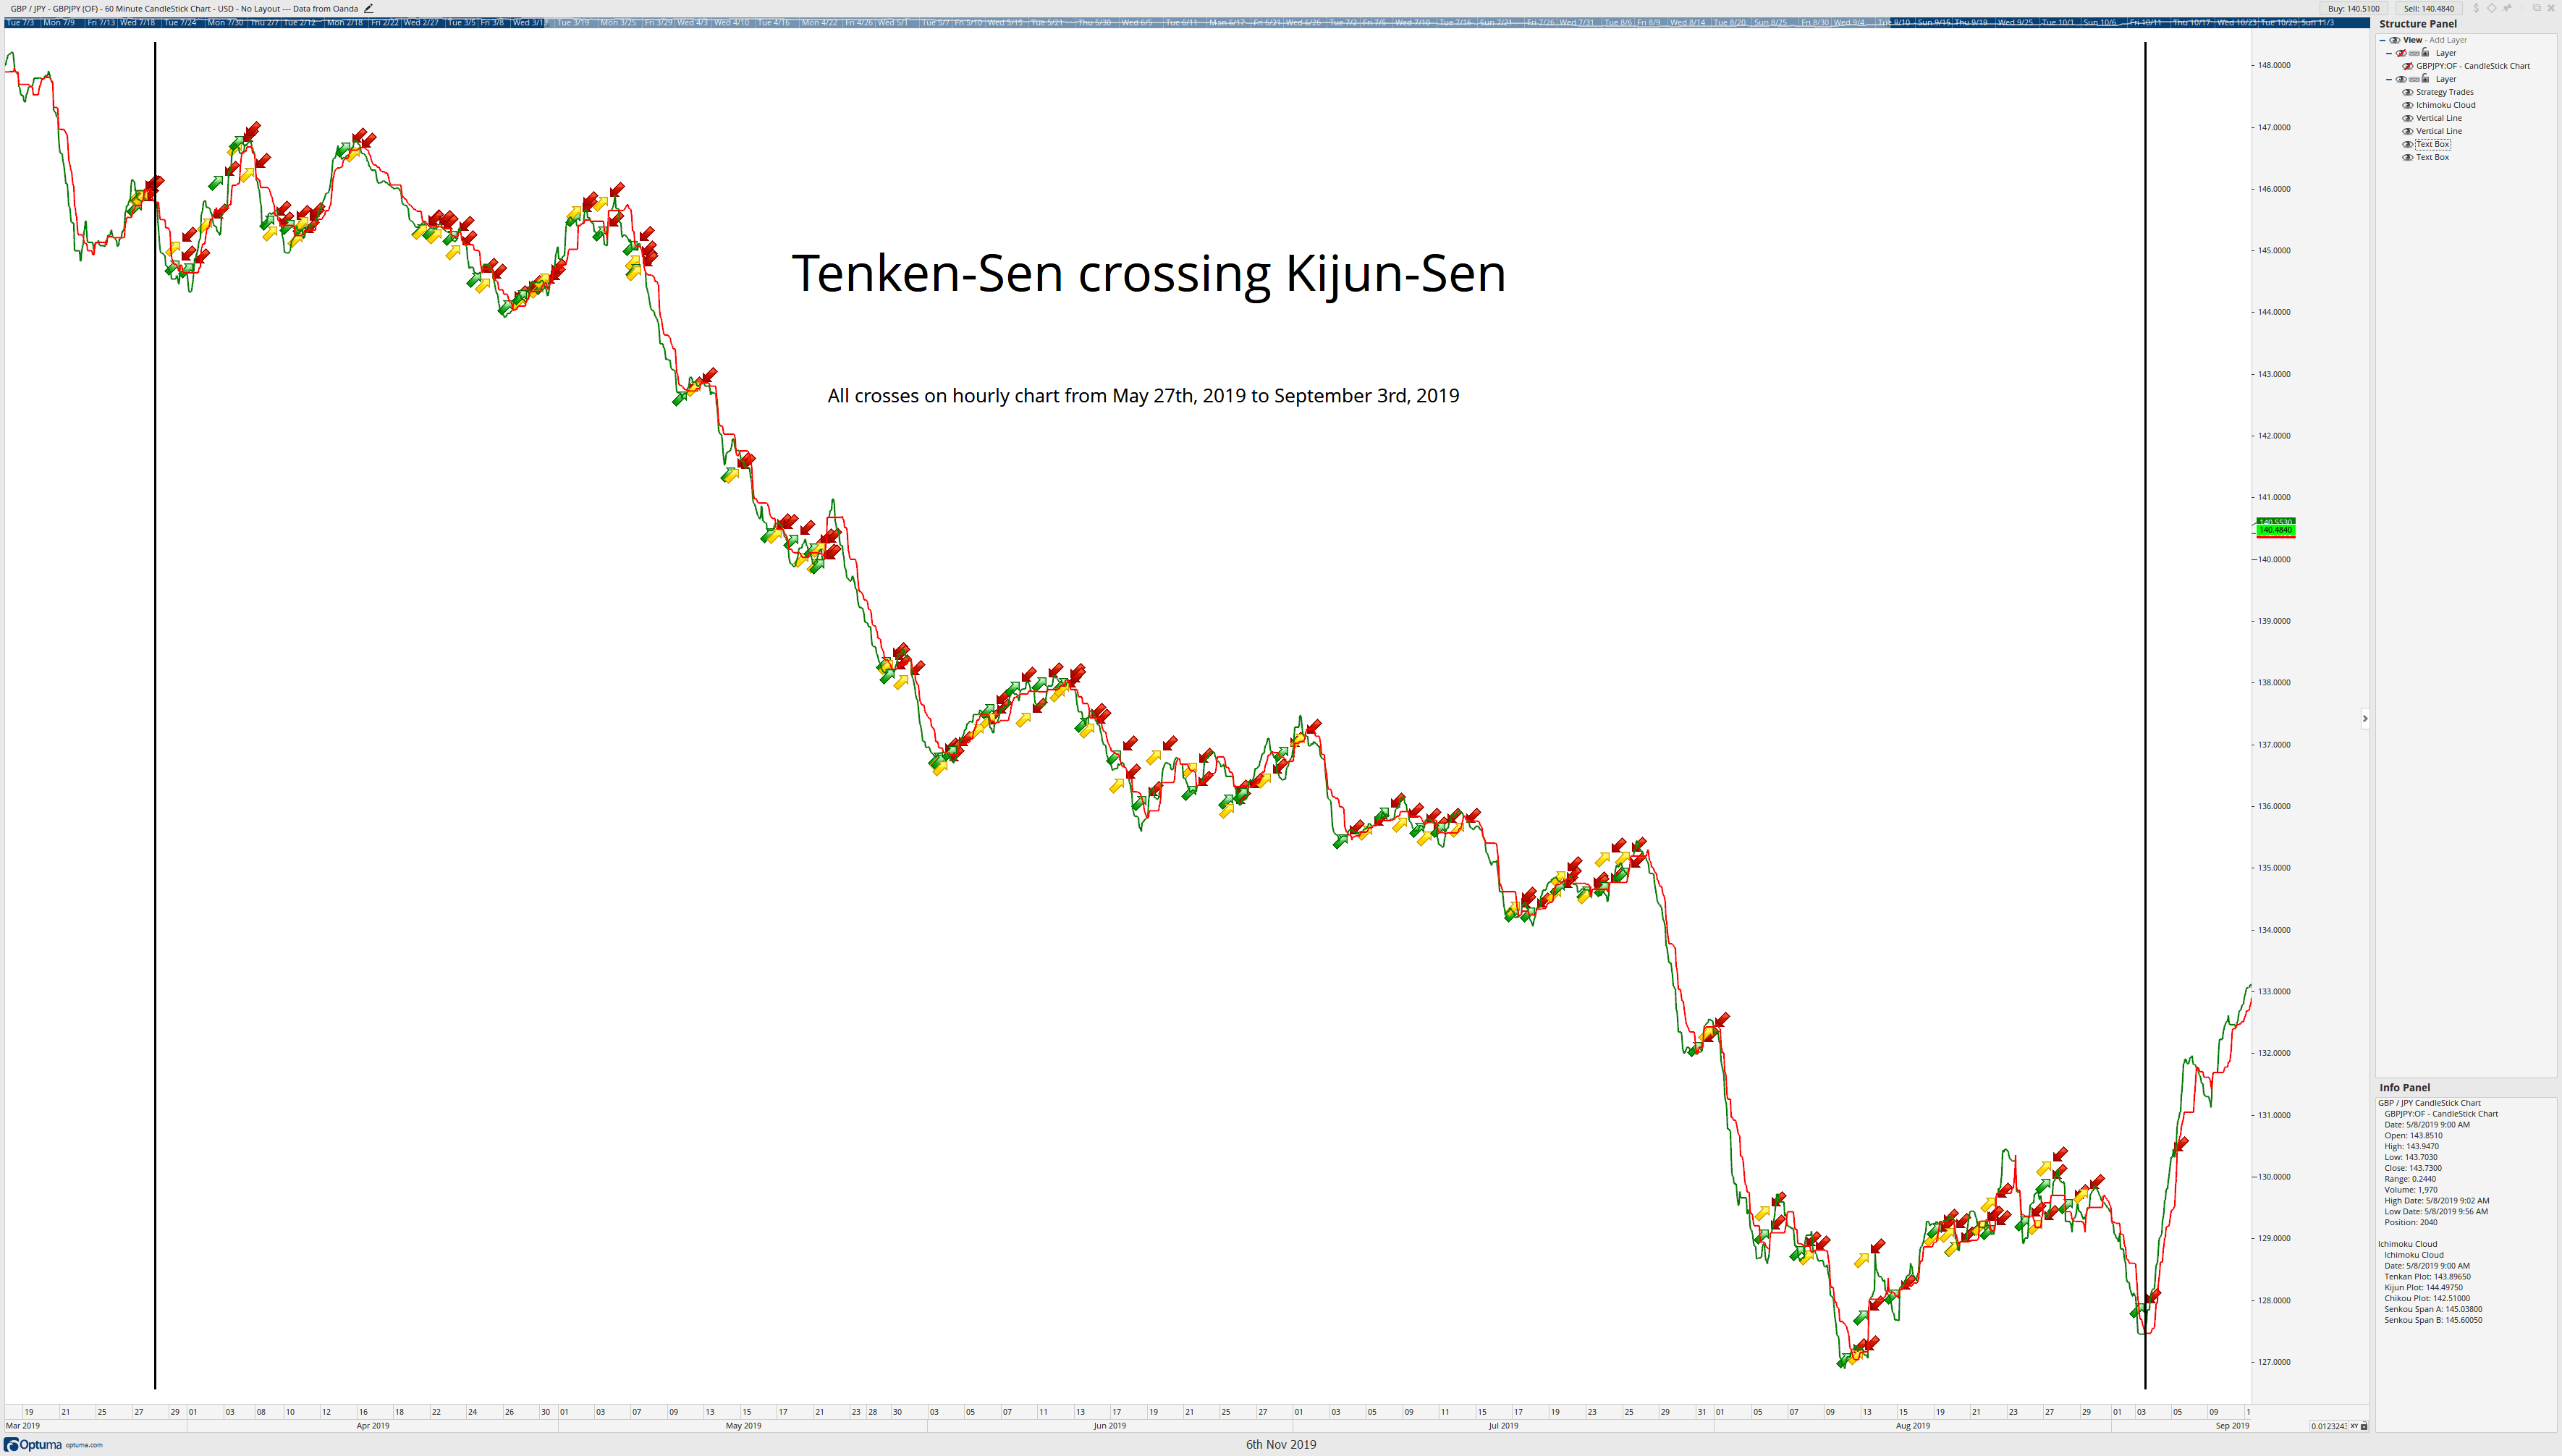
TKCross
The chart above is the hourly chart for GBPJPY. The black vertical lines delineate a test period that records when the Tenkan-Sen crosses the Kijun-Sen. You can see how many whipsaws and trades you would have taken (136 to be exact). Compare that to the daily chart below and how important T-K crosses are when there is a significant gap between the last cross.
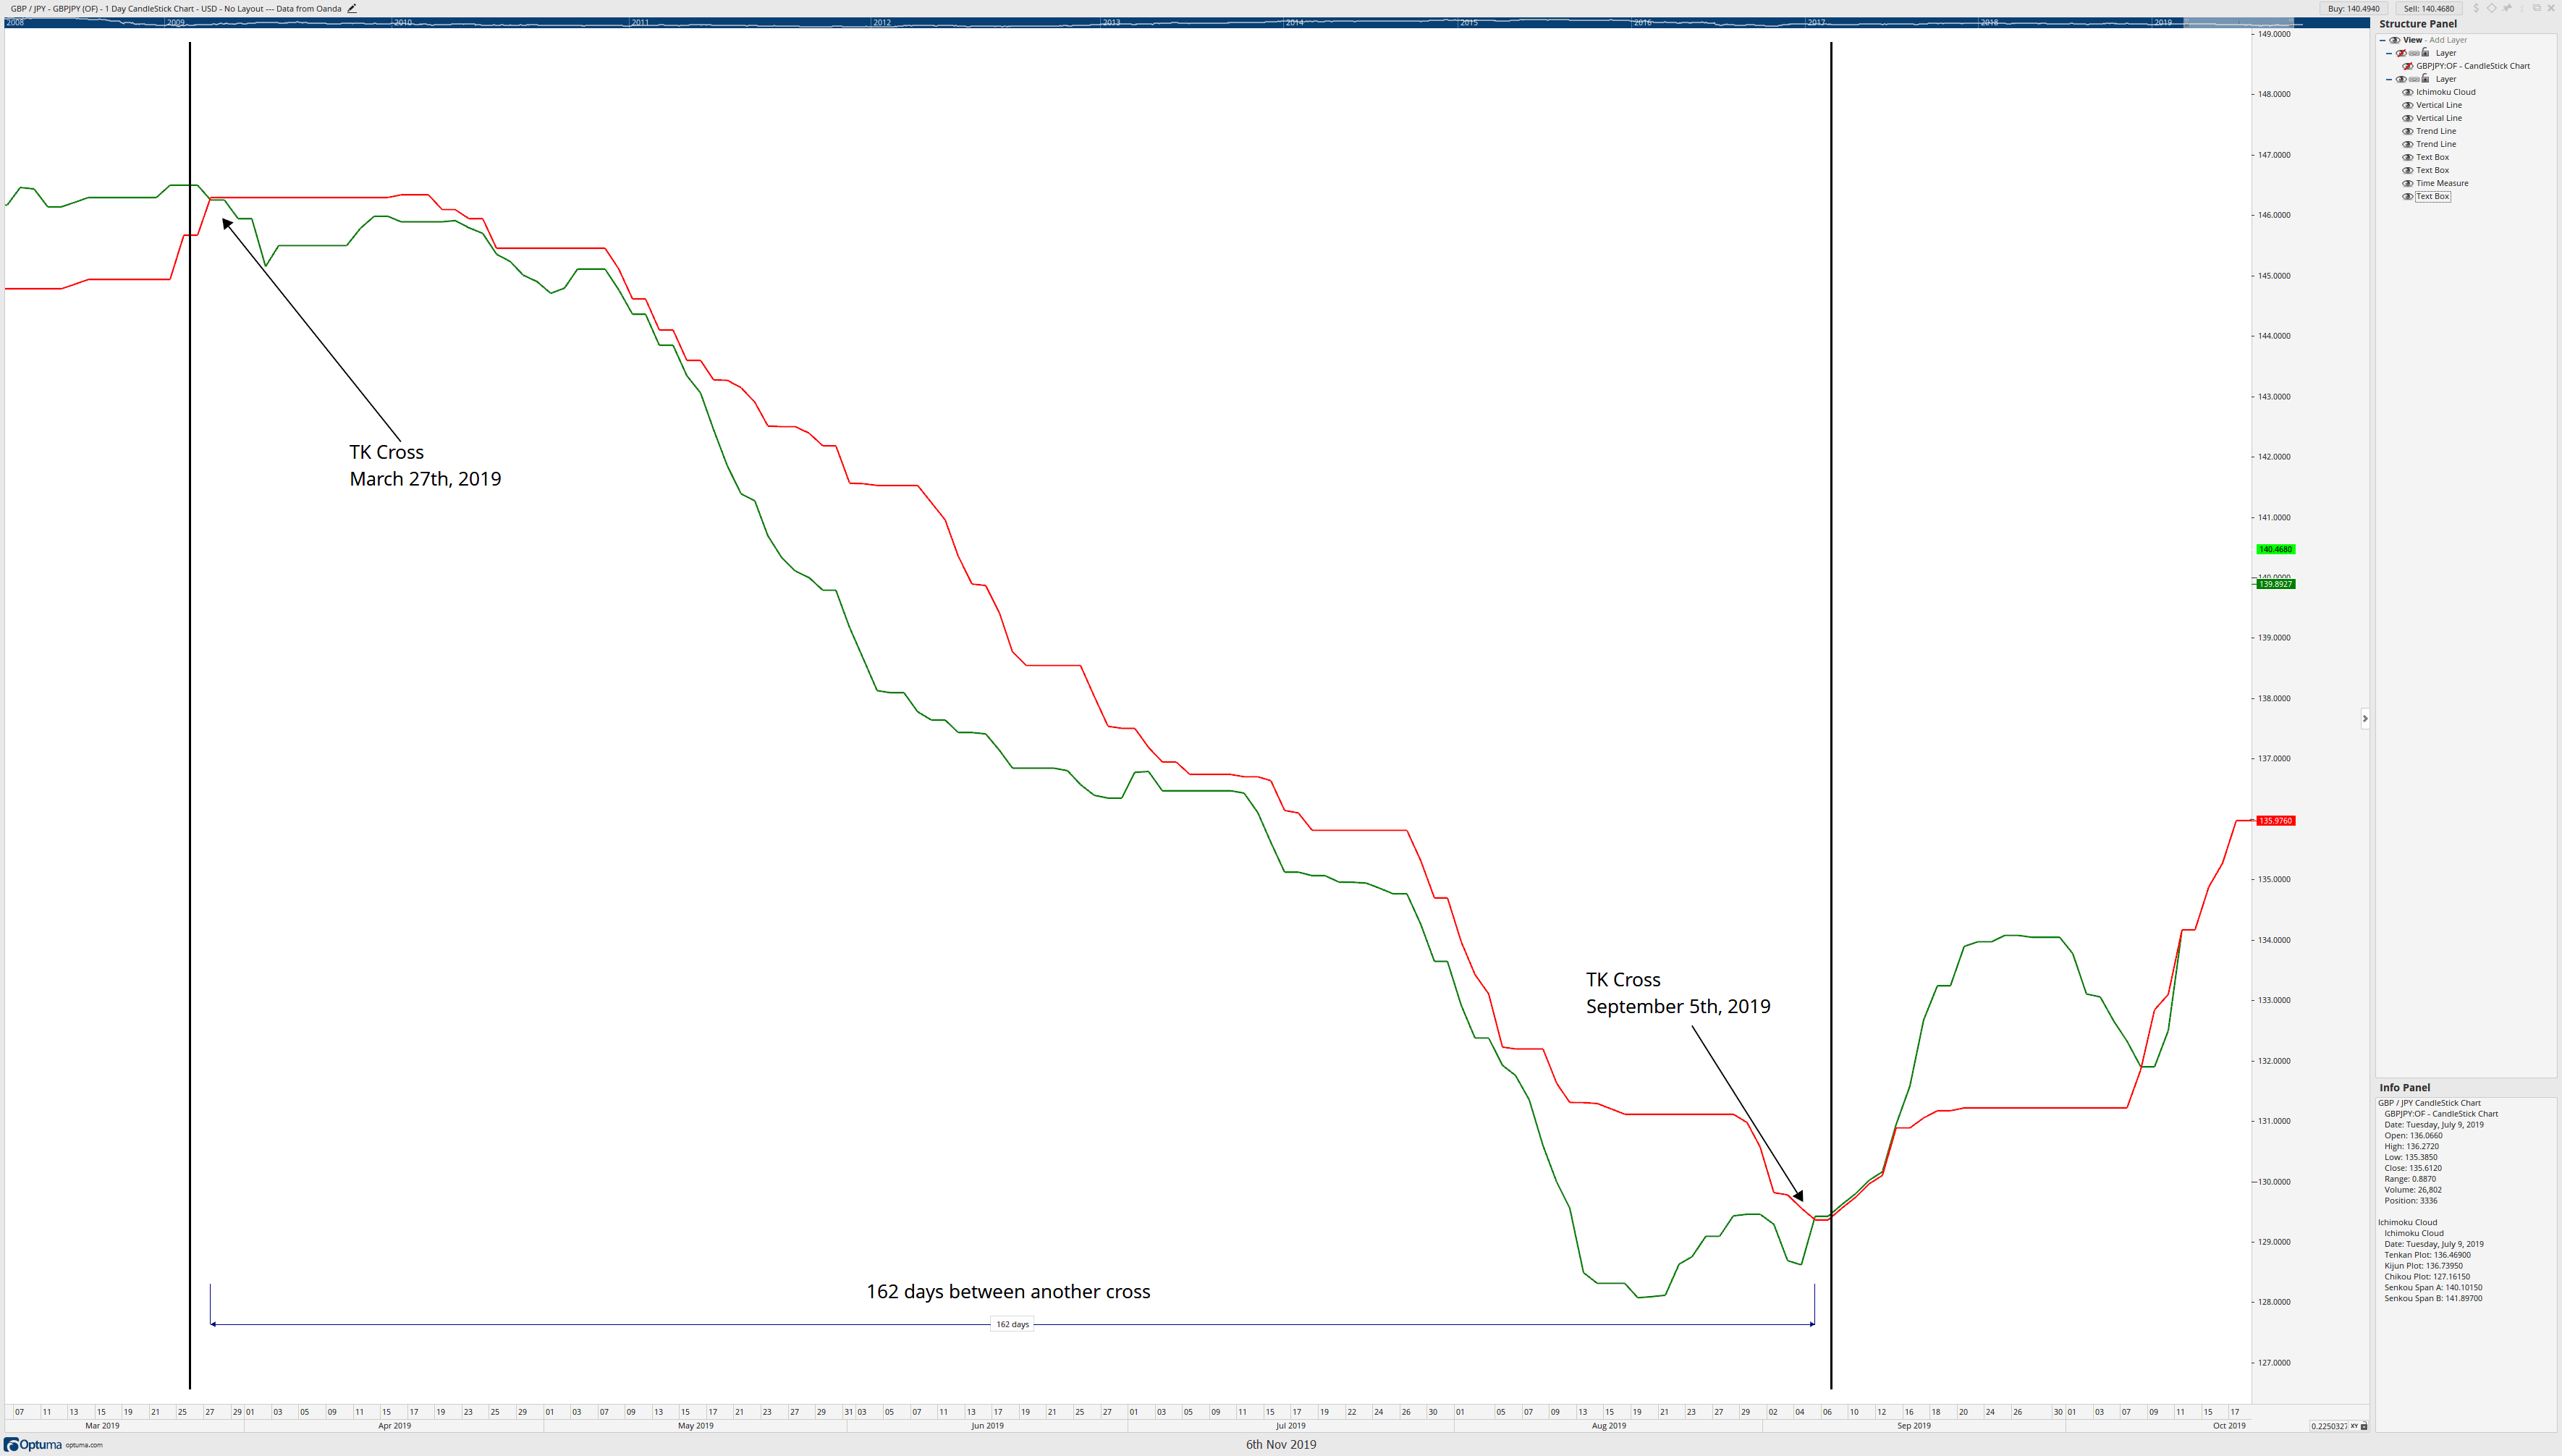
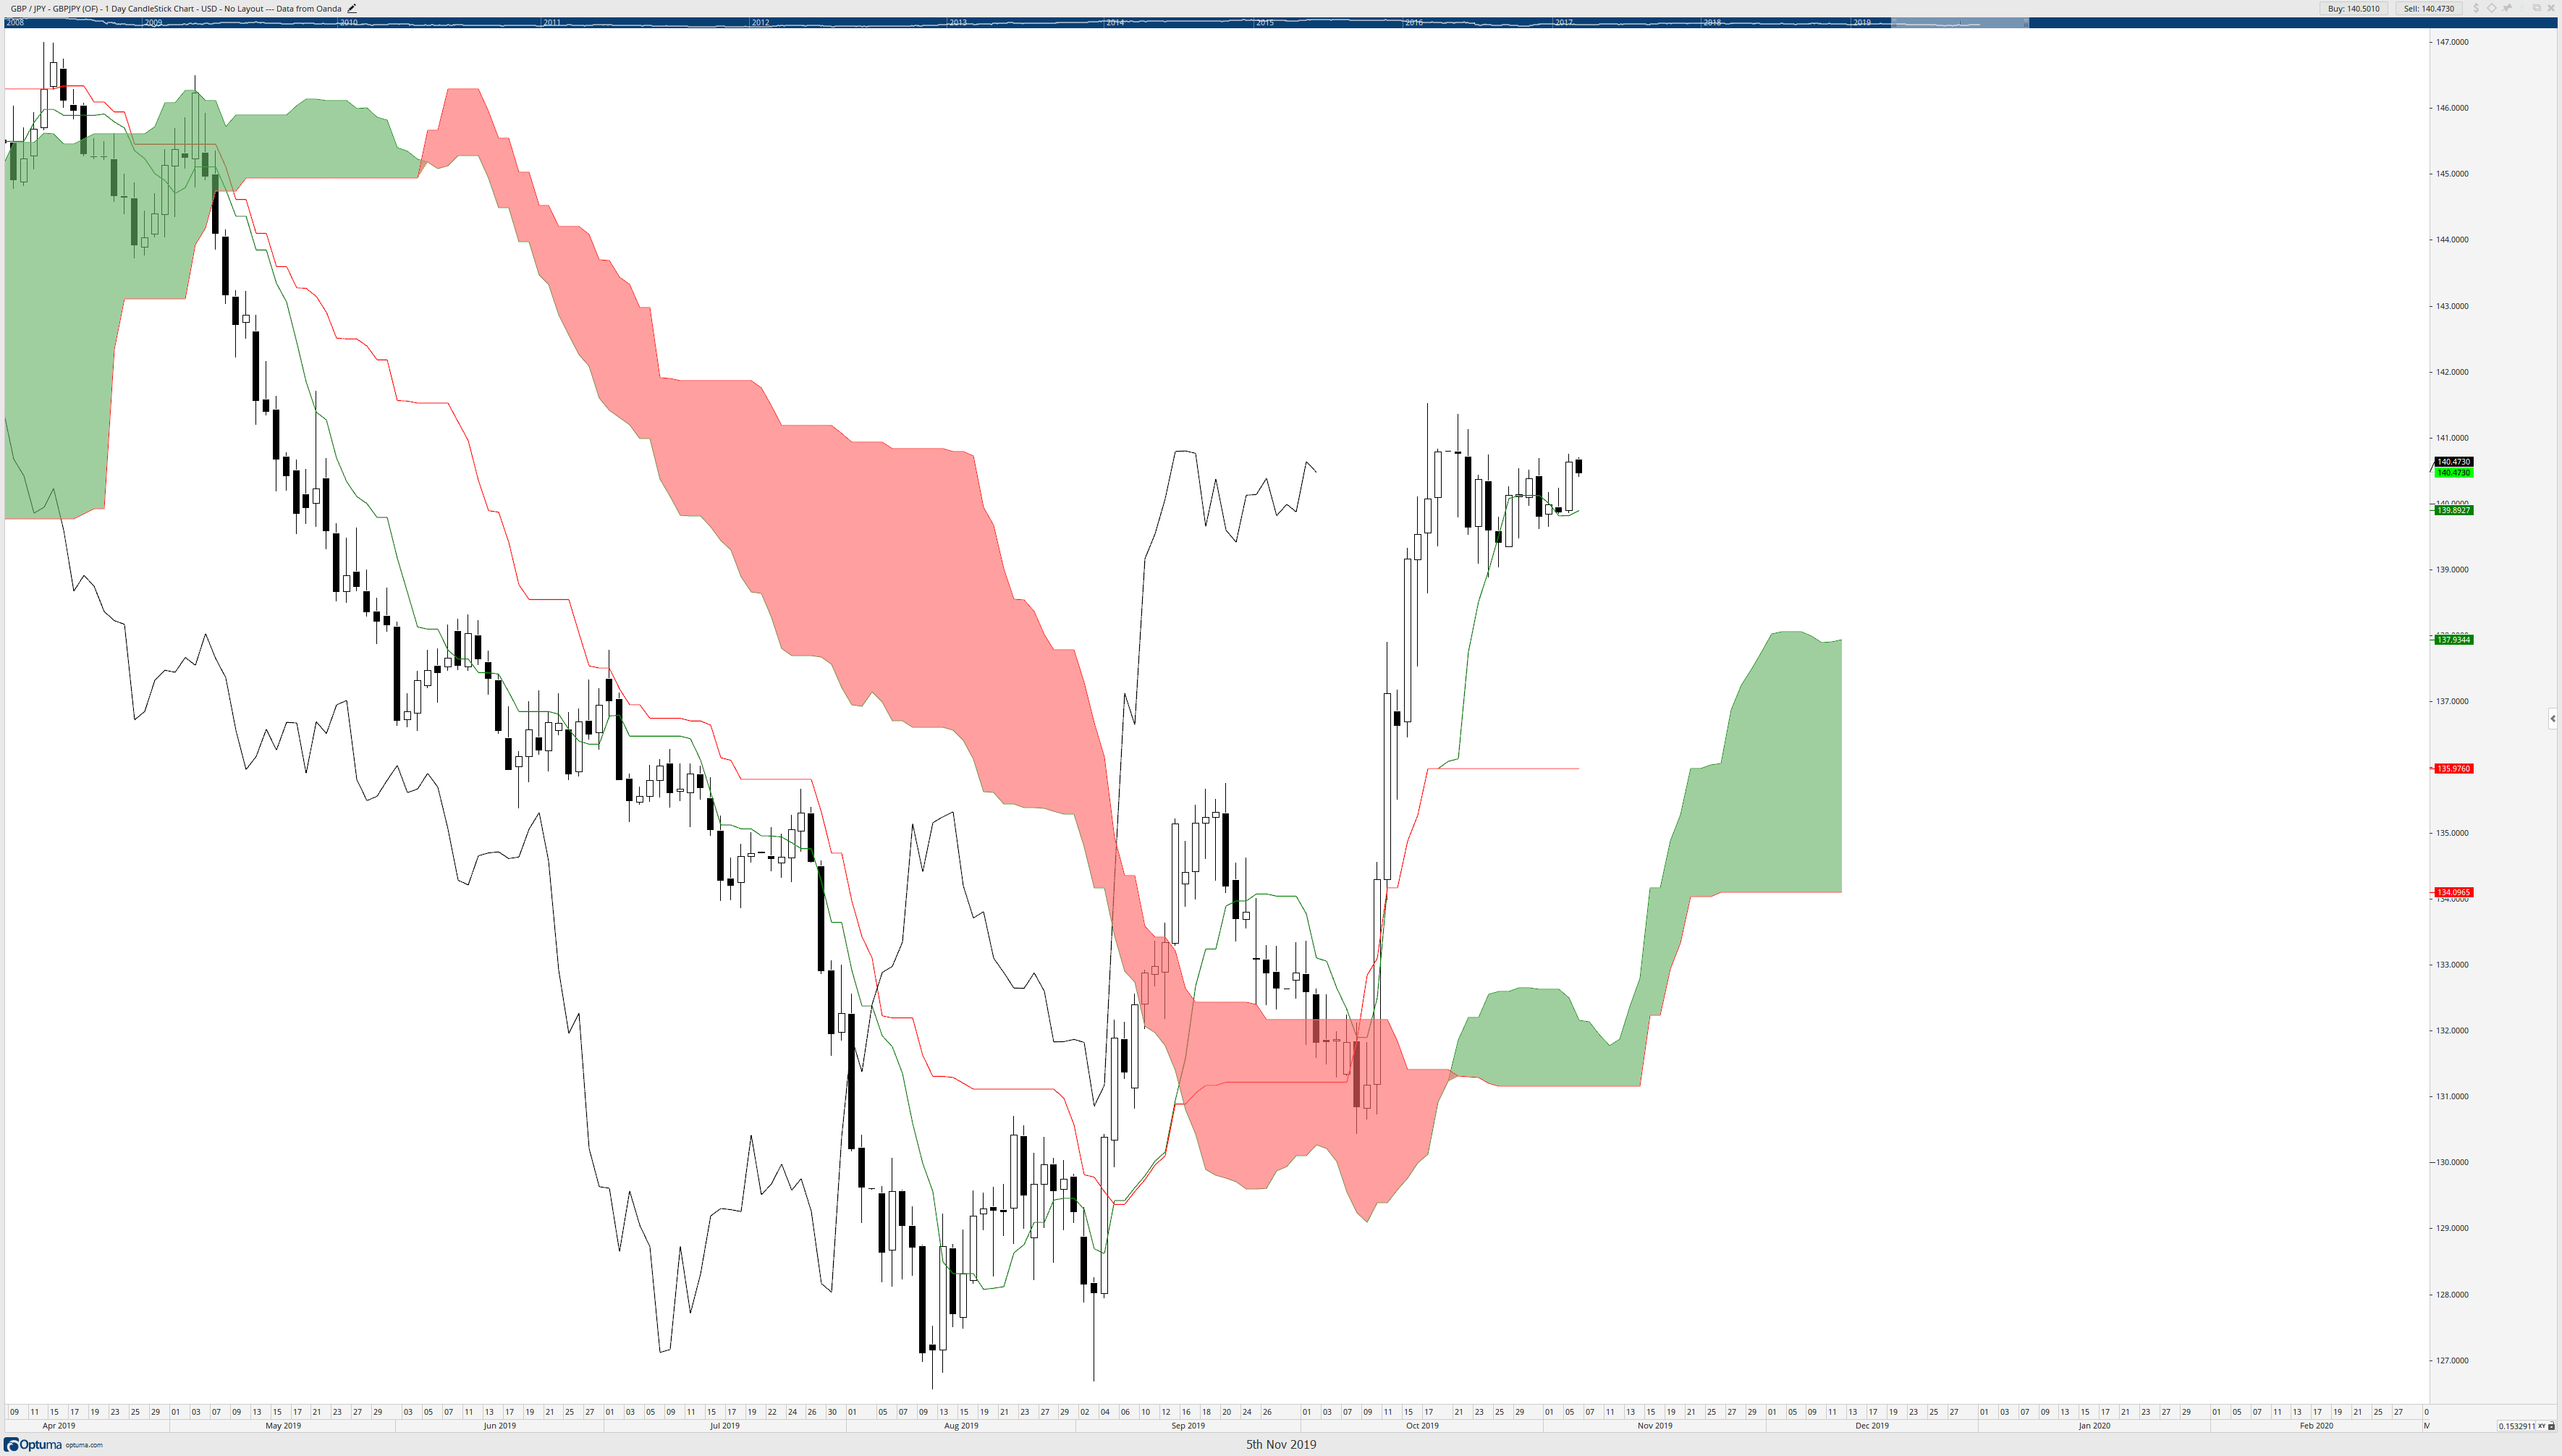
Daily TK Cross
You can see that the difference in time between these two crosses is significant. From the Tenkan-Sen crossing below the Kijun-Sen on March 27th, 2019, it took 162 calendar days before the Tenkan-Sen crossed above the Kijun-Sen on September 6th, 2019.
The Kumo (Cloud) – Senkou Span A and Senkou Span B
The Cloud – Senkou Span A and Senkou Span B
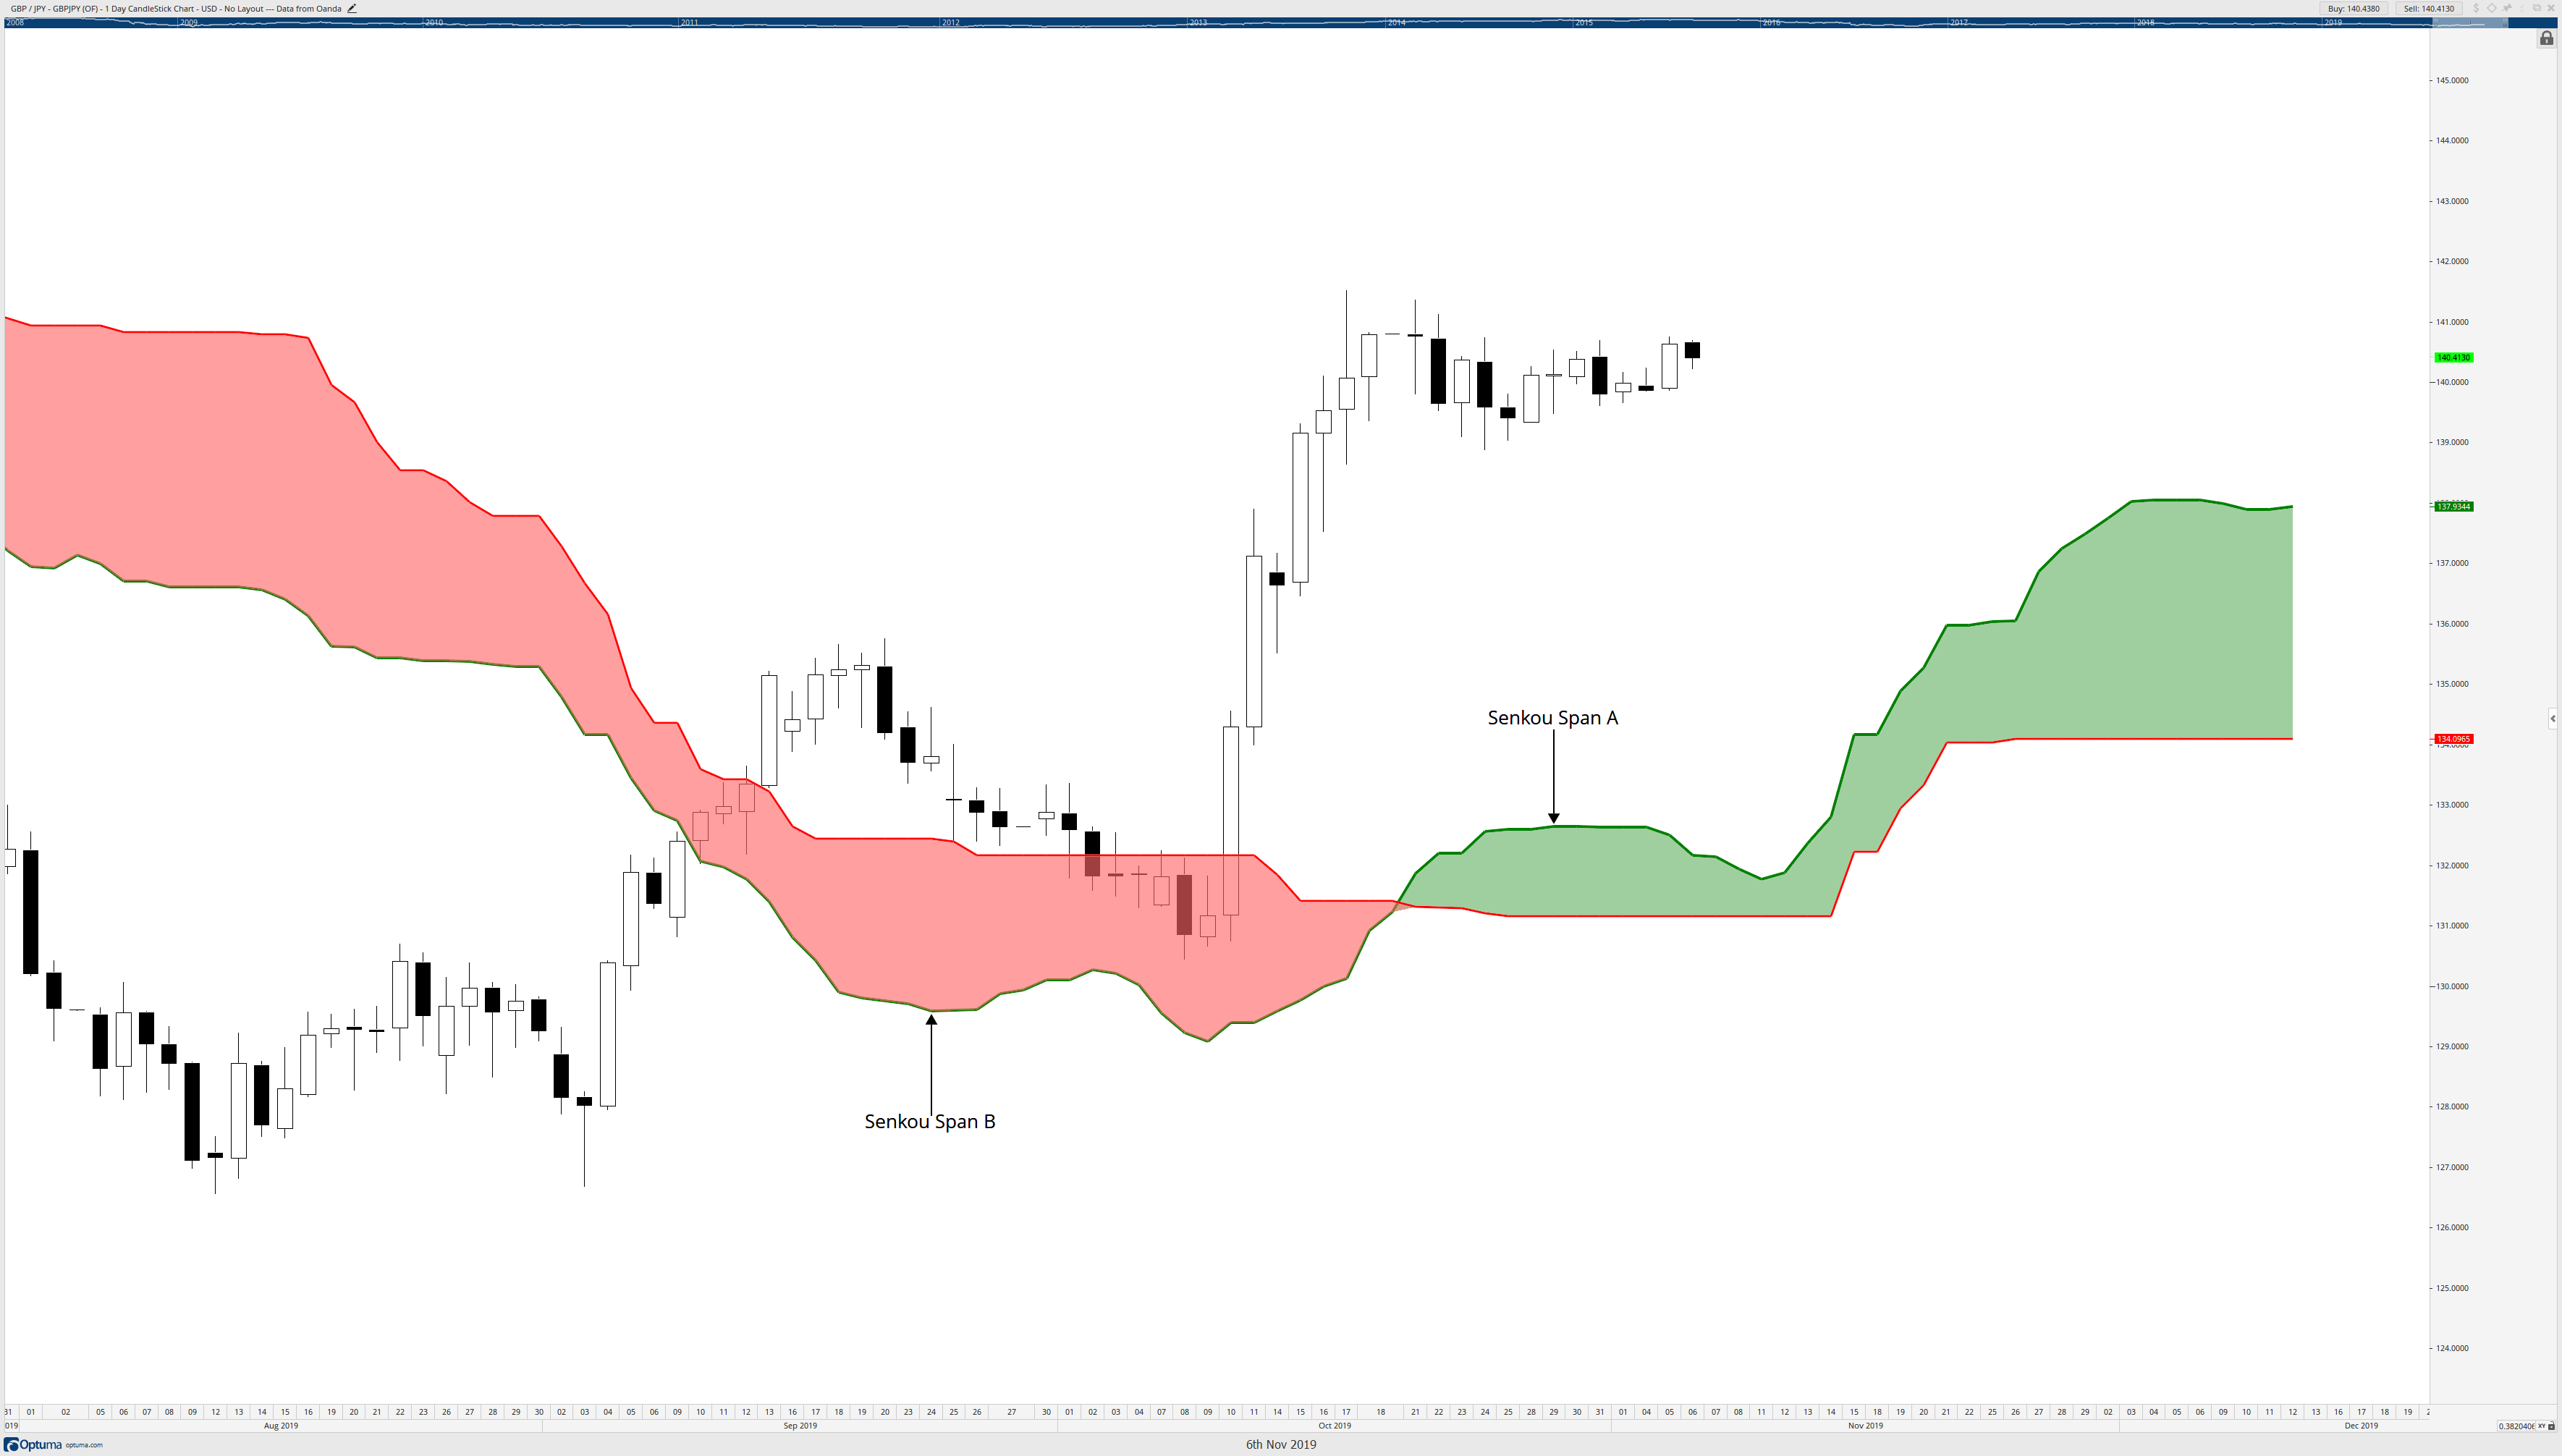
The Kumo (Cloud) is made up of the third and fourth components of the Ichimoku Kinko Hyo system, Senkou Span A and Senkou Span B. The ‘Cloud’ is the most distinguishing feature of the Ichimoku system. This ‘blob’ of color on the screen is perhaps one of the most ingenious applications of technical analysis theory in all of Technical Analysis. I say this because it is one of the very few forms of Technical Analysis that actively projects non-trend line-based data into the future – essentially turning lagging analysis into leading analysis. The Cloud is nothing more than the space between the two averages of Senkou Span A and Senkou Span B. Most software will then shade the area between these zones to correlate to the position of Senkou Span A to Senkou Span B. If Senkou Span A is above Senkou Span B, space is shaded green. If Senkou Span A is below Senkou Span B, the area is shaded red. The Cloud’s construction and interpretation is one that can cause significant confusion for someone new to this system, so I am going to break it down for each level.
Senkou Span A is the ‘faster’ line and is a measure of market balance and past volatility. (Peliolle) Senkou Span A is plotted by taking the average of the Tenkan-Sen and Kijun-Sen (Tenkan-Sen + Kijun-Sen) and dividing that number by two. It is then projected forward 26 periods.
Senkou Span B is the most powerful support and resistance level in the Ichimoku Kinko Hyo system. Senkou Span B is plotted by taking adding the highest high and lowest low of the last 52-periods, dividing that number by two, and then projecting it forward 26 periods.
Key Points
A flat Senkou Span B represents strength.
Thick Clouds equal strength. Thick Clouds also represent consolidation. (Linton)
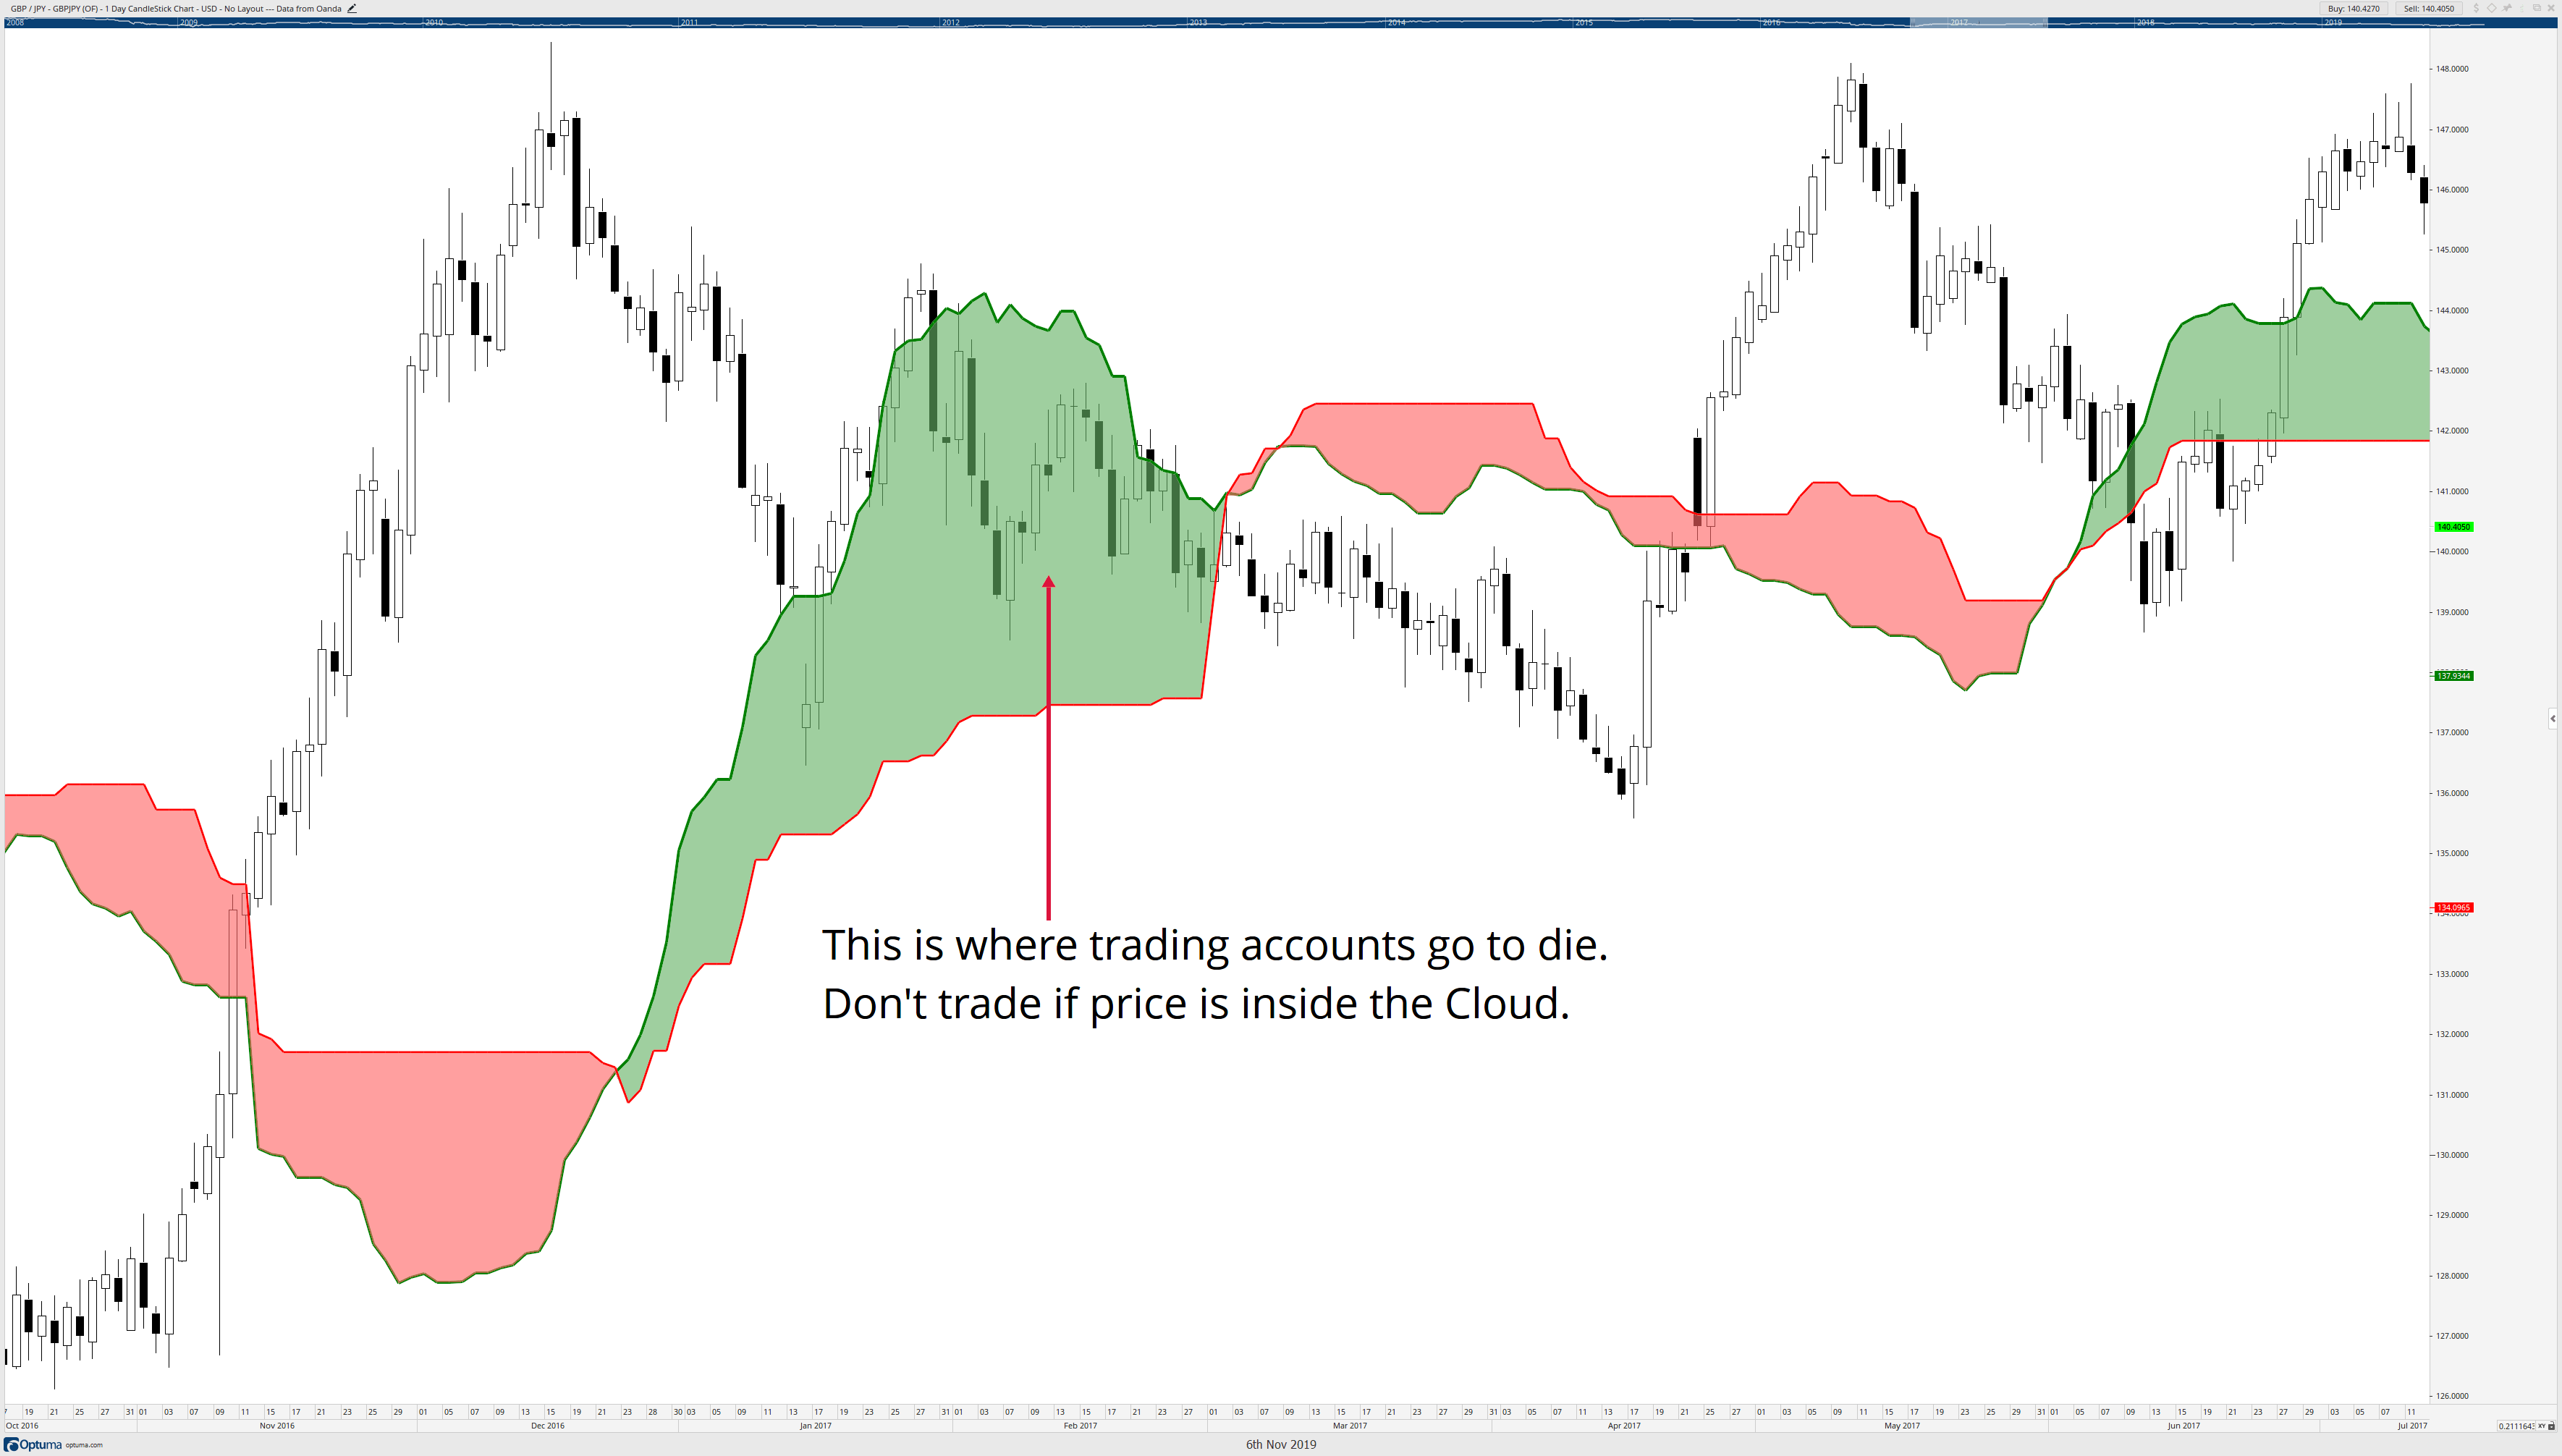
Thick Clouds tell us when not to trade. If you see price inside the Cloud, move on to another chart! (Morgan)
Kumo Twists (Senkou Span A crossing Senkou Span B) are indicative of likely changes. Sometimes a Kumo Twist is the most immediately visible sign of a trend change. (Linton)
The Cloud represents volatility.
The First Question You Should Ask Yourself
Price inside the Cloud
When using the Ichimoku Kinko Hyo system, the first question you should ask yourself is this: Is price inside the Cloud? If the answer is yes, then ignore that chart. Leave it alone. Find something else to do, find another chart to look at. That chart is dead to you if the price is inside the Cloud.
The Chikou Span (Lagging Span)
The fifth and final component of the Ichimoku Kinko Hyo system is the Chikou Span. I believe that this is the secret weapon of the entire system. If you have taken any classes or watched videos of the Ichimoku system anywhere else, the author or presenter may have removed the Chikou Span. I’ve read and observed a shocking number of people disregard the Chikou Span and treat it like it’s some pointless component that is not needed. People treat like it’s the gallbladder and just cut it out and think everything’s going to be just fine. That is a horrible idea.
This is my favorite tool in the entire system. It is very, very simple, and requires no averaging. It is merely the current price action shifted back 26 periods. It’s like a mirror image of the current price action. Even though it is simple to understand, visualizing this line can be hard. Look at the image below.
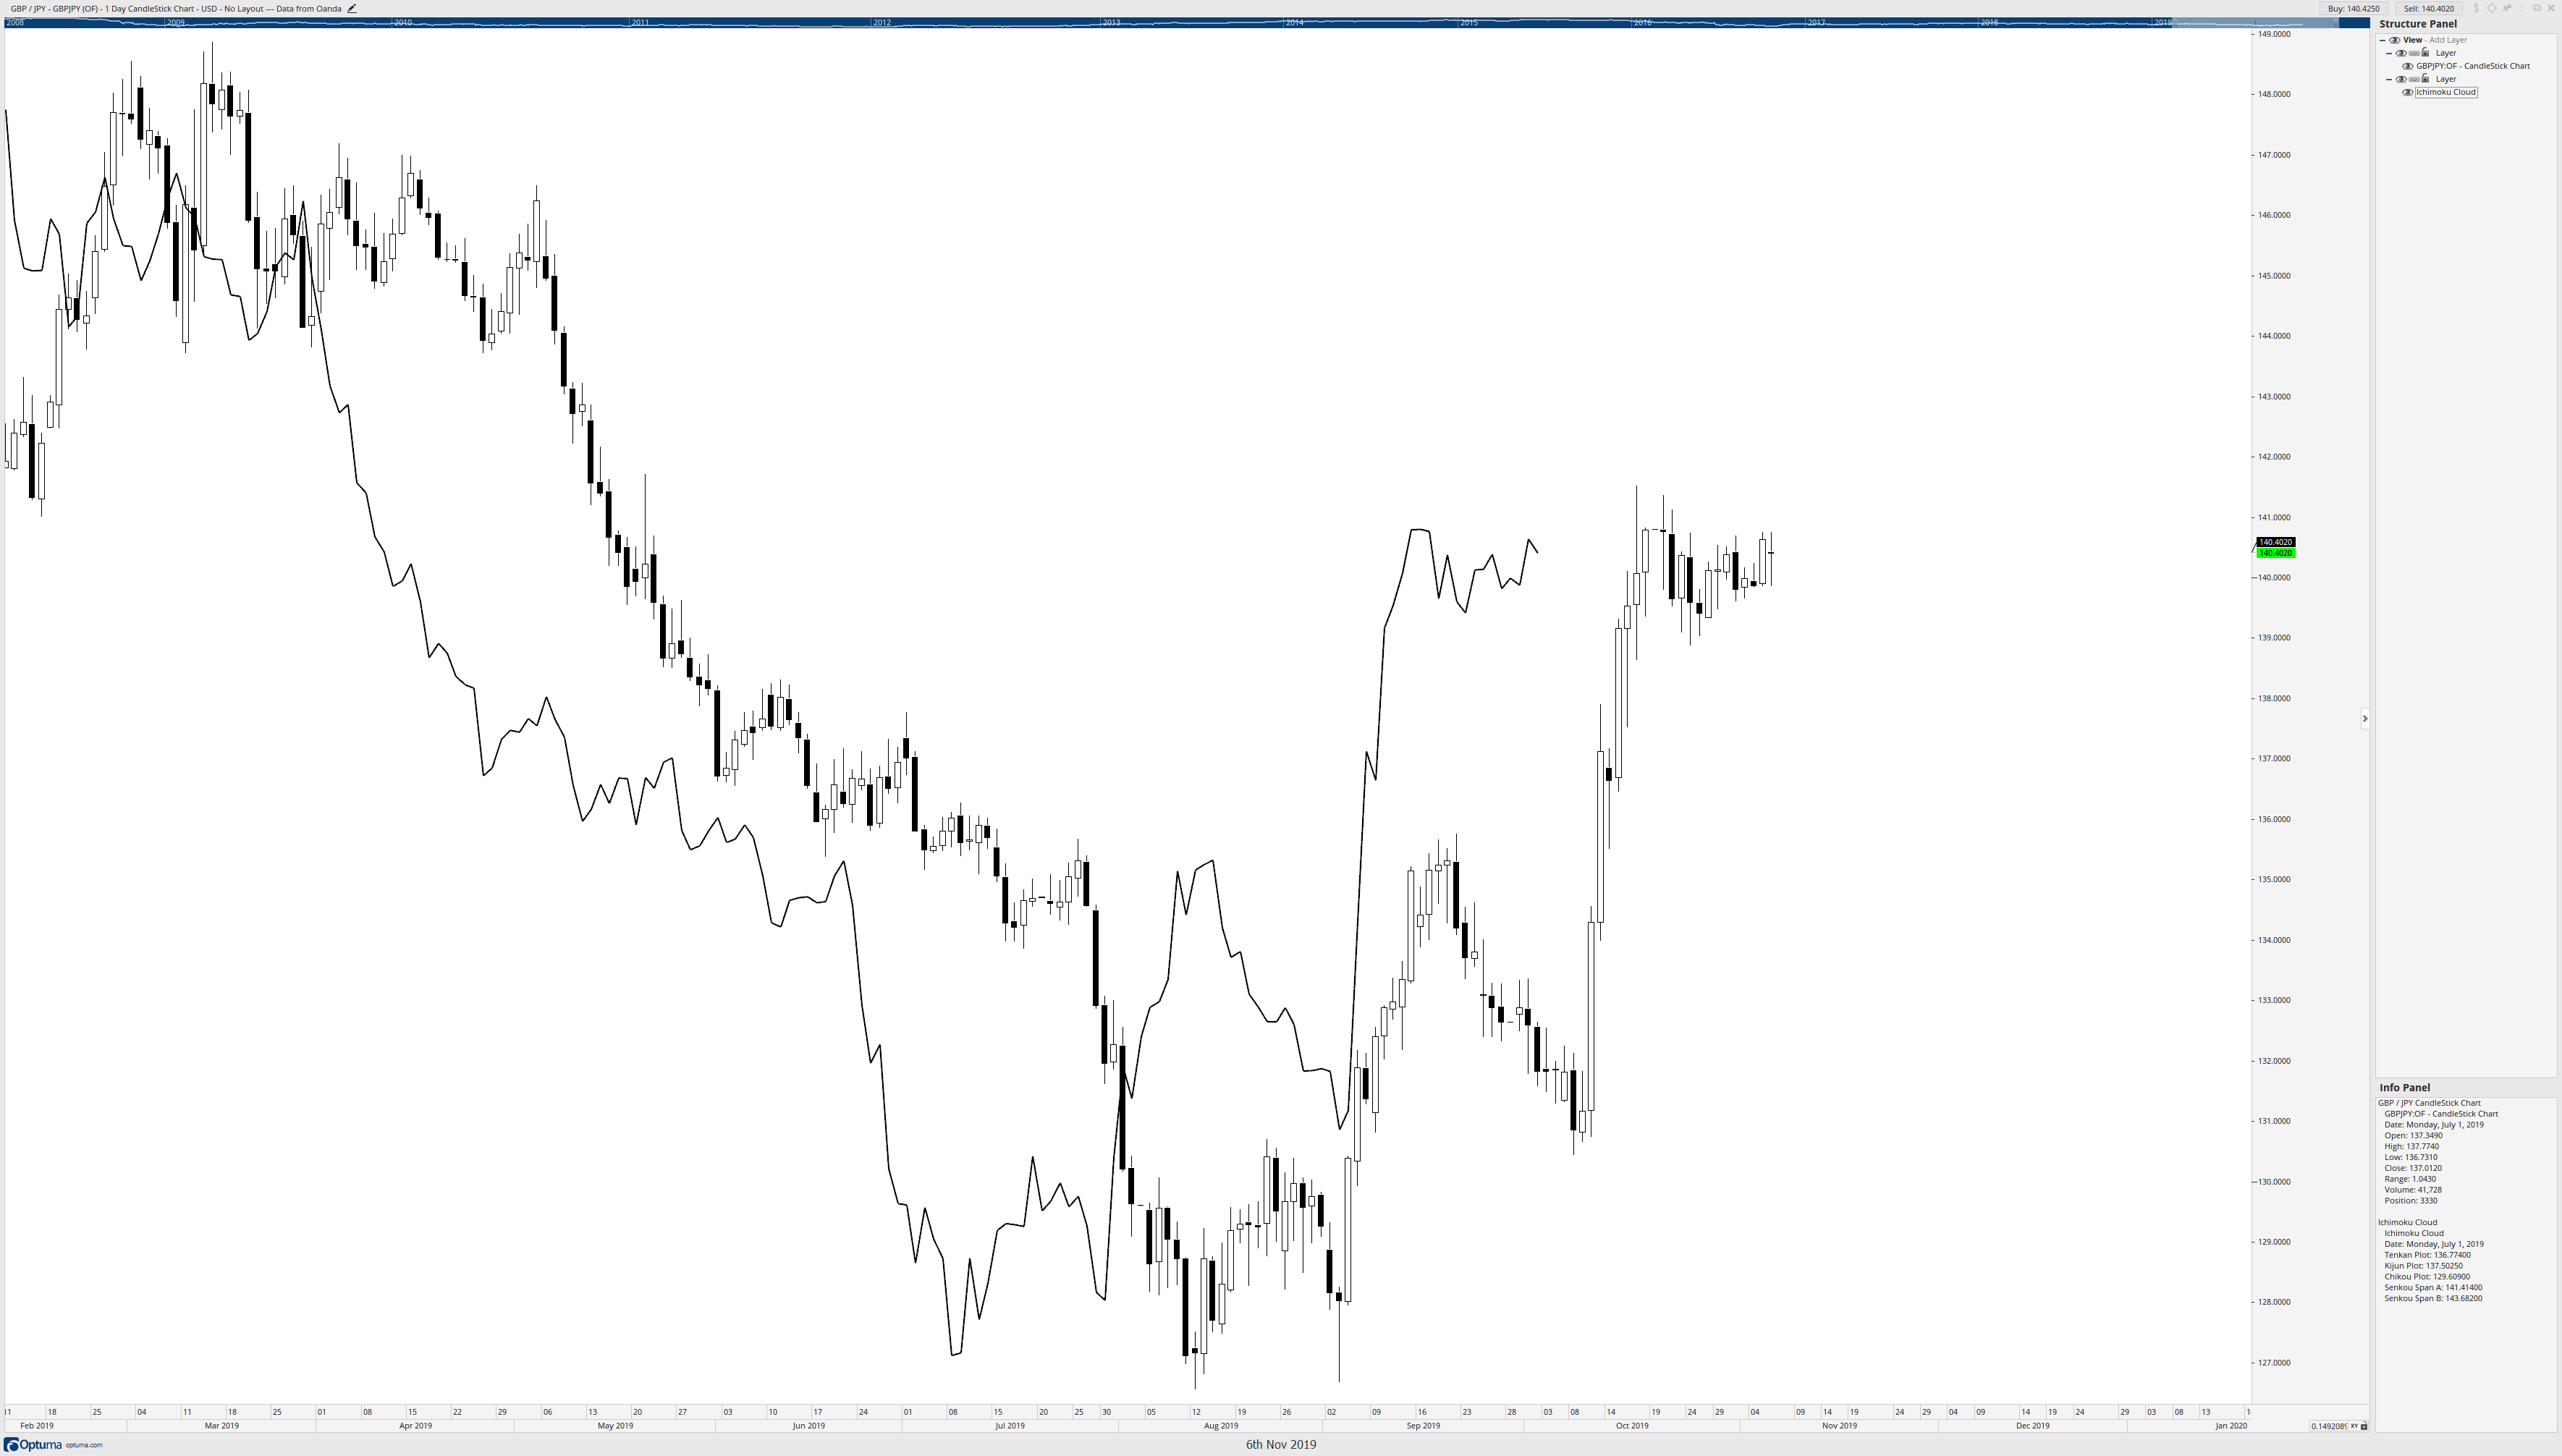
Chikou Span
The image above shows the Chikou Span on a Japanese Candlestick chart. If you are new to this trading system, you still may have a hard time ‘visualizing’ what the Chikou Span looks like. I think the easiest way for people to finally get it and experience the ‘ah-ha’ moment is to change the chart from a candlestick chart to a line chart. See below.
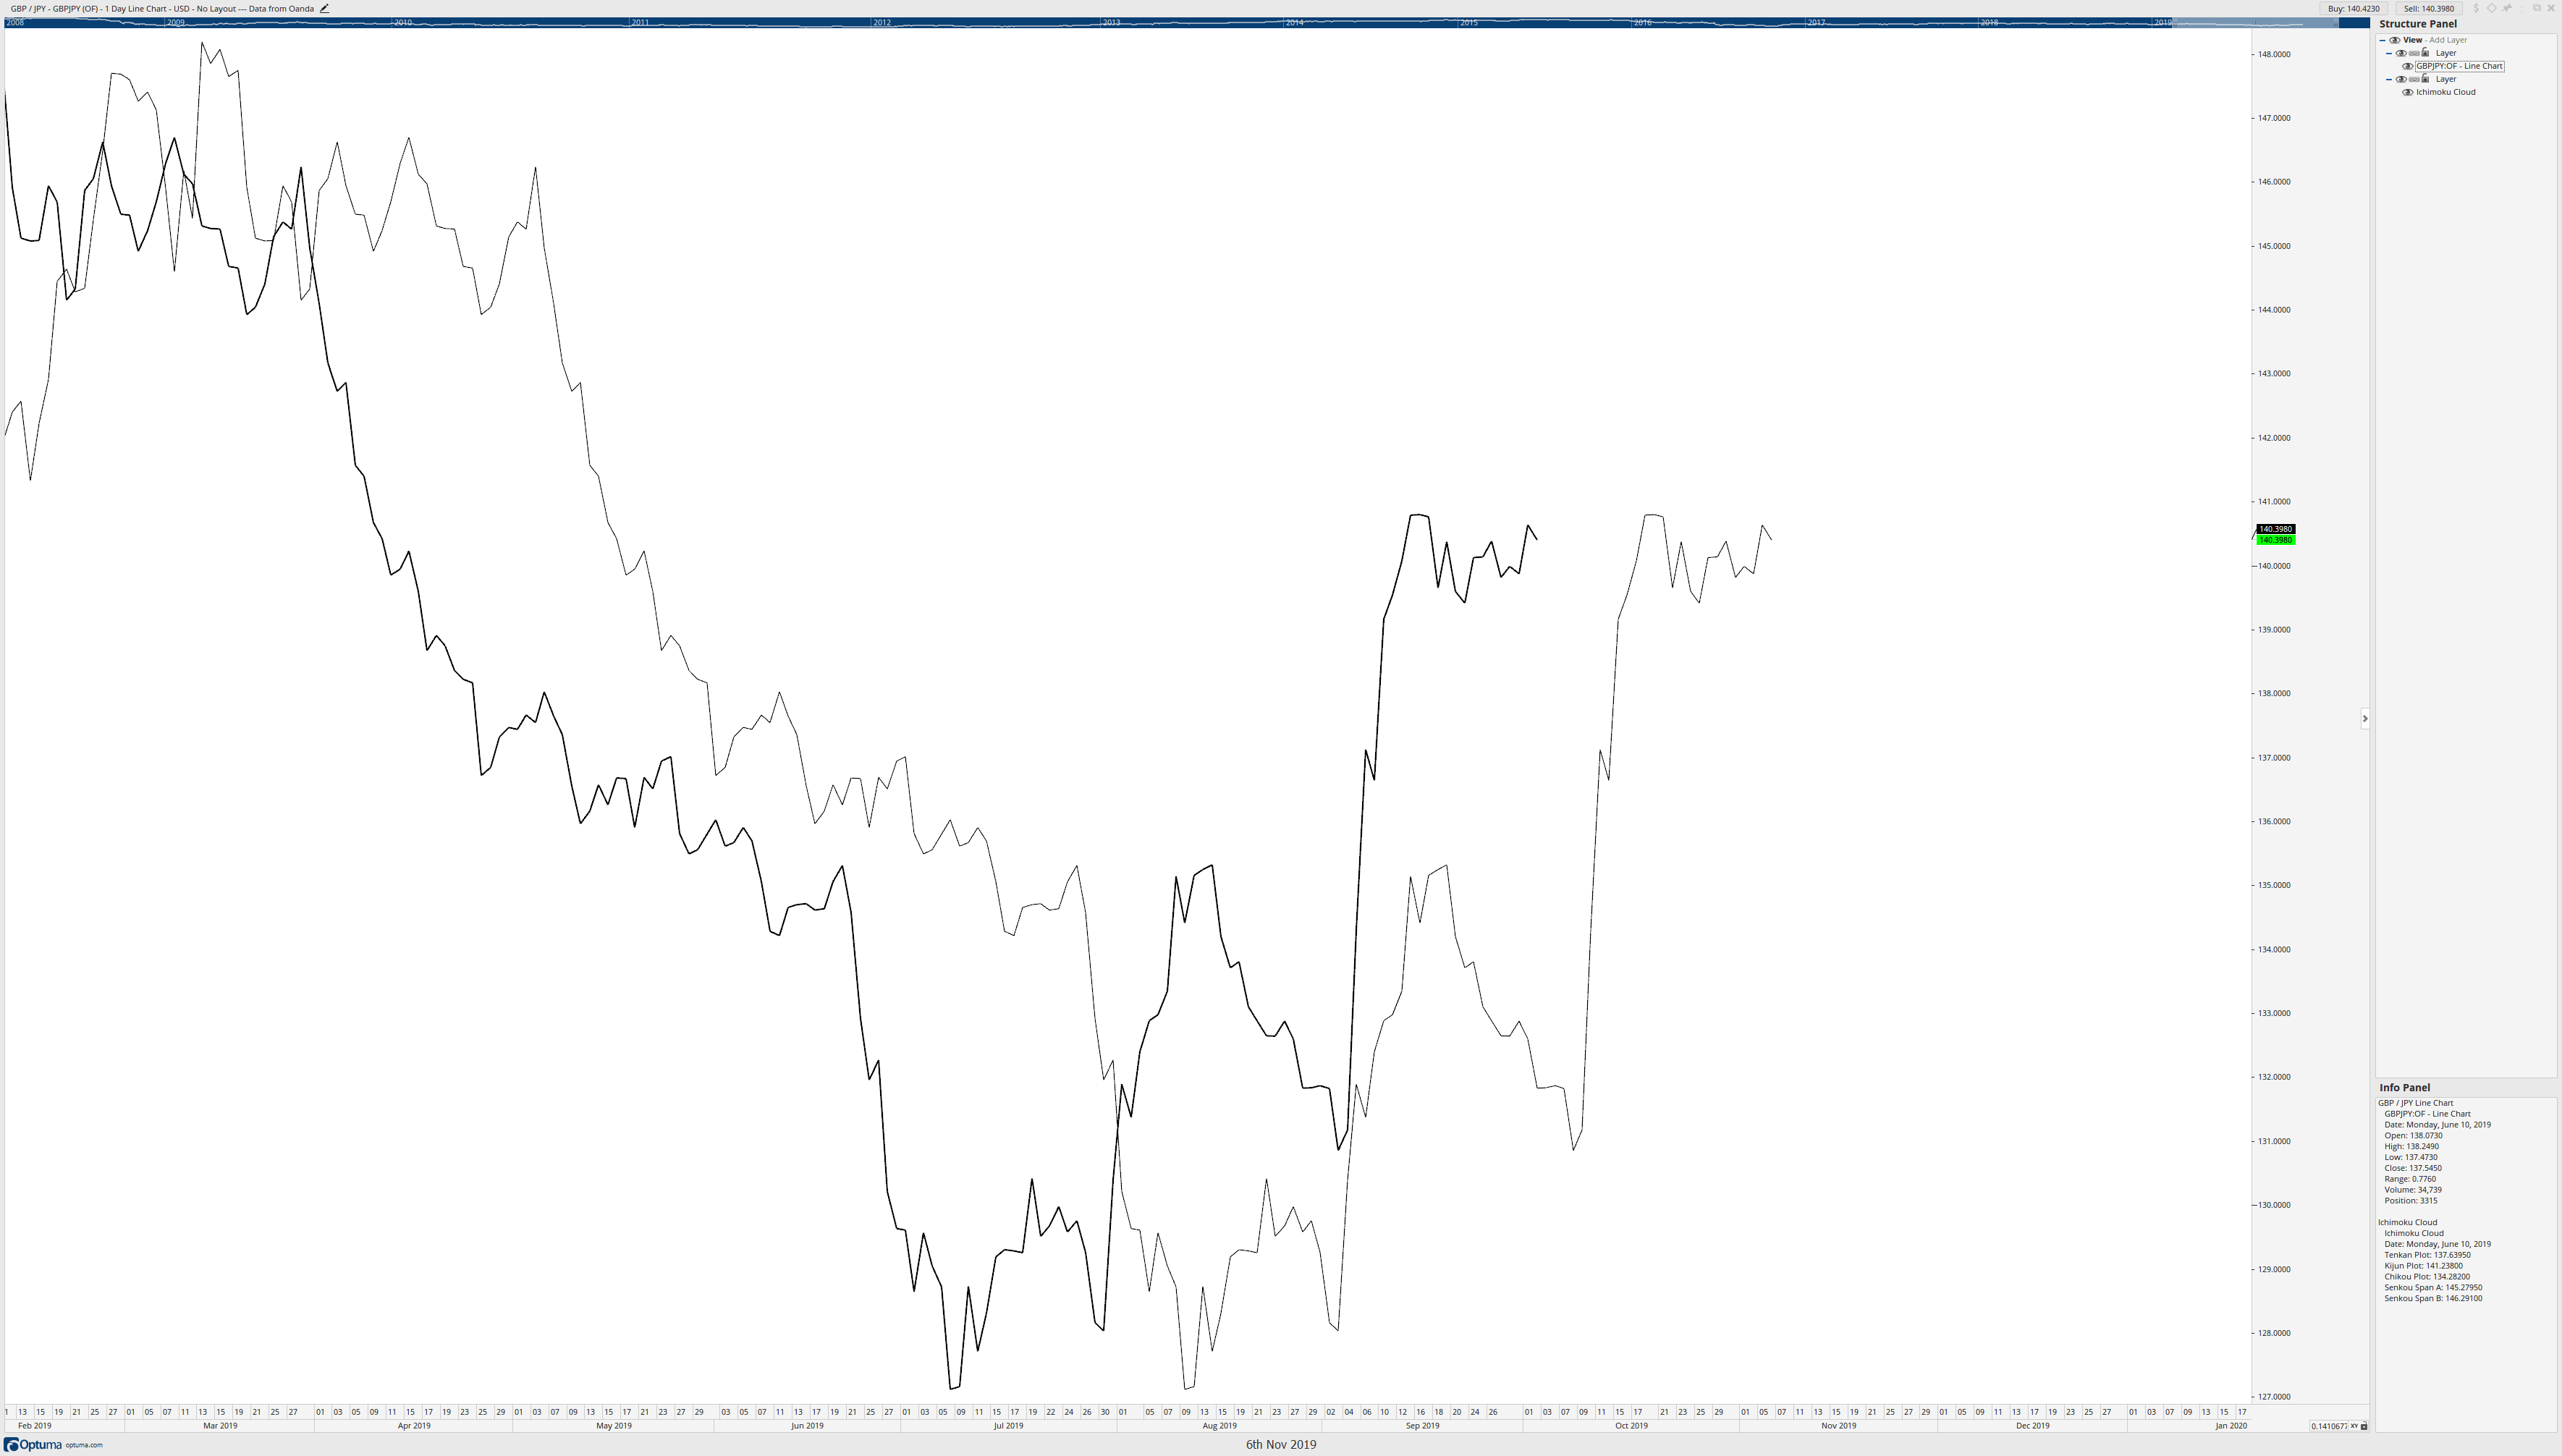
Candlesticks to Line Chart
When we change from a candlestick chart to a line chart, it is much easier to grasp and visualize what the Chikou Span is – because it is straightforward. The Chikou Span is just our current price shifted back 26 periods.
The Chikou Span represents the market’s memory. (Peliolle) It represents momentum. (Patel) David Linton identified what I consider one of the most crucial signals that can be generated on an Ichimoku chart. He wrote: When the Chikou Span crosses above or below the Cloud, it is THE confirmation signal in Ichimoku Analysis. (Linton)
Key Points
Look for when the Chikou Span is in ‘Open Space.’ Manesh Patel identified Open Space as a condition when the Chikou Span won’t intercept any candlesticks over the next 5 to 10 periods. This indicates a much easier move for the price with almost no supportive/resistive structure to stop price.
If the Chikou Span is trading ‘inside’ the candlesticks, the market is beginning to consolidate.
The Chikou Span responds to the same support and resistance levels as the price does. (Peliolle)
Why 9, 26, and 52?
One of the biggest questions people will ask is, why does the Ichimoku system utilize the periods of 9, 26, and 52? Much of this has to do with history and Japan’s normal trading week. A trading week in Japan was six days, so 9 is 1.5 weeks. (Elliot). There are roughly 26 trading sessions in a month. (Elliot) 52 is approximately two full trading months. Do not change these values.
Let me repeat that.
Do. Not. Change. Those. Values.
You can change your timeframes all you want but never change the base Ichimoku settings. You will read people give reasons why you should do it for this market and that market. You will read reasons why using Western values is useful for Western traders. You will hear a myriad of reasons why you should change the base values. Don’t. The Ichimoku Kinko Hyo system is a time tested, proven profitable, and robust trading system. Don’t muck it up by introducing variables that are not a part of the system.
The following articles in the Ichimoku series will detail advanced Ichimoku concepts such as Hidenobu Sasaki’s Three Principles as well as trading strategies utilizing the Ichimoku system.
Sources: Péloille Karen. (2017). Trading with Ichimoku: a practical guide to low-risk Ichimoku strategies. Petersfield, Hampshire: Harriman House Ltd.
Patel, M. (2010). Trading with Ichimoku clouds: the essential guide to Ichimoku Kinko Hyo technical analysis. Hoboken, NJ: John Wiley & Sons.
Linton, D. (2010). Cloud charts: trading success with the Ichimoku technique. London: Updata.
Elliot, N. (2012). Ichimoku charts: an introduction to Ichimoku Kinko Clouds. Petersfield, Hampshire: Harriman House Ltd.
Ichimoku is not an indicator (many platforms incorrectly label it an indicator) – it is a trading system. Ichimoku Kinko Hyo is, in my opinion, the
Ichimoku Kinko Hyo
Ichimoku is not an indicator (many platforms incorrectly label it an indicator) – it is a trading system. Ichimoku Kinko Hyo is, in my opinion, the
Ichimoku Kinko Hyo
Ichimoku is not an indicator (many platforms incorrectly label it an indicator) – it is a trading system. Ichimoku Kinko Hyo is, in my opinion, the most effective trading system to use with Japanese Candlesticks.
The reasons for this require a deep dive into the fundamentals behind the differences of Japanese VS Western analysis – but that is for another article. The Ichimoku system – and it is a system, not an indicator – is perhaps the most complimentary system that you could ever use with Japanese candlesticks. The reasons for this are rooted in history.
History of Japan: Edo, Meiji, and Candlesticks
One of the most important and famous economists in history, Milton Freidman, often used a specific point in Japan’s history to show how powerful free markets are. This period was known as the Meiji Restoration. If you are unaware of this period of history, you should do a little reading. It’s an astounding story. The period we are most interested in is the period after the end of the Tokugawa Shogunate (Edo Period) and the beginning of the Meiji Period.
It’s important to understand that before the Restoration, Japan was militantly xenophobic. For over a quarter of millennia, no foreigners were allowed in Japan, and no Japanese were allowed to leave. This policy ended almost literally overnight when the Emperor opened the doors of Japan to foreign capital, industry, and ideas. In just a couple of decades, the Japanese went from mostly medieval technology to fast-forwarding their technology ahead almost 350 years. I mean, think about it. In 80 years, the people went from medieval plowshares to aircraft carriers. It’s truly fascinating. But the major transition wasn’t just the technological leap; it was the capital and market-based leap as well.
Believe it or not, Japan created the first futures exchange. The Dojima Rice Exchange was created in 1697 by samurai. Samurai were not just masterful warriors, but they had various duties throughout their existence – one of which was collecting taxes. Rice was the de facto currency in Japan for centuries – it’s how people paid taxes. Rice coupons were issued and used as the first futures contracts.
Fast forward to the end part of the Edo period; we have the first instance of what we now know as Japanese Candlesticks coming to use. Munehisa Homma (nicknamed Sakata) is credited with creating Japanese Candlesticks. It is important to note that Japanese Candlesticks (the mid-1700s) were used well before the invention of American Bar Charts (1880s). More on the history of Japanese Candlesticks and Mr. Homma’s invention will be discussed in another article.
Ichimoku Kinko Hyo History
The man who created Ichimoku is Goichi Hosada. David Linton’s book, Cloud Charts – Trading Success with the Ichimoku Technique and Nicole Elliot’s book, Ichimoku Charts –An Introduction to Ichimoku Kinko Clouds provide an excellent history of both Japanese candlesticks and Goichi Hosada’s time spent creating Ichimoku. Both of those books should be on your shelves!
The translation for Ichimoku Kinko Hyo is this: At a glance (Ichimoku), Balance (Kinko), and Bar Chart (Hyo). The most important word here, Kinko, for balance. Experienced traders in Japanese theory and pedagogy will know that one of the most important characteristics in Japanese technical analysis is the focus of balance and equilibrium. This trait is constant in the Ichimoku system. The focus of equilibrium and balance is constant in various Japanese chart forms as well (Heiken-Ashi and Renko). The concept of balance will make more sense when you learn the Ichimoku system in the next article.
Sources: Péloille Karen. (2017). Trading with Ichimoku: a practical guide to low-risk Ichimoku strategies. Petersfield, Hampshire: Harriman House Ltd.
Patel, M. (2010). Trading with Ichimoku clouds: the essential guide to Ichimoku Kinko Hyo technical analysis. Hoboken, NJ: John Wiley & Sons.
Linton, D. (2010). Cloud charts: trading success with the Ichimoku technique. London: Updata.
Elliot, N. (2012). Ichimoku charts: an introduction to Ichimoku Kinko Clouds. Petersfield, Hampshire: Harriman House Ltd.