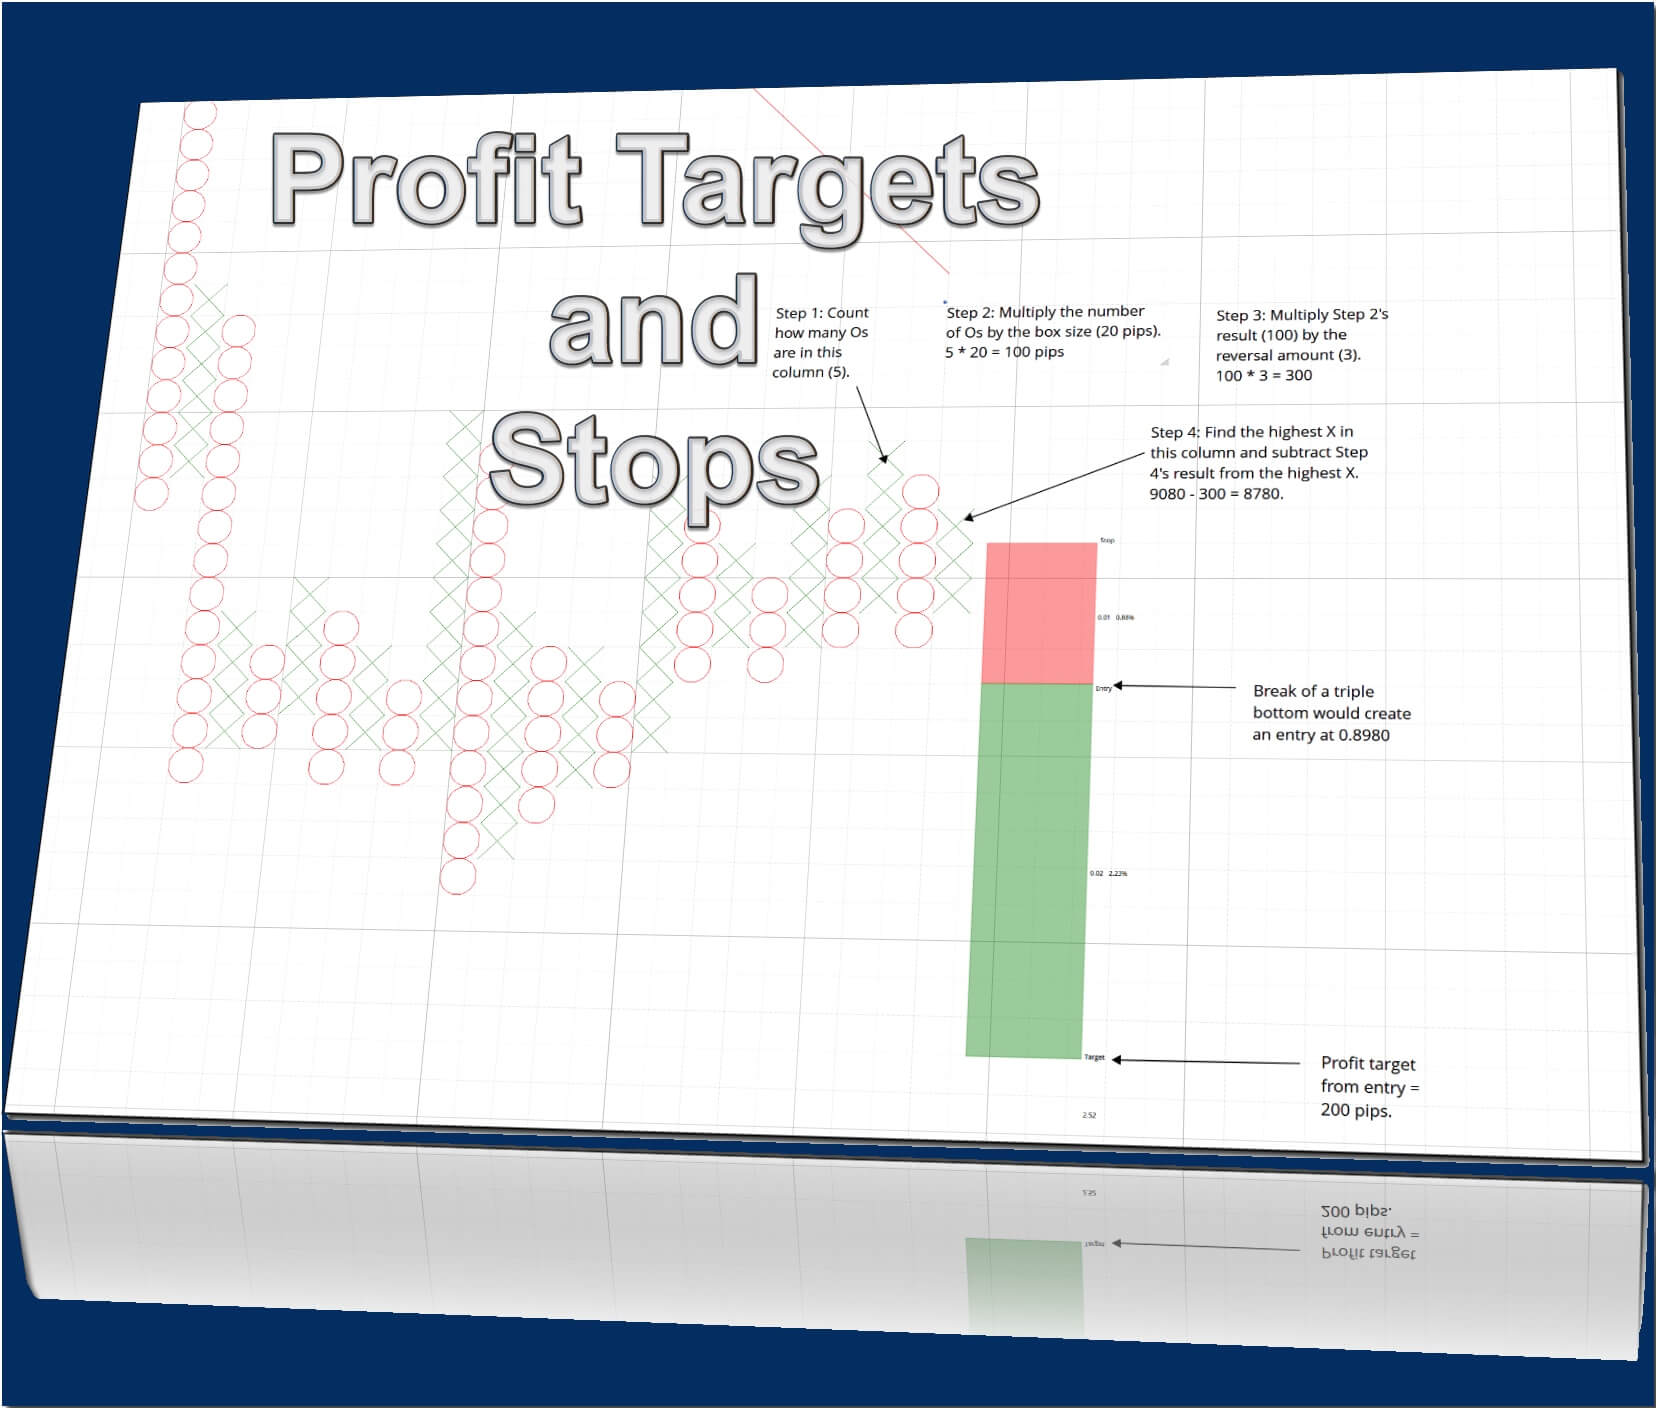
Something new traders struggle with is trying to find appropriate profit targets and stop targets. Point & Figure charts make a process that is a struggle into something that is very, very easy. Two methods can be used to identify profit targets on a Point & Figure chart: Vertical Method and Horizontal Method. I am only going to show you the Vertical Method because the entire series I’ve done here has strictly been on the use of 3-box reversal Point & Figure charts.
The Horizontal Method can be found in Jeremy Du Plessis’s work. The Horizontal Method is more applicable to the most traditional form of Point & Figure – the 1-box reversal chart. There’s a formula for calculating the profit target on Point & Figure. Don’t get freaked about the word formula – the process is very simple.
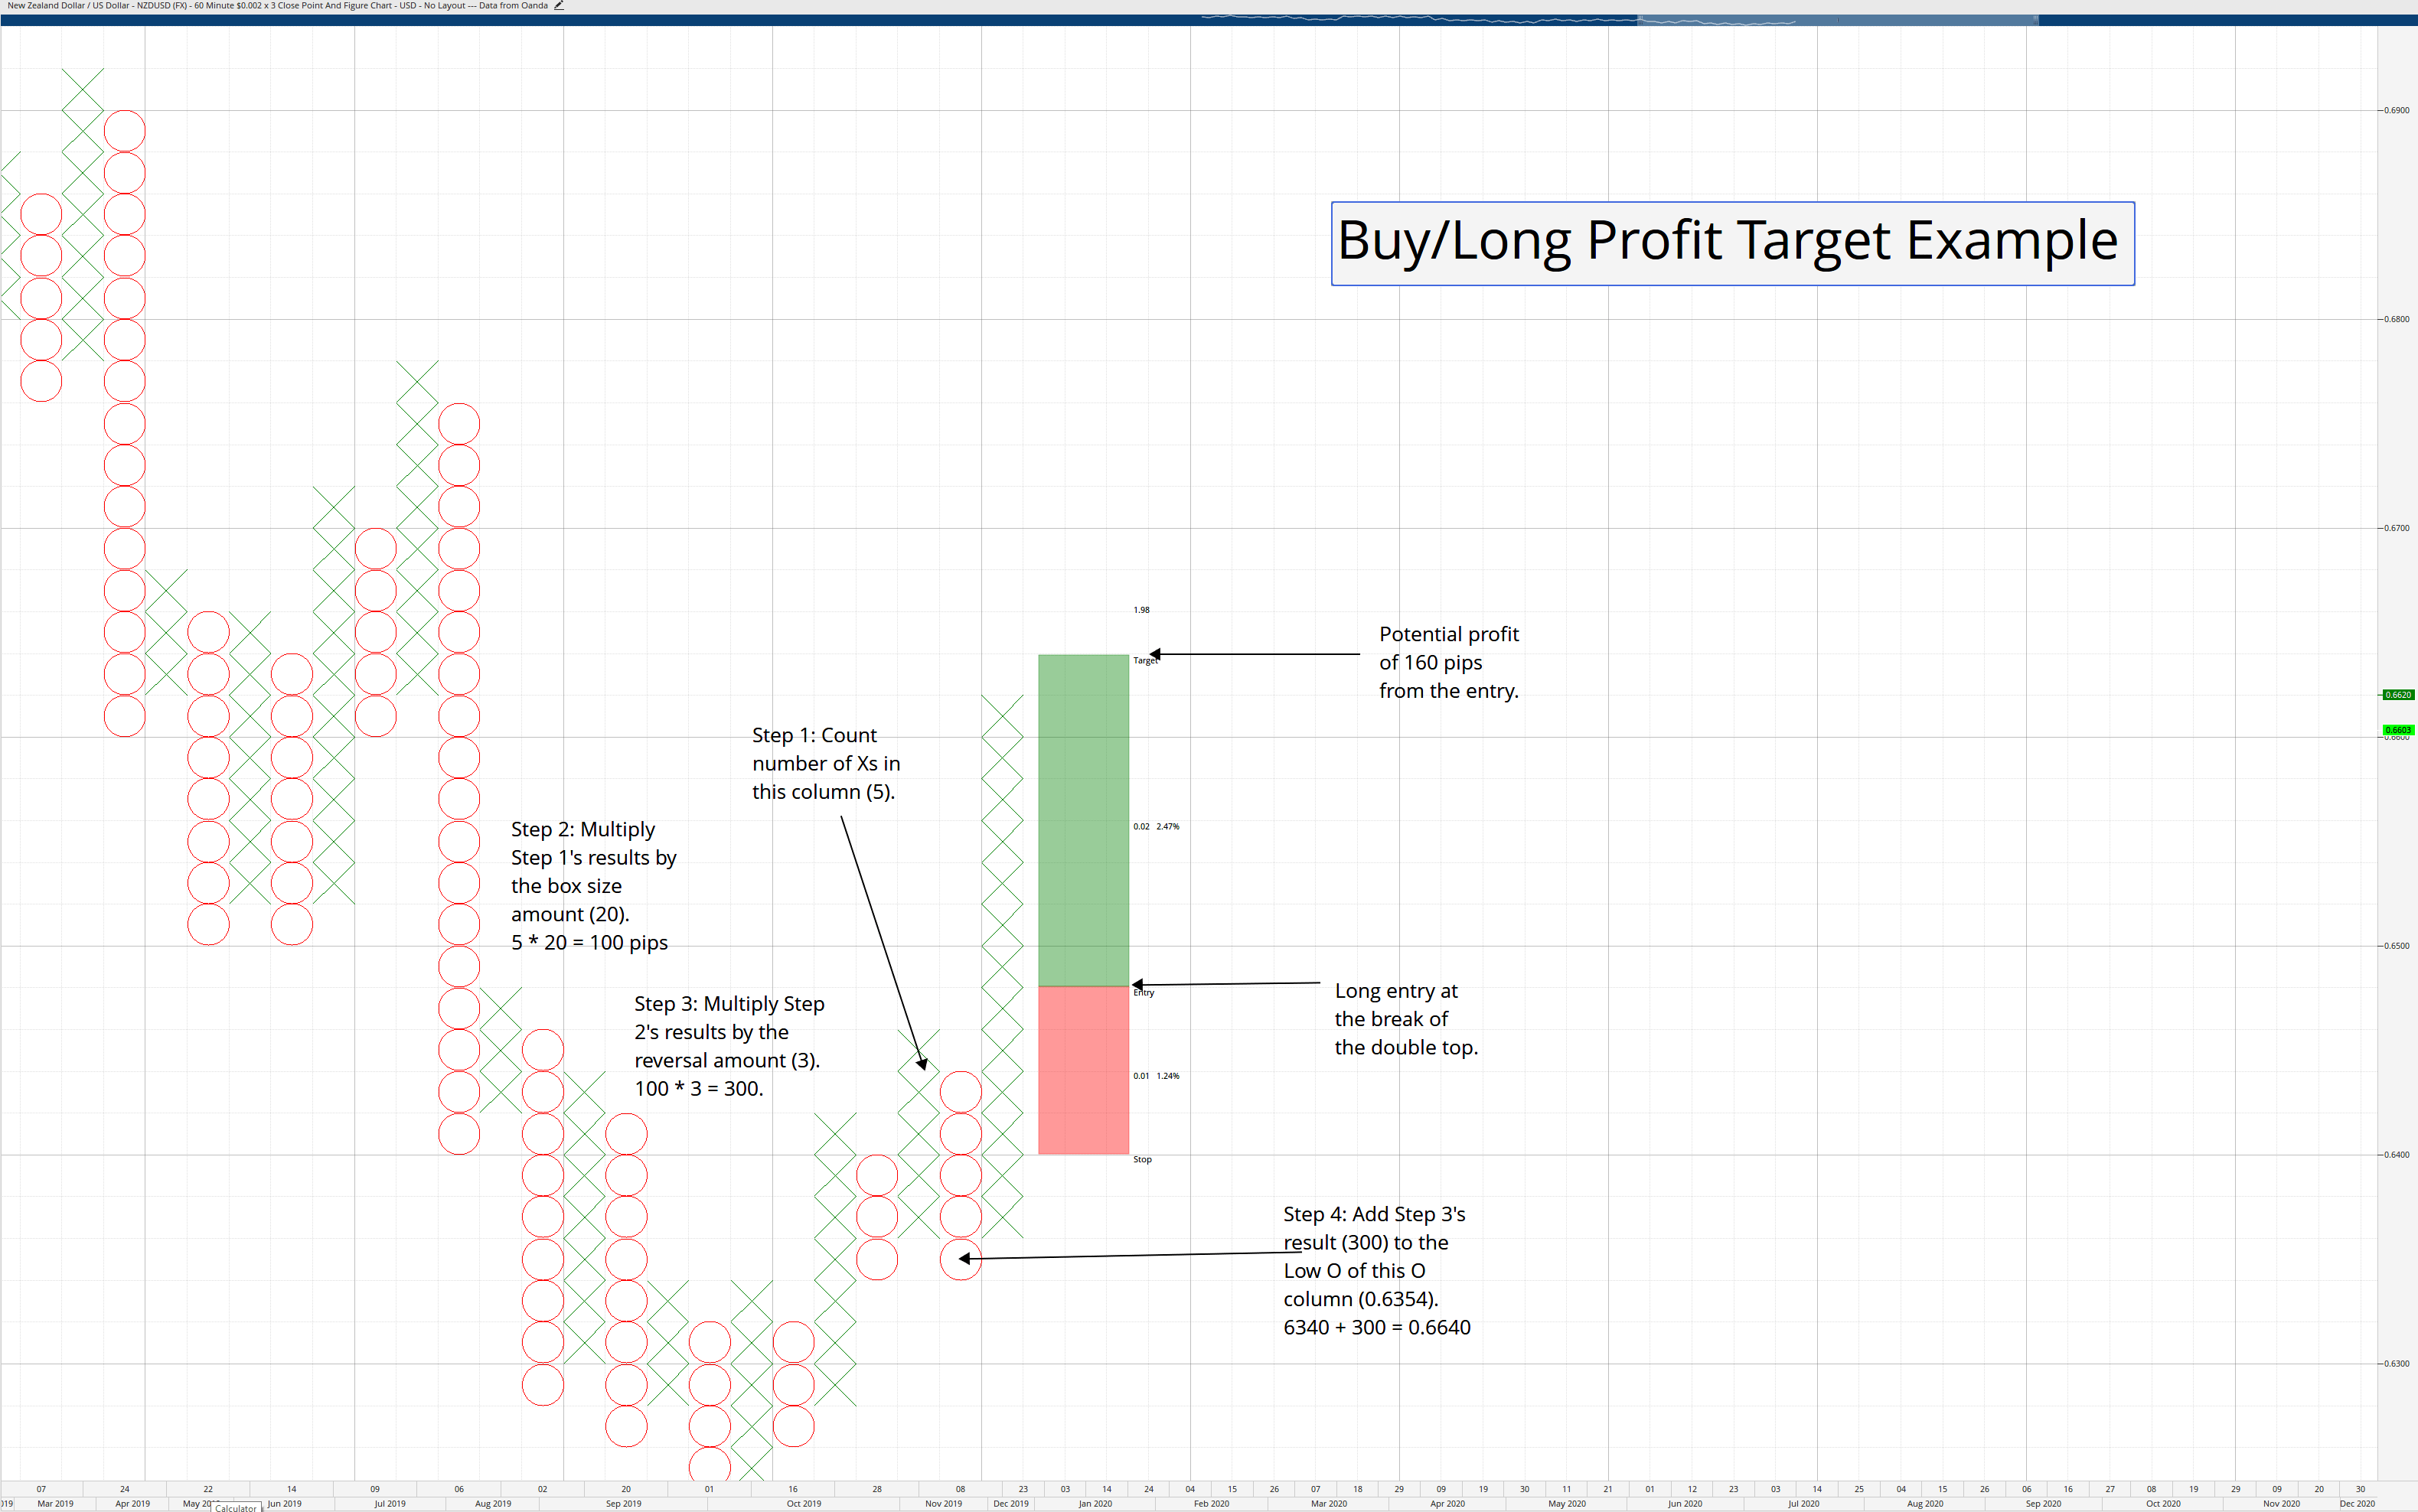
Buy/Long Profit Target = (number of Xs in prior column * box size) * (reversal amount) + lowest O of the current O column.
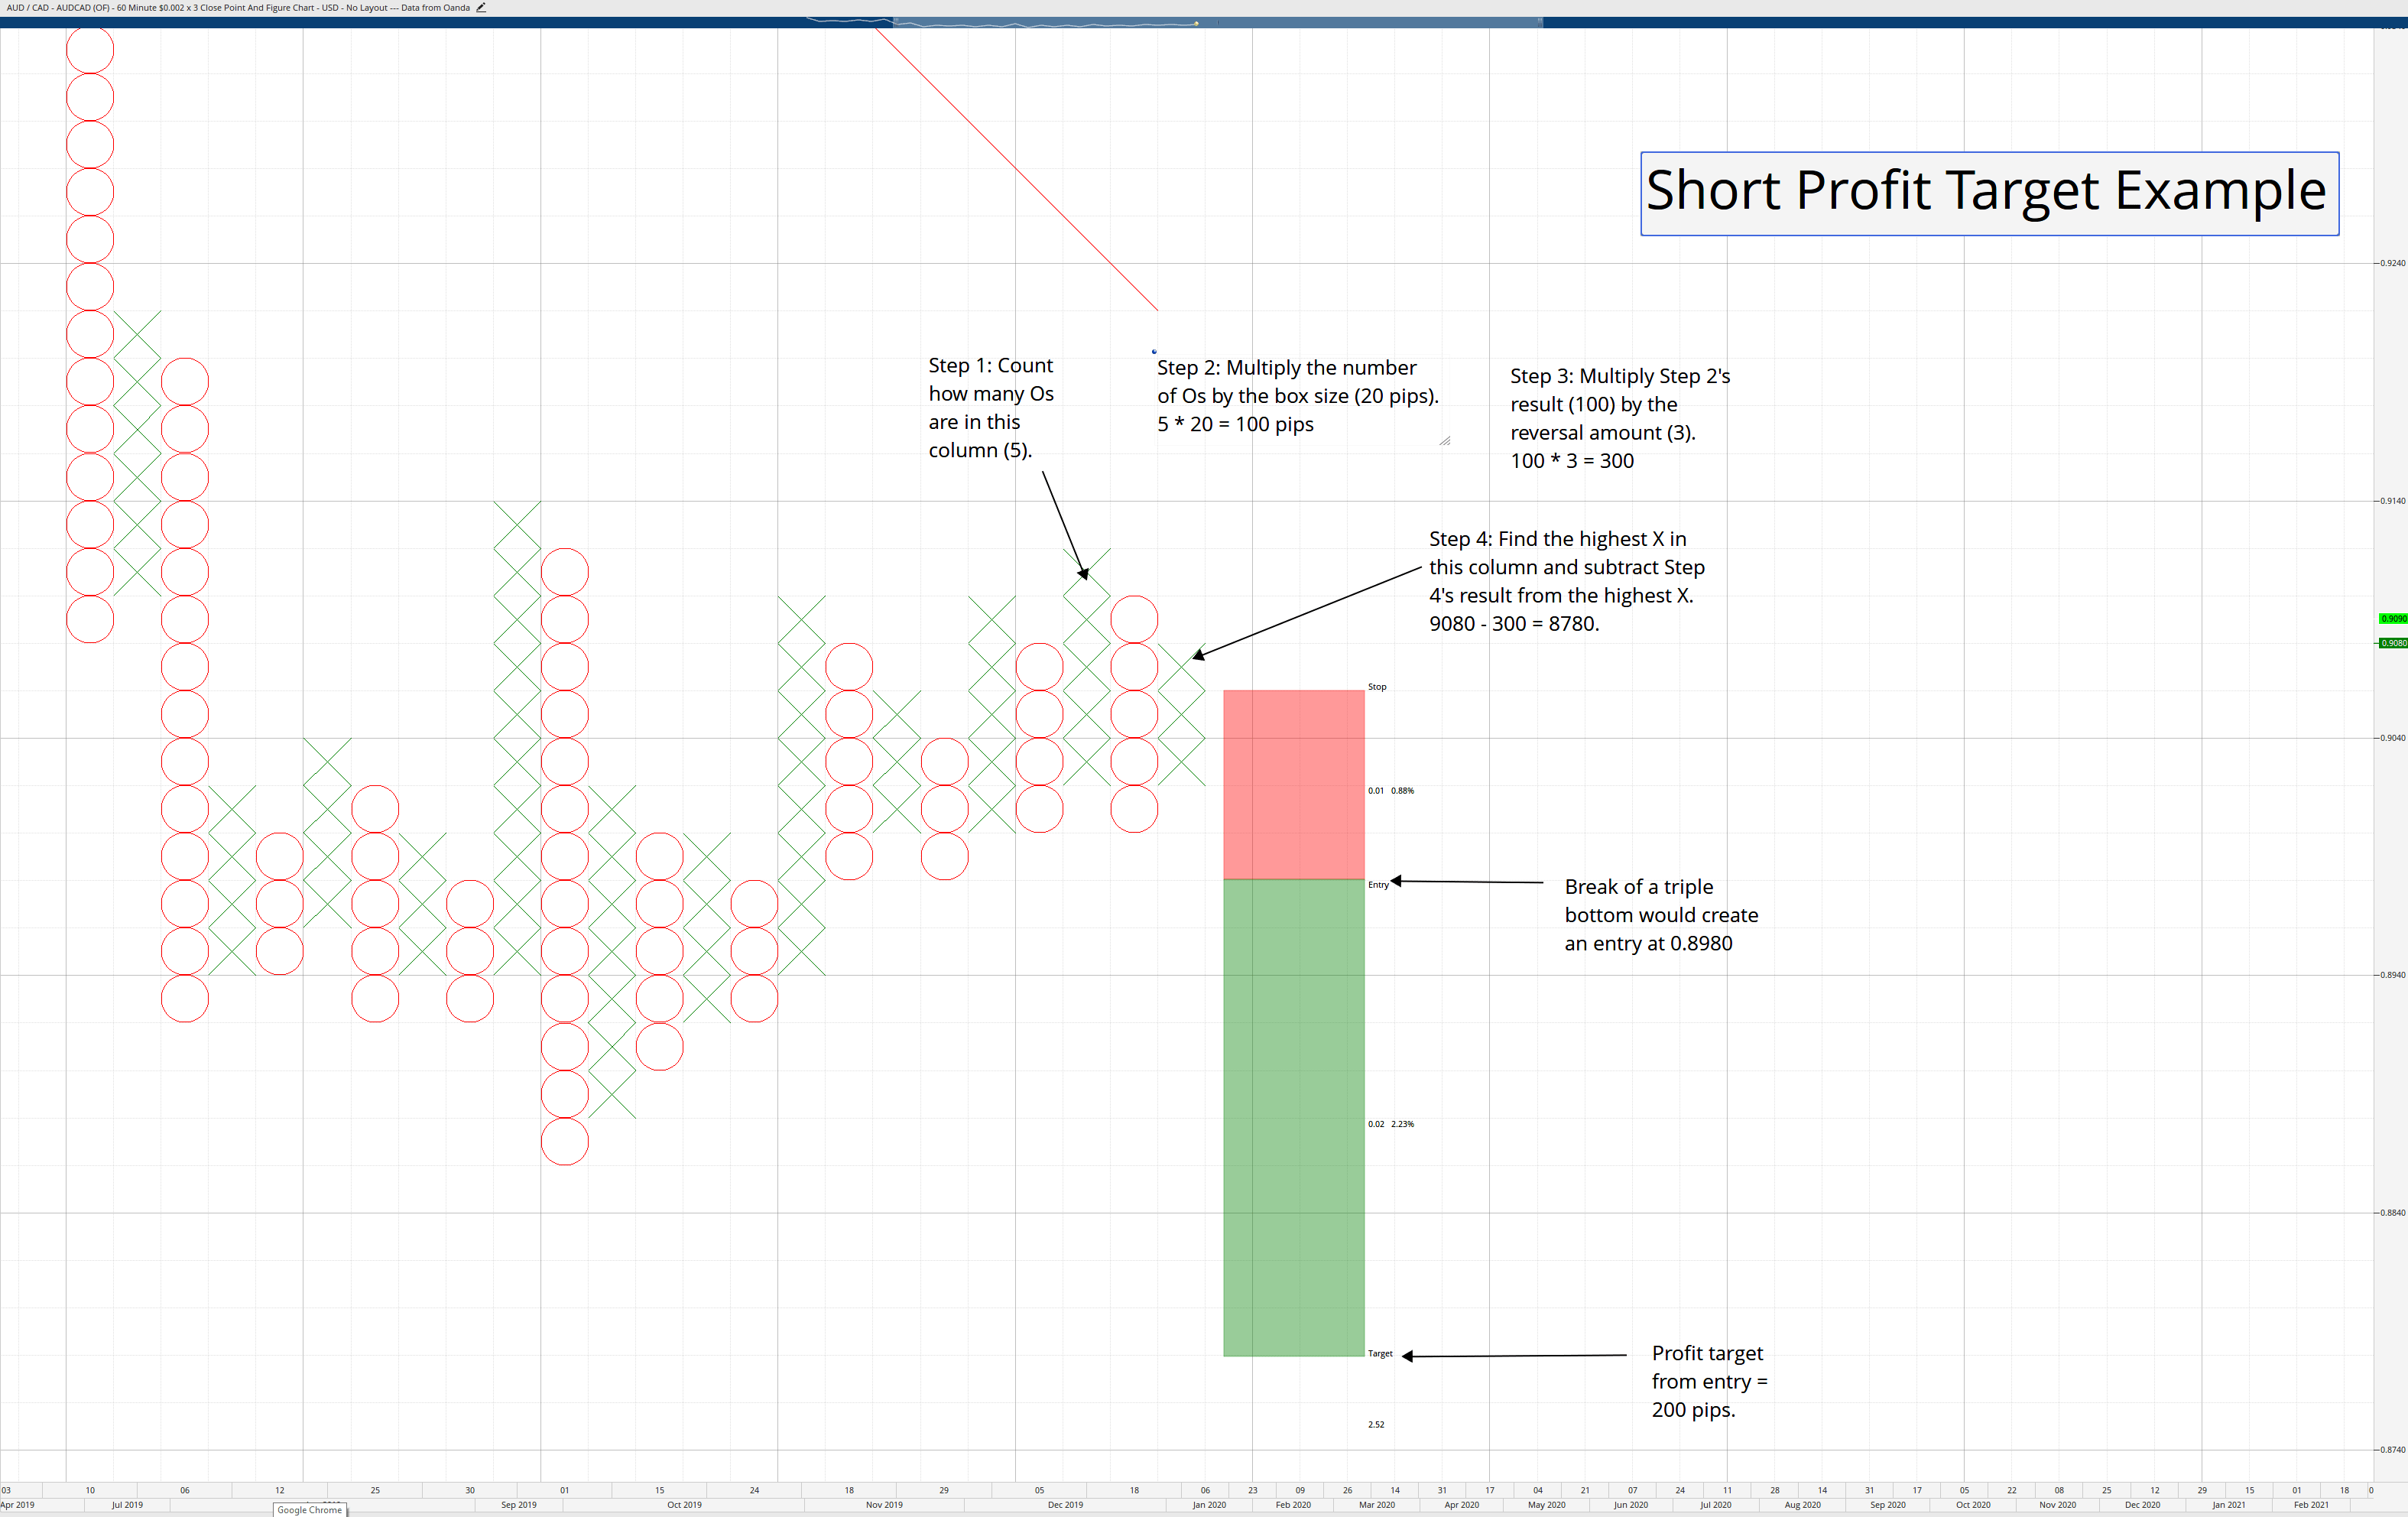
Short Profit Target = (Number of Os in prior column * box size) * (reversal amount) – highest X of the current X column.
Stops
Regarding stops, I always stick with the reversal amount – so my risk is always, no matter the trade, 3-boxes worth. On my standard 20-pip box size Point & Figure charts, 60 pips are my max loss on any trade. Some authors suggest putting the stop one box below (or above) the reversal amount, but I’ve always stuck with the reversal amount being my stop.
The Blind Entry Trading System
I want to tell you something that might be a little mind-boggling. I’ve been teaching Point & Figure to another class this year, and we’ve focused on live testing the ‘blind entry’ trading strategy in Point & Figure – which is nothing more than taking every single multiple-top or multiple-bottom break without any other filter. We focused on the following pairs:
GBPUSD, AUDUSD, USDCAD, USDJPY, GBPJPY, EURGBP, EURUSD, and AUDJPY.
We did not use any profit targets. We exited trades only when the reversal column appeared. So our losses were always limited to just 60 pips on a 20-pip/3-box reversal Point & Figure chart. We traded from March 1st, 2019 through December 7th, 2019. The results below detail the net pips at the end of our trading period:
GBPUSD = +1,060 pips
AUDUSD = -60 pips
USDCAD = +200 pips
UDSJPY = +1060 pips
GBPJPY = + 2,620 pips
EURGBP = +480 pips
EURUSD = -280 pips
AUDJPY = +1,200 pips
Net Total pips = +6,280 (the average for the class was +5443 pips).
To put that into perspective, with a 0.1 (10,000 unit) Lot size, that’s a net $6,280.00. A full Lot would have equaled a net $62,800. I had one woman who traded an odd 3.33 Lots as her standard position size (I guess it is not that odd if you think about it). She led the pack with her real net pip count at +6,880 – with a 3.33 lot size that meant she made a net $229,104. I was and remain very envious of her performance – she should probably be teaching!
Sources:
Dorsey, T. J. (2013). Point and figure charting: the essential application for forecasting and tracking market prices (4th ed.). Hoboken, NJ: John Wiley & Sons.
Kirkpatrick II, C. D., & Dahlquist, J.R. (2016). Technical Analysis: The Complete Resource for Financial Market Technicians (Third). Old Tappan, NJ: Pearson.
Plessis, J.J. (2012). Definitive Guide to Point and Figure – a comprehensive guide to the theory (2nd ed.). Great Britain: Harriman House Publishing.
DeVilliers, V., & Taylor, O. (2008). Point and figure charting. London: Financial Times/Prentice Hall.

