Introduction
EURGBP is the abbreviation for the currency pair Euro area’s euro against the Great Britain pound. This pair, unlike the EURUSD, USDCAD, GBPUSD, USDCHF, etc. is not a major currency pair. This pair is classified under the minor currency pairs and the cross-currency pairs. In EURGBP, EUR is the base currency, and GBP is the quote currency.

Understanding EUR/GBP
The current market price of EURGBP depicts the required number of pounds to purchase one euro. For example, if the value of EURGBP is 0.8527, then one needs to pay 0.8527 pounds to buy one euro.
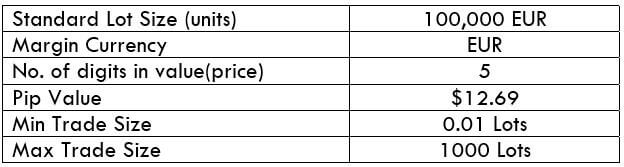
EUR/GBP Specification
Spread
Spread in trading is the difference between the bid price and the ask price. The spread is not the same on all brokers but depends on the type of account. It also varies depending on the volatility of the market. An average spread on an ECN account and an STP account is shown below.
Spread on ECN: 0.8 | Spread on STP: 1.5
Fees
On trade a trader takes, there is some fee associated with it. Fees, again, depends on the type of account. There is no fee on STP accounts, but few pips on ECN accounts.
Slippage
When a trader executes a using the market order, they don’t really get the price they had intended. There is a small pip difference between the two prices. And this difference between the prices is referred to as slippage. The slippage is usually within 0.5 to 5 pips.
Trading Range in EUR/GBP
Understanding the volatility of the market is essential before opening or closing a position. It shows how much profit or loss a trader will be on a particular timeframe. For example, if the volatility is on the 4H is 10 pips, the trader can expect to gain or lose $1269 (10 pips x 12.69 value per pip) in a matter of about 4 hours.
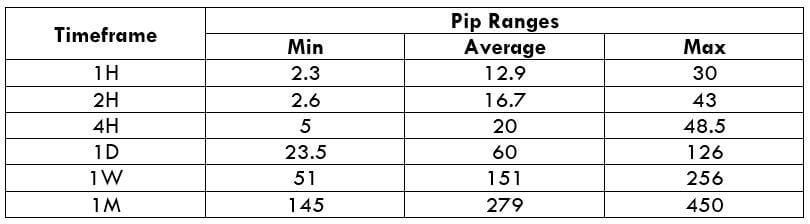
The table below illustrates the minimum, average, and maximum pip movement on the 1H, 2H, 4H, 1D, 1W, and 1M timeframe.
EUR/GBP PIP RANGES
Procedure to assess Pip Ranges
- Add the ATR indicator to your chart
- Set the period to 1
- Add a 200-period SMA to this indicator
- Shrink the chart so you can assess a large time period
- Select your desired timeframe
- Measure the floor level and set this value as the min
- Measure the level of the 200-period SMA and set this as the average
- Measure the peak levels and set this as Max.
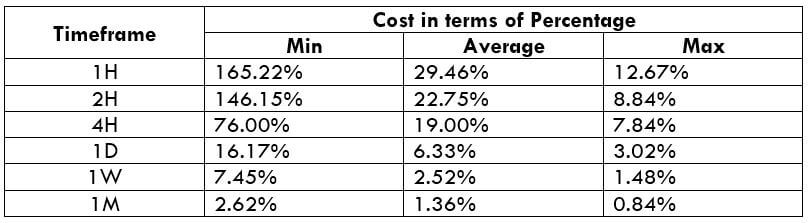
EUR/GBP Cost as a Percent of the Trading Range
An application of the volatility would be the determining of cost on each trade. As in, the ratio between the volatility and the total cost on each trade is calculated and is expressed in terms of percentage. The percentage depicts the cost for a particular timeframe and volatility. The comprehension of it shall be discussed in the subsequent section.
ECN Model Account
Spread = 0.8 | Slippage = 2 | Trading fee = 1
Total cost = Slippage + Spread + Trading Fee = 2 + 0.8 + 1 = 3.8
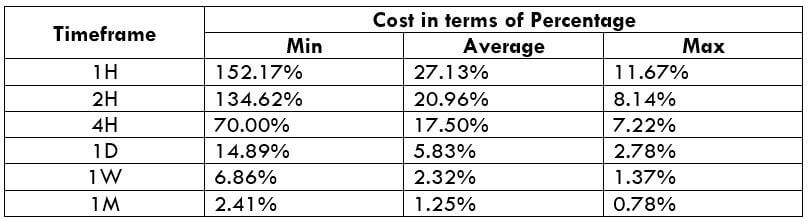
STP Model Account
Spread = 1.5 | Slippage = 2 | Trading fee = 0
Total cost = Slippage + Spread + Trading Fee = 2 + 1.5 + 0 = 3.5
The ideal way to trade the EUR/GBP
With the above two tables, let us figure out the ideal way to trade this currency pair. Note that the higher the percentage, the higher is the cost on a trade and vice versa. It is evident from the chart that the percentages are highest for the minimum column and lowest for the max column. In other words, the cost is high when the volatility of the market is low, and the cost is low when the volatility is high. So does this mean it is ideal to trade when the volatility is high? Well, that’s not the right approach to it, as trading in high volatility is risky. So, it is ideal to take trades during those times when the volatility is around the average range. Doing that will ensure marginal cost as well as decent cost. For example, a 4H trader must take trades during those occasions when the volatility is around 20 pips.
Note: One can apply the ATR indicator to determine the current volatility of the market.
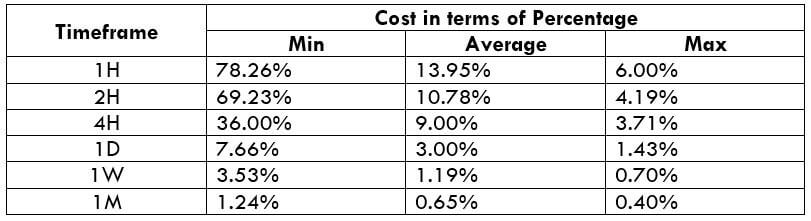
Another feasible way to reduce costs is by canceling out the slippage cost. Cancel slippage costs can simply be done by placing limit orders. With limit orders, the slippage automatically becomes 0.
The difference in the cost percentage when the slippage goes to zero is illustrated as follows.
We hope you find this Asset Analytics informative. Let us know if you have any questions in the comments below. Cheers!