Categories
Beginners Forex Education Forex Assets

The Fundamentals of the Euro (EUR)

The euro (symbol: €/code: EUR) is said to be used by approximately 341 million individuals each day, thus making it the second most-used currency in the world. The currency’s name was formally adopted in 1995 in Madrid upon then President of the European Commission, Jacques Santer, receiving a letter by Belgian Esperantist Germain Pirlot offering the suggestion. Like other currencies, the EUR used to be a commodity currency before becoming a fiat currency in the 1900s.

The idea of creating the EUR commenced in 1992 when certain documents were signed to initiate the process. Years passed and in 1998 a number of countries officially decided to gather around the same currency and adopt the EUR. Before this happened, each European country used a different currency: Germany – German Mark, France – French Franc, Italy – Italian Lira, Span – Peso, etc. These old currency notes were after 1998 exchanged over the new currency we now know under the name euro. This change allowed for easier migrations, travels, and commerce within the continent where an hour or two can get you from one country to several others.

Having a central currency helped the member states overcome and bypass many of the barriers that had previously existed. The EUR unites 19 of the 27 European Union member states in a monetary union called the eurozone or euro area. Many countries in the European territory have decided against using the currency, such as the majority of the Scandinavian countries and the United Kingdom, among others. The following Euro area member countries use the EUR: Austria, Belgium, Cyprus, Estonia, Finland, France, Germany, Greece, Ireland, Italy, Latvia, Lithuania, Luxembourg, Malta, the Netherlands, Portugal, Slovakia, Slovenia, and Spain.

Some countries are part of the EU but have yet to meet certain conditions to be able to adopt the EUR: Bulgaria, Croatia, the Czech Republic, Hungary, Poland, Romania, and Sweden. The following European microstates also use this currency: the British Overseas Territory of Akrotiri and Dhekelia, Montenegro, and Kosovo. The EUR is used outside Europe as well, in special territories of EU members, further complemented by other currencies pegged to the EUR. Countries can join the euro area through fulfilling convergence criteria that are binding economic and legal conditions stipulated by the 1992 Maastricht Treaty. The European Commission and the European Central Bank together decide on a country’s candidacy preparedness to adopt the EUR.

After the publishing of the reports stating their joint conclusion, the ECOFIN Council can rectify this decision upon consulting with the European Parliament and Heads of State, formally allowing the adoption process to start. A country’s readiness for euro adoption, the preparedness for the eurozone accession, or the member status may still not grant the full benefits of being a part of such monetary union due to the existence of certain individual financial irresponsibility which causes other countries to suffer. History has shown us how the more responsible member states had to step in in order to help the other struggling countries, and the period between 2008 and 2010 truly pointed to some concern whether the EUR could endure any longer. Greece, Spain, Ireland, and Italy, for example, were debated upon with regards to the question of keeping the membership status or discontinuing the use of the EUR.

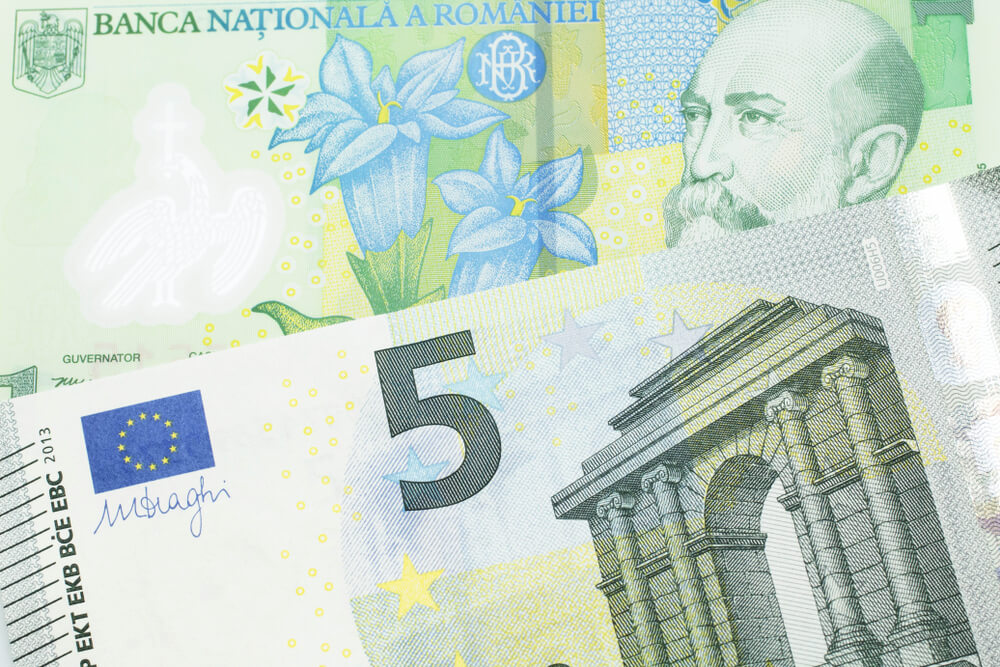
Cyprus is another example of a country that would have collapsed a long time ago were it not for the European Central Bank’s approval of emergency funding. The future still has several questions to find answers to – can so many countries with different cultures, ethics, history, economies, and overall individual differences maintain this union, and can the currency survive the continual struggles it undergoes? While the future alone holds these answers, the idea behind so many countries united under the same currency still prevails even in the EUR banknotes ranging in denomination from €5 to €500. The seven colorful bills, Austrian artist Robert Kalina’s work of art, do not display famous national figures but feature Europe’s map, the EU’s flag, and arches, bridges, gateways, and windows, symbolizing the unity of Europe.

European Central Bank (ECB)

European Central Bank (ECB) is one of the seven institutions of the European Union and the governing body responsible for the 19 EU countries which have adopted the EUR. Headquartered in Frankfurt, Germany, the ECB employs more than 3,500 individuals coming from different parts of Europe and collaborates with the national central banks within the euro area (Eurosystem). Unlike the government of the United States, which in contrast only needs to consider its personal interests, the ECB must create monetary policies in a way that would best benefit all countries connected by the EUR. Although directly governed by European law, this institution resembles a corporation due to its structure of three decision-making bodies: the Governing Council, the Executive Board, and the General Counsel.

The ECB is a single-mandate institution tasked with setting the interest rates for the eurozone, managing the eurozone’s foreign currency reserves, ensuring the supervision of financial markets and institutions and the functioning of the payment system, authorizing eurozone countries’ production of the EUR banknotes, monitoring price trends, and most importantly assessing price stability (inflation). Unlike other central banks, the ECB is not responsible for promoting employment or growth; however, this approach appears to be slowly changing, realizing the need to foster economic development. With regards to decision-making, the main body within the ECB responsible for this task is the Governing Council and all decisions are based on the majority of the votes of the body’s members. It consists of the six members of the Executive Board, accompanied by the governors of the national central banks of the 19 eurozone countries.

The Governing Council typically meets twice a month at the premises of the ECB, yet the monetary policy will be announced in only one of these meetings. The current President of the ECB, Christine Lagarde, who was born in Paris, France, has been performing this task since November 2019. The ECB President, who has the tie-breaking vote, bears a variety of responsibilities: heading the executive board, governing different bodies within the ECB, and representing the bank abroad.

Key Economic Reports

Eurozone’s economic reports differ greatly from the ones of other countries outside Europe. Australia, for example, creates a report that only concerns the country in question. When it comes to the Eurosystem, there are as many reports as there are member countries. Nonetheless, only the reports of France and Germany are said to be of importance for forex traders, as the former holds 40% and the latter holds 20% of the eurozone’s GDP, making the two countries 60% holders of the entire GDP of the Eurosystem. Therefore, due to the previously mentioned percentage, the occurrences within Germany and France should carry more meaning than those in smaller countries.

The main reports traders should be concerned with are then the GDP and employment reports of France and Germany. Moreover, apart from these independent reports, traders should also look into the Eurozone’s employment reports, providing information for the entire Eurosystem. Last, French, German, and eurozone inflation reports (CPI and PPI), are also vitally important as the ECB’s main goal is to combat inflation and its monetary policy will cover all territories governed by the EUR. As the eurozone tends to be growing, the reports in question will cover more and more territories, and traders should keep up with the relevant information in order to be on top of the events pertaining to the EUR.

The Most Traded Pairs

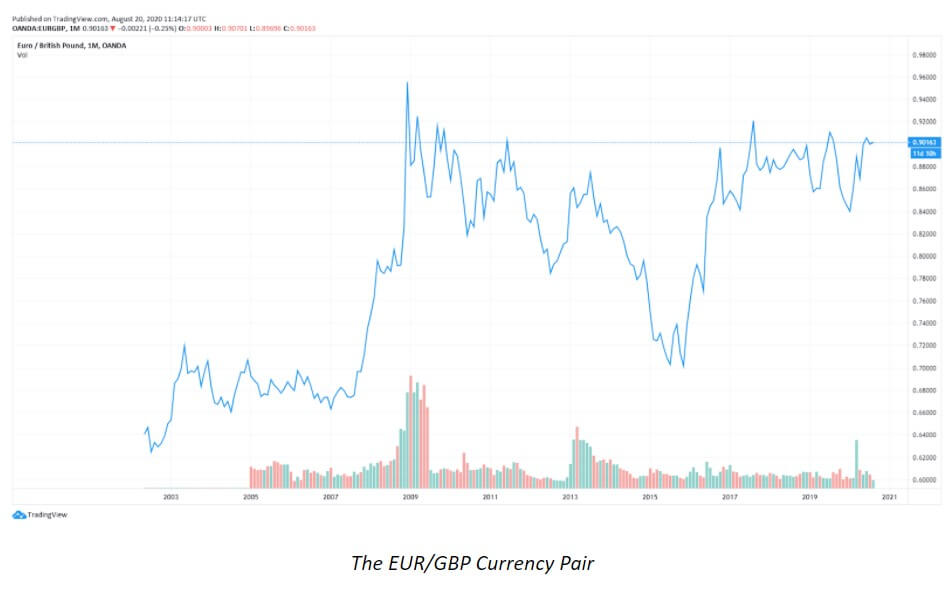
The most traded pairs involving the EUR are EUR/USD, EUR/JPY, EUR/CHF, EUR/GBP, EUR/CAD, and EUR/AUD. As the most traded pair in the world, EUR/USD 36% of all trading volume in the world, which is almost half of all transactions worldwide. As traders interested in news events primarily define liquidity, such great interest in this currency pair probably originates from the fact that it has the most liquidity. The second currency pair in line, EUR/JPY, is said to have the most liquidity, alike EUR/CHF which rounds up the three most traded currency pairs that overall do the most business. The other crosses, EUR/CAD and EUR/AUD appear to be quite popular in the currency market due to their overall good movement and predictable patterns, but the liquidity is not as good as with the first three pairs. Unlike EUR/USD, EUR/JPY, and EUR/CHF, these two currency pairs are increasingly more prone to slippage and volatility. Finally, EUR/GBP is believed to be less volatile than other EUR- or GBP-based crosses owing to the economic closeness and mutual dependence, but changes in the currencies’ respective central banks’ monetary policies could render this pair highly sensitive.

EUR Correlations

  • EUR/GBP

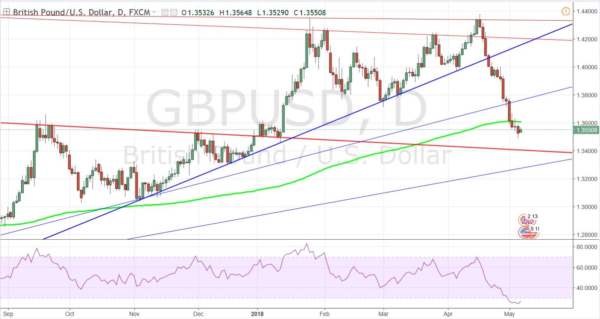
A vast quantity of trade the United Kingdom does is with Europe and vice versa, which is what brought on this prominent correlation in the first place in addition to the two both belonging to the eurozone. Despite them using two different currencies, we can with almost absolute certainty predict that if Europe is struggling at a specific point in time, the UK will most likely follow. In the past few years, this correlation has been impacted by various events that took place across Europe. The 2007/2008 financial crisis affected the entire world, but the UK managed to quickly take action to preserve its economy and currency. The UK’s official currency did plummet and the British economy was on the path of collapsing when in late 2008 the GBP reached its all-time low of €1.02. However, they considered revising their monetary policy and offering quantitative easing which eventually helped the country stabilize the economy.

Europe, on the other hand, took more time to come to terms with what had happened and, in the first two years after the crisis had occurred, Europe created the laws that would later prevent them from enacting bailout plans. Changes had to be made and soon after, between 2013 and 2015, Europe would face the emergence of great debt problems in Portugal, Greece, Spain, and Italy. With the announcement of Brexit in June 2016, the GBP suffered the greatest one-day fall of 6.02% against the EUR. Before the COVID-19 pandemic, the GBP was slowly getting back on its feet, but the current ongoing viral threat and the expectation of a new trade deal between the EU and the UK still make the EUR/GBP imitate the strained relationship between the two. The currency pair even went from its worst (1 EUR equaled 0.8301 GBP in February 2020) to its best exchange rate (1 EUR equaled 0.9427 GBP in March 2020) in one month. 
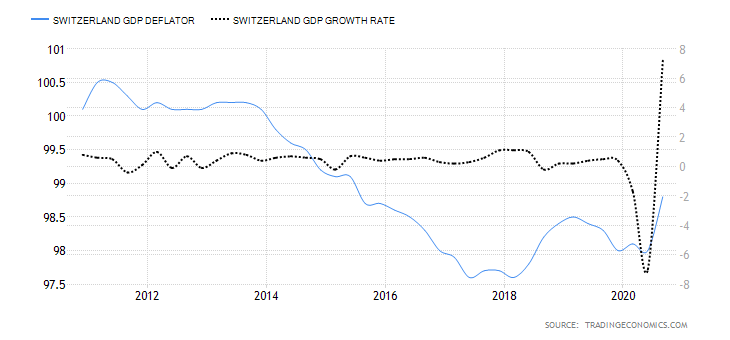
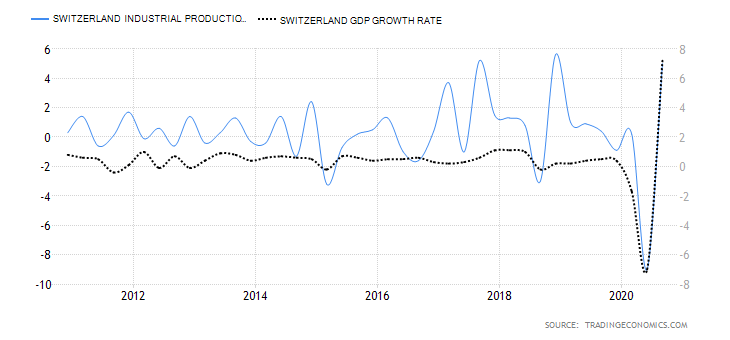
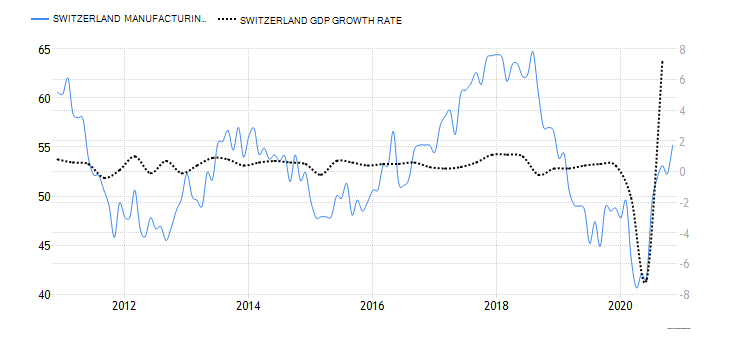
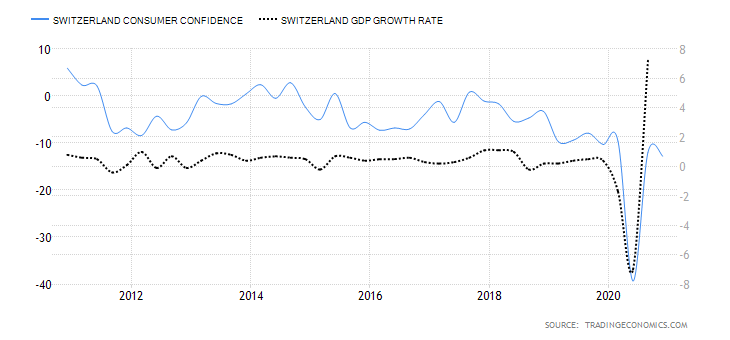
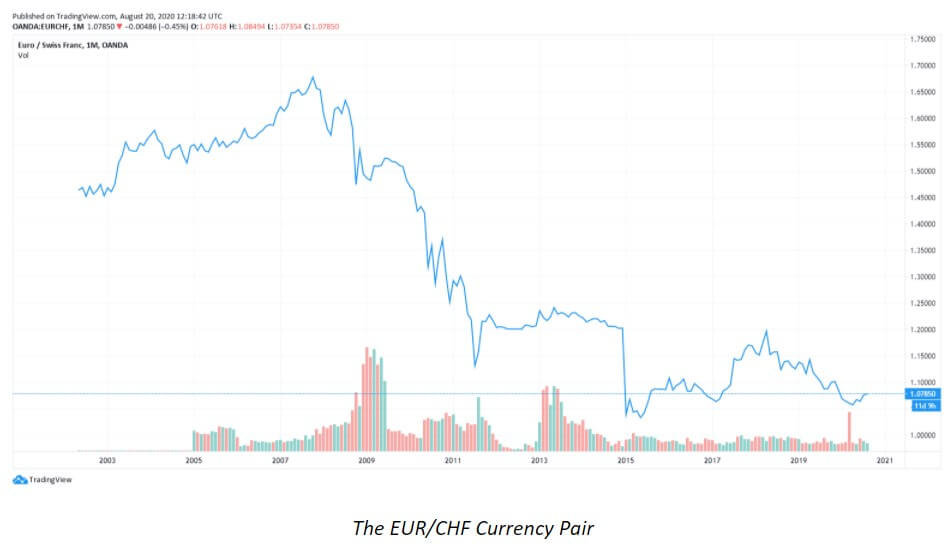
  • EUR/CHF

The correlations between the two currencies have been said to near 100% in particular due to the Swiss policies that have tied the CHF to the EUR. In the times of the EUR crisis, when the currency was plummeting, a great amount of money was directed to Switzerland. The Swiss banks are said to be some of the strongest ones in Europe and their neutral government was believed to be extremely stable, which is why many decided to send their euros in that direction. Owing to this great sell the EUR-buy the CHF movement was reflected in the currency pairs huge moves. At the peak of the crises, the pair would move from 1.40 to 1.05 in a matter of a few months. The moment this happened, the Swiss National Bank (SNB) decided to take action, particularly because their currency was that strong at the time. They put a peg at 1.20 and the chart moved 1500 pips up in approximately one hour. The correlation is still quite high and this generally indicates that the currency pair in question is not the best pair to trade. The EUR/CHF is currently believed not to be the pair from which traders can earn the most because if the EUR moves up, so will the CHF and vice versa. These simultaneous moves will often be of the same amounts and the opportunities to make money are thus limited with this currency pair. Instead of trading this pair, some professional traders believe that one should simply choose to trade other EUR-based pairs due to the greater liquidity of the currency.

Trading the EUR

Country Stability

The JPY and the USD are believed to be the safe-haven currencies, yet the USD may at times exhibit some unfavorable behavior. Traders would in such cases naturally divert to the other currencies with the greatest liquidity, i.e. the JPY and the EUR. The USD generally performs well in times of crisis, while in times of economic prosperity these currency pairs such as AUD/USD or USD/JPY seem to be too small liquidity pools. Naturally, the EUR is a favored alternative due to its high liquidity.
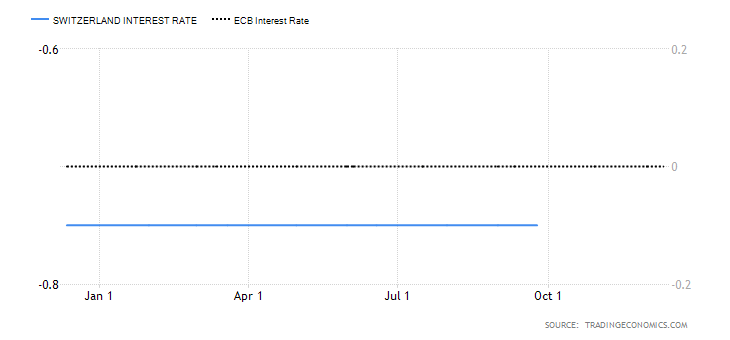
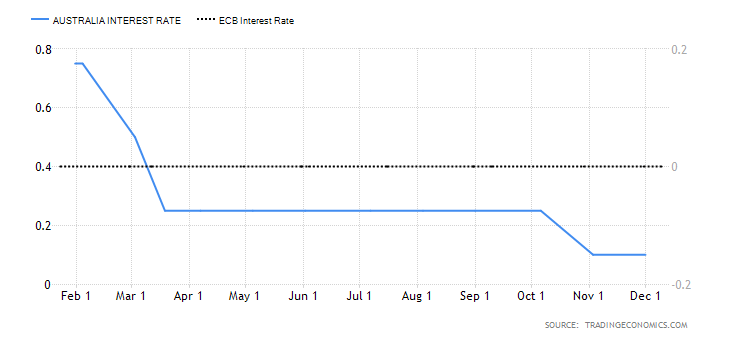
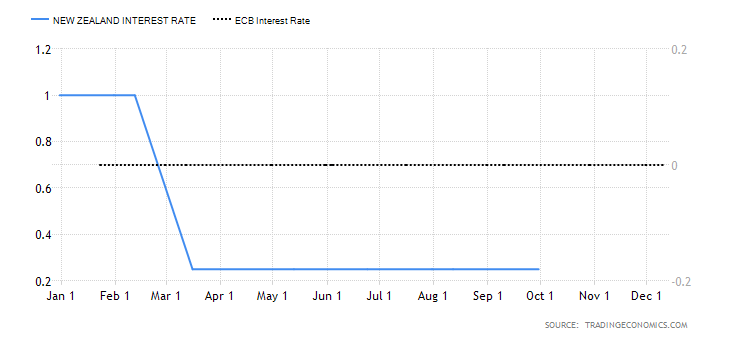
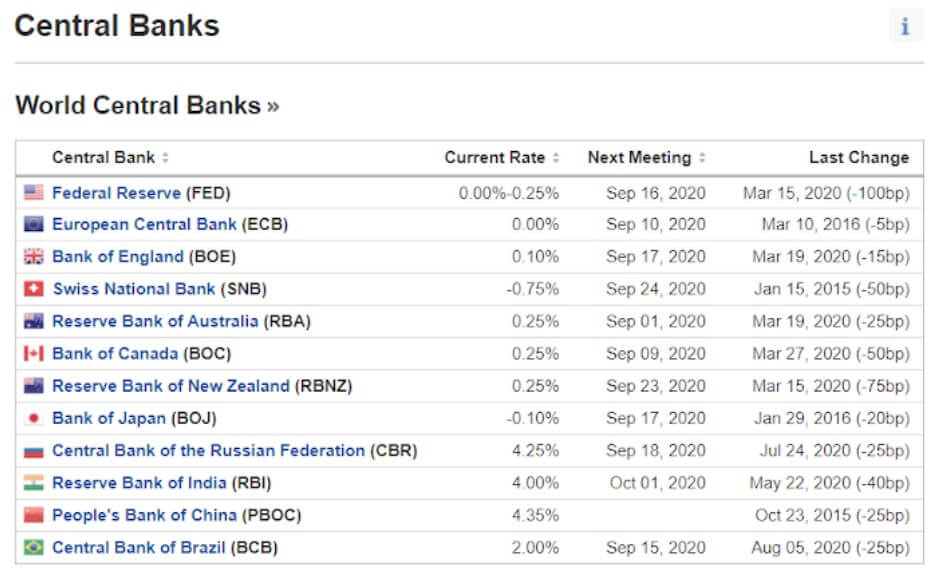
Interest Rates

The interest rates within the eurozone averaged 1.84 percent between 1998 until 2020, with an all-time high of 4.75% reached in October 2000 and a record low of 0% in March of 2016. Currently, the ECB’s interest rate is still set at 0%, last confirmed in July this year. The EUR is typically expected to be in the middle compared to other central banks’ rates (available below) and according to some econometric models the Euro area’s interest rate is projected to trend around 0.00 percent in 2021 as well.

Inflation

The topic of inflation is the European Central Bank’s most important aspect and is, thus, an extremely important indicator to which traders should be attentive when looking into Europe’s reports. Each European country has its individual CPI and PPI, but the same of the eurozone is also extremely important and informative. If inflation is below 2%, the ECB is likely to ease the monetary policy, while the approach may change towards the other end of the spectrum should it exceed 3.5%. 
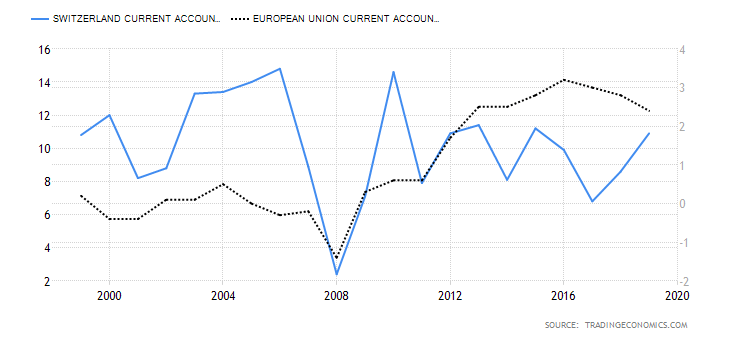
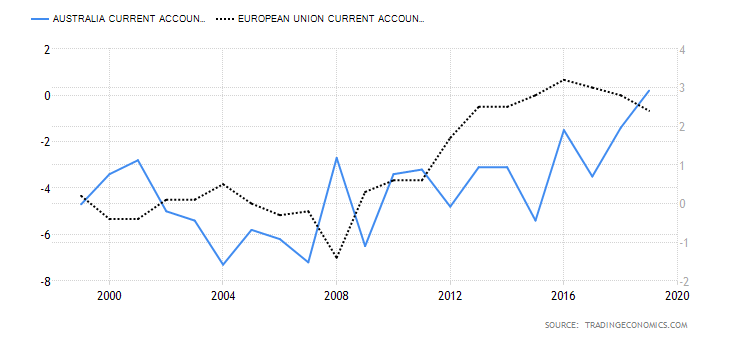
Trade Deficits

Unlike the GBP or the USD, the EUR generally does not suffer from trade deficits, as this has traditionally not been a cause of concern in trading with foreign countries with regard to this currency.
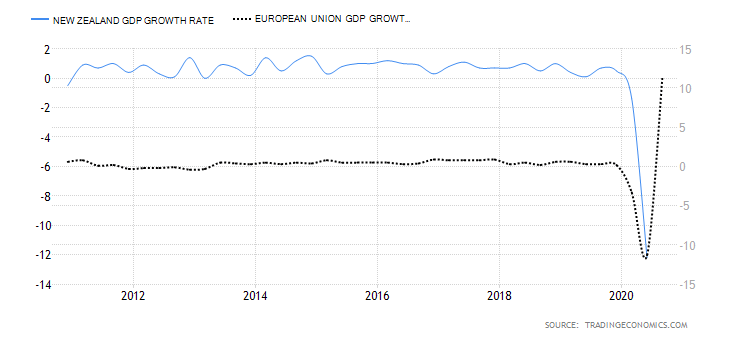
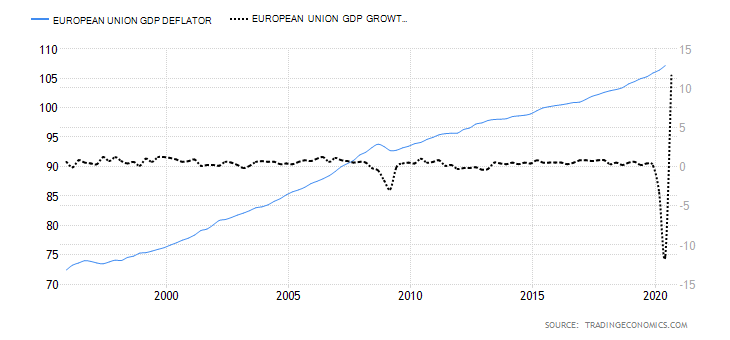
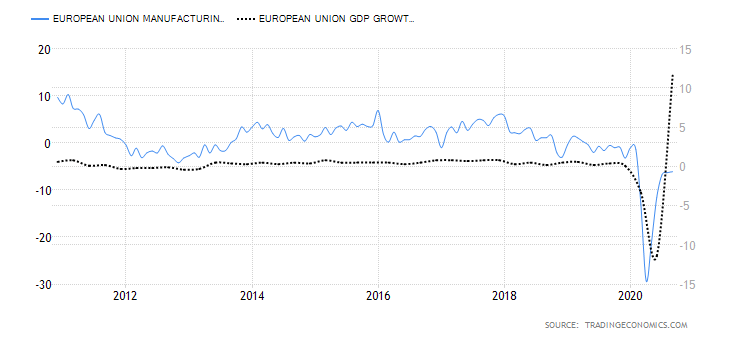
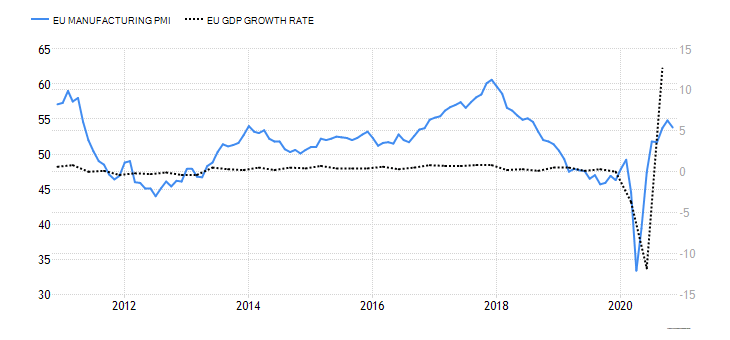
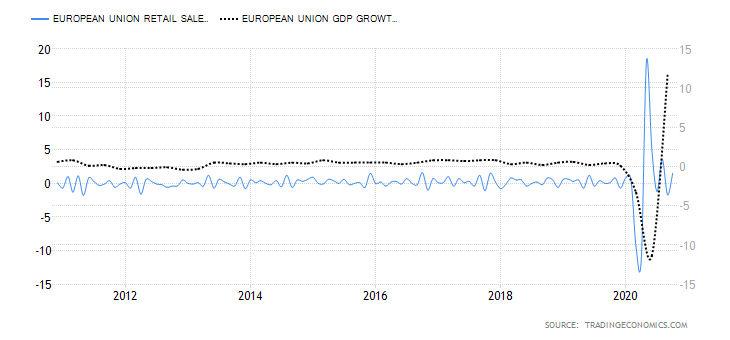
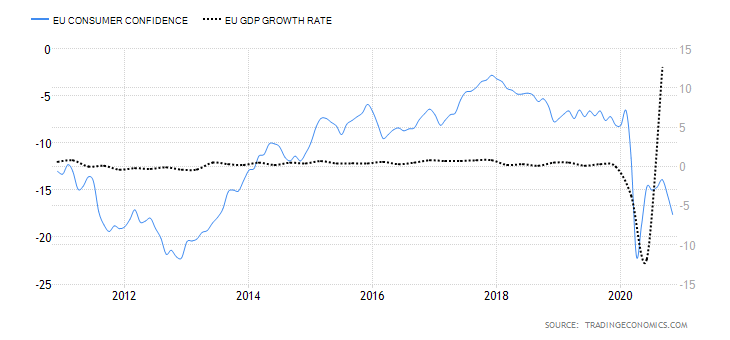
Economic Activity

In terms of the overall economic activity within the Eurosystem, traders should look into GDP reports discussed earlier in the text and, in particular, Germany as the largest European economy and the biggest driver.

Market Analysis

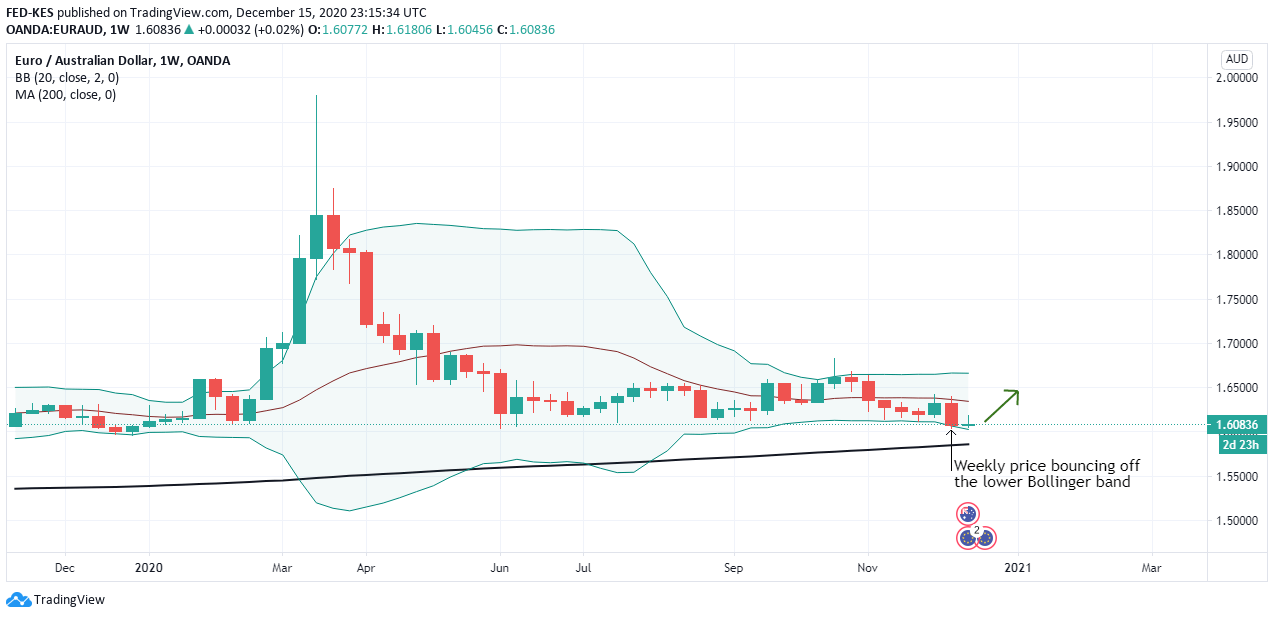
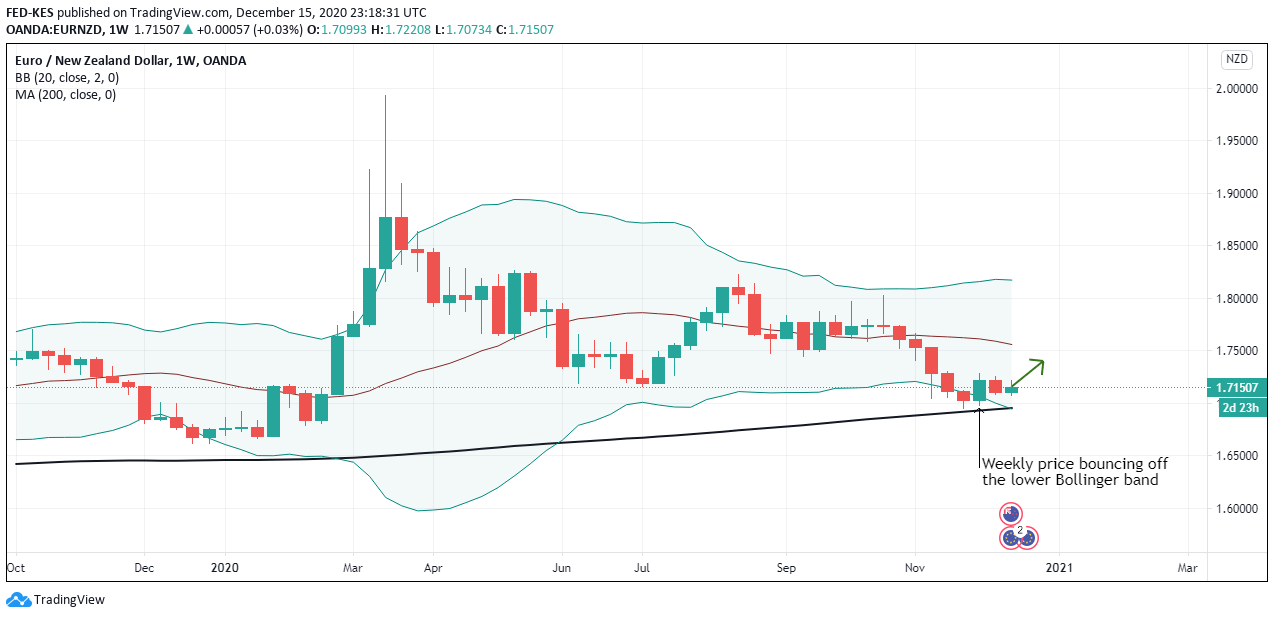
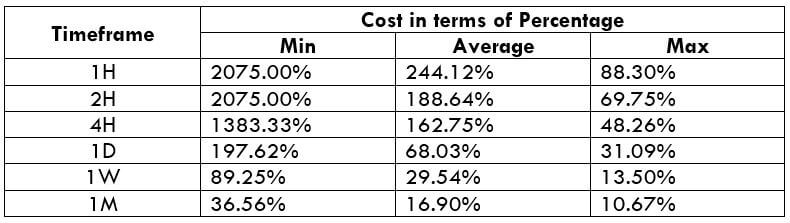
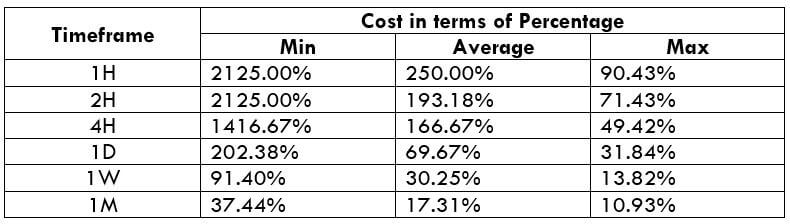
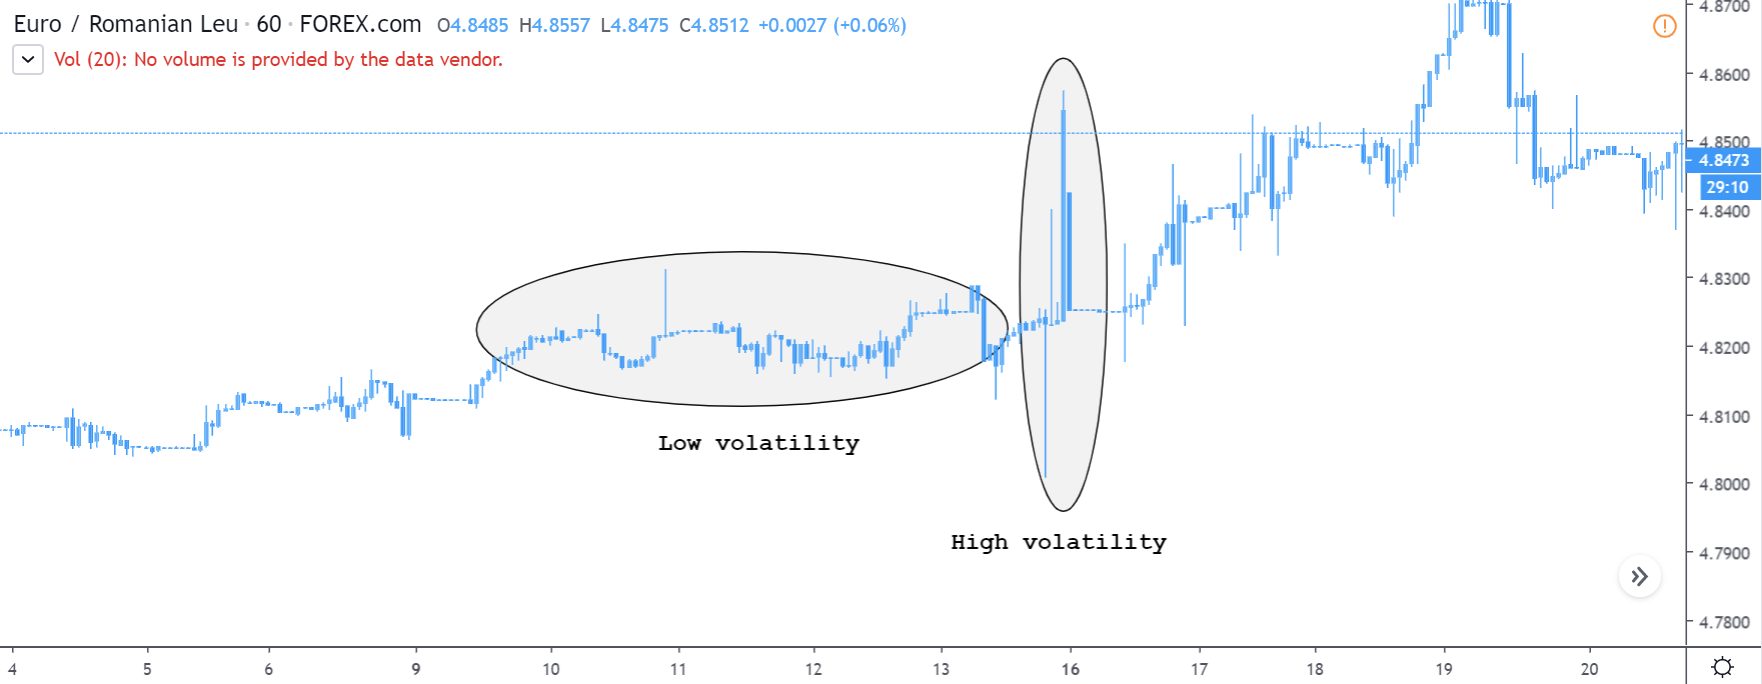
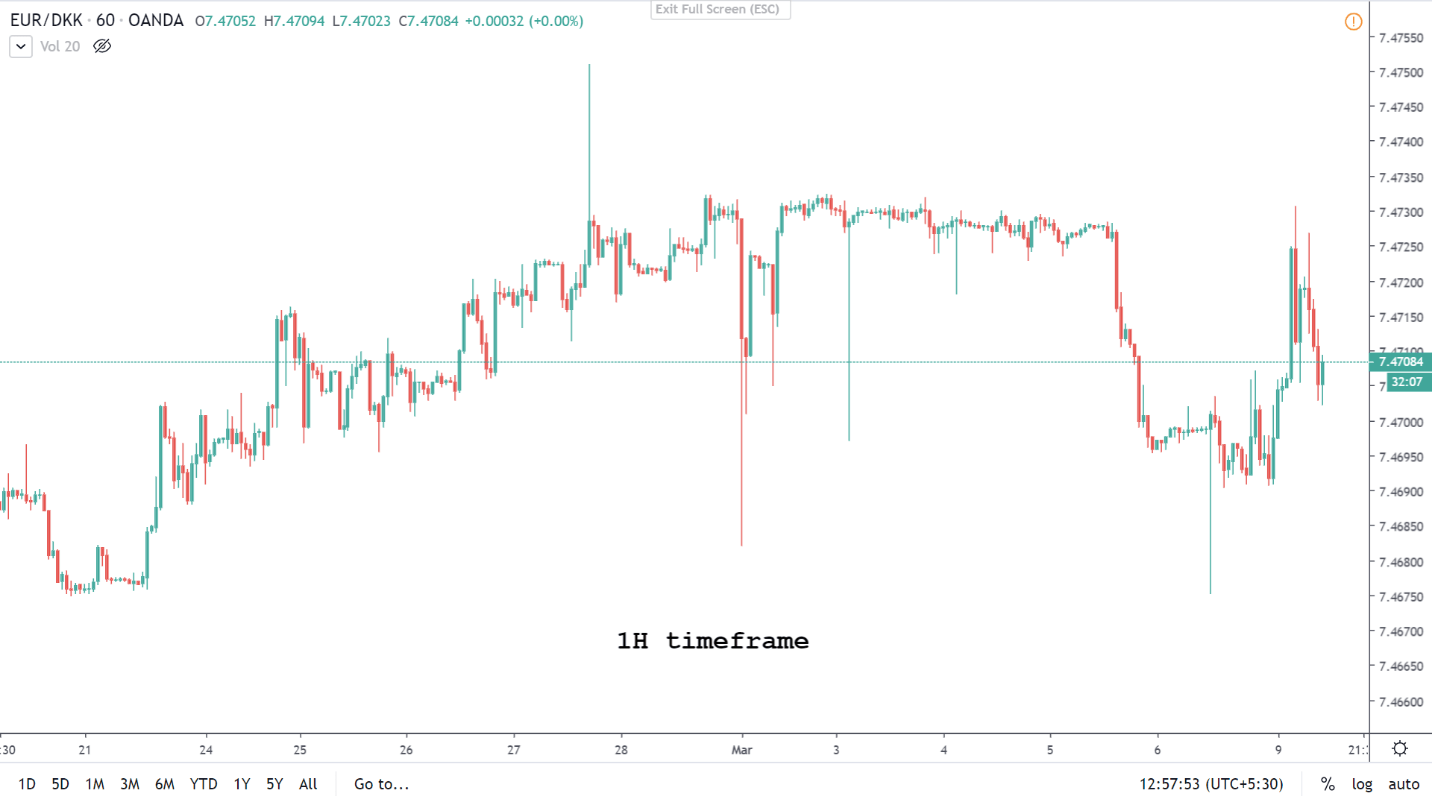
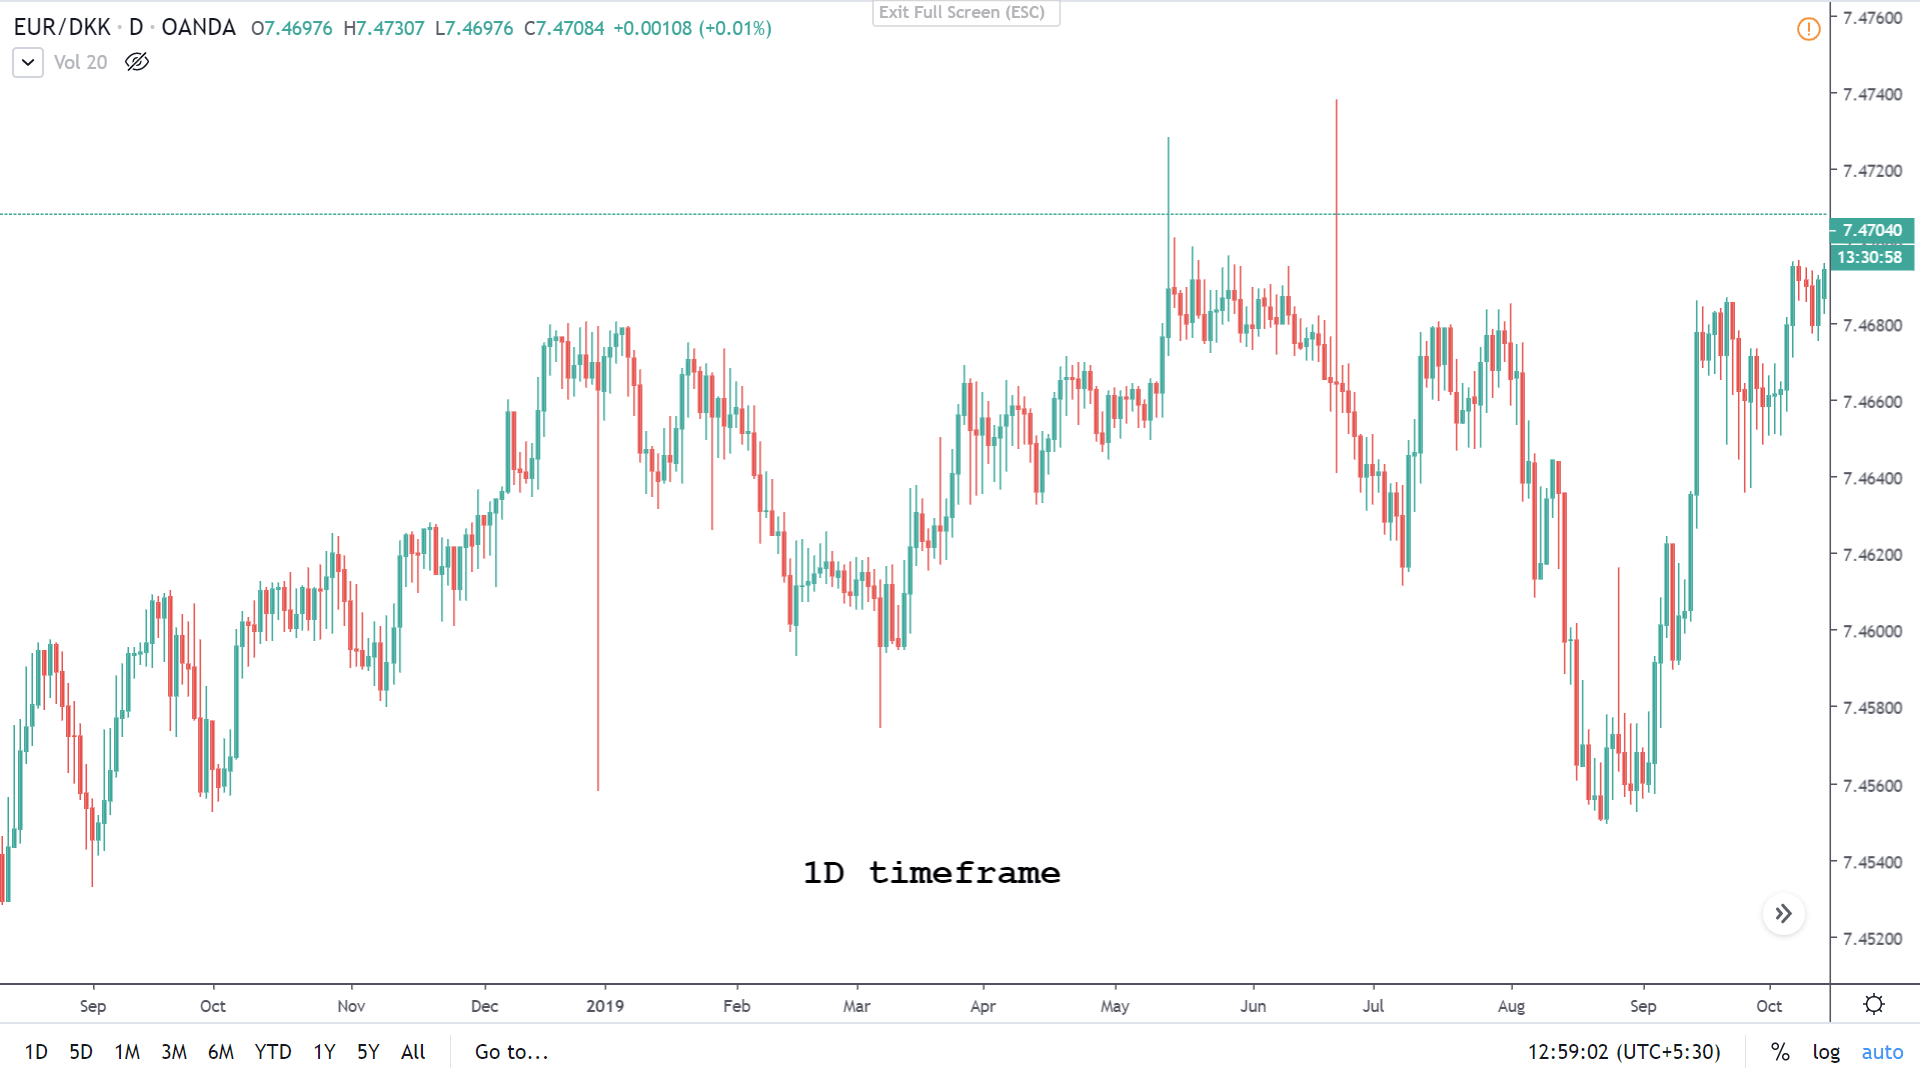
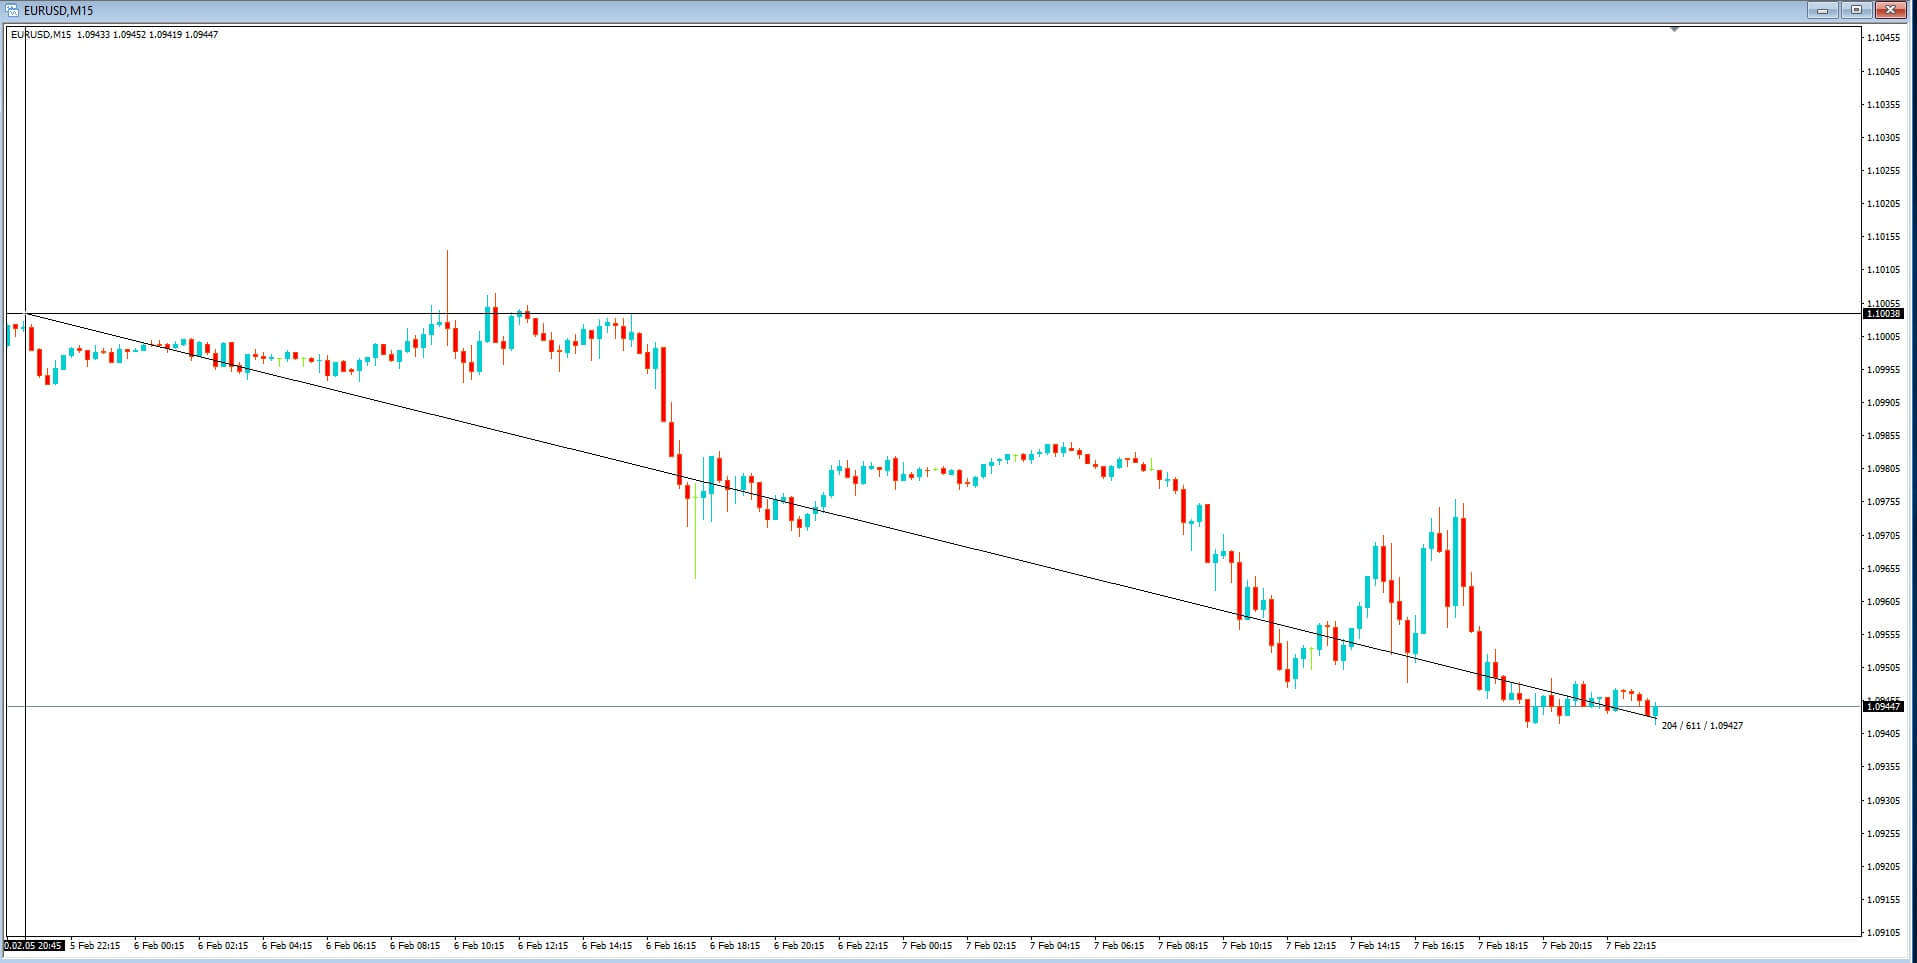
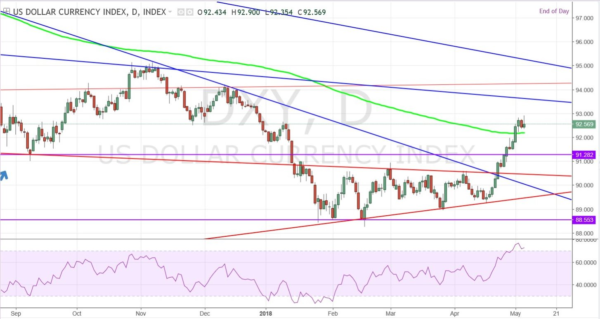
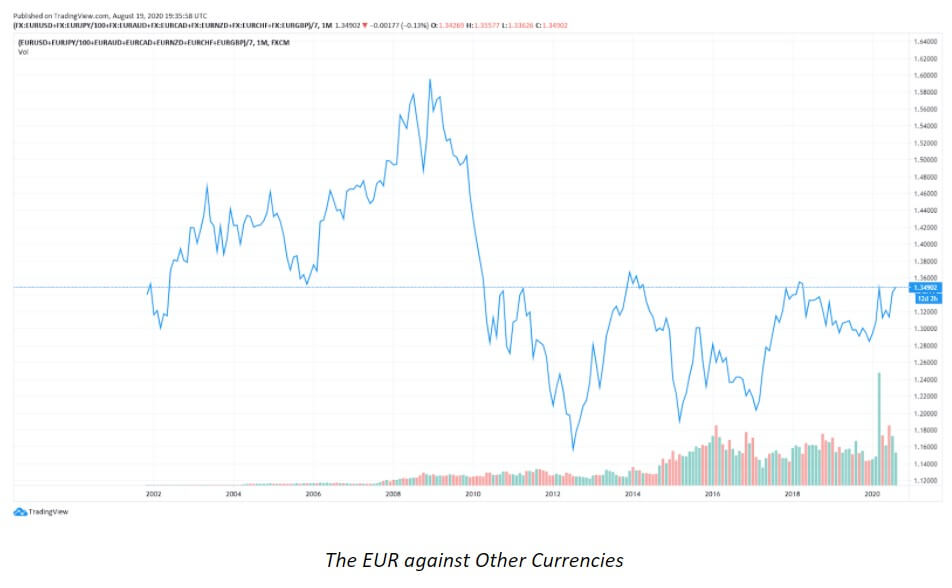
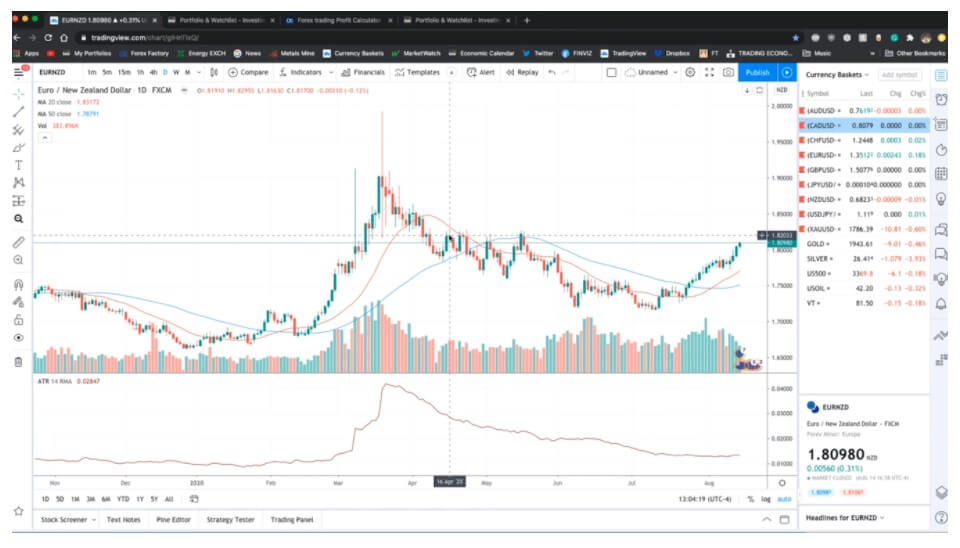
Currently, we are witnessing a decline in overall market volatility with an impactful momentum building up across the markets. As the market keeps moving up, the volatility appears to be further declining. The pattern we are witnessing now, forming towards the end of the chart below, shows how the price broke out and pulled back only to change direction upwards. The EUR crosses rarely appear to be short of such interesting patterns and they seem to be preferred to the upside.

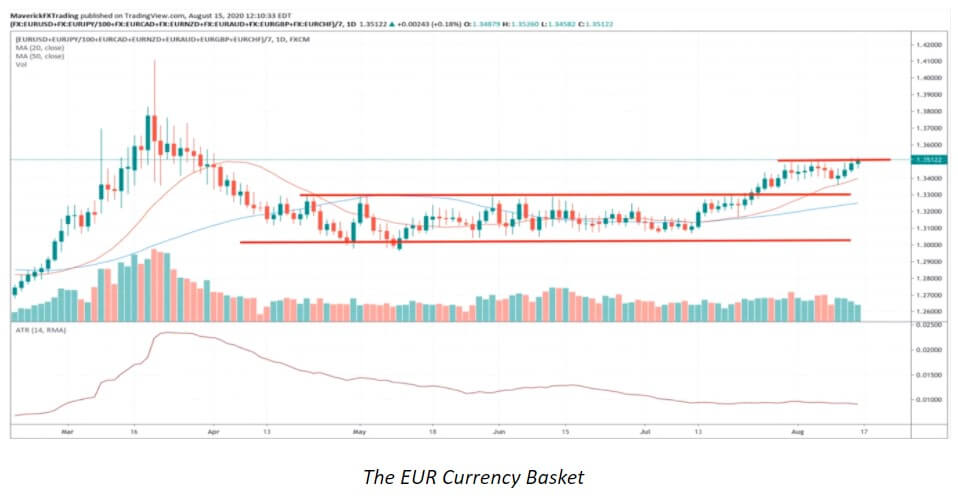
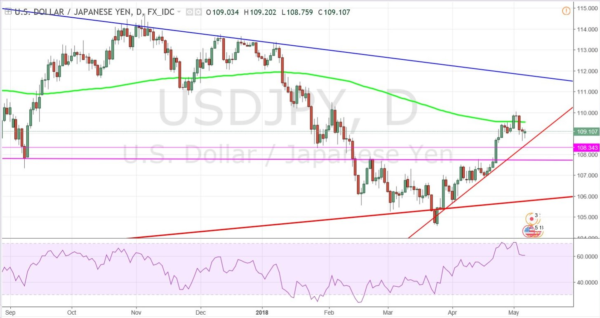
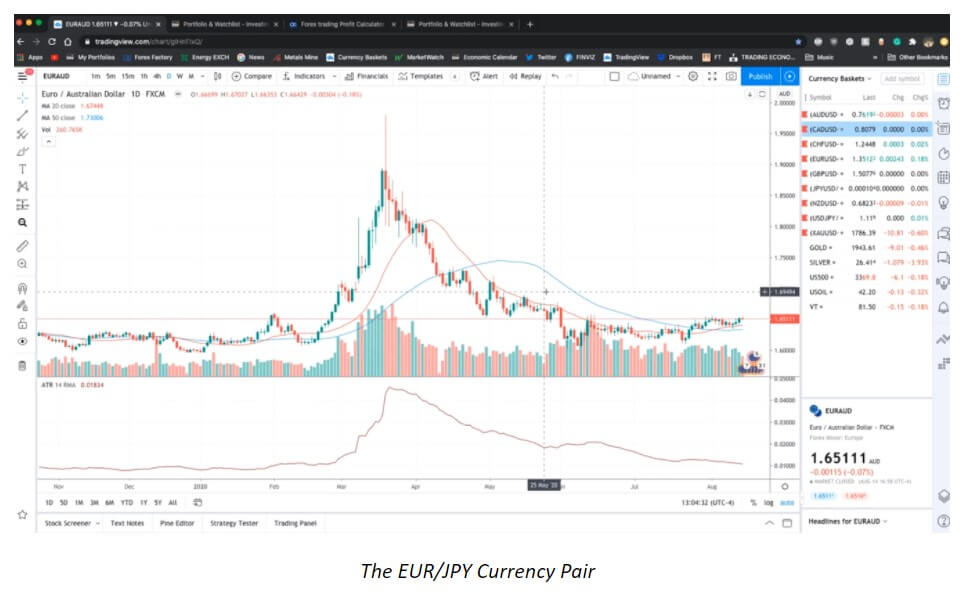
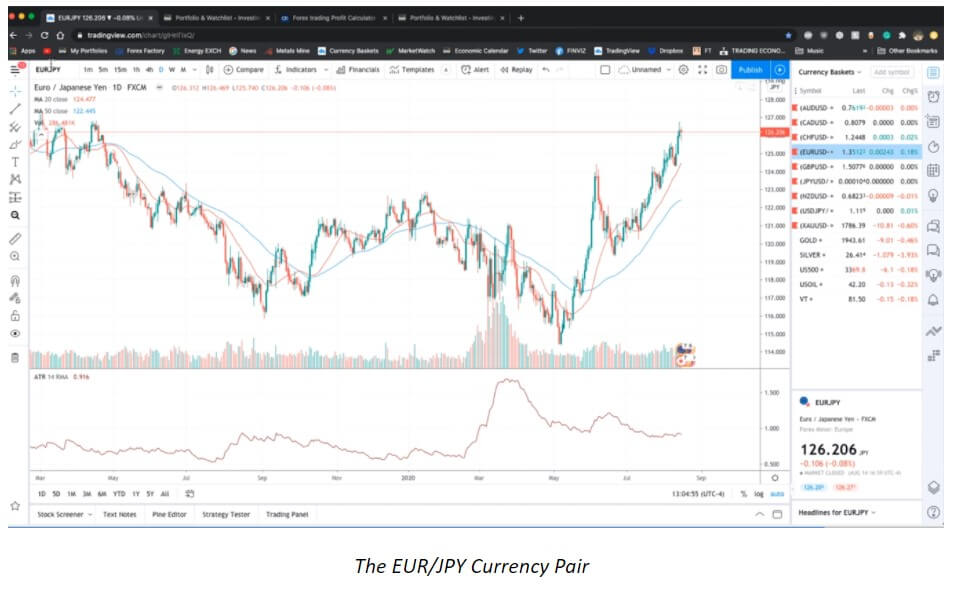
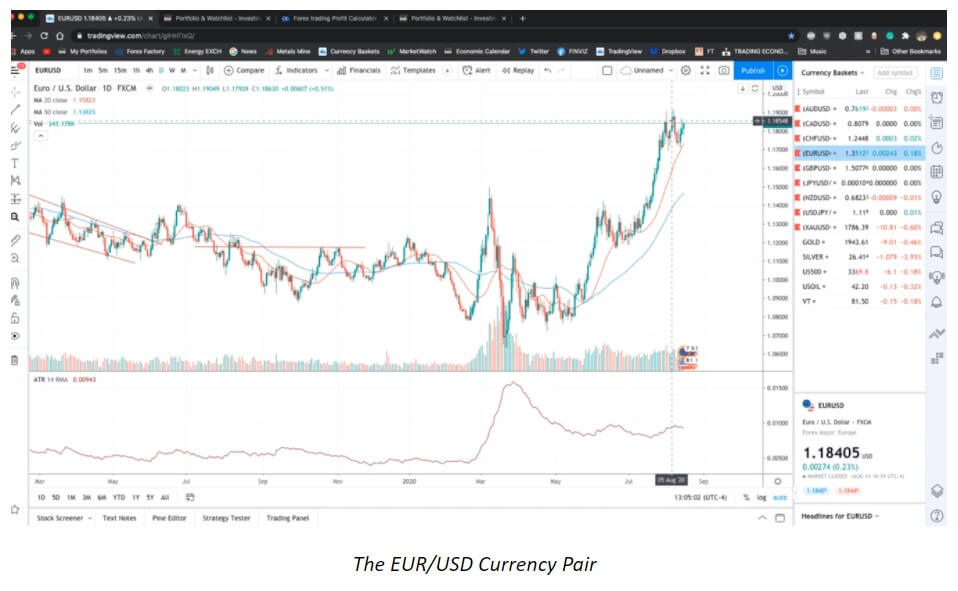
The EUR crosses seem to be developing really well and the EUR/NZD chart, for example, reveals some moving average crosses towards the end of the chart (see all charts below). The EUR/AUD pair also demonstrates this positive development, although we could potentially see a turn of events should the AUD weaken. The EUR/JPY is revealing a momentum taking place, especially when assessing a wider time frame. The EUR/USD activity is unfolding slowly and should it break at some point soon, the price could potentially exceed 1.20. Generally looking at the EUR basket, there seems to be a great possibility for a breakout very soon.

The market has not been showing a great deal of action in the previous few weeks, thus not pushing traders to enter new trades each day. As the final week of August is about to complete the month, we are looking into September expecting more volatility to break the previous consolation and calm periods. Traders interested in trading news events may need to patiently wait out this quiet period, awaiting new rounds of important reports to come out. The EUR currency pairs are doing well during this period, as it seems from the charts above. Nonetheless, for the time being, it is quite difficult to completely interpret the long-term effects the COVID-19 is going to have on the currency.

The EUR has already undergone crises in the past and yet it has lived to become an even stronger currency. The monetary policy of the ECB seems to be slowly adapting and Europe appears to be working hard to promote the currency and ensure its autonomy. The EUR has never challenged the USD and the EUR’s share in international is significantly lower. Still, the media shows an interest in the development of the EUR in these times of crisis, highlighting the belief that the currency’s potential has not been fully reached on a global scale. The EUR has certainly struggled in the past, in particular when the stronger countries had to step in and provide assistance to the weaker ones.

Despite the global viral threat and the history of this unusual currency, the ECB maintains a positive outlook with regard to the EUR, hoping to further promote the currency through a series of vital steps as well as fiscal and monetary policy changes. Currently, we are looking into the future where the EUR is directed towards stabilizing the monetary union, increasing the currency’s influence, and granting more benefits to the eurozone’s member states.

Categories
Forex Market Analysis

Daily F.X. Analysis, January 21 – Top Trade Setups In Forex – ECB Policy Ready to Play! 

The market’s news is likely to offer high impact events from the U.S., while the major focus will remain on the Philly Fed Manufacturing Index and Unemployment Claims. U.S. dollar may exhibit mixed bias until the release of these events as Philly fed manufacturing is expected to perform badly, and the Jobless claims are likely to perform well.

Economic Events to Watch Today  


EUR/USD – Daily Analysis

The EUR/USD continues to trade higher at the 1.2160 level, and a bullish breakout can extend buying trend until the 1.2229 level. The market trading sentiment still represents positive performance on the day as the positive environment around the Asia-Pacific stocks. All-time high upticks in the S&P 500 Futures highlight the risk-on mood, which was being supported by optimism over a potential vaccine/treatment for the highly infectious coronavirus. 

Meanwhile, the increasing hopes over more U.S. stimulus package under Joe Biden’s presidency also played its major role in supporting the market trading sentiment. The hopes of further U.S. stimulus package sparked after the Biden entered the White House, without any losses, which could be considered as one of the major reason behind the latest positive mood in the market,

In response, the broad-based U.S. declined to stop its long bearish bias and remained bearish on the day. The dip in the greenback was further sparked by the optimism over vaccines’ rollout for the highly contagious coronavirus disease, which eroded demand for safe-haven currencies. Therefore, the losses in the U.S. dollar becomes the key factor that kept the currency pair lower. The U.S. Dollar Index that measures the dollar versus a bucket of other currencies dropped by 0.19% to 90.300 by 11:26 PM ET (4:26 AM GMT).

As per the report, the Secretary of the Treasury nominee Janet Yellen urged Congress to “act big” on the Coronavirus relief program and shouldn’t worry about debt through her Senate confirmation hearing. These positive remarks helped the market trading bias to stay bid. 


Daily Technical Levels

Support   Resistance

1.2006     1.2091

1.2039     1.2106

1.2058     1.2139

Pivot Point: 1.2062

EUR/USD– Trading Tip

The EUR/USD is trading with a bullish bias at 1.2128 level. The EUR/USD is holding right below 50 periods EMA on the hourly timeframe, extending the EUR/USD pair’s resistance. On the lower side, the support level continues to hold around 1.2120 and 1.2062 level. The MACD and RSI are suggesting a mixed bias for the EUR/USD pair. Buying can be seen over 1.2115.


GBP/USD – Daily Analysis

The GBP/USD continues to hold its bullish tone through the first half of the day as the pair ran into the weekly highs around the 1.3710 mark. It’s mostly due to the weaker U.S. dollar. The trader hopes for further U.S. fiscal incentive immediately intensified after the U.S. Treasury Secretary candidate Janet Yellen urged lawmakers to act high on the COVID-19 relief package and not bother too much regarding debt. The remarks of Yellen were was seen as one of the critical factors that weakened the safe-haven U.S. dollar and added to the GBPUSD gains. 

Besides this, the dollar losses bolstered by the confidence over the rollout of COVID-19 vaccines, which confer some further support to the GBP/USD pair. The U.S. failed to stop its long bearish bias and remained bearish on the day. The losses in the U.S. dollar were further sparked by the optimism over vaccines’ rollout for the highly contagious coronavirus disease, which eroded demand for safe-haven currencies. Therefore, the losses in the U.S. dollar becomes the key factor that kept the currency pair lower. The U.S. Dollar Index that tracks the greenback against a bucket of other currencies dropped by 0.19% to 90.300 by 11:26 PM ET (4:26 AM GMT).

Conversely, the anxieties regarding increasing COVID-19 cases and economically-painful hard lockdowns in the U.K. keep questioning the pair’s upside impulse. The U.K. coronavirus strain has been discovered in at least 60 countries so far, as per the WHO report. The Kingdom announced 33,355 fresh virus cases and 1,610 deaths on the day. Globally, the number of cases has exceeded 96 million, prompting the pair’s upside momentum. Besides, the reports of likely shortage of vaccine in New York and postponement of Pfizer’s vaccine to Canada also seems to question the Sterling bullish bias.


Daily Technical Levels

Support   Resistance

1.3555     1.3722

1.3445     1.3781

1.3387     1.3890

Pivot Point: 1.3613

GBP/USD– Trading Tip

The GBP/USD is also heading north amid a weaker dollar, as it trades at a 1.3655 level. Continuation of an upward trend can lead the Cable towards the next target area of 1.3700 level. At the same time, the Cable may find support at 1.3628 level today. On the higher side, the bullish breakout of 1.3701 level can extend buying trend until 1.3736. The GBP/USD is supported by 10 and 20 periods EMA on the two-hourly timeframes, suggesting further buying in the pair. Let’s consider trading bullish over 1.3715 level today. 


USD/JPY – Daily Analysis

Today in the early European trading session, the USD/JPY currency pair failed to stop its previous-session selling bias and remained depressed around two-weeks low around below 103.5 level as the U.S. dollar faced some follow-through selling pressure, which, in turn, was seen as one of the key factors that exerting downside pressure on the USD/JPY currency pair. The bearish bias surrounding the U.S. dollar was mainly sponsored by the increasing optimism over the massive U.S. stimulus measures under the newly inaugurated Joe Biden administration, which undermined demand for safe-haven currencies. 

Simultaneously, the prevalent risk-on environment undermined the Japanese yen and helped the currency pair limit deeper losses. Meanwhile, the dovish comments by the BoJ Governor, Haruhiko Kuroda, added further burden on the JPY and extended some additional support to the USD/JPY currency pair to halt its bearish rally. Currently, the USD/JPY currency pair is currently trading at 103.47 and consolidating in the range between 103.33 – 103.67.

Conversely, the equity market’s positive performance weakened the Japanese yen and helped the currency pair limit its deeper losses. Also capping the currency pair’s losses could be the dovish comments by the BoJ Governor, Haruhiko Kuroda, which further weighed on the JPY and extended some support to the USD/JPY pair to stop its bearish rally. As per the latest report, Kuroda repeated that the BoJ observes the coronavirus’s impact very closely and will not hesitate to ease further if needed. The Japanese central bank updated its GDP target for the fiscal year 2020 to -5.6% from the previous projection of -5.5%.

On the different page, the concerns about rising COVID-19 deaths and re-imposing the economically-painful hard lockdowns keep challenging the upbeat market mood, which could change the currency pair’s direction.

Looking forward, the market traders will keep their eyes on updates from the Biden administration. Meanwhile, the European Central Bank’s (ECB) monetary policy and U.S. Unemployment Claims will also be key to watch. In addition to this, the risk catalyst like geopolitics and the virus woes will not lose their importance.


Daily Technical Levels

Support   Resistance

103.53     104.16

103.31     104.56

102.91     104.78

Pivot Point: 103.94

USD/JPY – Trading Tips

The USD/JPY continues to trade sideways in between a wide trading range of 104.340 – 103.560. The USD/JPY has formed a sideways channel on the 4-hour timeframe, and it has the chance of leading the pair towards the next resistance level of 104.800 upon the breakout of 104.810. The 50 periods EMA supports the bullish trend, and we may have odds of taking a buying trade over the 103.570 level today. Good luck! 

Categories
Forex Course

208. Using Yuppy (EUR/JPY) As A Leading Indicator For Stocks!

Introduction

EUR/JPY is among the most popular pairs in the international foreign exchange market. In fact, it indicated approximately 3% of the overall daily transaction. Moreover, it is indicated as the seventh-highest traded currency pairs in the forex market. Both traders and investors can leverage the potentials of the EUR/JPY currency pair as they both carry a high degree of volatility.

Best Time To Trade in EUR/JPY

Although you can trade EUR/JPY at any time of the day, to leverage the most benefit, you must trade when the pair is most volatile. Between 7:30 and 15:30 is the time when the currency pair trade is the busiest.

Factors Impacting EUR/JPY Rate

When it comes to making the most lucrative trade with this pair, it is important to understand what influences its rate.

Prominence Of EUR

Like many modern currencies, the prominent factors that impact the Euro price flow are financial, political, and economic. For instance, many trade decisions regarding the Euro are backed by the European Central Bank’s monthly reports.

These reports can influence the fluctuations in the Euro’s rates, and traders and investors promptly leverage the details as quickly as they are released to determine the flow of the Euro rates.

In economic terms, news releases focusing on employment can also play an important role in the fluctuations of euro rates. These details are easily accessible and offer vital insights into the economic condition of the Euro and the movement of Euro prices.

The Prominence of JPY

Japan’s economy has more factors that play an important role in determining the flow of currency. The basic health of the economy will play a significant role in involving a high rate of export and import trading. One uncommon factor that impacts the flow of the country’s currency is situations such as a natural disaster.

The Right Way To Trade EUR/JPY

In terms of speculative trading, CFDs provide traders and investors with easy access to a plethora of markets. They like to transact with CFDs as derivatives trading implies that buying the actual currency is unnecessary. When trading, investors and traders like to harness technical analysis and assess the EUR/JPY chart. This is done to determine the relationship of the pairing and forecast the highs and lows of the markets.

[wp_quiz id=”102014″]
Categories
Forex Fundamental Analysis

EUR/CHF Global Macro Analysis – Part 3

EUR/CHF Exogenous Analysis

  • The EU and Switzerland Current Account to GDP differential

The ratio of the current account to GDP helps us determine the level of a country’s participation in the international market. When a country has net exports, it means that it will have a current account surplus; and, the larger the surplus, the higher the current account to GDP ratio. Conversely, a country with higher imports than exports; it means it has a current account deficit, and its current account to GDP ratio will be lower.

The domestic currency will be in higher demand in the forex market when a country is a net exporter.

In 2020, the Swiss Current Account to GDP is projected to reach 7.5% and that of the EU 3.4%. Thus, the current account to GDP differential between the EU and Switzerland is -4.1%. That means we should expect that the CHF will be in higher demand than the EUR. Thus, we assign a score of -5.

The interest rate differential for the EUR/CHF pair determines which of these currencies is preferable to investors and carry traders in the forex market. When the interest rate differential is positive, it means that investors will earn more by buying the EUR. Similarly, carry traders will be bullish on the EUR/CHF pair, thus driving the exchange rate higher. A negative interest rate differential implies that the Swiss Franc will be preferable to investors, while carry traders will be bearish on the pair.

The Swiss National Bank has maintained the interest rate at -0.75% throughout 2020, and the ECB interest rate has been at 0%. The interest rate differential for the EUR/CHF pair is 0.75%. We assign a score of 2.

  • The EU and Switzerland GDP Growth Rate differential

The GDP growth differential is the difference between the rate at which the EU and the Swiss economy are growing. This will help us identify which economy is growing faster. A positive GDP growth differential between the EU and Switzerland will result in a higher exchange rate for the EUR/CHF pair. A negative one will lead to a drop in the exchange rate for the pair.

In the first three quarters of 2020, the EU economy has contracted by 2.9% while the Swiss economy contracted by 1.5%. The GDP growth rate differential is -1.4%. We assign a score of -3.

Conclusion

The exogenous factors between the EUR/CHF pair have a score of -6; which implies that the pair can be expected to be on a downtrend in the short term.

As you can see above, the Technical analysis shows that the weekly chart for the EUR/CHF pair has failed to breach the upper Bollinger band successfully and has bounced off of it supporting our fundamental analysis. All the best.

Categories
Forex Fundamental Analysis

EUR/CHF Global Macro Analysis – Part 1 & 2

Introduction

In conducting the global macro analysis of the EUR/CHF pair, we’ll focus on endogenous economic factors that contribute to the growth of GDP in the EU and Switzerland. Exogenous factors that influence the exchange rate of the EUR/CHF in the forex market will also be analysed.

Ranking Scale

A sliding scale of -10 to +10 will be used to rank the impact of endogenous and exogenous factors.

The ranking of the endogenous factors will be based on their correlation analysis with the GDP growth rate. A negative score implies that they resulted in the contraction of the economy hence depreciating the domestic currency. A positive score implies that they led in economic expansion hence appreciation of the domestic currency.

The exogenous factors are ranked based on their correlation with the EUR/CHF exchange rate. A positive score means that the pair lead to an increase in the exchange rate, while a negative ranking means that the exchange rate has decreased.

EUR Endogenous Analysis – Summary

The EUR’s endogenous analysis has a score of -3. This implies that the Euro had marginally depreciated in 2020.

CHF Endogenous Analysis – Summary

The change in the level of employment covers the quarterly developments in the labour market in Switzerland. The statistic includes the changes in both fulltime and parttime employment. Typically, changes in employment is a result of changes in business activities.

In Q3 of 2020, 5.08 million people were employed in Switzerland compared to 5.02 million in Q2. The employment level is still below the 5.11 million registered in Q1. We assign a score of -4.

  • Switzerland GDP Deflator

Switzerland GDP deflator is used to calculate the change in real GDP in terms of prices of all goods and services produced within the country. This is a comprehensive measure of inflation compared to measures like CPI and PPI, which only focus on a small portion of the economy.

In Q3 2020, Switzerland GDP deflator rose to 98.8 from 98 in Q2.  Up to Q3, the GDP deflator has increased by 0.8 points. The increase in inflation can be taken as an indicator that the economy is bouncing back from the economic shocks of the coronavirus pandemic. We assign a score of 3.

  • Switzerland Industrial Production

This indicator shows the changes in output for firms operating in the manufacturing, mining, quarrying, and electricity production. Although Switzerland is not heavily dependent on industrial production, it is still an integral part of the economy.

In Q3 2020, the industrial production in Switzerland increased by 5% from a drop of 9% in Q2. The YoY industrial production for Q3 was down 5.1%. For the first three quarters of 2020, the industrial production is down 3.8%. We assign a score of -3.

  • Switzerland Manufacturing PMI

This is an indicator of the economic health of the Swiss manufacturing sector. The purchasing managers are surveyed based in a questionnaire which covers the output in the sector, suppliers’ deliveries, inventories, new orders, prices, and employment. A PMI of above 50 shows that the Swiss manufacturing sector is expanding, while below 50 shows that the sector is contracting.

In November 2020, Switzerland manufacturing PMI rose to 55.2 from 52.3 in October. This is the highest reading since December 2018 and the fourth consecutive month of expansion since July. We assign a score of 7.

  • Switzerland Retail Sales

The retail sales measure the consumption of final goods and services by households in Switzerland. The expenditure by households drives the aggregate demand in the economy, which results in the changes in GDP.

In October 2020, Switzerland retail sales increased by 3.2% from a drop of 3.2% in September. YoY retail sales increased by 3.1% in October from 0.4% in September. Up to October 2020, the average retail sales has increased by 0.84%. We assign a score of 1.

  • Switzerland Consumer Confidence

About 1000 Swiss households are surveyed in January, April, July and October. They are evaluated based on their opinions about the economy, job security, financial status, inflation, and purchases. Consumer confidence tends to be higher when the economy is expanding and low during recessions.

In Q4 2020, the Swiss consumer confidence dropped to -12.8 from 12 in Q3. Although it is higher than it was in Q2 at the height of the pandemic, it is still lower than in Q1. The expectations on households’ financial situation also dropped to -6.6 from -4.2 in Q2. Households were increasingly pessimistic about the labour market and their job security. this can be attributed to the uncertainties that surround the ongoing coronavirus pandemic. We assign a score of -2.

  • Switzerland Government Gross Debt to GDP

This is the total amount that the Swiss government owes to both domestic and international lenders is expressed as a percentage of the GDP. It helps us to understand and evaluate the size of the debt relative to the size of the economy. At below 60%, the government is seen as being able to service its debt obligations and have room to acquire more debt without straining the economy.

In 2019, the Switzerland government gross debt to GDP was 41% same as in 2018. In 2020, it is expected to range between 49% and 51% due to aggressive expenditure to alleviate the shocks of coronavirus pandemic. We assign a score of -1.

In the very next article, you can find the exogenous analysis of the EUR/CHF Forex pair. Please check that and let us know if you have any questions below. Cheers.

Categories
Forex Fundamental Analysis

EUR/CAD Global Macro Analysis Part 1 & 2

Introduction

The global macro analysis of the EUR/CAD pair will analyze endogenous factors that drive the domestic GDP in the EU and Canada. We’ll also analyze exogenous factors that affect the dynamics of the EU and Canada economies, hence affecting the EUR/CAD exchange rate.

Ranking Scale

We’ll rank both endogenous and exogenous factors on a sliding scale from -10 to +10. When the endogenous factors are negative, it means they caused the domestic currency to depreciate. A positive ranking means they resulted in an appreciation of the currency during the period under review. The endogenous scores are based on correlation with the domestic GDP growth.

Similarly, when the exogenous factors get a negative score, they resulted in a drop in the exchange rate. A positive exogenous score means it increased the exchange rate of the EUR/CAD pair. The exogenous scores are based on a correlation with the price of the EUR/CAD pair.

EUR Endogenous Analysis – Summary

The endogenous analysis of the EUR has presented a score of -3. Based on the indicators that we have analyzed, we can conclude that the Euro has depreciated marginally this year.

CAD Endogenous Analysis – Summary

This economic indicator shows the monthly change in the number of Canadians who are employed. It covers both full-time and part-time employment. Normally, employment changes correspond to an increased business activity, which corresponds to changes in the GDP.

In November 2020, employment in Canada increased by 62,000, down from the 83,600 increase registered in October. The November employment change was the lowest since May 2020, when economic recovery from the effects of the coronavirus began. Up to November 2020, the Canadian economy has shed about half a million jobs. We assign a score of -6.

  • Canada GDP Deflator

The GDP inflator is a comprehensive measure of the change in the inflation rate in Canada. It is comprehensive since it reflects the changes in the prices of all goods and services produced within the economy. This contrasts with other measures of inflation like the CPI, which only measures changes in the price of a select basket of goods and services.

In Q3 of 2020, the GD deflator in Canada rose to 111.6 from 108.8 in Q2. Q3 reading is the highest ever in the history of Canada. This shows that the Canadian economy is bouncing back from the economic downturn brought about by the pandemic. We assign a score of 2.

  • Canada Industrial Production

This indicator measures the total output from businesses operating in the industrial sector. Canadian industrial production comprises mining, manufacturing, and utilities. It is the backbone of the Canadian economy, with crude oil production alone accounting for almost 10% of the GDP.

In September 2020, the YoY Canadian industrial production dropped by 7.9%, while the MoM increased by 1.41%, up from the 0.13% drop in August. Up to September, the overall industrial production is down 5.54%. We assign a score of -5.

  • Canada Manufacturing PMI

This indicator measures the Canadian manufacturing sector’s performance from the perspective of firms’ purchasing managers in the sector. The PMI aggregates the following indexes; inventories, employment, new orders, output, and suppliers’ deliveries. The sector is expanding if the index is above 50, while a reading below 50 shows contraction.

In November 2020, the Canada Manufacturing PMI rose to 55.8 from 55.5 in October. This marked the fifth consecutive expansion in the manufacturing sector from July 2020. Thus, we assign a score of 4.

  • Canada Retail Sales

The Canada retail sales data measures the changes in the value of final goods and services purchased by households over a particular period. It is a critical leading indicator of the overall economic growth since households’ consumption is considered the primary driver of GDP growth.

In September 2020, the MoM retail sales in Canada increased by 1.1%  compared to a 0.5% increase in August. YoY retail sales rose by 4.6% compared to 3.7% in August 2020. Up to September 2020, the retail sales figure has risen by an average of 1.38%. We assign a score of 3.

  • Canada Consumer Confidence

Canada consumer confidence is calculated from an aggregate of 11 questions from the survey of households. This survey estimated the current situation to that expected by households in about six months. The questions touch on the areas of the economy, personal finances, job security, household purchases, and savings vs. expenditure goals. Their confidence is measured on a scale from 0 to 100.

In November 2020, consumer confidence in Canada rose to 44.5 from 42.08 in October. It is, however, still lower than during the pre-pandemic period. We assign a score of -5.

  • Canada Government Gross Debt to GDP

In 2019, Canada had a government debt to GDP ratio of 88.6%, down from 89.7% in 2018. The 2019 ratio was the fourth consecutive year since 2016, when the government debt to GDP ratio dropped.

In 2020, it is projected that the Canadian government debt to GDP ratio will increase to 97%. This increase is due to the increased expenditure to alleviate the economy during the coronavirus pandemic. Over the long term, Canada’s government debt to GDP ratio is expected to stabilize around 90%. We assign a score of -2.

In the next article, you can find the exogenous analysis of the EUR/CAD forex pair where we have qualitatively forecasted the future price movement of this pair. Cheers.

Categories
Forex Fundamental Analysis

EUR/AUD Global Macro Analysis – Part 3

EUR/AUD Exogenous Analysis

  • The EU and Australia Current Account to GDP differential

The current account to GDP shows the percentage of a country’s international trade that makes up the GDP. Countries with higher current account surplus have a higher current account to GDP ratio while those running deficits have a negative current account to GDP ratio.

In this case, if the GDP differential is positive, it means that the exchange rate for the EUR/AUD pair will increase. But if the differential is negative, then the exchange rate for the pair will drop.

In 2020, the current account to GDP ratio in the EU is expected to hit 3.4% and -1.5% in Australia. Thus, the current account to GDP differential is 4.9%. We assign a score of 3.

Typically, investors put their money into financial instruments that offer higher interest rates. Therefore, the country with a higher interest rate should be expected to have more inflow of funds than that with a lower interest rate. Note that when foreign investors invest in the local economy, they have to convert their money into the domestic currency. This conversion increases the demand for the domestic currency in the forex market hence increasing its value.

In forex trading, if the EUR/AUD pair has a positive interest rate differential, it means that the exchange rate of the pair will increase. Conversely, a negative interest rate differential implies that the pair has a bearish outlook.

In 2020, the Reserve Bank of Australia cut the cash rate from 0.75% to 0.1%, while the ECB has maintained interest rates at 0%. Therefore, the interest rate differential for the EUR/AUD pair is -0.1%. We assign a score of -3.

  • The EU and Australia Growth Rate differential

In any economy, the value of the domestic currency is mostly determined by the growth of the local economy. Therefore, a country whose economy is growing faster will see its domestic currency appreciate faster.

If the growth rate differential is negative for the EUR/AUD pair, we can expect a bearish outlook. If it is positive, it implies that the exchange rate for the pair will rise.

For the first three quarters of 2020, the Australian economy contracted by 4% and the EU economy by 2.9%. The GDP growth differential is 1.1%. We assign a score of 2.

Conclusion

The EUR/AUD exogenous factors have a score of 2. If the conditions observed in the exogenous factors persist, we can expect that the pair will adopt a bullish trend in the short-term.

The technical analysis of the EUR/AUD shows the weekly price chart bouncing off the oversold region of the lower Bollinger bands. More so, the pair is still trading above the 200-period MA. All the best.

Categories
Forex Fundamental Analysis

EUR/AUD Global Macro Analysis – Part 1 & 2

Introduction

Global macro analysis of the EUR/AUD pair will focus on the endogenous analysis of fundamental factors driving economic growth in the EU and Australia. It will also involve exogenous analysis that will focus on factors that influence the EUR/AUD pair’s exchange rate.

Ranking Scale

This analysis will assign a score between -10 and +10, depending on the endogenous and exogenous factors’ impact.

A negative score for the endogenous factors means that the local currency shed some value. When positive, it means that the domestic currency has appreciated. The endogenous score is determined through correlation analysis between the endogenous factors and the GDP growth rate.

On the other hand, when the exogenous factors have a negative score, it means that the exchange rate between the EUR and the AUD will drop. A positive score means that the exchange rate will rise. The exogenous score is determined via a correlation analysis between the exogenous factors and the EUR/AUD pair’s exchange rate.

EUR Endogenous Analysis – Summary

The endogenous analysis of the EUR has an overall score of -3. Based on the factors we have analyzed, we can expect that the Euro has marginally depreciated in 2020.

AUD Endogenous Analysis – Summary

As you can see in the below image, according to the Endogenous Indicators of AUD, we can conclude that this currency has depreciated as well in 2020.

The employment change in Australia tracks the monthly number of people who are gainfully employed or engaged in unpaid work. The fluctuation in the number of those employed on a full-time or parttime basis helps to show economic growth.

Between September and October 2020, the number of those employed in Australia increased by 178,800. This shows that the economy is recovering and adding more jobs to the labor market. However, from January to October, the Australian labor market has lost about 190,100 jobs. Hence, we assign a score of -6.

  • Australia GDP Deflator

The GDP deflator measures the overall inflation for the economy. It is a comprehensive measure of inflation rate compared to other measures since it accounts for the changes in the prices of all goods and services produced within Australia. Changes in the prices often correspond to changes in economic growth.

In the third quarter of 2020, the Australia GDP deflator rose to 102.03 points from 101.64 in Q2. Up to Q3, the GDP deflator in Australia has dropped by 0.07 points. We assign a score of -2.

  • Australia Industrial Production

Industrial production measures the quarterly changes in output from the manufacturing sector, utilities, and mining. Note that the Australian economy is heavily dependent on commodity exports, which means that industrial production changes significantly impact economic growth.

In Q2, the industrial production in Australia dropped by 3.3%, while the YoY Q3 industrial production dropped by 2.02%. The drop in Q2 is the largest quarterly drop in over 25 years. We assign a score of -6.

  • Australia Manufacturing PMI

This PMI is from a survey of companies operating in the industrial sector. The index shows whether the manufacturing sector in Australia is expanding or contracting. In Australia, the Ai Group surveys the changes in new orders, employment, inventory, output prices, and production levels. When the index is above 50, it means that the manufacturing sector is expanding and contracting when it’s below 50.

In November 2020, the AIG Australian manufacturing PMI dropped to 52.1 from 56.3 in October. Despite the drop, the Australian manufacturing PMI points to growth in the industrial sector. Hence, we assign a score of 6.

  • Australia Retail Sales

The retail sales data in Australia tracks the monthly change of the consumer expenditure on goods and services. Consumer goods include items of clothing and footwear, food, and household items. Purchases made in restaurants, departmental stores, and hotel services and deliveries are also included as retail sales.

In October 2020, the MoM retail sales increased by 1.4% from a 1.1% drop in September. In 2020, the average MoM retail sales have grown by 0.97%. We assign a score of 2.

  • Australia Consumer Confidence

The Melbourne Institute and Westpac Bank survey about 1200 households in Australia and constructs the consumer confidence index. The index is based on households’ evaluation of their financial condition for the preceding year and in the next 12 months. It also includes their economic expectations in the next one and five years. When the index is above 100, it shows that households are optimistic and pessimistic if the index is below 100. Note that consumer confidence about their finances and the economy determines their level of expenditure; hence, it drives the rate of GDP growth.

In December 2020, consumer confidence in Australia rose to 112 from 107.7 in November, which is the highest in over ten years. We assign a score of 5.

  • Australia Government Debt to GDP

The government debt to GDP determines the ability of the economy to service its debts. It also impacts the ability of the government to take on more debt to advance an economic agenda. A debt level of below 60% of the GDP is preferable since it ensures that the government can take on more debt without over-leveraging the economy.

In 2019, the Australian government debt to GDP rose to 45.1% from 41.5% in 2018. In 2020, it is expected to reach 50% on account of increased government expenditure during the coronavirus pandemic. We assign a score of -3.

Please check our following article where we discuss the Exogenous analysis of the EUR/AUD Forex pair. Cheers.

Categories
Forex Fundamental Analysis

EUR/NZD Global Macro Analysis – Part 3

EUR/NZD Exogenous Analysis

  • The EU and New Zealand Current Account to GDP differential

An economy’s current account comprises the balance of trade, net transfer payments, and net factor income. In international trade, a country with a higher current account surplus experiences higher demand for its domestic currency. That means the value of its currency will be higher. Typically, a higher current account to GDP means that the country has more current account surplus.

For the EUR/NZD pair, if the differential of the current account to GDP is negative, it means that the pair’s exchange rate will fall. If it’s positive, we can expect the pair’s exchange rate to increase.

In 2020, New Zealand’s current account to GDP is forecasted to reach -0.8% while that of the EU 3.4%. Thus, the current account to GDP differential between the EU and New Zealand is 4.2%. We assign a score of 4.

The prevailing interest rate in a country determines the flow of capital from foreign investors. Naturally, the country that offers a higher interest rate will attract more foreign investors who seek higher returns. Similarly, a country with lower interest rates will experience an outflow of capital by foreign investors. In the forex market, a currency pair with a positive interest rate differential tends to be bullish since traders are buying the base currency – which offers a higher interest rate and sell the quote currency – which has a lower interest rate. Conversely, a currency pair is expected to be bearish if the interest rate differential is negative since investors will sell the base currency and buy the quote currency.

In 2020, the Reserve Bank of New Zealand cut the official cash rate to 0.25%, while the ECB maintained the interest rate at 0%. Hence, the interest rate differential for the EUR/NZD pair is -0.25%. We assign a score of -3.

  • The EU and New Zealand GDP Growth Rate differential

The value of a country’s domestic currency is impacted by the growth rate of the local economy. Thus, comparing the growth rate between countries’ GDP growth rates helps determine which currency appreciated or depreciated more than the other.

The New Zealand economy contracted by 3.2% in the first three quarters of 2020 and that of the EU by 2.9%. The GDP growth rate differential is 0.3%. We assign a score of 2.

Conclusion

The EUR/NZD exogenous analysis has a cumulative rank of 3. This means that the pair is expected to trade in a bullish trend in the short-term.

The bullish trend can also be observed from the technical analysis of the weekly price charts. The pair is trading above the 200-period MA and the weekly price rebounding from the lower Bollinger Band.

We hope you found this analysis informative. If you have any questions, please let us know in the comments below. Cheers!

Categories
Forex Fundamental Analysis

EUR/NZD Global Macro Analysis – Part 1 & 2

Introduction

In conducting the global macro analysis for the EUR/NZD pair, we will analyze the endogenous factors that impact the EU and New Zealand economic growth. We’ll also analyze exogenous economic factors that affect the EUR/NZD pair’s exchange rate in the forex market.

Ranking Scale

We will rank the effects of the endogenous and exogenous factors on a sliding scale of -10 to +10. The endogenous factors will be ranked based on correlation analysis with the GDP growth rate. When the endogenous ranking is negative, it means that the domestic currency will depreciate and appreciate when positive.

Similarly, the exogenous factors are scored based on correlation analysis with the EUR/NZD pair’s exchange rate. A positive score means that the EUR/NZD pair’s price will rise and drop if the score is negative.

Summary – EUR Endogenous Analysis

Based on the factors we have analyzed, we have got a score of -3, and we can expect the Euro to be marginally depreciating in 2020.

Summary – NZD Endogenous Analysis

A score of -4 on NZD Endogenous Analysis implies that in 2020, the NZD has depreciated as well.

Employment change measures the quarterly change in the number of people who are gainfully employed. It can be used as a comprehensive measure of the labor market changes, which corresponds to economic growth.

In Q3 of 2020, Employment in New Zealand dropped by 0.8%, from a 0.3% drop in Q2 to 2.709 million. The Q3 reading is the largest drop in QoQ employment since Q1 of 2009. We assign a score of  -6.

  • New Zealand GDP Deflator

This indicator measures the quarterly changes in the price of all economic output in New Zealand. It is regarded as the most specific inflation measure since it covers price changes for every good and service produced.

In Q2 of 2020, the New Zealand GDP deflator dropped to 1238 points from 1242 in Q1. This shows that the economy contracted in Q2. Hence, we assign a score of -3.

  • New Zealand Manufacturing Sales

New Zealand manufacturing sales track the change in the volume of total sales made in the manufacturing sector. The indicator tracks the sales in 13 industries, which comprehensively represents New Zealand’s economy. The changes in the volume of sales are directly correlated to the growth of the economy.

In Q3 of 2020, the YoY manufacturing sales in New Zealand increased by 3.1% after dropping by 12.1% in Q2 and 1.9% in Q1. The increase in Q3 is the largest recorded since January 2017. However, since the overall industrial production is still at multi-year lows, we assign a score of -6.

  • New Zealand Manufacturing PMI

This index is aggregated from a survey of purchasing managers in the manufacturing sector. It is a composite of scores regarding output in the sector, prices, expected output, employment, new orders, and inventory. When the PMI is above 50, it means that the manufacturing sector is expanding. A PMI score below 50 shows that the sector is contracting. Naturally, these periods of expansions and contractions are leading indicators of changes in the GDP growth rate.

In November 2020, the New Zealand manufacturing PMI rose to 55.3 from 51.7 in October. The rise was due to increased new orders, inventory, production, and deliveries, as uncertainties surrounding COVID-19 decreased. We assign a score of 4.

  • New Zealand Retail Sales

The retail sales track the changes in the quarterly purchase of final goods and services by households in New Zealand. Although retail sales are often affected by seasonality and tend to be highly volatile, it is a significant measure of the overall economic growth since consumer expenditure is one of the primary drivers of GDP growth.

In Q3 of 2020, New Zealand retail sales increased by 28% from 14.8% recorded in Q2. Historically, the Q3 retail sales increase is the largest rise recorded in New Zealand since 1995. The increase was driven by increased expenditure on groceries, vehicles, and household goods. On average, the QoQ New Zealand retail sales figure has grown by 4.1%. We assign a score of 4.

  • New Zealand Consumer Confidence

The New Zealand consumer confidence is also called the Westpac McDermott Miller Consumer Confidence Index. The index measures the quarterly change in consumers’ pessimism or optimism about the performance of the economy. When the index is above 100, it shows increased optimism by households, and that below 100 shows pessimism.

In the fourth quarter of 2020, New Zealand consumer confidence rose to 106 from 95.1 in Q3. The increased optimism was driven by higher readings in both the current and expected financial situation. We assign a score of 2.

  • New Zealand Government Net Debt to GDP

Investors use this ratio to determine if the economy is capable of servicing its debt obligations. Consequently, the government’s net debt to GDP affects the government securities yield and determines a country’s borrowing costs. Typically, levels below 60% are deemed favorable.

In 2019, the New Zealand Government Net Debt to GDP dropped to 19% from 19.6% in 2018. In 2020, it is projected to range between 27% to 32%, which would be the highest since 1998. We assign a score of 1.

In the next article, we have done the exogenous analysis of both EUR and NZD pairs to accurately forecast this currency pair’s future trend. Please check that out. Cheers.

Categories
Forex Fundamental Analysis

EUR/GBP Global Macro Analysis – Part 1

Introduction

A global macro analysis attempts to analyze the endogenous factors that influence the value of a country’s domestic currency and exogenous factors that affect how the domestic currency fairs in the forex market. The endogenous analysis will cover fundamental economic factors that drive GDP growth in the UK and the Euro Area. The exogenous factors will analyze the price exchange rate dynamics between the EUR and the GBP.

Ranking Scale

Both the endogenous and the exogenous factors will be ranked on a scale of -10 to +10. A negative ranking for the endogenous factors means that they had a deflationary effect on the domestic currency. A positive ranking implies that they had an inflationary impact. Similarly, a negative score for the exogenous factors means the EUR/GBP is bearish and bullish when the score is positive.

EUR Endogenous Analysis – Summary

The endogenous analysis of the EUR has an overall score of -3. Based on the factors we have analyzed, we can expect that the Euro has marginally depreciated in 2020.

This is a quarterly measurement of the changes in both part-time and full-time employment in the EU. It includes individuals working for profit or pay and those who perform family work unpaid. Changes in employment help put economic growth in perspective since an expanding economy corresponds to increased employment opportunities and a contracting economy leads to job losses.

In the third quarter of 2020, employment in the EU increased by 0.9% compared to the 2.7% drop in Q2. Up to Q3 2020, employment in the EU has dropped by 2.1 %. Based on correlation with GDP, we assign a score of -5.

  • European Union GDP Deflator

The GDP deflator is an in-depth measure of the rate of inflation. It measures the changes in the price levels of all goods and services produced in an economy. Therefore, it is the perfect measure of the changes in real economic activities. i.e., it filters out any nominal changes in price.

In Q3 of 2020, the EU GDP deflator rose to 107.17 from 106.37 in Q2. Cumulatively, the EU GDP deflator in 2020 has increased by 2.45. We assign a score of 3 based on the weak correlation between the inflation rate and GDP.

  • European Union Manufacturing Production

In the EU, manufacturing production accounts for about 80% of the total industrial output. With most EU economies heavily reliant on manufacturing, the sector forms a significant portion of the GDP and the labor market.

In September 2020, the YoY manufacturing production in the EU decreased by 6.1%. This is an improvement from the decline of 6.3% in August. The overall industrial production reduced by 5.8% during the period.

We assign a score of -5 based on its correlation with the GDP.

  • Euro Area Manufacturing PMI

Markit surveys about 3000 manufacturing firms. The Markit manufacturing PMI comprises five indexes: new orders accounting for 30% weight of the index, output 25%, employment 20%, delivery by suppliers 15%, and inventory 10%. The Euro Area manufacturing is seen to be improving when the index is above 50 and contracting when below 50. At 50, the index shows that there is no change in the manufacturing sector.

In November 2020, the IHS Markit Eurozone Manufacturing PMI was 53.8, down from 54.8 registered in October. The October reading was the highest ever recorded in the past two years. Despite the November drop, the manufacturing PMI is still higher than during the pre-pandemic period. We, therefore, assign a score of 5.

  • European Union Retail Sales

Retail Sales measures the change in the value of goods and services purchased by households for final consumption. In the EU, food, drinks, and tobacco contribute to the highest in retail sales – 40%. Furniture and electrical goods account for 11.5%, books and computer equipment 11.4%, clothing and textile 9.2%, fuel 9%, medical and pharmaceuticals 8.9%, non-food products and others 10%.

In October 2020, the MoM EU retail sales increased by 1.5%, while the YoY increased by 4.2%. Based on our correlation analysis with EU GDP, we assign a score of 3.

  • Euro Area Consumer Confidence

The consumer confidence survey in the Euro Area covers about 23,000 households. Their opinions are gauged from issues ranging from economic expectations, financial situation, savings goals, and expenditure plans on households’ goods and services. These responses are aggregated into an index from -100 to 100. Consumer confidence is a leading indicator of household expenditure, which is a primary driver of the GDP.

In November 2020, the Euro Area consumer confidence was -17.6, down from -15.5 in October. It is also the lowest reading since May – primarily because of the new lockdown measures bound to impact the labor market. Based on correlation with GDP, we assign a score of -3.

  • Euro Area Government Debt to GDP

This is meant to gauge whether the government is over-leveraged and if it might run into problems servicing future debt obligations.

The Euro Area Government Debt to GDP dropped from 79.5% in 2018 to 77.6% in 2019. In 2020, it is projected to hit 102% but stabilize around 92% in the long run. Based on correlation with GDP, we assign a score of -1.

In our very next article, we have performed the Endogenous analysis of GBP to see if it has appreciated or depreciated in this year. Make sure to check that and let us know in case of any questions in the comments below. Cheers.

Categories
Forex Signals

EURCAD Piercing Pattern and Breakout

EURCAD has been moving in a slightly descending channel, here shown as a linear regression channel.  The last iteration of the Price drove it from the top of it to near the bottom. There, it made a double bottom figure and headed up again. After being rejected by the central regression line (dotted line), the Price retraced slightly, then, four hours ago, The Price made a piercing candlestick followed by a large candlestick that went above the last high.

A trade can be made with the entry at 1.5191, a stop below the recent low (1.5110), and a profit target neat the last high of 1.5374. for a reward/risk ration of over 2.

The technical factors ate in favor of the trade. The price moves above the +1 sigma line of the Bollinger bands, and the bands are heading up. Also, the Stochastic oscillator has triggered a buy signal near the oversold level.

The Setup

Buy Entry: 1.5191

Stop-loss:1.5110 or lower

Take-profit: 1.5374

Reward/Risk: 2

Dollar risk: $575 on one lot. $57.5 on a mini lot, and $5.75 on a micro lot

Dollar reward: $1,150 on a lot.

It is recommended not to go above 1 percent of your balance in a single position. Thus, traders should not take more than two micro lots for every $1000 in their trading account.

Categories
Forex Market Analysis

Daily F.X. Analysis, May 20 – Top Trade Setups In Forex – European CPI Figures Ahead! 

The U.S. Federal Reserve will release its latest FOMC meeting minutes. The European Commission will post the May Consumer Confidence Index (-23.7 expected) and final readings of April CPI (+0.4% on-year expected). The U.K. Office for National Statistics will release April CPI (+0.9% on-year expected).

Economic Events to Watch Today 


EUR/USD – Daily Analysis

The EUR/USD prices were closed at 1.09228 after placing a high of 1.09759 and a low of 1.09020. Overall the movement of the EUR/USD pair remained bullish throughout the day. After gaining almost 100 pips on Monday, the EUR/USD pair rose to near its highest level in 2 weeks of 1.0976 level on Tuesday. The upbeat market mode was derived by the Franco-German recovery fund proposal, which was announced on Monday and provided a boost to the single currency EUR. 

The Vice President of the European Commission, Valdis Dombrovskis, said that the European Stability Mechanism (E.S.) strongly supported the Franco-German proposal. Commission was also looking forward to presenting the proposal in the upcoming European summit on May 27.

Following the previous day’s gains, the EUR/USD pair continued to rise and was further supported by the better than expected economic data release on Tuesday.

At 14:00 GMT, the ZEW Economic Sentiment from the European Union showed that the economic outlook of the Eurozone in the view of institutional investors and analysts increased to 46.0 from the expected27.4 and supported EUR. 

The German ZEW Economic Sentiment also showed an improved economic outlook after releasing as 51.0 against the expected 30.0 during the month of May and supported EUR.

The better than the expected economic outlook of the whole bloc, along with Germany even in the lockdown time, gave a sudden push to the already prevailing bullish trend in EUR/USD and rose its prices above two weeks high. However, pair failed to hold its gains and started to drop in late-session but managed to end its day with a bullish candle.

On the other hand, the greenback lost its demand in the absence of any significant economic data. Only Housing Starts in the month of April were released from the U.S. on Tuesday, which declined to 0.89M against the 0.95 forecasted and weighed on the U.S. dollar.

Meanwhile, the Fed Chair Jerome Powell also refrained from providing any specific surprising remarks about the economy or policy outlook and hence kept the U.S. dollar under pressure. He said that the Fed would remain committed to using its all tools to recover the U.S. economy from a corona-induced crisis. U.S. Dollar Index fell near 99.50 level on that day.

Daily Support and Resistance

  • R3 1.1089
  • R2 1.1008
  • R1 1.0961

Pivot Point 1.088

  • S1 1.0833
  • S2 1.0752
  • S3 1.0705

EUR/USD– Trading Tip

The technical outlook for EUR/USD pair seems bullish as the pair is trading at 1.0938, having formed a bullish engulfing pattern above an immediate support level of 1.0918 level. On the 4 hour timeframe, the pair is also forming a higher high and higher low pattern, which can drive further buying trends in the EUR/USD pair. The MACD is bullish, while the 50 EMA is also supporting the bullish bias among traders. The pair has the potential to trade towards north to target 1.0993 triple top area while support holds at 1.0918 and 1.08850 level today.


GBP/USD – Daily Analysis

The GBP/USD prices were closed at 1.22482 after placing a high of 1.22961 and a low of 1.21839. Overall the movement of GBP/USD pair remained bullish throughout the day. The GBP/USD pair rose for 2nd consecutive day on Tuesday amid the broad-based U.S. dollar weakness and better than expected employment data from the U.K. 

The U.S. dollar was already under pressure the previous day after the announcement of the Franco-German recovery fund proposal, which consists of 500 Billion euros. The increased risk appetite in the market also made the U.S. dollar weaker on Tuesday. 

Furthermore, better than expected U.K. employment data on Tuesday gave strength to GBP and raised GBP/USD prices. The office for National Statistics reported that U.K. Unemployment Rate in April dropped to 3.9% from the expected 4.4% and supported GBP.

Despite the decreased unemployment rate, around 857K people filed for jobless claims in April against the forecasted 675K. The decreased unemployment rate, which covers three months to March, showed that unemployment might have fallen sharply during April considering the increased numbers of jobless claims that month.

Meanwhile, U.K. announced a new tariff regime for Brexit that will remove tariffs on 30 billion pounds worth of imports or about 60% worth of trading coming into the U.K. The latest tariff named U.K. Global Tariff (UKCT) will become effective from January 2021 when the transition period will end.

AT 11:00 GMT, the Claimant Count Change for April showed that almost 856.5K people applied for jobless benefit claims against the expectations of 675.0K and weighed on Sterling. At 11:02 GMT, the Average Earning Index for the quarter showed a decline to 2.4% from the expected 2.7% and weighed on U.S. Dollar. However, the Unemployment rate for March showed a decline to 3.9% against the anticipated 4.4% and supported Pound.

Daily Support and Resistance

  • R3 1.2411
  • R2 1.2319
  • R1 1.2257

Pivot Point 1.2166

  • S1 1.2104
  • S2 1.2013
  • S3 1.195

GBP/USD– Trading Tip

On Wednesday, the GBP/USD traded sharply bullish to trade at 1.2245 level despite the release of worse than expected Labor market reports from the U.K. At the moment, Cable faces resistance around 50 EMA, which holds at 1.2255 level. The closing of candles below 1.2260 can drive selling. Still, considering the recent bullish engulfing and long histograms of GBP/USD pair, we may see a continuation of a bullish trend in the Sterling. On the upper side, the violation of 1.2246 level may lead Sterling towards 1.2318 today.  


USD/JPY – Daily Analysis

The USD/JPY pair was closed at 107.700 after placing a high of 108.086 and a low of 107.261. Overall the movement of the USD/JPY pair remained bullish throughout the day. The pair USD/JPY moved above 108.00 level on Tuesday, which was the one-month top-level amid increased risk-on market sentiment. The safe-haven Japanese Yen was under pressure after the latest optimism related to the encouraging initial results of coronavirus vaccine trials. Weaker Yen moved the USD/JPY pair in the opposite direction and made it to post gains above 108.00 level.

The intraday selling bias towards the Japanese Yen increased after the Bank of Japan called out for an unscheduled meeting on Friday. This fueled speculations that Bank would announce more easing measures.

The strong positive momentum due to weakened Yen lifted the USD/JPY prices to its highest level since April 13. However, the rally remained limited due to the rising concerns about the US-China relationship.

Another reason behind the limited rally on Tuesday was the fears about the second-wave of coronavirus. Senators questioned the Fed Chair Jerome Powell and the U.S. Treasury Secretary Steven Mnuchin about their stewardship of specific aspects of the $2 trillion package on Tuesday.

The Senate Banking Committee held its first look at spending under the package announced in March to assist people affected by the coronavirus pandemic. Mnuchin and Powell showed different perspectives on the economic outlook. Mnuchin remained optimistic and said that in the second half of 2020, the economy would see an upturn, while Powell suggested that congress might need more than trillions to aid the economy.

Daily Support and Resistance    

  • R3 108.04
  • R2 107.78
  • R1 107.56

Pivot Point 107.3

  • S1 107.09
  • S2 106.82
  • S3 106.61

USD/JPY – Trading Tips

On Wednesday, the USD/JPY mostly remains mostly bearish following a bullish breakout of the choppy trading range of 107.480 – 107.029 level. For now, the pair is holding at 107.630, having immediate support around 107.500. Above this level, we may see USD/JPY prices heading towards the next resistance level of 108.130. The ascending triangle pattern has already been violated, and it’s expected to kee the USD/JPY supported around 107.500. So let’s consider taking buying trades over 107.500 today. All the best for today! 

Categories
Forex Assets

Everything About The EUR/RUB Forex Asset

Introduction

The EUR/RUB is the abbreviation of the Euro Area’s Euro against the Russian Ruble. This is an exotic-cross currency pair. The volatility and volume in this pair are good enough for traders to day trade this currency. Here, the EUR is the base currency, and the RUB is the quote currency.

Understanding EUR/RUB

The price in the exchange market of the EUR/RUB specifies the value of RUB that is needed to purchase one Euro. It is quoted as 1 EUR per X RUB. For example, if the value of EUR/RUB is 85.769, this much of Rubles are required to buy one Euro.

Spread

The price of buying is not the same as the price for selling. One must pay the ask price for buying and bid price for selling. And the difference between the bid price and the ask price is called the spread. This value varies based on the type of execution model used by the broker.

ECN: 42 pips | STP: 44 pips

Fees

Like in the stock market where you pay commission on both sides of your trade, in the forex market as well, you must pay few pips of fee for your trade. This could be between 5-10 pips. Note that the fee on STP accounts is nil.

Slippage

Due to the volatility in the market and the broker’s execution speed, there is a difference in the price at which you execute the trade and price, which is actually given by the broker. This is known as slippage.

Trading Range in EUR/RUB

The depiction of the minimum, average, and maximum volatility in the market for different timeframes is given in the below table. These values help us in assessing the risk of trade for a specified time frame.

Procedure to assess Pip Ranges

  1. Add the ATR indicator to your chart
  2. Set the period to 1
  3. Add a 200-period SMA to this indicator
  4. Shrink the chart so you can assess a large time period
  5. Select your desired timeframe
  6. Measure the floor level and set this value as the min
  7. Measure the level of the 200-period SMA and set this as the average
  8. Measure the peak levels and set this as Max.

EUR/RUB Cost as a Percent of the Trading Range

The cost of trade changes as the volatility of the market also changes. In the below tables, we have illustrated the cost variation in the trade-in different timeframes and volatilities for both ECN and STP model account.

ECN Model Account

Spread = 42 | Slippage = 3 |Trading fee = 3

Total cost = Slippage + Spread + Trading Fee = 3 + 42 + 3 = 48

STP Model Account

Spread = 44 | Slippage = 3 | Trading fee = 0

Total cost = Slippage + Spread + Trading Fee = 3 + 44 + 0 = 47

Trading the EUR/RUB

The EUR/RUB is one of the most traded exotic-cross currency pairs. The volatility in this pair is pretty high. However, a retail trader can still trade it.

Consider the above two volatility tables. We can see that the values are large in the min column and small in the max column. This means that the costs are more when the volatility is low, and less when the volatility is high.

Traders looking to trade with low cost can consider trading when the volatility is high. And traders who need low volatility will have to bear higher costs. There are traders who look for a balance between the two. Such traders can trade when the volatility of the market is around the average values. This will ensure enough volatility as well as low costs.

Another simple way to reduce cost is by placing orders using limit and stop instead of the market. This will take away the slippage on the trade. Hence, this will reduce the total cost of the trade. So, in our example, the total cost will reduce by three pips.

Categories
Forex Assets

What Should You Know Before Trading The EUR/RON Forex pair

Introduction

The abbreviation of the Euro Area’s euro against the Romanian Leu is written as EUR/RON. This pair is classified as an exotic currency pair. The volume traded in this pair is pretty low. Here, the EUR is the base currency, and the EGP is the quote currency.

Understanding EUR/RON

The value of the EUR/RON determines the value of RON equivalent to one EUR. It is quoted as 1 EUR per X RON. For example, if the value of EUR/RON is 4.8512, then exactly 4.8512 RON is required to buy one Euro.

Spread

The difference between the bid and the ask price for that currency pair is referred to as the spread. The spread is different on ECN and STP accounts.

ECN: 75 pips | STP: 80 pips

Fees

The fee is simply the commission on the trade. One has to pay a few pips of fee on the trade for entering as well as exiting the trade. However, this is only on ECN accounts. On STP accounts, there is no fee.

Slippage

The slippage is the difference between the trader’s required price for execution and the price the broker actually gave the trader. There is this difference due to the volatility of the market and the broker’s execution speed.

Trading Range in EUR/RON

A Trading range is the illustration of the pip movement of a currency pair in different timeframes. The values are obtained from the average true indicator. The volatility values help us in determining the number of pips our trade can move in a given time frame.

Procedure to assess Pip Ranges

  1. Add the ATR indicator to your chart
  2. Set the period to 1
  3. Add a 200-period SMA to this indicator
  4. Shrink the chart so you can assess a large time period
  5. Select your desired timeframe
  6. Measure the floor level and set this value as the min
  7. Measure the level of the 200-period SMA and set this as the average
  8. Measure the peak levels and set this as Max.

EUR/RON Cost as a Percent of the Trading Range

With the volatilities values obtained above, we can even determine the variation in the cost of the trade. Below are the cost variation tables for ECN and STP accounts.

ECN Model Account

Spread = 75 | Slippage = 5 |Trading fee = 3

Total cost = Slippage + Spread + Trading Fee = 5 + 75 + 3 = 83

STP Model Account

Spread = 80 | Slippage = 5 | Trading fee = 0

Total cost = Slippage + Spread + Trading Fee = 5 + 80 + 0 = 85

Trading the EUR/RON

Which timeframe to trade?

Consider the below chart on the 1H timeframe. We can clearly see that the volatility in this pair is very high. There is hardly any movement for a few hours, but a big spike up/down suddenly. And this type of movement is very risky for business. Hence, it is recommended to avoid trading smaller timeframes of this pair.

Nonetheless, considering the 1D chart of EUR/RON, we can see that the volatility is decent enough. Hence, this becomes a tradable timeframe for us. In fact, any timeframe above the daily can be traded efficiently.

How to manage costs?

In the trading cost table, we can see that the percentage values are large in the min column and small in the max column. This means that the costs are high for low volatilities and small for high volatilities. So, to have a balance between the volatility and costs, one may trade when the volatility is around average values.

Furthermore, trading through limit orders is another way to reduce costs. In doing so, the slippage on the trade will not be applied to the total costs.

Categories
Forex Assets

Understanding The EUR/EGP Exotic Currency Pair

Introduction

The Euro Area’s euro against the Egyptian Pound is abbreviated as EUREGP. This is an exotic-cross currency pair in the forex market. In this pair, the EUR is the base currency, and the EGP is the quote currency.

Understanding EUR/EGP

The market price of the EUREGP depicts the value of EGP that is equivalent to one euro. It is simply quoted as 1 EUR per X EGP. So, for example, if the market price of this pair is 17.8341, then exactly 17.8341 Egyptian Pounds is required to purchase one Euro.

Spread

The difference between the bid price and the ask price is referred to as the spread. These two values are set by the brokers. Hence, it is different for different brokers. The spread also varies based on how the orders are executed.

ECN: 100 pips | STP: 111 pips

Fees

The fee is simply the commission paid on the trade. There is no fee on STP execution model but a few pips on the ECN execution model. However, the fee absence on STP accounts is usually compensated by higher spreads.

Slippage

Slippage is the difference between the price which was wanted by the trader and the price the broker actually gave the trader. It is typically not possible for brokers to give the exact price intended by the traders due to reasons:

  • Broker’s trade execution speed
  • Market volatility

Trading Range in EUR/EGP

Trading range is an illustration of the pip movement in a currency pair for different timeframes ranging from 1H to 1M. These volatility values help in assessing the risk involved in a trade. Basically, it acts as an effective risk management tool. Another application to it is discussed in the subsequent section.

Procedure to assess Pip Ranges

  1. Add the ATR indicator to your chart
  2. Set the period to 1
  3. Add a 200-period SMA to this indicator
  4. Shrink the chart so you can assess a large time period
  5. Select your desired timeframe
  6. Measure the floor level and set this value as the min
  7. Measure the level of the 200-period SMA and set this as the average
  8. Measure the peak levels and set this as Max.

EUR/EGP Cost as a Percent of the Trading Range

This is a very helpful application of the trading range. In the cost as a percent of the trading range, we combine the volatility values with the total cost on the trade and observe how the cost varies for changing volatilities.

ECN Model Account

Spread = 100 | Slippage = 10 |Trading fee = 3

Total cost = Slippage + Spread + Trading Fee = 10 + 100 + 3 = 113

STP Model Account

Spread = 111 | Slippage = 10 | Trading fee = 0

Total cost = Slippage + Spread + Trading Fee = 3 + 111 + 0 = 114

Trading the EUR/EGP

The EUR/EGP is an exotic-cross currency pair. This pair is highly volatile, but the trading volume is pretty low. However, this pair can still be traded in certain situations.

Firstly, we can see that the spreads on this pair are high. This is because the volatility in this pair is very high. For example, the average pip movement in the 1H timeframe is over 400 pips. So, we can’t really say that the spread of this pair is high.

Consider the table representing the variation in the costs. We can see that the percentages are highest in the min column. And the values are considerably small in the average and max column. If we were to interpret this, the cost of the trade reduces as the volatility of the market increases. So, based on the type of trader you are, you can choose to enter the market. For example, if you’re concerned about the high costs, then you may trade when the volatility of the market is at its peak. If you’re a conservative trader who needs petty low volatility, then you may use it during low volatilities, but you’ll have to bear high costs for it.

Furthermore, there is a way through which you can bring down your existing cost on the trade. This is simply by executing trades using limit or stop orders instead of the market. In doing so, the slippage will be nullified. So, in our example, the total cost would reduce by ten pips.

Categories
Forex Assets

Everything About EUR/TRY Forex Currency Pair

Introduction

EUR/TRY is the abbreviation for the Euro area’s euro against the Turkish Lira. This pair is classified as an exotic-cross currency pair. In this pair, EUR is the base currency, and TRY the quote currency.

Understanding EUR/TRY

The price of this pair determines the value of TRY, which is equivalent to one euro. It is quoted as 1 EUR per X TRY. For example, if the value of this pair is 6.5552, then about 6.5 Turkish Liras are required to purchase one euro.

EUR/TRY Specification

Spread

Spread is simply the difference between the bid price and the ask price in the market. This value is controlled by the brokers. This value varies on the type of execution model used for executing the trades.

Spread on ECN: 40 pips | Spread on STP: 44 pips

Fees

The fee in Forex is similar to the one that is pair to stockbrokers. Note that, there is no fee on STP accounts, but a few pips on ECN accounts.

Slippage

The slippage on a trade is the difference between the price that is demanded by the trader and the price that is actually executed by the broker. Market volatility and the broker’s execution speed are the reasons for slippage to occur.

Trading Range in EUR/TRY

A trading range is the representation of the minimum, average, and the maximum volatility of this pair on the 1H, 4H, 1D, 1W, and 1M timeframe. Using these values, we can assess our profit/loss margin of trade. Hence, this proves to be a helpful risk management tool for all types of traders.

Procedure to assess Pip Ranges

  1. Add the ATR indicator to your chart
  2. Set the period to 1
  3. Add a 200-period SMA to this indicator
  4. Shrink the chart so you can assess a large time period
  5. Select your desired timeframe
  6. Measure the floor level and set this value as the min
  7. Measure the level of the 200-period SMA and set this as the average
  8. Measure the peak levels and set this as Max.

EUR/TRY Cost as a Percent of the Trading Range

With the volatility values obtained from the above table, we can see how the cost varies as the volatility of the market varies. All we did is, got the ratio between the total cost and the volatility values and converted into percentages.

ECN Model Account 

Spread = 40 | Slippage = 3 | Trading fee = 3

Total cost = Spread + Slippage + Trading Fee = 40 + 3 + 3 = 46

STP Model Account

Spread = 44 | Slippage = 3 | Trading fee = 3

Total cost = Spread + Slippage + Trading Fee = 44 + 3 + 0 = 47

The Ideal way to trade the EUR/TRY

The EURTRY is a pair with enough volatility and liquidity. Hence, this makes it simpler to trade this exotic-cross currency.

From the above table, we can see that the percentage values are all within 200%. This means that the costs are low irrespective of the timeframe and volatility you trade.

Digging it a little deeper, the costs are higher when the volatility of the market is low and lower for higher volatilities. However, we cannot ignore the fact that this pair is highly volatile. For example, the maximum volatility on the 1H timeframe is as high as 456. So, traders must be cautious before trading this pair.

When it comes to the best time of the day to trade this pair, it is ideal for entering this pair during those times of the day when the volatility is in between the average values because this will ensure decent volatility as well as low costs.

Furthermore, traders can easily reduce their costs by placing orders as ‘limit’ and ‘stop’ instead of ‘market.’ In doing so, the slippage on the trade will not be considered in the calculation of the total costs. So, in our example, the total cost will reduce by three pips.

Categories
Forex Assets

Exploring The EUR/THB Exotic Currency Pair

Introduction

EUR/THB is the abbreviation for the Euro area’s euro against the Thai Baht. This pair is classified as an exotic currency pair. In this pair, EUR is the base currency, and THB is the quote currency.

Understanding EUR/THB

The market value of this pair represents the value of THB equivalent to one EUR. It is quoted as 1 EUR per X THB. For example, if the current market price of this pair is 35.345, these many units of THB are required to purchase one euro.

EUR/THB Specification

Spread

The algebraic difference between the bid and the ask price is referred to as the spread. Spread is determined by the brokers and varies based on the execution model they use.

Spread on ECN: 25 pips | Spread on STP: 28 pips

Fee

The fee is simply the commission paid on the trade. However, this fee is levied only on ECN accounts, not STP accounts.

Slippage

When you execute orders by market, the price you receive from the broker is different from the price you trigger your order. This happens solely due to the changes in the market volatility and the speed with which brokers execute the trades.

Trading Range in EUR/THB

The trading range is the representation of the range of pip movement in a currency pair. These pip values help in assessing the profit/loss in a trade, even before opening positions. In the below table, we have included six timeframes, ranging from 1H to 1M.

Procedure to assess Pip Ranges

  1. Add the ATR indicator to your chart
  2. Set the period to 1
  3. Add a 200-period SMA to this indicator
  4. Shrink the chart so you can assess a large time period
  5. Select your desired timeframe
  6. Measure the floor level and set this value as the min
  7. Measure the level of the 200-period SMA and set this as the average
  8. Measure the peak levels and set this as Max.

EUR/THB Cost as a Percent of the Trading Range

The cost as a percent of the trading range is the representation of the cost variation in the trade. The cost varies based on the volatility of the market. Having an idea of the cost variation, we can find our ideal times of day to trade in the market with reduced costs.

ECN Model Account

Spread = 25 | Slippage = 3 | Trading fee = 3

Total cost = Spread + Slippage + Trading Fee = 25 + 3 + 3 = 31

STP Model Account

Spread = 28 | Slippage = 3 | Trading fee = 0

Total cost = Spread + Slippage + Trading Fee = 28 + 3 + 0 = 31

The Ideal way to trade the EUR/THB

Before getting right into it, let’s comprehend the above tables. To analyze the tables, we consider the magnitude of the percentages. The higher the percentages, the higher is the cost of the trade. Conversely, lower percentages imply lower costs.

The costs in the min column are higher compared to the max column. This means that the costs are high when the volatility of the market is low, and the converse holds true as well.

The ideal way to trade this pair is completely dependent on the type of trader you are. For instance, if you are a trader looking for low costs, then you may trade when the volatility is high. Since the majority of the traders need a balance between the two, they may trade when the volatility of the market is somewhere around the average values in the trading range table.

Another simple technique to reduce costs is implementing strategies such that orders are executed using limit orders instead of market orders. In doing so, the slippage will be completely eradicated, and the total costs will be reduced by a decent number.

Categories
Forex Assets

Everything You Should Know About The EUR/SEK Forex Pair

Introduction

EUR/SEK is the abbreviation for the Euro Area’s euro against the Swedish Krona. This exotic-cross currency pair has enough volatility but lacks liquidity. This is the reason this has pretty high spreads. In this pair, EUR is the base currency, and SEK is the quote currency.

Understanding EUR/SEK

The market price of EURSEK as a whole determines the value of SEK that is required to buy one euro. It is quoted as 1 EUR per X SEK. For example, if the value of this pair is 10.5839, then this amount of SEK is required to purchase one EUR.

EUR/SEK Specification

Spread

The difference between the bid price and the ask price is called the spread. This value is different from one ECN and STP accounts. The approximate values of the same are mentioned below.

Spread on ECN: 50 pips | Spread on STP: 55 pips

Fees

The fee is simply the commission paid for the trade. This, too, depends on the type of execution model used by the broker. The fee on ECN accounts is a few pips, while it is nil on STP accounts.

Slippage

The slippage is the difference between the trader’s intended price and the broker’s executed price. There is this difference because orders are executed by the ‘market.’ The two main reasons for slippage to occur include, broker’s execution speed & Market volatility.

Trading Range in EUR/SEK

With the values in the trading range, which depict the pip movement in different timeframes, we can determine the gain or loss that is possible on trade.

These values are obtained by combining the moving average with the average true range indicator. A complete procedure to get it into your charts is given below.

Procedure to assess Pip Ranges

  1. Add the ATR indicator to your chart
  2. Set the period to 1
  3. Add a 200-period SMA to this indicator
  4. Shrink the chart so you can assess a large time period
  5. Select your desired timeframe
  6. Measure the floor level and set this value as the min
  7. Measure the level of the 200-period SMA and set this as the average
  8. Measure the peak levels and set this as Max.

EUR/SEK Cost as a Percent of the Trading Range

Firstly, the total cost is calculated by finding the sum of the spread, slippage, and trading fee. And this cost varies as the volatility of the market changes. Below is a table that represents the cost variation for EURSEK for both ECN and STP accounts.

ECN Model Account 

Spread = 50 | Slippage = 3 | Trading fee = 3

Total cost = Spread + Slippage + Trading Fee = 50 + 3 + 3 = 56

STP Model Account

Spread = 55 | Slippage = 3 | Trading fee = 0

Total cost = Spread + Slippage + Trading Fee = 55 + 3 + 0 = 58

Note: The costs may seem high because of the Spreads. As we know, these Spreads keep changing from time to time. At times we have seen the spreads for this pair being as low as 10. But we have considered the maximum spread to give you the maximum cost percentages.

The Ideal way to trade the EUR/SEK

From the trading range table, we can clearly see that the volatility in this pair is pretty high. However, this does not mean that it cannot be traded.

Coming to the next two tables, the percentage values are within the 600% mark. Note that the higher the value of the percentages, the higher is the cost. The opposite holds true, as well. Since the percentage values are high in the min column, we can conclude that the costs are high when the volatility of the market is low.

Now, to have a balance between the costs and the volatility, one must trade during those times when the volatility of the market is around the average values in the trading range table.

Moreover, there is a way through which we can nullify the slippage on the trade. This can simply be done by placing orders using ‘limit’ instead of ‘market.’ In doing so, the total cost will reduce by a decent amount.

Categories
Forex Assets

EUR/NOK – Everything You Should Know Before Trading This Currency Pair

Introduction

EUR/NOK is the abbreviation for the Euro Area’s euro against the Norwegian Krone. This pair is classified as an exotic-cross currency. Here, EUR is the base currency, and NOK is the quote currency.

In this asset article, we shall understand what the value of this pair means, the volatility in different timeframes, the cost variations, and finally, the ideal way to trade this pair.

Understanding EUR/NOK

The value of this pair represents the value of NOK equivalent to one EUR. It is quoted as 1 EUR per X NOK. For example, if the value of this pair is 10.4373, approx. 10 Krones are required to purchase one euro.

EUR/NOK Specification

Spread

The difference between bid and ask prices set by the brokers is referred to as the spread on the trade.

There are two types of trade execution models in forex, namely, ECN and STP. The spread on both vary.

  • Spread on ECN: 55 pips
  • Spread on STP: 57 pips

Fees

For every position you take on your account, you are required to pay some fee for it. This fee is typically between 5-10 pips. Moreover, there is no fee as such in STP accounts.

Slippage

When orders are executed by the market, the trader will not receive the exact price at which he triggered the button. The difference between the actual received price and the triggered price is called the slippage.

Trading Range in EUR/NOK

A Trading range is a tabular representation of the pip movement in a currency pair for different timeframes. Below is the same table for the EURNOK currency pair. From these values, we can assess our profit/loss on a trade beforehand. All you must do is, find the product of the volatility value and the pip value ($0.95).

Procedure to assess Pip Ranges

  1. Add the ATR indicator to your chart
  2. Set the period to 1
  3. Add a 200-period SMA to this indicator
  4. Shrink the chart so you can assess a large time period
  5. Select your desired timeframe
  6. Measure the floor level and set this value as the min
  7. Measure the level of the 200-period SMA and set this as the average
  8. Measure the peak levels and set this as Max.

EUR/NOK Cost as a Percent of the Trading Range

This is an application to the above trading range table. By clubbing these values with the total cost of a trade, we can determine the cost variations for changing volatilities.

ECN Model Account 

Spread = 55 | Slippage = 3 | Trading fee = 3

Total cost = Spread + Slippage + Trading Fee = 55 + 3 + 3 = 61

STP Model Account

Spread = 57 | Slippage = 3 | Trading fee = 0

Total cost = Spread + Slippage + Trading Fee = 57 + 3 + 0 = 60

The Ideal way to trade the EUR/NOK

Trading the EURSEK is similar to trading any other exotic-cross pair. This pair has pretty high volatility with liquidity lesser than major/minor pairs. This is the reason for its spreads to be at 55 pips. Yet, this pair can still be traded.

From the above cost percentage table, we can infer that the magnitudes are large in the min column and small in the max column. This means that the costs are more for low volatilities are less for high volatilities. It is neither preferable to trade during high volatilities nor when the costs are less, for obvious reasons. So, to maintain equilibrium between costs and volatility, it is ideal for entering this pair when the volatility is more or less near the average values in the trading range table.

Another simple way to bring down your costs is by placing orders by ‘limit’ and ‘stop.’ When trades are not executed as market orders, the slippage is cut off. Hence, the total cost is reduced by a decent percentage. An example of the same is given below.

Spread = 55 | Slippage = 0 | Trading fee = 3

Total cost = Spread + Slippage + Trading Fee = 55 + 0 + 3 = 58

Categories
Forex Assets

Analyzing The Costs Involved While Trading The EUR/DKK Forex Pair

Introduction

The Euro Area’s euro against the Danish Krone, in short, is written as EURDKK. This is an exotic pair in the forex market. Typically, this pair is traded with low volumes. Here, EUR is the base currency, and DKK is the quote currency.

Understanding EUR/DKK

The current market price in the exchange of this pair depicts the value of Danish Krone equivalent to one euro. It is simply quoted as 1 EUR per X DKK. For example, if the current value of EURDKK is 7.4702, then about 7.5 DKK are required to buy one euro.

EUR/DKK Specification

Spread

In the foreign exchange market, spreads are the primary source through which brokers make money. They set a different price for buying and a different price for selling the same currency pair. This difference is referred to as the spread. This spread varies from broker to broker and also from the type of execution model used.

Spread on ECN: 40 pips | Spread on STP: 42 pips

Fee

This fee is the same fee is paid to the stockbrokers. In other terms, this is the commission that is paid to the broker. The fee on ECN accounts is between 5-10 pips, while it is nil on STP accounts.

Slippage

The difference between the price at which the trader executed the trade and actual executed price is called the slippage on the trade. This happens only on market orders, due to two reasons – Market volatility & Broker’s execution speed

Trading Range in EUR/DKK

As the name partially suggests, the trading range is a range of pip movements in a currency pair in different timeframes. Pip movement is also referred to as the volatility values. These values are extremely helpful in figuring the gain/loss that can be made on a trade.

Procedure to assess Pip Ranges

  1. Add the ATR indicator to your chart
  2. Set the period to 1
  3. Add a 200-period SMA to this indicator
  4. Shrink the chart so you can assess a large time period
  5. Select your desired timeframe
  6. Measure the floor level and set this value as the min
  7. Measure the level of the 200-period SMA and set this as the average
  8. Measure the peak levels and set this as Max.

EUR/DKK Cost as a Percent of the Trading Range

The total cost of the trade is determined by summing up the slippage, spread, and the trading fee. And this cost is not fixed. It varies based on the volatility of the market. Below is the tabular representation of the cost variation, which is signified in percentages.

ECN Model Account

Spread = 40 | Slippage = 3 | Trading fee = 3

Total cost = Spread + Slippage + Trading Fee = 40 + 3 + 3 = 46

STP Model Account

Spread = 42 | Slippage = 3 | Trading fee = 0

Total cost = Spread + Slippage + Trading Fee = 42 + 3 + 0 = 45

Note: The costs may seem significantly high because of the Spreads. As we know, these Spreads keep changing from time to time. At times we have seen the spreads for this pair being as low as 12. But we have considered maximum spread to give you the maximum cost percentages.

The Ideal way to trade the EUR/DKK

Trading the EURDKK is different from trading the major/minor currency pairs. And this can be easily figured out from the percentage values.

From the table, we can infer that the percentage values are extremely high on the 1H, 2H, and 4H timeframes. This means that the costs in these timeframes are super-high. Hence, trading this pair on these lower timeframes is a bad decision.

However, if we look at the next three rows (1D, 1W, and 1M), we can see that the percentage values are significantly lower than the above values. Hence, this makes this pair tradable on the daily, weekly, and monthly timeframes.

Consider the charts of EURDKK on the 1H and the 1D timeframe. On the 1H timeframe chart, we can see that there is barely any movement in the price. Also, volatility is high here.

On the other hand, on the 1D timeframe, there is enough movement in the prices, and the volatility is not very high as well. Hence, making it the ideal timeframe to trade.

Moreover, a simple and effective way to reduce costs is by trading using limit and stop orders instead of market orders. In doing so, the slippage will be completely nullified. Hence, the total cost will significantly reduce.

Categories
Forex Assets

Trading Costs Involved While Trading The EUR/SGD Exotic pair

Introduction

EUR/SGD is the abbreviation for the Euro area’s euro against the Singapore Dollar. This is one of the most traded exotic currency pairs in the world. In this pair, EUR is the base currency, and SGD is the quote currency.

Understanding EUR/SGD

The price of this pair represents the value of SGD, which is equal to one EUR. It is quoted as 1 EUR per X SGD. For example, if the value of this pair is 1.5552, then about 1.5 Singapore Dollars are required to purchase one euro.

EUR/SGD Specification

Spread

The spread is the difference between the bid and the ask price in the market. These two prices are set by the brokers. And it depends on the type of execution model used by the brokers.

Spread on ECN: 10 pips | Spread on STP: 11 pips

Fees

On ECN accounts, for every position you open, there is some fee involved with it. This is different for different brokers. However, on STP accounts, there is no fee as such.

Slippage

To put it in simple words, slippage is the difference between the trader’s demanded price and price given by the broker. The trader does not get his intended price due to two reasons – Broker’s execution speed & Market volatility

Trading Range in EUR/SGD

With the trading range table, we can assess our gain/loss on a trade in a given timeframe even before we open positions for it. This is done by considering the past volatility of the market.

Now, to determine the profit/loss on a trade, all you must do is, multiply the volatility value with the pip value ($7.25).

Procedure to assess Pip Ranges

  1. Add the ATR indicator to your chart
  2. Set the period to 1
  3. Add a 200-period SMA to this indicator
  4. Shrink the chart so you can assess a large time period
  5. Select your desired timeframe
  6. Measure the floor level and set this value as the min
  7. Measure the level of the 200-period SMA and set this as the average
  8. Measure the peak levels and set this as Max.

EUR/SGD Cost as a Percent of the Trading Range

This is an excellent application to the above volatility table. By considering the pip movement values, we can determine the cost variation of a trade as well. To do so, we find the ratio between the total cost and volatility value and convert it into percentages. Below are the cost variations for ECN and STP accounts models.

ECN Model Account 

Spread = 10 | Slippage = 3 | Trading fee = 3

Total cost = Slippage + Spread + Trading Fee = 3 + 10 + 3

Total cost = 16

STP Model Account

Spread = 11 | Slippage = 3 | Trading fee = 0

Total cost = Slippage + Spread + Trading Fee = 3 + 11 + 0

Total cost = 14

The Ideal way to trade the EUR/SGD

Comprehending the costs : Large/Small percentage -> High/Low costs

From the above the tables and the implications, we can conclude that costs are high when the volatility of the low and high when the volatility is low. And when it comes to the ideal way to trade this pair, conservative traders may trade it during those times when the volatility values are at or above the average values. This will ensure enough volatility as well as affordable costs. And other aggressive traders may trade during any of the extremes.

Also, traders can reduce their total costs by trading using limit orders and stop orders. Unlike the market orders, limit and stop orders do not include slippage on the trade. Hence, this will reduce costs considerably.

Categories
Forex Videos

Forex – How To Trade The EURUSD Pair Right Now!

What on earth is going on with the EURUSD pair and how to trade it!

In 2011 the EURUSD was way ahead of other currency pairs being traded in the Forex market and was traded with almost 50% more in volume than that of the USDJPY and GBPUSD combined.
Indeed it was only a couple of years ago that you might expect the daily swing in the EURUSD pair to be well over 100 pips per day. And yet, in recent months, we have seen the daily price action of the pair restricted to around 25-30 pips on many occasions during the European and American trading sessions, when its volumes are at their peak.

Example A


Let’s take a quick look at example A which is a 15-minute time frame of the pair, where the two vertical lines indicate where the majority of the volume will have been traded. This time frame is a fairly typical choice for an institutional trader to use. So let’s take a more detailed look at what is going on in example B.

Example B


From the 5th of February 2020 through to the 7th, which contains two complete trading days, we can see that the total amount of pips traded is just 61, giving us our average of 30.5 pips per day. In terms of volume, it is almost nothing.


Example C


Let’s drill down further, in example C, to try and define what is going on. We have broken the time period down into three sections. Firstly, in section A we can see that where was sidewards trading, which was consolidating and restricted to only 21 pips and where price action was fluctuating very tightly around the key 1.10 exchange level.

Finally, traders threw in the towel with regard to expectations that the key 1.10 level would act as an area of support, and price action then falls lower to area B, again where it consolidates into a restrictive range of only 19 pips.
Again price action moves lower initially in area C, but again we see a fairly restrictive price action of only 33 pips including the most volatile session in the middle of this area which is associated with the release of the US nonfarm payrolls, and where the much better than expected 225,000 jobs were added to the labor force, and where previously one might have expected dollar strength to move this pair 100 pips to the downside with such a number, but it was relatively unaffected.

So what is happening, and how can we trade this pair? First and foremost, it was only a couple of months ago that big institutional players were suggesting that this pair could be heading for the 1.15 level, such is the belief in the strength of the Euro. Obviously, that has not happened, and this is largely due to a weakness in the Euro area and which is particularly affecting growth in the German economy, which some say is in borderline recession, and where the German economy is pretty much the backbone of the European Union.

We also have fallout from Great Britain formally leaving the European Union and where uncertainty will prevail with the European model, due to losing income from the UK and whereby no formal trade agreements have yet been set in place and where the restrictive timeline to implement this leaves many wondering whether it is achievable by the end of December 2020.
The Coronavirus is also keeping worries with regard to a potential contraction in growth and all of this can

only mean one thing the big institutional players are uncertain with regard to directional bias for this pair in the short to medium-term and are pretty much standing on the sidelines waiting for clear evidence of where the Euro is heading.
Therefore, should you be standing on the sidelines as well? This pretty much depends on your flavor for risk. You might be better off looking at other major currencies such as the USDJPY, the GBPUSD, if you want volatility. But if you want to trade the EURUSD pair, we suggest that you use simple add price action boxes such as we have drawn onto our charts and look for breakouts when they occur, or simply drop down to a lower time frame such as the 5-minutes chart in order to scalp the pair to try and make a few pips here and there throughout the day.

Categories
Forex Assets

Asset Analysis – EUR/HKD Exotic Currency Pair

Introduction

EUR/HKD is the abbreviation for the Euro area’s euro against the Hong Kong dollar. It is classified as an exotic currency pair that usually has high volatility and low trading volume. Here, the EUR is the base currency, and the HKD is the quote currency.

Understanding EUR/HKD

The current value of the pair represents the value of HKD that is equivalent to one USD. It is quoted as 1 EUR per X HKD. For example, if the value of this pair is 9.8764, then these many units of HKD are required to buy one US dollar.

Spread

In trading, the difference between the bid price and the ask price is referred to as the spread. Spread typically varies from broker to broker. The approximate spread on ECN and STP accounts is given below.

ECN: 17 pips | STP: 18 pips

Fees

The fee is the commission you pay to your broker for each position you open. The value of this, too, is in the hands of the broker. However, note that there are no fee STP accounts.

Slippage

Slippage is the difference between the price at which the trader executed the trade and the price he actually received from the broker. Essentially, slippage depends on two factors:

  • Broker’s execution speed
  • Market’s volatility

Trading Range in EUR/HKD

Knowing how much profit you can make or how much loss you can incur in a trade in a specific time frame is vital. The Trading Range can be assessed using the table given below. It represents the minimum, average, and maximum pip movement in EURHKD in different timeframes.

Procedure to assess Pip Ranges

  1. Add the ATR indicator to your chart
  2. Set the period to 1
  3. Add a 200-period SMA to this indicator
  4. Shrink the chart so you can determine a large period
  5. Select your desired timeframe
  6. Measure the floor level and set this value as the min
  7. Measure the level of the 200-period SMA and set this as the average
  8. Measure the peak levels and set this as Max.

EUR/HKD Cost as a Percent of the Trading Range

Total cost is not constant for every trade you take. It varies based on the volatility of the market. And the variation of it can be obtained from the two tables given below.

ECN Model Account

Spread = 17 | Slippage = 3 |Trading fee = 3

Total cost = Slippage + Spread + Trading Fee = 3 + 17 + 3 = 23

STP Model Account

Spread = 18 | Slippage = 3 | Trading fee = 0

Total cost = Slippage + Spread + Trading Fee = 3 + 18 + 0 = 21

The Ideal way to trade the EUR/HKD

Exotic currency pairs tend to have high volatility and low volume. And it is not ideal to trade during these times. So, let us find out the best times of the day to trade this currency pair by comprehending the above tables.

The higher percentages depict higher costs on the trade. It can be ascertained that the percentages are on the upper side in the min column. Hence, we can conclude that the costs are high when the volatility of the market is high and vice versa.

And, when it comes to determining the right time to enter the market, one may open positions when the volatility of the market is around the average volatility. This method will ensure both decent volatility and low costs.

Market orders result in slippage, and limit orders do not. Hence, placing limit orders is another way through which one can considerably reduce their total costs on the trade.

Categories
Forex Assets

What Should You Know About EUR/GBP Forex Pair Before Trading

Introduction

EURGBP is the abbreviation for the currency pair Euro area’s euro against the Great Britain pound. This pair, unlike the EURUSD, USDCAD, GBPUSD, USDCHF, etc. is not a major currency pair. This pair is classified under the minor currency pairs and the cross-currency pairs. In EURGBP, EUR is the base currency, and GBP is the quote currency.

Understanding EUR/GBP

The current market price of EURGBP depicts the required number of pounds to purchase one euro. For example, if the value of EURGBP is 0.8527, then one needs to pay 0.8527 pounds to buy one euro.

EUR/GBP Specification

Spread

Spread in trading is the difference between the bid price and the ask price. The spread is not the same on all brokers but depends on the type of account. It also varies depending on the volatility of the market. An average spread on an ECN account and an STP account is shown below.

Spread on ECN: 0.8 | Spread on STP: 1.5

Fees

On trade a trader takes, there is some fee associated with it. Fees, again, depends on the type of account. There is no fee on STP accounts, but few pips on ECN accounts.

Slippage

When a trader executes a using the market order, they don’t really get the price they had intended. There is a small pip difference between the two prices. And this difference between the prices is referred to as slippage. The slippage is usually within 0.5 to 5 pips.

Trading Range in EUR/GBP

Understanding the volatility of the market is essential before opening or closing a position. It shows how much profit or loss a trader will be on a particular timeframe. For example, if the volatility is on the 4H is 10 pips, the trader can expect to gain or lose $1269 (10 pips x 12.69 value per pip) in a matter of about 4 hours.

The table below illustrates the minimum, average, and maximum pip movement on the 1H, 2H, 4H, 1D, 1W, and 1M timeframe.

EUR/GBP PIP RANGES

Procedure to assess Pip Ranges

  1. Add the ATR indicator to your chart
  2. Set the period to 1
  3. Add a 200-period SMA to this indicator
  4. Shrink the chart so you can assess a large time period
  5. Select your desired timeframe
  6. Measure the floor level and set this value as the min
  7. Measure the level of the 200-period SMA and set this as the average
  8. Measure the peak levels and set this as Max.

EUR/GBP Cost as a Percent of the Trading Range

An application of the volatility would be the determining of cost on each trade. As in, the ratio between the volatility and the total cost on each trade is calculated and is expressed in terms of percentage. The percentage depicts the cost for a particular timeframe and volatility. The comprehension of it shall be discussed in the subsequent section.

ECN Model Account

Spread = 0.8 | Slippage = 2 | Trading fee = 1

Total cost = Slippage + Spread + Trading Fee = 2 + 0.8 + 1 = 3.8

STP Model Account

Spread = 1.5 | Slippage = 2 | Trading fee = 0

Total cost = Slippage + Spread + Trading Fee = 2 + 1.5 + 0 = 3.5

The ideal way to trade the EUR/GBP

With the above two tables, let us figure out the ideal way to trade this currency pair. Note that the higher the percentage, the higher is the cost on a trade and vice versa. It is evident from the chart that the percentages are highest for the minimum column and lowest for the max column. In other words, the cost is high when the volatility of the market is low, and the cost is low when the volatility is high. So does this mean it is ideal to trade when the volatility is high? Well, that’s not the right approach to it, as trading in high volatility is risky. So, it is ideal to take trades during those times when the volatility is around the average range. Doing that will ensure marginal cost as well as decent cost. For example, a 4H trader must take trades during those occasions when the volatility is around 20 pips.

Note: One can apply the ATR indicator to determine the current volatility of the market.

Another feasible way to reduce costs is by canceling out the slippage cost. Cancel slippage costs can simply be done by placing limit orders. With limit orders, the slippage automatically becomes 0.

The difference in the cost percentage when the slippage goes to zero is illustrated as follows.

We hope you find this Asset Analytics informative. Let us know if you have any questions in the comments below. Cheers!

Categories
Forex Market Analysis

Daily FX Brief, October 04 – Major Trade Setups – Buckle Up for NFP Event!

Daily FX Brief, October 04 – Major Trade Setups – Buckle Up for NFP Event! 

On Friday, the U.S. dollar index continues to weaken ahead of the U.S. NFP data, which is due in the New York session today. Lately, the Institute of Supply Management (ISM) released the Purchasing Manager Index (PMI) for Non-Manufacturing Goods as 51.6 against the expected 55.0 for September. 

The data showed that it fell to a 3-Year low this month. The release of weak indices of the Manufacturing and Non-manufacturing sector this week indicates the slow growth of the economy in the U.S. Consequently, we are seeing less growth in the U.S. dollar today.

Economic Events to Watch Today

Let’s took at these fundamentals.


EUR/USD – Daily Analysis

During the early Asian session, the EUR/USD currency pair hit the bullish track for the 4th consecutive day due to all-important United States Nonfarm Payroll data.

As of writing, the EUR/USD currency pair presently trading at 1.0978, hit the high level of 1.0984 and showing 0.13% gains on the day. The pair maintained its gains for the 4th consecutive session.

On the other hand, all traders are presently expecting more than 80% odds of the rate cut by the 25-basis-points at the Federal Reserve next meeting later this month. The expectations were 64% on Wednesday, and 40% were on Monday, and currently reached 80% so far.

The increasing probabilities of an October Federal reserve rate cut also support the bullish track put forward by the hourly chart golden crossover.

At the U.S. Payroll front, the data is scheduled to release at 12:30 GMT an expected to show the economy added 145,000 jobs during the September after the 130,000 additions during the August. Besides this, the Average Hourly Earnings are found while increasing by 3.2% year on year, and the jobless rate is estimated to stay flat at 3.7%.

Whereas, the sluggish data will prop the dovish Federal Reserve expectations and pushing the greenback lower across the board.

As in consequences, probably the EUR/USD pair will come under pressure and possibly hit the low level of 1.09 if the data beats forecasted figures by a considerable margin.   


Daily Support and Resistance


S3 1.0823

S2 1.0883

S1 1.0921

Pivot Point 1.0943

R1 1.0981

R2 1.1002

R3 1.1062

EUR/USD – Trading Tips

Before Non-farm payrolls, the EUR/USD is consolidating in a narrow range. Investors await for NFP and trying to stay out of the market until the actual figure is out. The 50-hour moving average (M.A.) had a hit above the 200-hour M.A., confirming a golden crossover – a buyer market sign. Therefore, the pair seems set to maintain the continuous recovery rally from recent lows near 1.0880. 

Consider staying bullish above 1.0970 to target 1.1040. The bearish target can be set at 1.0880. 


USD/JPY – Daily Analysis

The USD/JPY closed at 106.910 after placing a low of 106.480 on Thursday. With no economic release from japan side, the movement of USD/JPY solely depended on U.S. dollars on Thursday. The weak ISM Non-Manufacturing PMI at 19:00 GMT indicated a slowdown in the economic activity of the United States by coming as 52.6 against 55.1 expected. This raised the concerns of the U.S. falling under recession after the continuous disappointing economic releases from the U.S. for three consecutive days. 

On Wednesday U.S. Private sector showed that the hiring made by them in September was not satisfactorily affected by the trade disputes prevailing between U.S. & China.

Concerning trade disputes, on Wednesday, there was another announcement from Trump’s administration related to the Tariffs on European Goods. 

With the increased chances of U.S. economic slowdown and a third rate cut by Federal Reserve in upcoming policy meeting, the U.S. Dollar faced pressure for 3rd consecutive day and has made USD/JPY to move in Bearish Trend.

Other economic releases from the United States on Thursday were, the Unemployment Claims at 17:30 GMT, came as 219K against 215K expected, weighed the U.S. Dollar. At 18:45 GMT, the Final Services PMI came as expected 50.9. The Factory Orders came in favor of U.S. Dollar as -0.1% against -0.5% expected.


Daily Support and Resistance 

S3 105.7

S2 106.53

S1 106.86

Pivot Point 107.37

R1 107.69

R2 108.2

R3 109.04

USD/JPY – Trading Tips

The USD/JPY continues to trade bearish after violating the bullish channel on the 240 mins chart. The USD/JPY is now holding below 50 periods EMA, which is suggesting bearish bias among traders. 

On the lower side, the USD/JPY is likely to gain support at 106.400 area. The MACD and RSI are holding below 0 and 50, suggesting odds or more bearish bias in the USD/JPY. Let’s stay bearish below 107 to target 106.400 today. 


GBP/USD – Daily Analysis

The GBP/USD currency pair hit the high level of 1.2350 and maintains the recovery rally, as worries about the U.S. fundamentals weighing over the Brexit news.

The US ISM Non-Manufacturing Purchasing Managers Index PMI is entering the previous manufacturing level from the same surveyor. Besides, the increased level of uncertainty coming from the survey has extended pullback in the greenback from the 2-year highs.

On the other hand, the GBP/USD pair trades started the day with headlines concerning the European Union. The EU has given 7-days more to the United Kingdom Prime Minister Boris Johnson to announce a better offer. The Tory leader could increase the support of thirty-labour rebels that supports the Breit deal.

Later in the day, investors will keep their eyes on the September month employment data, namely Nonfarm Payrolls (NFP), Unemployment Rate, and Average Hourly Earnings. After the news report, the eyes will remain on the U.S. Federal Reserve Chairman Jerome Powell’s speech at the “Federal Reserve the meeting.


Daily Support and Resistance


S3 1.2088

S2 1.2186

S1 1.2242

Pivot Point 1.2283

R1 1.234

R2 1.2381

R3 1.2479

GBP/USD – Trading Tips

On the technical view, the 130-pip area between 50-day and 21-day simple moving averages (SMA), 1.2250, and 1.2380, respectively, may keep the pair’s trading moves limited. Today, consider staying bullish above 1.2330 to target 1.2400 and 1.2500. Whereas, the GBP/USD may remain bearish below 1.2330 to target 1.2275 and 1.2230. 

 All the best! 


Categories
Forex Market Analysis

Bullish Economy at a Crossroad: Free Trade against Protectionism


Underlying Events


Last week’s volatility was fueled early Monday by Italy’s political instability as Italian president Sergio Mattarella refused to appoint Giuseppe Conte, a Eurosceptic, as Finance Minister even though he has the backing of the majority of the parliament.

Then, on May 30, as fears about Italy eased the markets focused its attention on EU officials statements against the US imposed tariffs on steel and aluminium.

“The US is playing a dangerous game by slapping tariffs on European steel and aluminium,” said Cecilia Malmstrom, warning about the consequences for economic recovery on the EU as well as US industry. (source BBC)


 Last week’s Economic Calendar was full of interesting releases


US

May’s US Consumer Confidence figure is at its historic highs, at its estimated 128.0 level, non-farm unemployment is at 3.8%, and US GDP (QoQ) grew at 2.2% a tick below estimations, while US Advance Goods Trade Balance was below expectations at -68.2b.

On the consumer front, May 31 brought us the US PCE Core (YoY) that is stable at 1.8%, the Personal Income (APR) stable at 0.3%, and Pending Home Sales (MoM) below expectations at -1.3%, below the expected 0.4%.

On the Energy Front, crude oil inventories were -3620K well below the expected 450k, while the gasoline inventories were 634K, above the expected -1200K

Finally, the USD Manufacturing figures were a bit above expectations, at 58.7 over 58.2 expected.

Eurozone

German retail sales on April (MoM)grew 2.3% well above the expected 0.5% although the yearly figure fell to 1.2% growth, below the expected 1.6%.

On the unemployment front, Germany’s May unemployment change was -11K above the expectations, and the unemployment Claims rate dropped one centile to 5.2%.

Britain’s consumer credit grew to 1.84B, above the expected 1.3B, while the mortgage approvals slightly descended to 62.5K, below the expected 63.2K

Swiss’s main figure this week was its Gross Domestic Product (YoY) for the first quarter at 2.2%, slightly below the expected 2.3%.

Japan:

JPY retail trade (YoY) grew 1.6%, above the expected 1%, while JPY retail sales figure was down -0.8% below the expected 0.2%. Also, JPY industrial production for April was up 2.5%, below the expected 3.6%.

Canada:

Last week BoC kept its interest rate unchanged at 1.25%, as was expected. However, its GDP figure for the first quarter was a disappointing annualised 1.3%, below the expected 1.8%

The overall picture of this economic background is that of a strong US economy, a not so strong Eurozone, and a possible weakening of the Canadian economy. This is especially sensitive as both Europe and Canada have a potential tariffs war against the USA. We also see weakened Japanese industrial production.

All this make us think on the continuation of the strength of the US Dollar and a further weakening scenario for the Euro, the Pound, and the Yen.


Next Week


G7

Next week lacks major economic reports and no earnings news, so markets will possibly pay attention to political developments that will fill the headlines, such as President Trump’s trade wars, or the G7 summit by the end of the week in Canada. Mr Trump is expected to arrive on Friday and meet leaders from Germany, UK, France, Italy, and Japan. A statement of the other six members of the group showed their “unanimous concern” about US tariffs.


US Trade Data.

To be released on Wednesday (14:30 GMT+2). The forecasted deficit is 50.0 B from 49B in March.


China Trade Figures:

To be released in the early hours of Friday. The expectations are for an increase of the surplus figures to $32.5B, higher than last month’s $28.8 B.

It is expected that exports will grow by 6.3% and imports to rise 16%.


RBA Policy meeting:

Due on Tuesday early morning, it will likely keep its rates unchanged at 1.5%.

We should also pay attention to the New Zealand GDP release early Wednesday.


Technical Analysis


S&P 500

The S&P 500 behave very bullishly on a weekly basis, although it suffered some drawbacks during the week. Technically the price moves inside a very steep upward channel, but right now it is close to a resistance area that matches the opening of a large red candle drawn in March. We need to watch how the price reacts here. If it is crossed next week we see a free path to head for January highs, mid-term.


Ehlers Adaptive Moving Average MAMA and cycle indicator show a bullish momentum is developing. The only black cloud in the sky is that the price is facing a strong resistance area.


DAX

The weekly chart shows that the DAX and the Euro-zone are not confident of its economic outlook.  The Index has drawn two consecutive bearish candles and we see that it shows descending lows. Its Cycle Indicator also points to the downside.

We have to pay attention next week to the US index because the DAX is correlated to it, but if we only pay attention to the technical outlook, we are more in the side of the bearish scenario.


The daily chart doesn’t change its outlook. We see that the price broke the triangular formation to the downside and tested it three times last week without being able to break it. Last Friday, although the session closed with gains, the inside candle drawn shows indecision and doubt. The most probable scenario is for the DAX to head down to test the support at 12378 level.


US Dollar Index

The US Dollar Index weekly chart shows a Spinning Top candle, while Ehlers’ Cycle indicator has changed to bearish. This may indicate that last week’s correction isn’t finished yet and we may look for a test of the Fibo 0.38 or, even to a 50% retracement, although this is less probable.


The Dollar Index daily chart’s engulfing candle that happened on May 29 has been challenged but not successfully. The Cycle indicator also points to the bearish side. Therefore our expectation is for more drops next week.


This means the Euro and GBP could still be retracing their heavy drops that started mid-May.


USDJPY

On a weekly chart the pair made an engulfing candle two weeks ago, and last week it continues moving down toward its support zone, where it bounced sharply up creating a hammer.
The price is moving mainly by its fundamentals, and now it is heading to the resistance area (green rectangle ). We may see the pair moving between those two areas for some time.


Looking at the daily chart, the pair broke the triangle formation to the upside with a large candle. The cycle indicator also points upward.
The target level is at its recent highs.


Categories
Forex Trading Strategies

The Connors & Raschke’s 80-20 Strategy


Introduction


The original Connors & Raschke’s 80-20 Strategy is an intraday strategy that was published in Street Smarts by Larry Connors and Linda Raschke.

It is based on the Taylor Trading Technique, which is a manual for swing trading. Taylor’s method was the result of the observation that the markets move within a cycle that is made up of a buy day, a sell day, and a sell short day. That setup was further investigated by Steve Moore ar the Moore Research Center.

Mr. Moore focused on days that closed in the top 10% of the range for the day. Then, he checked on for the percent of time next day prices exceeded the previously established high, and, also, for the percentage of times it also closed higher.

His results showed that when prices closed in the top/bottom 10% of its range, it had an 80-90% chance of following-through the next session, but only 50% of them closed higher/lower. This fact implied an excellent possibility of reversal.

Derek Gibson, said Connors, found out that the market has an even higher chance of reversing if the set-up bar opened in the opposite end of the range. That is, a candlestick with short wicks and a large body. Therefore this pre-condition was added. To create more opportunities, they lowered the percent of the daily range from 90 to 80, because it didn’t affect the system’s profitability.


Long Setups


  1. Yesterday, the asset opened in the top 20% and closed in the lower 20% of its daily range.
  2. Today the market must trade at least 5-15 ticks below yesterday’s low. This is a guideline.
  3. An entry buy stop is then placed at yesterday’s low, once the trade is being filled, and an initial protective stop near the low extreme of today’s action.

Move the stop to lock in profits. This trade is a day trade only.


Short setups


  1. Yesterday the asset opened in the bottom 20% and closed in the higher 20% of its daily range.
  2. Today the market must trade at least 5-15 ticks above yesterday’s high This is a guideline.
  3. An entry sell stop is then placed at yesterday’s high, after being filled, and an initial protective stop near the upper extreme of today.

Move the stop to lock in profits. This trade is a day trade only.


Example of a trade


The Connors & Raschke's 80-20 Strategy


Testing the Strategy


We tested this strategy using the backtesting capabilities of the Multicharts64 version 11 Platform.

The naked strategy, as is, in EURUSD, USDGPY, and USDCHF over a range of 17 years, were positive in all cases. Below the equity curves for the three pairs:


Examining the parameter map


The figure above shows the parameter maps of the USD_CHF and the EUR_USD pairs. We see that the return of the strategy increases as the parameters move to the 50% level, meaning that the importance of the starting and ending point (Open to Close) in the previous candlestick is not essential. The critical fact is the next day’s break above(below) the previous highs(lows) and the subsequent return to that level (False Breakout).


Example of  50-50 System with optimized stops and targets on the EURUSD


As we said, this is a 50-50 system, meaning that we don’t care in which part of the candle is the Open and Close. This is a simple false breakout system.

We see that the curve is quite good over its 17-year history. Starting with 10,000 dollars, the final equity reached $72,000, for a 6X profit figure.


Looking at the Total Trade Analysis table, we can observe that this system is also robust, with almost 40% winners and an average Ratio Win to Average loss ( Reward/risk) of 2.19.


The shuffled Trades Analysis shows that the system is very reliable, with a likelihood of small drawdowns, depicting a max consecutive loss of 16 trades.


The Net Profit distribution Analysis shows that there is a 75% probability of getting a 5X equity profit over 16 years and a 25% probability of getting a 7X profit figure.


Above is the Max Consecutive Losing Streak analysis, which shows that there is less than 10% probability of ending above a 16 losing streak. Although you think that a 16-losing-streak is terrible, it is not, but we need to be prepared psychologically to endure it. This figure is the one needed to help us conservatively decide our risk strategy.

As I already mentioned in other strategy analyses, you, as a trader, need to decide which percent of your equity you can lose without losing your temper. Many don’t like to lose any amount so they shouldn’t trade, because losing streaks are part of the trading job. Many would say 10% while others 50%. That figure has a close relation to the rate of growth of your trading account because it will decide the size of your position.

And here it comes the way to do it. Once we know the distribution of drawdowns of our trading system, we, as traders, want to minimize the probabilities that a losing streak goes beyond our max drawdown figure. This is an approximation, but its good enough to allow us to decide the best position size for our risk tastes.

Let’s say we are an average-risk trader, and we will be upset if we lose ¼ of our account. Using this trading system, and admitting a 10% probability of error, we would choose 16 as the losing streak to compute our size per trade.

Therefore, we divide 25% equity drawdown by 16, which is 1.56%. In this case, we must trade using a 1.56% risk on every trade. That means that the cost of a trade computed by the distance from entry to stop-loss levels, multiplied by the dollar pip risk and by the number of contracts should be 1.56% of your current equity balance.

Let’s simplify it using elementary math:

Percent Risk (PR) = MaxDD / Max_losing_Streak

Dollar Risk = PR x Equity_Balance

Dollar Risk = (Entry-Stop) x PipCost x Nr_of_Contracts

Let’s call Entry-Stop, Pips. And NC the Number of Contracts. Then the equation is:

Dollar Risk = Pips x PipCost x NC

Let’s move the elements from this equation to compute the Nr of contracts.

NC = Dollar_Risk / (Pips x PipCost)


That’s all. Every trade will be different, and the distance in pips from entry to stop loss will be different, but we can compute the number of contracts quickly:

Let’s do an example. Our current balance is right now $12.000, and we want to enter a trade with 20 pips of risk, and our cost per pip is $10 per lot. Which is my optimal size?

Our Dollar Risk is 1.56% of $12,000 or $187

NC = 187 / (20 x 10) = 0.93 lots, or 93 micro-lots.


Computing the Performance of the System


Now we want to know how much on average are we going to get, monthly, from this system. That is easily computed using the numbers above. We know that this system’s history is 205 months long, and it had 1401 trades, which is seven trades per month on average. Evidently, this system trades very scarcely, but we can hold a basket of assets. Thus, If we manage to get a basket of 10 holdings, including pairs, crosses, indices, and metals, we could trade 70 times per month. And those trades will not overlap most of the time if the assets are chosen uncorrelated.

Based on our risk profile and the average Reward-to-risk ratio, we know that our average winning trade will be 2.2 times our average losing trade.

So,

AvgWin = 411

AvgLoss = 187

Our winning percentage is 40%, so our losing one is 60%

Then on a 10-asset basket, there will be 28 winners and 42 losers monthly, then:

Gross Profit: 411*28 = 11,508

Gross Loss:  42*187 =  7,854

Average Monthly Net Profit =11,508 – 7,854 = 3,654

This is an average 30,4% monthly from a $12,000 balance. Not bad!


Note: The computations and graphs were done using Multicharts 11 trading platform.


Categories
Forex Market Analysis

Daily Market Update: Eurozone Outlook


News Commentary


The German Final CPI results were not unexpected. The indicator dropped to 0.0%, marking a 3-month low. The Eurozone Final CPI went to 1.2%, down from 1.3% last month. The Eurozone Final Core CPI dropped from 1.0% to 0.7%. If inflation levels continue to soften, the ECB will have to extend its stimulus program, which is set to run until September. Germany will release additional inflation numbers on Friday.

First-quarter Eurozone and German GDP data were within expectations, but investors should not become too bullish, as the numbers referred to a slowdown in the economy. Both Germany and the Eurozone gained 0.6% in the fourth quarter of 2017. Analysts don’t seem optimistic. The German indicator posted a sharp drop of -8.2 for a second straight month, the first declines since July 2016. The low reading certainly doesn’t show much optimism.

The EUR has another battle with Italy’s new leader’s elections, who may propose new deficit spending that appears to tighten the EU Growth.

All eyes will be on US Unemployment Claims with expectations of 216K.


Chart Analysis


EUR/USD

On the daily chart, the price has a strong down rally after reversing from the resistance level of 1.1950 with a pin bar. The price is expected to go down to the support zone of 1.1680-1.1550, provided by the broken descending lower channel. Then, it is supposed to work its way back up from these levels with a push from the harmonic pattern & divergence in RSI to reach the resistance zone again.


USD/JPY

The price is located at a very strong short-selling area, rebounding from the descending trend line from the high of 2018. Besides the broken uptrend line from the low of 2011, also reaching the top edge of the upward channel along with forming an AB=CD harmonic pattern with divergence on RSI. The price also is about to shape a double top pattern. We will wait for a bounce from these levels and break beneath the upward channel to go short to our targets of 108.1 then 104.8.


Categories
Forex Market Analysis

USA VS China Trade, Inflation and Quarterly Results


Macroeconomic Outlook

Three references for the markets this week

1)      Trade relation between China and USA

  1. Last Friday it was agreed what it could be the beginning of talks that will take time
  2. Rather a constructive agreement than a bad one

2)      Inflation

  1. American inflation is the key variable this week
  2. It is expected to increase to 2.5% from previous 2.4%
  3. Currently is above the 2% target and this creates certain anxiety and can have some effect on bonds
  4. Might consider the option of a lower than expected inflation (<2.4%)
  5. Payrolls data, which was published on Friday, was 2.6% instead of 2.7% moving away from the 3% barrier
  6. The option of a lower inflation rate provides a less stressful outlook

3)      Quarterly Results

  1. Really good so far in the USA
  2. Partly because of the tax reform
  3. EPS had increased to an average of 24,8% when at the beginning it was expected to be around 17%
  4. Good so far too in Europe
  5. More European companies will publish results this week

Hence, bearing in mind a decent agreement between USA and China, the possibility of lower inflation and good corporate results, the markets should bounce and rise a little this week.

Furthermore, if the inflation turns out to be lower, it could be good for bonds and could contribute to a weaker US Dollar wich has increased significantly recently.


Technical Analysis

US Dollar Index

Daily Chart

It is possible to appreciate how the US Dollar Index, after tumbling for a couple of weeks, broke all the resistances and increased significantly. The most important resistances generated from its monthly bearish trend have been broken in one strong movement upward. Including, also, its 200-day EMA which is retesting right now. The only significant resistance that is facing now is at the 93.5 which will be the next target leaving some space for a longer run.

EURUSD

Daily Chart

After testing for the third time the bearish trend line on the top it dropped,  strongly breaking its two supports below it. Not only it fell after testing its resistance and breaking the upcoming supports but also, on Wednesday it broke below the third support which is currently retesting. This can be either a fake breakout or another shorting opportunity.


GBPUSD

Daily Chart

After breaking the support, which has been holding price during its bullish trend line, it is eyeing the next solid resistance which is at a level of 1.34 more or less. After breaking the 200-day EMA, it is taking a rest. It may either retest the recent support broken which is hard as the bullish trend was really steep or test the next resistance which is closer and extending the bearish move.


USDJPY

Daily Chart

The dollar broke both resistances after doing a fake breakout and bouncing back from the monthly support. It has created a small bullish trend in the short term where it can be holding on until it reaches its next target which is the monthly bearish trend, currently situated at a level of 111.5. Either that or starts going sideways for the next days until it breaks one of the monthly trends.

Crude Oil

Daily Chart

Recent geopolitical events and tensions in Syria have created volatility in the markets, and consequently, the price of oil has been on the rise. After holding to the bullish trend line and breaking above $65 it did a retest of the recent resistances it just broke above. Without more resistances ahead, it has just reached the expected target of $70 per barrel. There are not any significant resistance above which leaves the door open for a longer bullish run.

DAX

Daily Chart

It bounced back from the monthly bearish trend which was the strongest one and consequently in the recent run it has just broken both two bearish weekly resistances. Last Friday it closed above the last resistance which leaves the door open for a continuation, possibly at less slow pace, of the recent bullish trend formed from testing the resistances and breaking the supports.

©Forex.Academy

Categories
Forex Market Analysis

Opposing forces drive the markets in the upcoming week

Weekly Update

Regarding fundamentals, we are expecting opposing forces drive the markets in the upcoming week. Volatility has sparked bearing in mind the recent intervention of the USA in Syria. However, stock futures are up, and oil is down on hopes Syria attack a one-off.

Thus, we’ll focus on the most foreseeable variables. There are three variables that are mainly moving the markets

  • Protectionism
    • A less negative pressure in the short term as fears erase
    • Recent formal declarations by Chinese president rise expectations of a friendlier trade
    • There are still two months until Trump takes in action any tariff measure
  • Technology
    • Recent testimony by Mark Zuckerberg leaves good feelings and calms the markets
    • Relieves pressure on technology companies
  • Quarterly results
    • 2018 benefits are revised downwards
    • However, 1st quarter is expected to be robust with strong corporate volumes and margins which will be positive in the short term
Macro Data

This week there is no major macroeconomic event that will affect considerably the markets.

On Monday we have American Retail Sales which are expected to increase to 0.4% from the last- 0.1%. This can benefit the US Dollar. On Tuesday, the German ZEW Economic Sentiment can have some impact on the Euro and DAX. It is expected to decrease to -0.8 from 5.1. Finally, on Thursday, the American Manufacturing Index is released, and it is expected to decrease around one point.

In general, the macro outlook is more pessimist than positive. However, the previous three variables provide a more positive outlook and provide a better understanding than the macroeconomics events on how the markets will act this week. So that, we could expect a stabilization phase in the markets after the recent volatility. In general, slightly more positive than negative.


 USD Index

Weekly Chart


In the weekly chart, it is possible to appreciate how the USD Index is not only below the 200 EMA but also broke below the weekly support that has been retesting in the recent weeks and which has not been successful so far. In the short term is facing a bearish trend line caused by its recent devaluation.

During the first half of this week, there are not big news. However, on Wednesday, American Inflation numbers come out. It is forecasted that the core CPI will increase to 2.1% from previous 1.8%. Furthermore, on Friday, Moody’s published its USA rating, which right now has the highest rating possible with stable perspective. Hence, recent controversial policies from the American government making protectionism and a trade war a reality can alter the expectations for the mention economic events. In case the forecast does not vary the USD should not be hurt. However, an unexpected increase in the Core CPI and a rating downgrade from Moody’s can really hurt the Dollar.

Daily Chart 

The daily chart is similar to the weekly chart. The retest cannot break above the recently broken support and is facing more bearish pressure ahead. Nevertheless, it just formed double bottom pattern followed by a short-term bullish trendline. This week will be critical to know whether the bearish support is strong enough or it holds on to the current bullish trend.

EURUSD

Daily Chart

Regarding the EURUSD, it has been flat since February. Last month it broke its monthly bullish trend, and the consequently retest it.  From there, it has remained flat with no major fluctuations. However, with the recent uncertainties facing both the Eurozone and the USA it will not be surprising to see the EURUSD leaning towards a side. For now, it is holding at a strong resistance that dates back to September of 2017.  It is facing a couple of support and resistance which will help to know towards what side it will lean and leave the rectangle it is in now.

USDJPY

Daily Chart

Moving into the USDJPY, it has just bounced from a monthly bullish trend after doing a fake breakout and consequently bouncing back. A bullish trend could be considered since there are not big resistances ahead part from the 200 EMA and the recent bearish monthly trend. In the short term, there are two resistances not very strong, but that may cause a small retracement. However, the monthly support is stronger than the resistance it is locked up between.

GBPUSD

Daily Chart

GBPUSD seems to have no limits. At the beginning of the year, the Pound broke an important bearish trendline holding to its current bullish trendline. Moreover, last week just broke another key resistance. With no more important resistance ahead it has a clear path to keep up with the current upward trend. Maybe it is possible to do small retest as we saw with the previous one.

Crude Oil

Daily Chart

Recent political events, like the recent issue of the missile attack against Syria, have created volatility in the markets and consequently, the price of oil has been on the rise. After holding to the trendline and breaking above $65 it is possible to see a retest of the recent resistances it just broke above. Without more resistances ahead, analyst set that next target is $70 per barrel.

DAX

Daily Chart

Regarding technical, it is within a bearish trend that can be prolonged as there is still uncertainty in terms of politics and the recent macroeconomics event have not been reaching the forecasted ones. However, an improvement in the economic sentiment and political stability can help the DAX to break the ahead resistance and enter a bullish trend, leaving the current flat to bearish trend it is involved in now.

As commented at the beginning, on Tuesday the German ZEW Economic Sentiment is released. Hence, it can major point to decide whether it breaks the recent resistance and follows the daily bearish trend.

© Forex.Academy

Categories
Forex Market Analysis

market overview for US index & pairs

News

No need to say that that the hour talk now is about hitting Syria by US, France, & Great Britain

Of course, there’s a lot of action going on as U.S. tells UN it’s ready to hit Assad again, if necessary.

Also U.S. Eyes Russia Sanctions for Syria, U.K. Sees One-Time Hit.

UN Ambassador Nikki Haley, speaking Sunday on CBS’s “Face the Nation,” said U.S. Treasury Secretary Steven Mnuchin will announce new sanctions Monday that “go directly to any sort of companies that were dealing with equipment” related to Syrian leader Bashar al-Assad and his chemical weapons.

Oil prices, which already are above their three-year highs, may be about to jump further.

As Brent oil could spike to $80 a barrel if the U.S. and European Union reimpose sanctions on Iran, and as Western powers expand the scope of the Syrian civil war.


US Index

S&P500 behaviour has been intensively bearish on Daily frame, with a sideways movement during the last ten weeks.

There are perfectly well-noticed signs indicating that prices will be up active again.

Reversing from the support level at 88.35, bouncing from the uptrend’s  2018 low, and forming a double bottom, which is a reversal pattern, to give shape to a harmonic pattern (crab).

The price is facing a strong resistance test at the down trend lin from the high of May 2017, also with the red resistance zone (90.45-91.65).

If the price successfully breaks these levels, we can see it climbing up to its next zone (92.55-93.9). as it’s 61.8% & 78.6% Fibonacci, B harmonic level, and turn down from the high of 2017.

 EUR/USD

On 1H frame, we can see that the price broke the uptrend line provided by reversing from resistance zone (1.239-1.2425). The most important issue is that it approached the downtrend line traced from 2008 high.

The price draws a triangle that, if broken down, we can easily test the levels 1.23 then 1.226


GBP/USD

On 1H frame, the pair touched the resistance 1.428, with a megaphone pattern.

The price is expected to visit the 1.42 level to retest it. In case it breaks it, we can see it touching 1.415 and then 1.409


NZD/USD

The pair has faced its resistance level at 0.939 by breaking the uptrend line and rising reversal wedge. It’s supposed to retest the uptrend from the low of April at 0.732 then 0.727

Categories
Forex Market Analysis

Volatility moves towards Europe

Hot Topics:

  • S. Core PPI (YoY) reaches the highest level since 2012.
  • Volatility moves towards Europe.
  • The pound rally continues due to the weakness of the dollar.
  • Jinping reduces risks of a Trade War.
  • Oil Brent reaches the highest level since 2014.

U.S. Core PPI (YoY) reaches the highest level since 2012.

The signs of strength in the economic growth of the United States continue, the Underlying Producer Price Index (YoY) reached 2.7% in the March period, the highest level since June 2012. The Core PPI (MoM) index, for its part, it reached 0.3% on the expectations of analysts who projected 0.2%. According to the Bureau of Labor Statistics, 70% of the increase in final demand is attributed to a rise of 0.3% in the prices of final demand services, in the same way, transport and storage services for final demand increased by 0.6 %. The increases in the level of inflation for producers are expected to have an impact on the Consumer Price Index, which will be published this Thursday.

Despite these positive macroeconomic data, the greenback index continues its strong depreciation, which has lost 2.83% in the year. Today is closing with -0.25% of loses. We are paying attention to the zone between 89.15 and the 61.8% of Fibonacci retracement level, where the Index has found support.

Volatility moves towards Europe.

The risks of the Trade War between the United States and China are disappearing more and more with the bilateral attempts to resolve the conflict in a friendly way. However, in Europe, the scenario that seemed full of geopolitical stability is changing. This Sunday 08, Viktor Orban won the elections in Hungary for the fourth time in a row. With an utterly autocratic speech, the nationalist Prime Minister proposes an anti-immigrant policy and open attacks towards the European Union. Hungary refuses to comply with the agreed European migration policy, that is, accept quotas of Syrian refugees, in the same way as the United Kingdom raised in one of its arguments against Brexit. It should be added that Mr Orban is not alone in this political tendency; he has found allies in power in Poland, the Czech Republic, Slovakia and Italy. All of them are willing to reject the obligation to accept refugees and respect the right of free movement.

The euro has closed with gains for the third consecutive session with a 0.29% of advance. The pair shows a bullish move in the middle of a sideways formation. In the last trading session, the price has found resistance at 61.8% of Fibonacci retracement

The pound rally continues due to the weakness of the dollar.

The pound continues for the third consecutive session in a bullish rally advancing 0.64% in the week and has gained 0.35% in the last trading session. All this occurs in the context of the weakness of the dollar despite the excellent macroeconomic data of the United States. The level of support to be controlled is 1.4145; the key resistance level is 1.42 as a psychological level.

Jinping reduces risks of a Trade War.

Chinese President Xi Jinping has promised to reduce import tariffs by alleviating the fear generated by the escalation of bilateral tensions between the United States and China. In a speech held at the Boao Forum, President Jinping promised to open the Chinese economy further, protect the intellectual property of foreign companies. These words filled the market with optimism, leading the indexes to move positively, the Dow Jones Index advanced 1.48%, while the yen reduced its attractiveness as a refuge, leading the USD-JPY to close with 0.41% of earnings.

The USD-JPY pair is forming an ascending diagonal pattern, which still has space to follow a rally, the closest resistance levels are 107.49 and 108, and the support level to control is 106.64.

The Dow Jones index, which is within a descending channel, the price is for the control support level at 24,037.3 and is developing a possible upward diagonal formation whose closest resistance is at 24,630, a level that coincides with the Upper part of the bearish channel. Bullish positions are valued as long as they do not fall below the 23,749.3 level.

Oil Brent reaches the highest level since 2014.

The euphoria of the reduction of the economic tensions between the United States and China due to the sayings of Jinping, not only has motivated to the indices but also the oils. The Brent has reached its highest level since 2014, reaching the $ 71.03. Crude Oil, on the other hand, approached two-week highs reaching $ 65.76. The oil rally and the Dollar weakness also benefited to the pair USD-CAD (by inverse correlation) which closed at lowest levels since February testing the psychological level 1.26 approaching the level of Fibonacci retracement 61.8% at 1.2583.

Our central view for this highly correlated group has been bullish; but we currently prefer to maintain a neutral position considering that once the oils reach specific levels in the long term for their structures, they should make a significant corrective movement that will allow us to join to the trend. As long as Brent does not reach the area between $ 71.26 and $ 72.91, and Crude Oil does not come close to $ 69 and $ 70, we do not expect a start of a significative correction.

In the case of the USD-CAD pair, once it reaches the base of the channel, it is expected that a bullish move could begin.

©Forex.Academy


Categories
Forex Market Analysis

Tit-for-tat weighs heavy on the markets

A difficult week

It has been another difficult week in the markets, and this has been primarily down to the difficulty in assessing what the trade standoff between the US and China mean for the markets. The week started off with the market taking fright as additional tariff threats were voiced by the US, leading to a sharp sell-off in equity markets. However, much of that rhetoric was rowed back on leading to a significant bounce back actually making pre-fright highs before the SP500 started to sell off again.  This simply means that there is no overriding directional bias in either direction making this market very choppy and difficult to trade.


Gold

As a result, the Gold market responded by initially strengthening due to the fear related to the equity story but then reversed those initial gains and now trades right in the middle of significant support and resistance levels which can be clearly seen from the chart below, these significant levels are $1,357 and $1,310, so all eyes will be on these levels over the coming days and weeks to see what is next for the yellow metal.

Oil

The Crude-Oil market responded to these major global developments by initially selling off but then after seeing a bit of erratic price action we continued to see a continuation to the down side, closing the week below the $62 level.  However, from a technical perspective, the situation regarding the crude oil market is an interesting one.  We can see from the chart below that we have been in a consistent up trend since mid-June 2017, reaching a high of $66 towards the end of Jan 2018.  Since this time, this market has clearly struggled to break the $66, creating a double top end of March.  So over the last two weeks, this market has bounced back to its lower trend line.  The next few days will be interesting to see whether the support level holds and we see another attack at the $66 level or will this support level break, and we see prices pushing down to a potential structural failure below the $60 level which would put major pressure on this market to the downside.  At this crucial point, it’s hard to see whether buyers or sellers will win out.


So just to recap, over the course of the last 5 trading days, US officials made very strong statements about the need for trade tariffs to be introduced only for US officials to then row back on some of its rhetoric, as a result, market nerves were calmed, and Monday’s fear related move was subsequently reversed. The S&P rallied and then retraced, and the gold and crude oil markets came off.

US Dollar

The USD, however, has been impacted by recent events but to a lesser degree. As you can see, from the chart below, the dollar index has been in a period of consolidation since mid-Jan.  These, unfortunately, for the time being, are the market conditions in which we are trading the USD. The two major prices to keep an eye out for over the coming days and weeks is the 99.880 to the up side and 88.416 to the down side.  A move in either direction would be significant for this market.


EURUSD

EURUSD continues to trade within a range. Today’s weaker NFP numbers perhaps suggest that the pair might move higher next week given the fact too that from a technical perspective, the pair is trading closer to the lower end of its range as can be seen from the chart below.


USDJPY

USDJPY has been firmer this week, however, watch the key pivotal resistance area next week around 108.20. This was the breach that confirmed a bearish range breakout back in February.


The US Dollar paired earlier gains during Friday’s London session after data showed the US economy adding new jobs at less than half the pace economists had expected for the March month. The important Non-Farm Payrolls figure grew by just 103,000 during the recent month, which is down from 313,000 in February and far below the economist consensus for a reading of 188,000.

Separately, the unemployment rate held steady at 4.1% for the month when markets had been looking for a 10-basis point fall to 4.0%. Household incomes grew by 0.3% during the recent month, which is up from the 0.1% seen in February and in line with the consensus forecast of economists.


Price action largely noted limited volume in the week leading up the non-farm payroll figure but saw initial volatile swings before the USD began to weaken over the course of Friday afternoon and evening.

Trade of the week – Long GBP/USD

With the US caught up with trade issues with China causing confusion among other countries and added uncertainty across the US Dollar Forex Pairs, perhaps the best technical trade may look GBP support with better than forecast UK economic data.

With the GBP showing strength over the USD in April for the last 13 consecutive years running, speculators are now looking at this trend for the best potential buying opportunity. With good news for the pound with UK PMI slightly higher than expectations, Friday trading is seeing the pound trade up with a touch and bounce from the greater bullish trendline of 2017. The discussion now seems to favour the pound is seemingly defying the expectations of Brexit doom.


Categories
Forex Market Analysis

The Trade War could benefit South American Producers

DAILY UPDATE

Released: 5th April 2018.

Hot Topics:

  • The trade war could benefit South American producers.
  • The unemployment rate of European Union falls to 8.5%.
  • Climatic factor impacts on March PMI Construction.
  • The Bounce of the Stock Markets Boosts the Yen’s Crosses.
  • Indices rebound driven by possible bilateral talks between the United States and China.
  • The Canadian Dollar is showing an example of the alternation rule of the Elliott Wave theory.
  • Crude Oil Production falls to its lowest level in over a year.

The Trade War Could Benefit South American Producers.

Uncertainty due to the trade war between the United States and China continues. This time China has reacted by incorporating a 25% tariff on soybeans of US origin. It should be noted that China is the primary consumer of soybeans in the world. As a result of this increase in tariffs on American soy, it is estimated that China could turn to South American producers to meet the demand for the grain. Despite this pessimism in the economic context, the Dollar Index in the hourly chart is developing an inverted Head and Shoulder pattern as a bullish continuity configuration. The next control zone is in the range of 90.20 and 90.36, in case if we do not overcome the resistance of 90.36, we could see a potential retracement to the 89.15 area.

The Unemployment Rate of European Union Falls to 8.5%

The signs of recovery in the European economy continue. The unemployment rate of the European Union has fallen to 8.5% in February, down from 8.6% in January. According to the information provided by Eurostat, the labour market in the Eurozone has reached the lowest level since December 2008. This level of optimism has not been enough to push the Euro towards new highs. The single currency is within a range between 1.225 and 1.23, from where it could create a bottom around the levels 1.2213 and 1.224. A new bullish rally could start from here.

Climatic Factor Impacts on March PMI Construction.

The PMI of the Construction sector (MoM) plummeted sharply to 47 pts, compared to the 50.9 forecast, despite the weak data. It is the lowest level since July 2016, when it reached 45.9 pts in the context of the Brexit elections (June 23, 2016). The critical factor in the decrease in activity has been the climatic factor, remember that in March the worst snowfalls in recent years were recorded. Technically the pound is developing a pattern of Head-Shoulder, which could be contained in a more extensive setup of Head-Shoulders. This could lead to sterling up to 1.3922 in the first instance, and up to 1.3737 in the second instance. All this structure could correspond to a major degree lateral structure that takes us from the 1.373 area to reach new highs around 1.45.

The Bounce of the Stock Markets Boosts the Yen’s Crosses.

Yesterday, although tensions in the dispute of tariffs between the United States and China, the Bank of Japan (BoJ) disbursed 833 billion yen (about US $ 7.8 billion) in the purchase of Exchange-Traded Funds (ETFs). This level of expenditure is the highest level since September 2017, the month in which the BoJ spent 830 billion yen. This action earned the yen to start a turn in its trend; this can be seen both in the chart of the USD-JPY and EUR-JPY which have begun to show bullish patterns. For the USD-JPY pair, the closest key resistance level is 108; in the case of the EUR-JPY cross, the control level is 131.71, a level that if exceeded could lead to the price to exceed 133.5 with a maximum extension of 134.5 in the short term.

Indices Rebound Driven by Possible Bilateral Talks Between The United States and China.

Through his Twitter account, President Trump stressed that the United States is not in a trade war with China. The Trump administration indicated that it is willing to negotiate with China on the escalation of tensions between the two countries. The most significant problem as mentioned by the American President in his account on the social network is that the deficit in the American trade balance is $500 billion, which according to his words “When you’re already $500bn DOWN, you cannot lose.” With the fears of a commercial war between the Trump administration and the administration of Jinping, the indices began to recover confidence. They realised a V-turn pattern is taking the Dow Jones to close above the 24,000 pts in a day. It started lower in the global indexes. The level of resistance to control is between 24,800 pts and 24,982 pts, an area from where in case of breaking up, could take us to levels close to 26,000 pts. The key support levels are 24,034 and 23,330 pts, which coincide with the base of a bearish channel.

The Canadian Dollar is Showing an Example of the Alternation Rule of the Elliott Wave Theory.

The Loonie has made a false rut beginning a downward cycle. It is developing a long-term bullish channel as a long-term bearish formation and is reaching a zone of 1.31 and coinciding with the upper guideline of the channel. Once started, this bearish cycle has been developing five clear movements. In this case, we will highlight the corrective formations or consolidation. According to the Elliott Wave theory, the alternating rule states that after a simple corrective structure, a complex structure should be presented and vice versa. By looking at the time chart of the USD-CAD, we can see this application. The conclusion that this case leads us to is to suspect that a recession is approaching, and that could take the price to levels around the area of the complex corrective structure and then return to develop new minimums in the long term.

Crude Oil Production Falls to Its Lowest Level in Over a Year.

The production of crude oil from the countries belonging to OPEC has fallen to the lowest level in a year and a half. This is mainly due to the problems plagued by the policy of Venezuela, where production decreased by 100,000 barrels per day since February, reaching 1.51 million barrels per day according to the survey conducted by Bloomberg News. The overall level of the output of the 14 OPEC member countries fell by 170,000 barrels to 32.04 million barrels per day in March. OPEC has helped stop production as of January 2017 with the aim of boosting the price of oil, which has been currently consolidating above $60 a barrel. Structurally in the hourly chart, we observed a Head-Shoulder formation that did not reach the technical target bouncing upwards. As long as oil does not lose levels below $60.2, the dominant trend continues to be bullish.

©Forex.Academy

Categories
Forex Market Analysis

The Germany ZEW Economic Sentiment could mark optimism for the Euro and other stories

Hot Topics:

  • GBP – The Unemployment rate in historic lows.
  • AUD – Waiting for the minutes of the last meeting of the Reserve Bank Board.
  • EUR – The Germany ZEW Economic Sentiment could mark optimism for the Euro. 

GBP – The Unemployment rate in historic lows.

On Wednesday 21th, the unemployment rate will be released. The analyst survey consensus does not foresee changes in respect to the last month’s data of 4.3 percent, the lowest in four decades. On the same day, the Bank of England (BoE) will release its Annual Inflation Report to the Treasury Select Committee. The BoE’s Governor, Mark Carney will speak in the British Parliament on the Annual Inflation Report to the Select Committee of the Treasury.

The pound reached a new low below 1.3978 and as long as it does not exceed 1.434, there is a high probability that it will fall back to new lows with a maximum target of 1.3448, which would coincide with the long-term bullish guidance.

GBP-USD 4-hour chart (click on the image to enlarge)


AUD – Waiting for the minutes of the last meeting of the Reserve Bank Board.

On Tuesday 20th, in the overnight session, the Reserve Bank of Australia (RBA) will publish the minutes of the last monetary policy meeting, where the members of the Reserve Bank Board decided to keep the interest rate unchanged at 1.50%. Although members observe the growth of employment, and the unemployment rate has remained at a minimum, they conclude that inflation is still below the target goal of the RBA.

The AUDUSD pair could be developing a corrective structure in the form of A-B-C, which could lead to 0.765, once it reaches this area, it could again be a new connector of a higher degree leading to new highs.

AUD-USD 4-hour chart ( click on the image to enlarge)


EUR – The German ZEW Economic Sentiment could mark optimism for the Euro.

In January, the German Economic Sentiment Index ZEW reached its highest point in 8 months, marking 20.4 points, increasing the expectation in the economic environment for the first half of the year. For this month, the analysts’ consensus expects it to fall to 16 points. However, considering the last GDP (YoY) in Germany reached 2.3%, and in the Eurozone which reached 2.70% (YoY), we expect the ZEW index to continue at the same level as that registered in January.

The single currency could mark a new maximum that could reach 1.2646, thus completing a sequence of five movements. After this, we could expect a corrective move for the Euro. However, we should expect all pairs against the Euro to be “aligned” before starting a more profound corrective process for the euro.

EUR-USD 4-hour chart ( click on the image to enlarge)

Categories
Forex Market Analysis

DAILY ABSTRACT – 15th February 2018


Hot Topics:

  • USD – CPI above the FED target increases the probability of a rate hike
  • EUR – Growth level of the Eurozone suggests that tapering could start soon


Main currencies daily performance.

USD – CPI above the FED target increases the probability of a rate hike.

In the session on Wednesday, the Consumer Price Index (CPI) and the Core Consumer Price Index (Core CPI) were published, discounting energy and food components. The CPI (YoY) index as of January climbed to 2.1%, above the 1.9% expected by analysts. The current level shows a consolidation in the strength of the level of consumption in the US economy; in this context, the probability of raising the interest rate in the next meeting of the Federal Open Market Committee (FOMC) increases.


Technically, we observe the continuation of the corrective movement that could reach the area from 88.66 to 88.44, the area from which it could form a higher grade connector (or mother wave), and begin to bounce. At the moment we maintain the neutral position in this index.

US Dollar Index 1-hour chart ( click image to enlarge)


EUR – Growth level of the Eurozone suggests that tapering could start soon.

The last Gross Domestic Product (GDP) (YoY) of the Eurozone published by Eurostat, has reached 2.7% for the second consecutive month, giving signs of stabilisation in the level of economic strength. In the same way, this confidence in the robustness of the economy of the Eurozone gives us indications that the tapering of the policy of quantitative easing could begin to begin very soon.


The single currency is developing a bullish structure that could bring the price to 1.2488, from where it could make a corrective move to 1.24190. While the EURUSD pair does not lose the 1.2275, the primary trend is bullish.

EUR-USD 1-hour chart (Click image to enlarge)

Categories
Forex Market Analysis

WEEKLY UPDATE from January 22 to 26, 2018


Weekly Update’s Hot Topics:

  • JPY – BOJ KEEPS THE MONETARY POLICY UNCHANGED, AND INFLATION CLOSE TO TARGET.
  • DOLLAR – DESPITE THE DEAL TO STOP THE SHUTDOWN THE GREENBACK HAS CONTINUED FALLING.
  • EUR – EURO EXCEEDS 1.25 HELPED BY DECLARATIONS OF DRAGHI.
  • AUD – EXPECTED VOLATILITY DUE TO INFLATION DATA RELEASE.


This week, the best performer was Crude Oil <USOil> with a rise of 4.48%. WTI has reached $66 (US)/Barrel, the highest level since December 2014. Despite the strikes deal between the Republican and Democrat US Senators to stop the Government shutdown, the Dollar <DOLLAR> cannot take a breath and continued falling 1.56% this week.


JPY – BOJ KEEPS THE MONETARY POLICY UNCHANGED, AND INFLATION CLOSE TO TARGET.

The Bank of Japan (BoJ) decided to keep the monetary policy and the economic stimulus unchanged. Kuroda (The Bank of Japan governor) has signalled that the BoJ might be nearing the start of policy normalisation: but not so fast. The BoJ’s members voted 8-1 to keep its interest rates and asset purchases at current levels. Also, Kuroda said inflation expectations had stopped falling. The BoJ’s perspective is that the economy will grow 1.4% in the fiscal year starting in April, with an inflation of 1.4% over the same period.

The inflation data (YoY), excluding the food component, released this week has reached 0.9%. Kuroda, speaking at the World Economic Forum in Davos has said that “there are some indicators that wages and some prices have started to rise”. Also added that “there are many factors that make reaching the 2% target difficult and time-consuming, but we are finally close”.


Technically, the USD-JPY is completing a sideways consolidation macro-structure. Our vision is, if we expect the price to fall to 108.16 to 107.18, the yen could find buyers again.

USD-JPY  Daily Chart ( click on the image to enlarge)

DOLLAR – DESPITE THE DEAL TO STOP THE SHUTDOWN THE GREENBACK HAS CONTINUED FALLING.

This week the Republicans Senators have struck a deal with the Democrats to temporally stop the US Government shutdown which lasted for three days, the first shutdown since 2013. In this agreement, Democrats have accepted to vote for the bill while they will continue negotiating immigration legislation for “dreamers” (children that migrate illegally to the US). This agreement has as a deadline February 8.

The week has ended with the US GDP (QoQ) data release. The US economic growth is at 2.6%, that is lower than the expected 3% in the fourth quarter. Although the fourth-quarter GDP has been slowed, in 2017 the economic growth has gained momentum from the 0.9% reported in March 2017.


Technically, the US Dollar Index has broken down in the past week to the 88.9 level. Our vision for the next week is a limited downward turn to the 87.85 to 87.1 area, and then for it to make a potential reversal pattern to reach 91.03 level.

US Dollar Index Daily Chart ( click on the image to enlarge)


EUR – EURO EXCEEDS 1.25 HELPED BY DECLARATIONS OF DRAGHI.

This Thursday the common currency has raised to over 1.25, the highest level since December 2014. In the last Monetary Policy Decision ECB Conference, President Mario Draghi has maintained the accommodative policy and the interest rates will remain well beyond the end of the QE.

Regarding forex risk, Draghi signalled that “now, we have downside risks relating primarily to geopolitical and especially foreign exchange markets. But by and large, the risks to growth are balanced.”

On the technical side, once the Euro reached the weekly Fibonacci level F(38.2), it has started to make a corrective move leading the pair to the 1.24235 level. Our central vision is that the Euro could start a new bearish cycle, where our first target is 1.16845.


EUR-USD  Daily Chart ( click on the image to enlarge)

AUD – EXPECTED VOLATILITY DUE TO INFLATION DATA RELEASE.

In the last week of the month in the Oceanic Session, the volatility expected will come from the Inflation (QoQ) data release. The analysts expect that the CPI (QoQ) will be 0.8% and (YoY) 2.0%. Under this context, the RBA (Reserve bank of Australia) could hike the Interest Rate in the next Monetary Policy Meeting scheduled on February 6.

As has been forecasted previously, our primary vision remains bullish for the Aussie, where the long-term target is 0.8433 level from where the price could find sellers to begin to develop a major degree connector.

AUD-USD  Daily Chart ( click on the image to enlarge)

Categories
Forex Market Analysis

Daily Abstract 22nd January 2018

Daily Abstract’s Hot Topics:

  • USD – THE US GOVERNMENT SHUTDOWN ENDS AS SENATE MAKES A DEAL.
  • EUR – PRESIDENT MACRON TO BBC: FREXIT IS COMING?
  • JPY – ANALYSTS DON’T EXPECT CHANGES IN THE MONETARY POLICY.


Main currencies daily performance.

USD – THE US GOVERNMENT SHUTDOWN ENDS AS SENATE MAKES A DEAL.

The US government shutdown ends after the Senate Republicans and Democrats voted to approve a temporary funding bill. Democrats have accepted to vote for the bill while they will continue negotiating immigration legislation for “dreamers.” The agreement has until the 8th February deadline.


The Buck today has moved in a range expecting an agreement between Republicans and Democrats. The bias remains bearish.

EUR – PRESIDENT MACRON TO BBC: FREXIT IS COMING?

The French President Emmanuel Macron said to BBC that he would have “probably” voted to leave the EU if offered the choice in a referendum. This is not the first time that President Macron has spoken about the Frexit idea, on the 1st of May 2017, in the presidential campaign, he said that “we have to reform this Europe” or “we will have a Frexit.”

Despite the President Macron’s declarations, the Euro is still moving in a range between 1.221 and 1.227; probably the common currency is expecting for more volatility that could be helped by the German ZEW Economic Sentiment data release.


JPY – ANALYSTS DON’T EXPECT CHANGES IN THE MONETARY POLICY.

The BoJ (Bank of Japan) will release its statement on today’s Monetary Policy Meeting. The analysts do not expect changes on monetary easing despite recent signs of economic recovery, and the inflation target is below the BoJ target (0.6% real vs 2% target). Probably the Governor Haruhiko Kuroda could give signs of the reduction in the quantitative easing and the interest rate hike in the long-term.


Technically, the pair USDJPY is in a sideways structure. Our vision is that there will be a probability of a bearish continuation before a spike to 111 level for starting a downward cycle.


Categories
Forex Market Analysis

Hot Topics – December 18 to 21, 2017

Hot Topics:

  • US DOLLAR – THE BEARISH BIAS DUE TO TAX REFORM CONTINUES.
  • GBP-USD – BREXIT NEGOTIATIONS AND ECONOMIC GROWTH DRIVES STERLING.

This past week presented significant advances for the New Zealand dollar with a 2.25% advance, due mainly to the weak inflation data (YoY) shown by the American economy (1.7% vs. 1.8% expected). The increase of the interest rate by the FOMC was not enough to reverse the advance of the Kiwi.

The worst performance of the week was exhibited by the British Pound with a -0.41% loss. The BoE decided to keep the interest rate at 0.5% in the context of an increase in unemployment for a second consecutive month, reaching 4.3%. On the other hand, inflation (YoY) scored a 3.1% advance, the highest level for almost six years; specialists believe that CPI is reaching a peak and that it could mainly impact the cost of the services sector.


 US DOLLAR – THE BEARISH BIAS DUE TO TAX REFORM CONTINUES

Dollar begins a bearish week in the context of uncertainty over the approval of tax revision legislation with the aim of making American companies more competitive.

The Republican Senator Bob Corker has expressed concern about the fiscal deficit that can result from the tax cuts. Despite having a position in favour of the tax review, doubts remain in the approval of the reform, in the same way that the Senate rejected the Trump Administration’s proposal to suppress Obamacare last July.

The Greenback has broken the bullish guidance that has reached S3; there is a possibility that it will develop a bullish reversal movement up to the weekly pivot level. You can find more information in our article Finding Trade Opportunities Using Pivot Points.


GBP-USD – BREXIT NEGOTIATIONS AND ECONOMIC GROWTH DRIVES STERLING.

Economic growth and negotiations for Brexit continue to be the primary drivers of the Sterling. On Wednesday, the governor of the BoE will address the Parliament in the context of the hearing of the Select Committee of the Treasury on the November Financial Stability Report.

The British Prime Minister, Theresa May, has assured the Parliament that she is looking for the Brexit transition to be completed within two years. The first phase of the Brexit negotiations has been on the rights of EU citizens in Britain. EU members have agreed to move to the second stage, which focuses on the transition and future commercial relations. The British Parliament has urged May to stand firm in the interests of the United Kingdom, such as a previous Prime Minister, Margaret Thatcher.

Technically, the Pound is developing a corrective structure, with a bias for bullish continuation. The RSI shows a bullish divergence; however, we expect a retracement towards the weekly pivot zone and then continue with the bullish movement in the medium-long term.

 EUR-USD – CORRECTIVE STRUCTURE IN DEVELOPMENT

The single currency is developing a corrective structure; the RSI has not yet shown evidence of rupture. We expect the price to make a bearish movement in five; that means, the euro could move up to R1 and then fall to S2, thus completing a five-wave sequence.


 USD-CAD – LOONIE CONTINUES IN A SIDEWAYS RANGE MOVEMENT.

The Loonie continues in a sideways range formation, waiting for data to act as a catalyst. Most probably, the previous movement will continue to R2 (1.30 level). The RSI is forming a triangular structure that is finding resistance at level 60. The bullish bias still prevails, with the average of 9 periods under the RSI.


 NZD-USD – A PENNANT THAT COULD BE A PAUSE OF A NEW RALLY.

Last week, the Kiwi was the best currency performer with a 2.25% increase against the USD. This week it is developing a pennant pattern, manifesting a pause with further continuity of the bullish movement. The RSI, on the other hand, is forming a corrective structure. We expect a false move towards the weekly pivot, and then, continuing the upward cycle to the zone of R2 (0.715).


Categories
Forex Market Analysis

Outlook for 10.24.2017

EUR/USD

The US Dollar is hesitant as President D. Trump told reporters he is very close to a decision about who should chair the Federal Reserve, which includes current Fed Chair, Janet Yellen. It also weighs on the US currency the rumors about Trump’s plan to reform taxes.

On the Euro front, European Central Bank is expected to announce on Thursday a possible timetable for a reduction of its asset purchases, as economic data suggest the Eurozone might witness a higher than expected economic expansion in 2017. Reducing asset purchases might, likely, be accompanied with a continuation of low interest rated, as Eurozone inflation data seems to be stable

Sideways channel movement on the EUR/USD pair

The Euro 1-hour price has been trending down since Oct, 19 when it draws an almost perfect triple top (1). Yesterday it touched Oct, 18th lows and bounced from there, and piercing up the downward trendline

Overall, the EUR/USD pair seems to trade in a sideways channel, but its current price may allow for a profitable trade, with a target touching the upper trend line (fig.1).


GBP/USD

JP Morgan analysts are convinced that shorting the GBP is still the way to go

The GBP is, still, affected by the Brexit process, but no major news about it is expected today. Slower consumer expending and softening of economic sentiment press policymakers to keep interest rates unchanged, which weighs on the British currency.

Daniel Hui, a foreign exchange strategist at J.P. Morgan said that their conviction to short the GBP is still high because they felt UK rate hikes were “overpriced”, given the “weak starting point for UK growth” and the reality of a Brexit shock that keeps dominating the medium-term outlook.

There is evidence that today’s lows might be the start of a new up-leg that may carry GBP/USD prices up to, at least, the highs of this lateral channel

GBP/USD daily price is experiencing a sideways movement, after retracing more 70% of its upward movement from its lows in August 2017

Possible scenarios:

  1. Today’s lows (1.31653) might be the start of a new up-leg that may carry GBP/USD prices up to, at least, the highs of this lateral channel (1.32272), provided that prices cross over the downward trend line.
  2. If the price does not continue up and reverse near the BB mean, then the downward leg is continuing to its next floor, at 1.31, and a good reward to risk trade is possible at about 1.3177.


USD/JPY

Japan was in focus yesterday, as prime minister, Shinzo Abe is back in power

Japan was in focus yesterday, as prime minister, Shinzo Abe is back in power, after his victory this weekend, that drove the yen downward yesterday. Today, we see a bounce that set prices to test the highs of yesterday’s session. Tuesday, the Japanese currency, instead of focusing on Japan’s manufacturing PMI, slightly lower in October, it seems to pay more attention to interest rate differentials.

Mid-term, the USD/JPY is trading on a lateral price channel whose low is at about 107.7 and it’s high is at 114.34. Currently, the price, trading at 113.71, is moving closer to the top of that channel.

A short-term bottom at (1) in sync with the MACD signal crossover, marks the start of a new uptrend. The red 10-period BB is sloping strongly up, so prices are heading for a test of the recent highs at (3), and, potentially break them up.

The best possible action here is to scalp on a short timeframe, such as 15 min charts or shorter, being aware that we are at the highs of a mid-term channel. Long and short-swing trades must wait for a clear signal or news event


USD/CHF

The Swiss National Bank (SNB) is keeping an expansive monetary policy that drives Swiss CHF down

The Swiss National Bank (SNB) considers the CHF to be over-valued, so it is keeping an expansive monetary policy that is driving the Swiss currency down. The SNB policy of negative interest rates contributes to the downward currency trend.

To sum up, the Swiss economy is slowing down, its growth rate (+0.3%) is losing track compared to the one registered in the Eurozone (+2.3%) in the second 2017 quarter.

USD/CHF is at overbought but still strongly moving up

The USD/CHF weekly is on a sideways channel with a lower limit at 0.942, and an upper limit at 1.0365. Its current price – 0.9896- is at about the middle of this channel. On a daily and weekly basis, the price is in overbought territory.

Today the USD/CHF is trading strongly up, and its hourly chart is currently at overbought territory as well, with its price touching the 3rth Bollinger band (+3STD) (1). On such a strong trend, the best thing to do is wait for a price pullback to create a short-term support near the mean of the Bollinger bands (2) and set a long trade there.


AUD/USD

Tomorrow, Australia’s quarterly inflation data will be released.

The Aussie is under pressure as the soft Chinese housing data was weaker than expected. China is a major partner for Australia, and China’s economic health shakes Australian currency for the good and the bad. The Housing Price Index grew in China by 6.3%, after an 8.3% increase in August. Next Wednesday, Australia will release its quarterly inflation figures.

AUD/USD is currently in a downtrend

The AUD/CAD pair, on a weekly chart, is moving on a downward leg, in a sideways channel that started in Jan 2015. The channel has a slight upward bias.

On the daily chart, the AUD/USD pair is down-trending after drawing a double top (July and September 2017). Actually, the price is below the -1 Bollinger Band showing that the downtrend is still in place

The most probable scenario for the AUD/USD pair is to go down to at least 0.766, or, even deeper, to touch the lower weekly trend line (0.7518). The MACD crossover to the downside confirms the bearish bias of this currency pair


USD/CAD

USD continues to show strength against the Canadian currency. Tomorrow’s interest rate decision by the Bank of Canada will bring a confirmation (or denial) to the strong uptrend od this currency pair. The odds of a new rate hike are getting lower, after weak economic data ahead of the BoC meeting.

Canada Wholesale sales rose by just 0.5% in line with forecasts, although, it seems the market expected a bit more increment.

USD/CAD moving up with strength
The USD/CAD pair, on a weekly chart, is in the middle of a retracing trend, starting at the beginning of September, which has retraced 35% of the length of the downward move. Its daily chart shows the currency pair approaching the ceiling of a potential wide and sideways price channel. The other notable fact being, a price breakout through 1.25953, starting a new impulsive leg up.


NZD/USD

NZ Government to reform RBNZ process to set rates.

The Kiwi dollar is under pressure since the government announced its plans to reform the Reserve Bank of New Zealand. NZ Labor-led coalition said it will modernize the bank’s process for rate-setting and adapt it into a format that was more “growth-friendly”. Giving hints about expansionist monetary policy. Analysts say the RBNZ reform is already well priced by the market, and have downplayed its impact on interest rate expectations.

NZD/USD is currently at the bottom of a down-trending channel

On a daily chart, the NZD/USD pair is trending down on a channel that started on July, 27. Actually, the price is oversold, well below the -2 Bollinger Band. The price is near a mid-term support, so it’s in the process of bottoming out, as is clearly seen in its hourly chart.

A possible scenario for the next few hours is a retracement from here to test resistance points at about 0.695. If it stalls without breaking 0.6908, and MACD turns bearish the retracement is failing, and the downtrend might resume testing the lows made in May 2017.