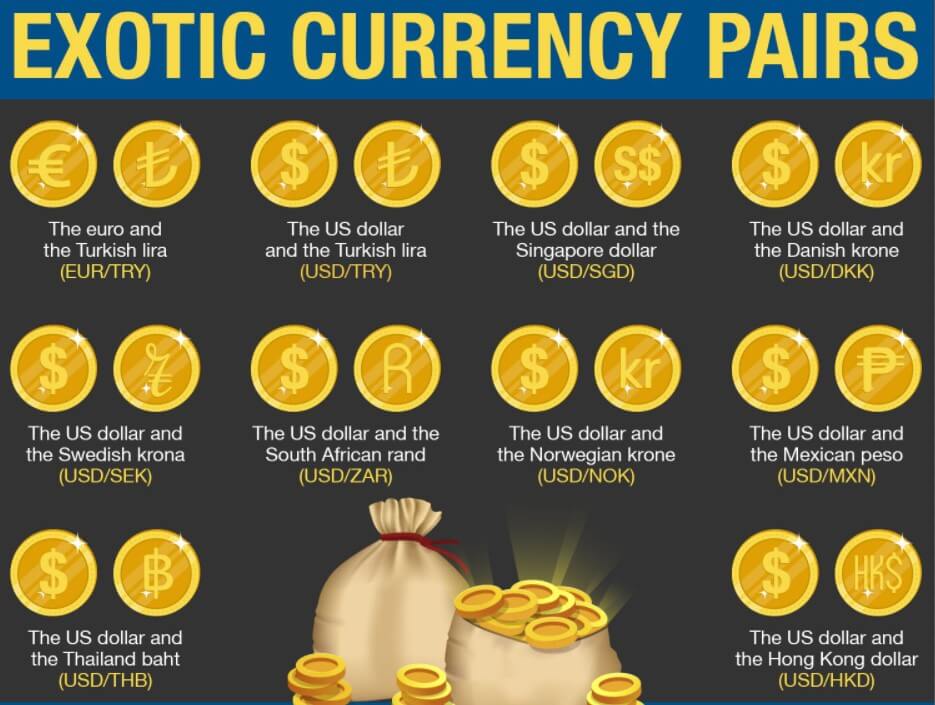
Introduction
In this exotic, AUD is the Australian Dollar, and PKR is the Pakistani Rupee. Trading exotic currency pairs can be highly volatile compared to major currency pairs. The AUD is the base currency, and the PKR is the quote currency. That implies that the exchange rate of the AUD/PKR is the number of Pakistani Rupees that a single Australian Dollar can buy. Thus, if the exchange of AUD/PKR is 112.584, it means that with 1 AUD, you can buy 112.584 PKR.
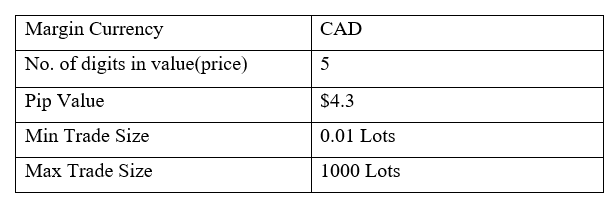
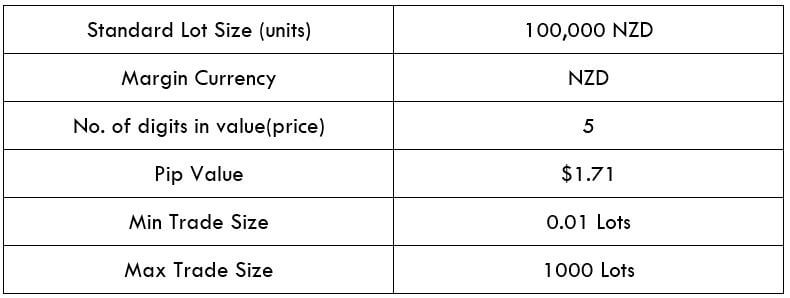
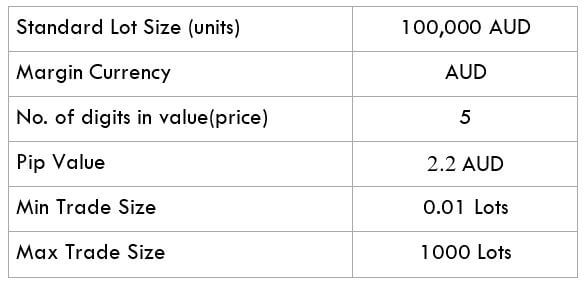
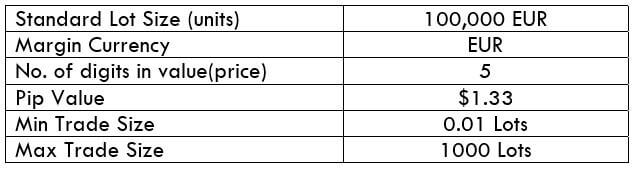
AUD/PKR Specification

Spread
The spread in forex trading represents the value difference between the buying price of a currency pair and its selling price. These prices are referred to as “bid” and “ask.” The spread for the AUD/PKR pair is – ECN: 32 pips | STP: 37 pips
Fees
Some forex brokers charge a fee whenever a trader opens a position. The fee is not standardized and depends on the broker and the size of the trade. Note that STP accounts normally don’t attract broker fees.
Slippage
Whether long or short, when you open a position, it can be executed at a different price than what you requested. This price difference is called slippage in the forex market and is a direct result of extreme volatility or broker delays.
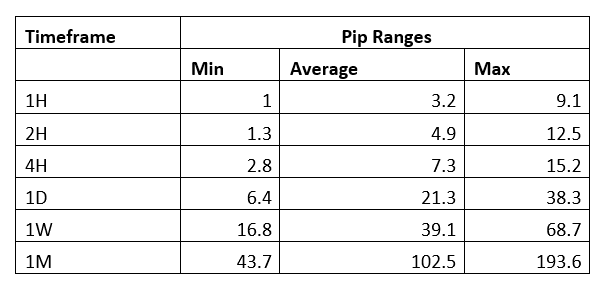
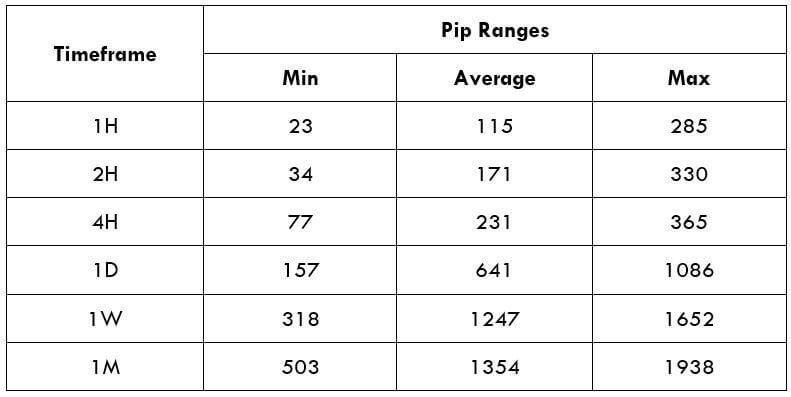
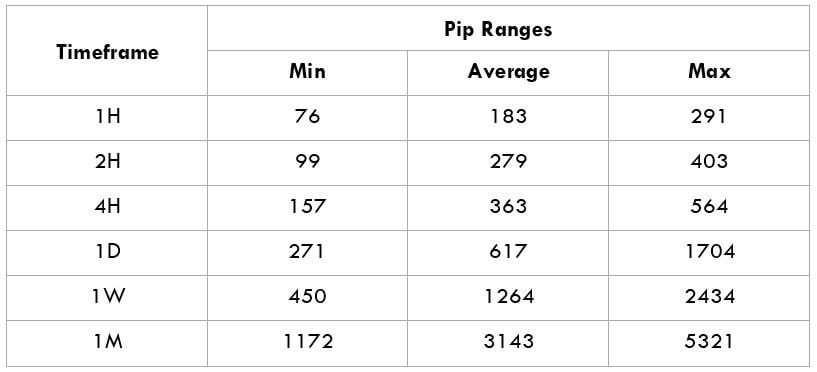
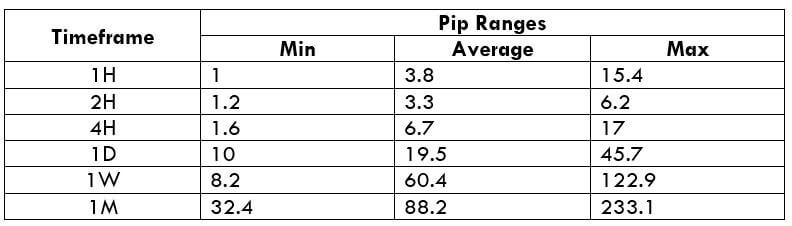
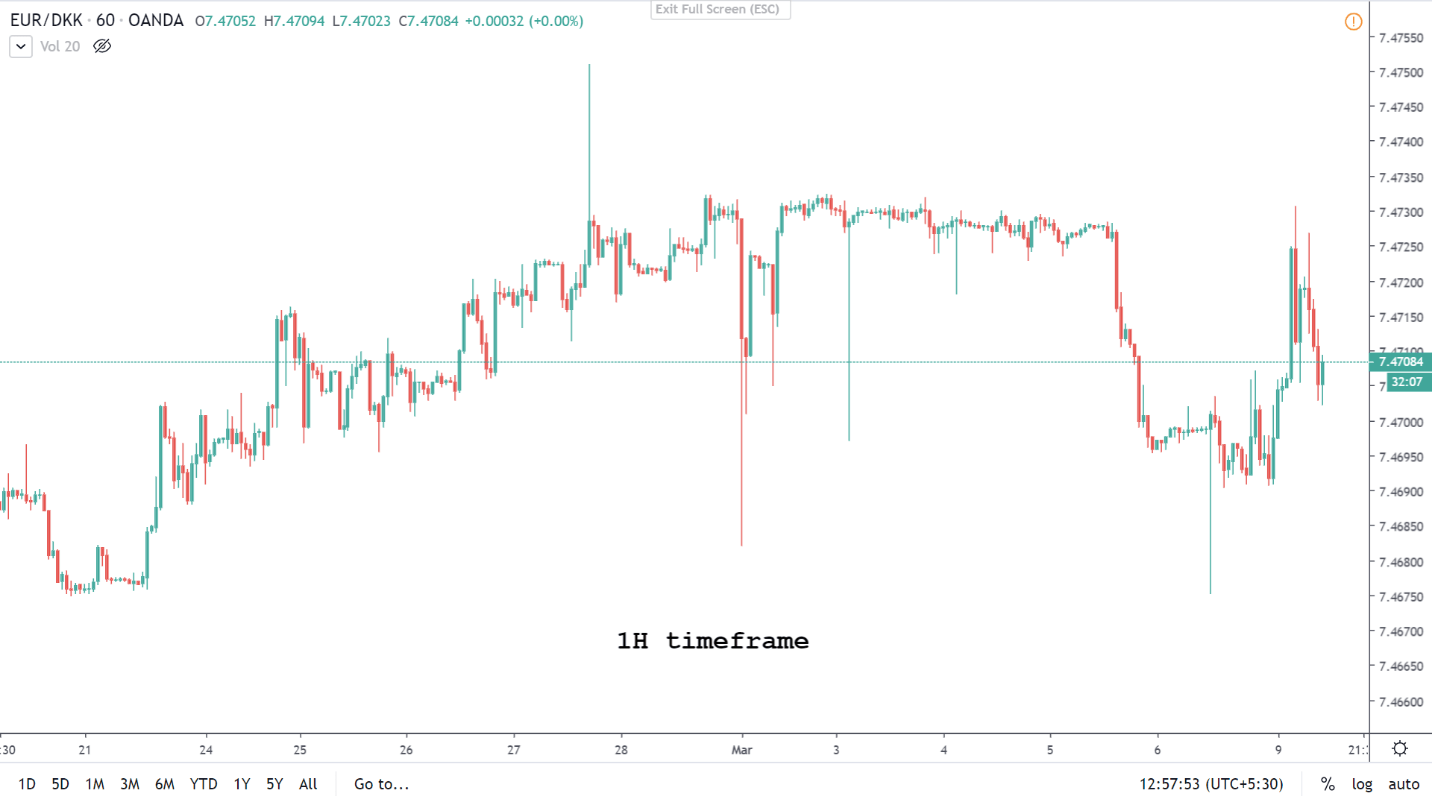
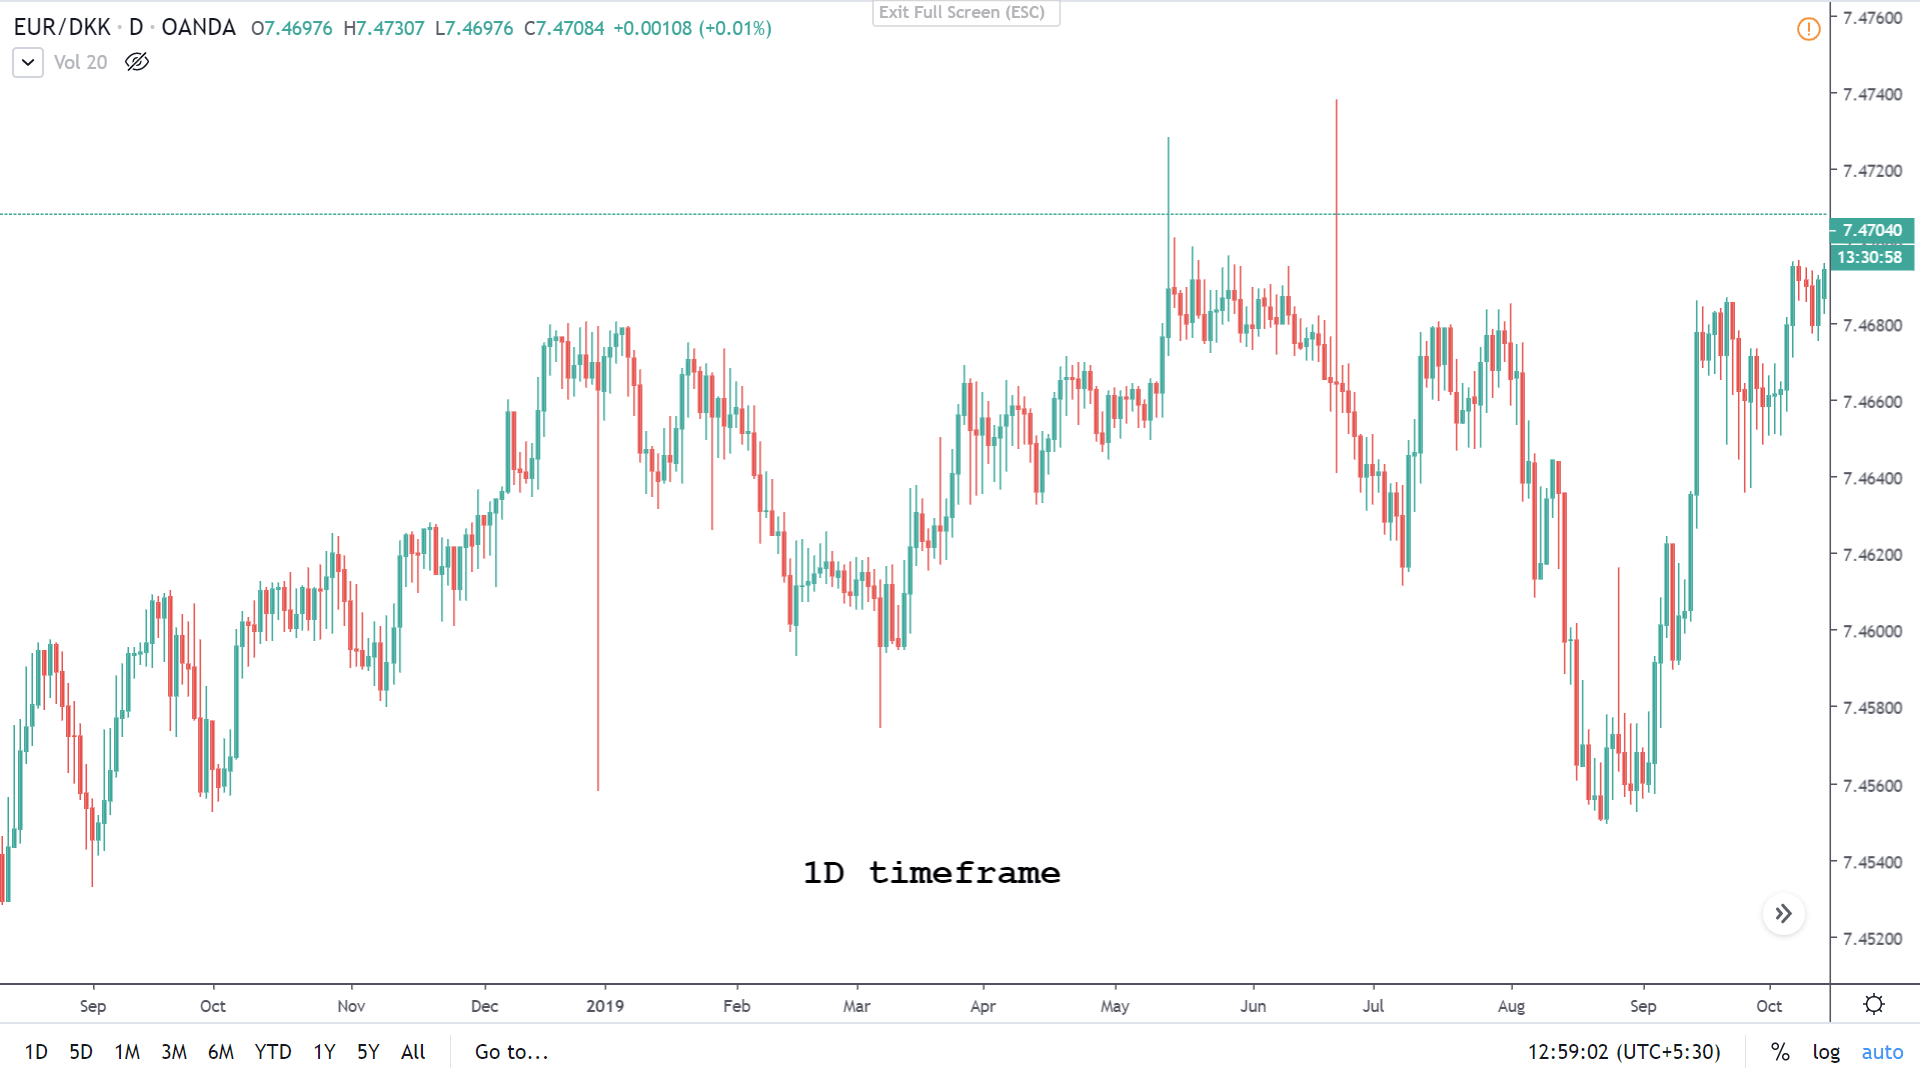
Trading Range in the AUD/PKR Pair
If you observed a currency pair’s price movement, you’d notice the difference in price changes across different timeframes. That is the trading range and is used to determine the volatility of a pair.
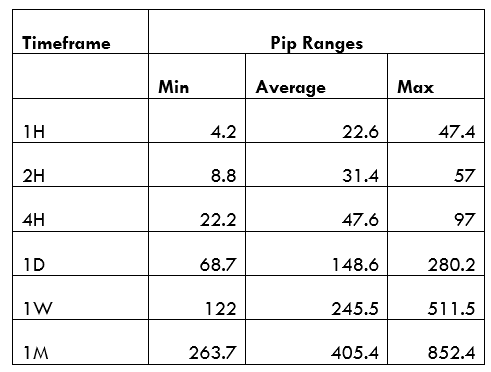
The Procedure to assess Pip Ranges
- Add the ATR indicator to your chart
- Set the period to 1
- Add a 200-period SMA to this indicator
- Shrink the chart so you can determine a larger period
- Select your desired timeframe
- Measure the floor level and set this value as the min
- Measure the level of the 200-period SMA and set this as the average
- Measure the peak levels and set this as Max.
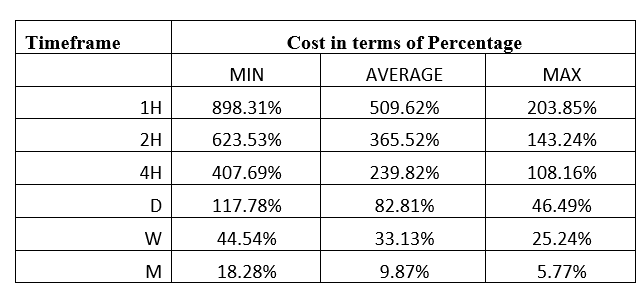
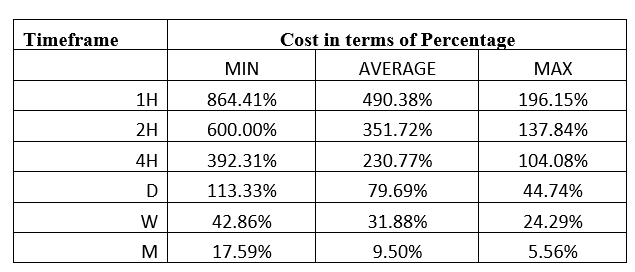
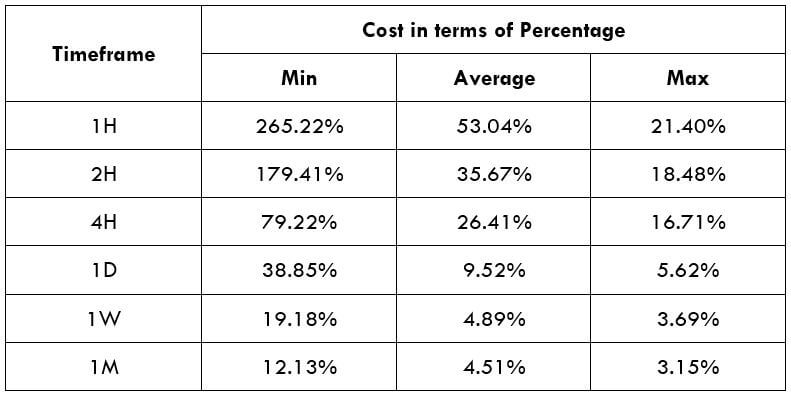
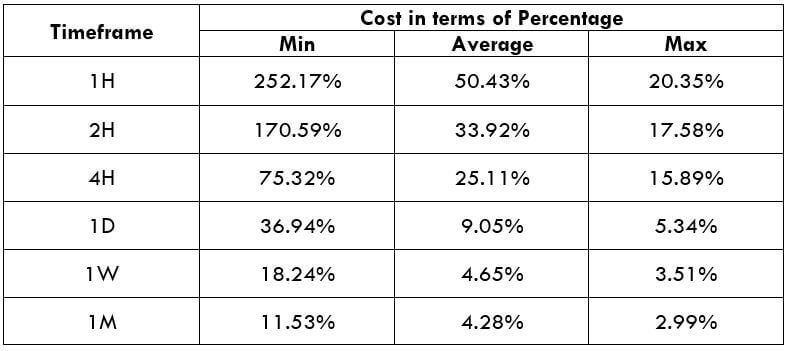
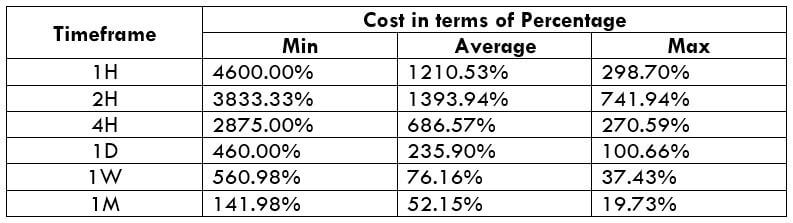
AUD/PKR Cost as a Percentage of the Trading Range
When you combine the total trading costs of a currency pair, you can analyze the percentage costs across different timeframes. This analysis can help you determine the best time to trade a currency pair.
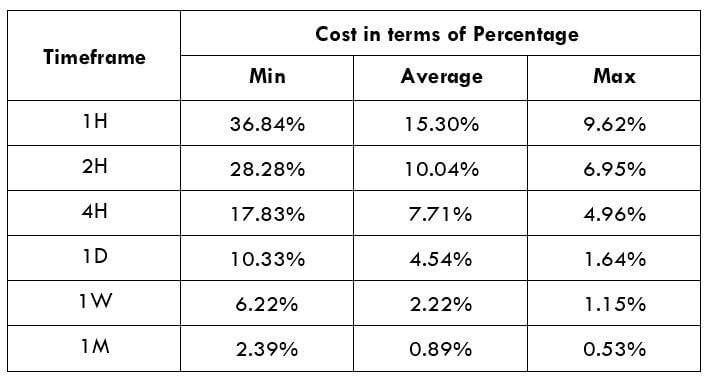
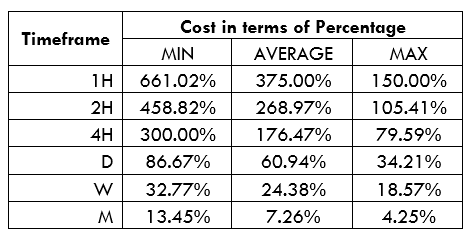
ECN Model Account Cost
Spread = 32 | Slippage = 2 | Trading fee = 1 | Total = 35
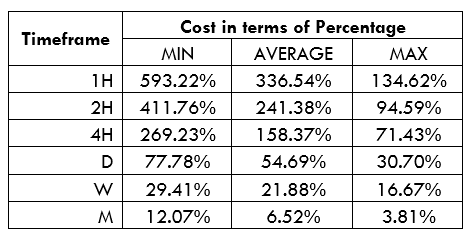
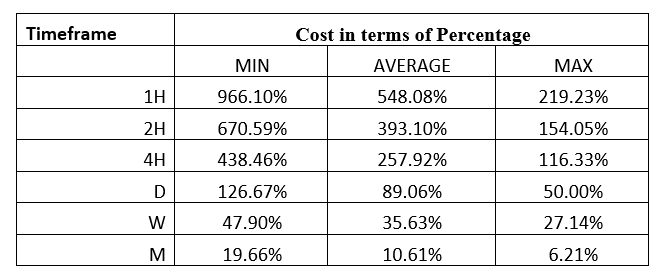
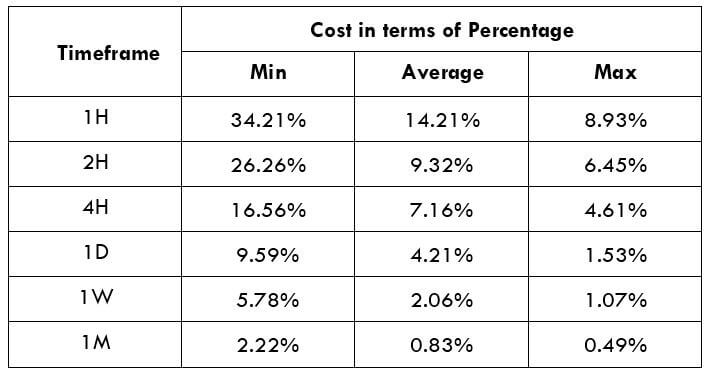
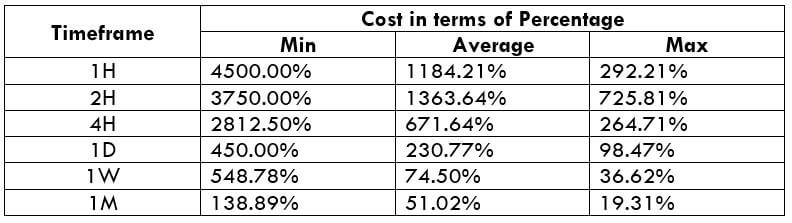
STP Model Account Cost
Spread = 37 | Slippage = 2 | Trading fee = 0 | Total cost = 39
The Ideal Timeframe to Trade the AUD/PKR
As seen above, trading the AUD/PKR pair on shorter timeframes is costlier. In both the ECN and the STP accounts, it is cheaper trading the pair over longer timeframes since the trading costs are lower. Note that the trading costs decrease with an increase in volatility. The lowest trading cost for the AUD/PKR pair is when volatility is at the highest 852.4 pips.
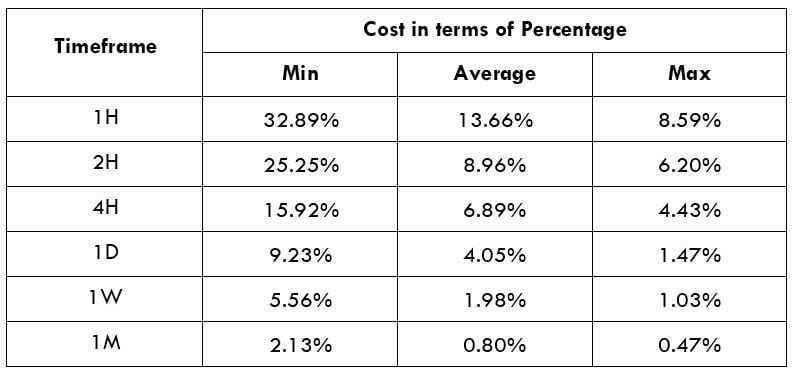
The ideal trading time is evidently on the longer timeframes. But shorter-term traders can open positions when volatility is maximum across 1H, 2H, 4H. and 1D timeframes. Traders can also employ the use of forex pending order types, which eliminate the cost of slippage. Here’s an example with the ECN account.
Total cost = Slippage + Spread + Trading fee = 0 + 32+ 1 = 33
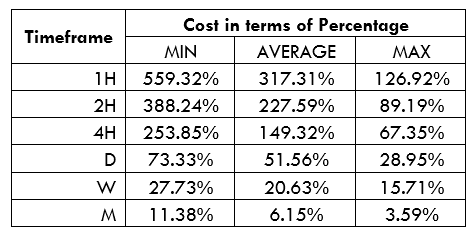
Notice how the trading costs have been reduced across all timeframes when forex pending orders are used. The maximum cost, for example, has reduced from 593.22% to 559.32%.