Categories
Forex Assets

Asset Analysis – Trading The NZD/SEK Exotic Cross Currency Pair

Introduction

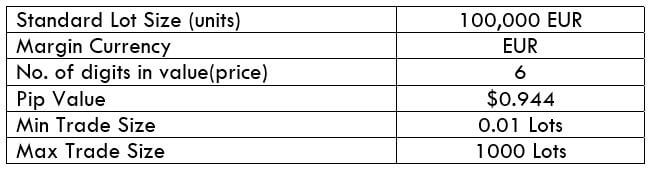
NZD/SEK is the acronym for the currency pair New Zealand dollar versus the Swedish Krona. It is marked under the exotic cross-currency pair category. In this pair, NZD will be the base currency, and SEK will be the quote currency. In this article, we shall understand everything about trading this currency pair.

Understanding NZD/SEK

The price of this pair in the foreign exchange market determines the value of SEK comparable to one NZD. It is quoted as 1 NZD per X SEK. So, if the value of this pair is 5.8296, these many Swedish Kronor (SEK) are required to purchase one NZD.

Spread

Trading the Forex market usually does not involve spending a lot of fees like the Stock market. Here, Forex brokers make profits through spreads. It is nothing but the difference between Bid – Ask prices of an asset. Some broker has the cost inherent into the buy and sell prices of the currency pair; instead of charging a separate fee. Below are the spread values of ECN and STP brokers for the NZD/SEK pair.

ECN: 48 pips | STP: 53 pips

Fees

A Fee is the charges we pay to the stockbroker for executing a particular trade. The fee fluctuates from the type of broker we choose. For example, the fee on the STP accounts is zero, but we can expect a few additional pips on ECN accounts.

Slippage

Slippage is the contrast between the price expected by the trader for execution and the price at which the agent executed the price. There is this variation due to the high market volatility and more passive execution speed.

Trading Range in NZD/SEK

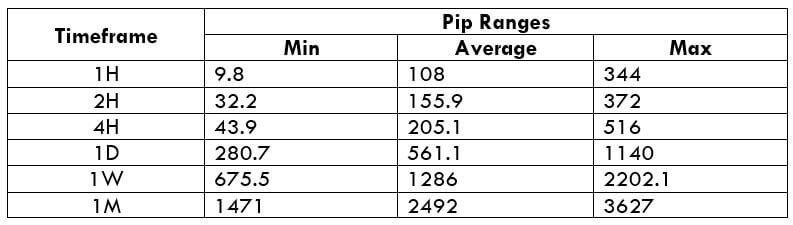
The trading range is used at this point; to measure the volatility of the NZD/SEK pair. The amount of money we will gain or lose in an allotted timeframe can be evaluated using the trading range table. The minimum, average, and maximum pip movement of the currency pair is exemplified in the trading range. This can be evaluated simply by using the ATR indicator combined with 200-period SMA.

Procedure to assess Pip Ranges

  1. Add the ATR indicator to your chart
  2. Set the period to 1
  3. Add a 200-period SMA to this indicator
  4. Shrink the chart so you can assess a large time period
  5. Select your desired timeframe
  6. Measure the floor level and set this value as the min
  7. Measure the level of the 200-period SMA and set this as the average
  8. Measure the peak levels and set this as Max.

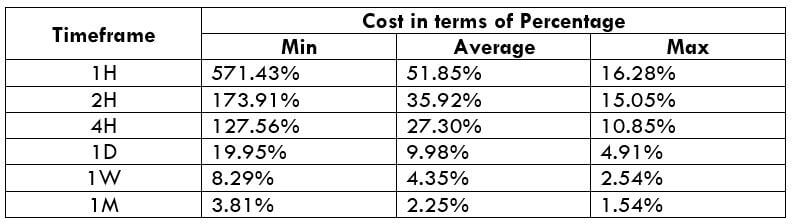
NZD/SEK Cost as a Percent of the Trading Range

The rate of trade varies on the stockbroker and fluctuates according to the volatility of the market. This is because the trading cost includes fees, slippage, and the spread. The rate of variation in terms of percentage is given below.
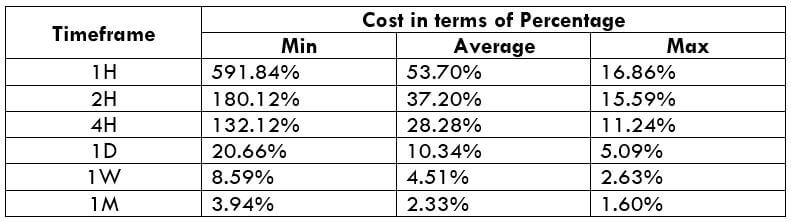
ECN Model Account

Spread = 48 | Slippage = 5 |Trading fee = 8

Total cost = Slippage + Spread + Trading Fee = 5 + 48 + 8 = 61
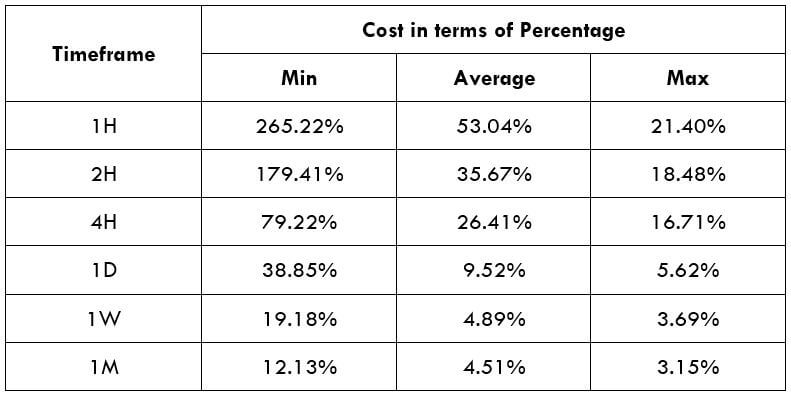
STP Model Account

Spread = 53 | Slippage = 5 | Trading fee = 0

Total cost = Slippage + Spread + Trading Fee = 5 + 53 + 0 = 58

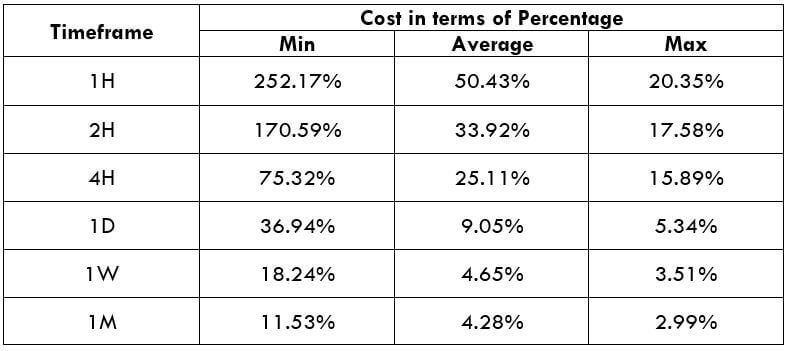
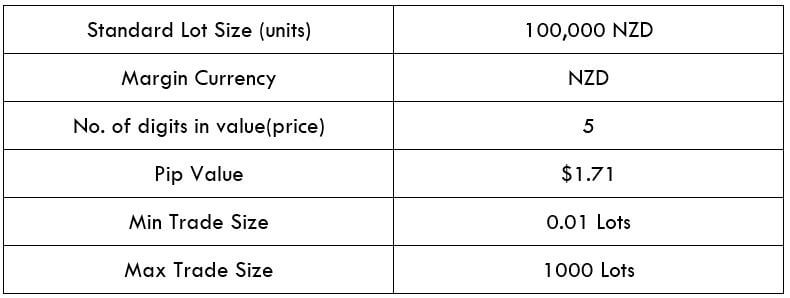
The Ideal way to trade the NZD/SEK

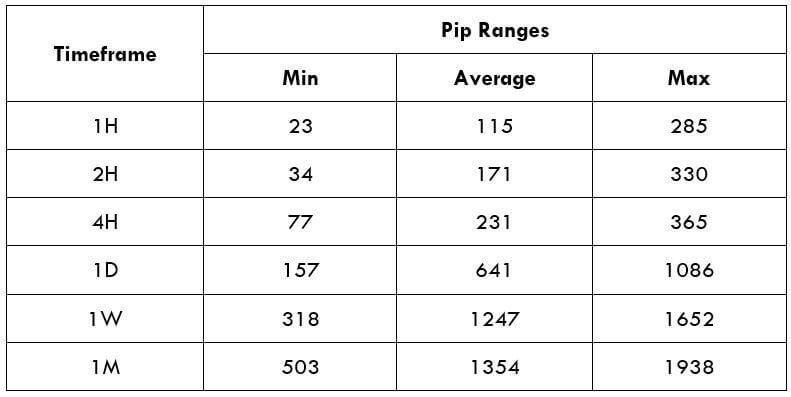
The NZD/SEK is termed as an exotic-cross currency pair and has a low volatile market. Looking at the pip range table, the average pip movement on the 1H timeframe is 115 pips, which implies high volatility. As we know, the higher the volatility, the smaller will be the cost to implement the trade. Nonetheless, this is not a benefit to trading in a volatile market; it involves higher risk.

For instance, in the 1M time frame, the Maximum pip range value is 1938, and the minimum is 503. When we evaluate the trading fees for both the pip movements, we notice that for 503 pip movement fees is 12.13%, and for the 1938 pip movement, fess is only 3.15%. Therefore, from the above instance, we can determine that trading the NZD/SEK currency pair will be on the expensive side.

Categories
Forex Assets

Everything You Should Know About The EUR/SEK Forex Pair

Introduction

EUR/SEK is the abbreviation for the Euro Area’s euro against the Swedish Krona. This exotic-cross currency pair has enough volatility but lacks liquidity. This is the reason this has pretty high spreads. In this pair, EUR is the base currency, and SEK is the quote currency.

Understanding EUR/SEK

The market price of EURSEK as a whole determines the value of SEK that is required to buy one euro. It is quoted as 1 EUR per X SEK. For example, if the value of this pair is 10.5839, then this amount of SEK is required to purchase one EUR.

EUR/SEK Specification

Spread

The difference between the bid price and the ask price is called the spread. This value is different from one ECN and STP accounts. The approximate values of the same are mentioned below.

Spread on ECN: 50 pips | Spread on STP: 55 pips

Fees

The fee is simply the commission paid for the trade. This, too, depends on the type of execution model used by the broker. The fee on ECN accounts is a few pips, while it is nil on STP accounts.

Slippage

The slippage is the difference between the trader’s intended price and the broker’s executed price. There is this difference because orders are executed by the ‘market.’ The two main reasons for slippage to occur include, broker’s execution speed & Market volatility.

Trading Range in EUR/SEK

With the values in the trading range, which depict the pip movement in different timeframes, we can determine the gain or loss that is possible on trade.

These values are obtained by combining the moving average with the average true range indicator. A complete procedure to get it into your charts is given below.

Procedure to assess Pip Ranges

  1. Add the ATR indicator to your chart
  2. Set the period to 1
  3. Add a 200-period SMA to this indicator
  4. Shrink the chart so you can assess a large time period
  5. Select your desired timeframe
  6. Measure the floor level and set this value as the min
  7. Measure the level of the 200-period SMA and set this as the average
  8. Measure the peak levels and set this as Max.

EUR/SEK Cost as a Percent of the Trading Range

Firstly, the total cost is calculated by finding the sum of the spread, slippage, and trading fee. And this cost varies as the volatility of the market changes. Below is a table that represents the cost variation for EURSEK for both ECN and STP accounts.

ECN Model Account 

Spread = 50 | Slippage = 3 | Trading fee = 3

Total cost = Spread + Slippage + Trading Fee = 50 + 3 + 3 = 56

STP Model Account

Spread = 55 | Slippage = 3 | Trading fee = 0

Total cost = Spread + Slippage + Trading Fee = 55 + 3 + 0 = 58

Note: The costs may seem high because of the Spreads. As we know, these Spreads keep changing from time to time. At times we have seen the spreads for this pair being as low as 10. But we have considered the maximum spread to give you the maximum cost percentages.

The Ideal way to trade the EUR/SEK

From the trading range table, we can clearly see that the volatility in this pair is pretty high. However, this does not mean that it cannot be traded.

Coming to the next two tables, the percentage values are within the 600% mark. Note that the higher the value of the percentages, the higher is the cost. The opposite holds true, as well. Since the percentage values are high in the min column, we can conclude that the costs are high when the volatility of the market is low.

Now, to have a balance between the costs and the volatility, one must trade during those times when the volatility of the market is around the average values in the trading range table.

Moreover, there is a way through which we can nullify the slippage on the trade. This can simply be done by placing orders using ‘limit’ instead of ‘market.’ In doing so, the total cost will reduce by a decent amount.