Categories
Forex Course

208. Using Yuppy (EUR/JPY) As A Leading Indicator For Stocks!

Introduction

EUR/JPY is among the most popular pairs in the international foreign exchange market. In fact, it indicated approximately 3% of the overall daily transaction. Moreover, it is indicated as the seventh-highest traded currency pairs in the forex market. Both traders and investors can leverage the potentials of the EUR/JPY currency pair as they both carry a high degree of volatility.

Best Time To Trade in EUR/JPY

Although you can trade EUR/JPY at any time of the day, to leverage the most benefit, you must trade when the pair is most volatile. Between 7:30 and 15:30 is the time when the currency pair trade is the busiest.

Factors Impacting EUR/JPY Rate

When it comes to making the most lucrative trade with this pair, it is important to understand what influences its rate.

Prominence Of EUR

Like many modern currencies, the prominent factors that impact the Euro price flow are financial, political, and economic. For instance, many trade decisions regarding the Euro are backed by the European Central Bank’s monthly reports.

These reports can influence the fluctuations in the Euro’s rates, and traders and investors promptly leverage the details as quickly as they are released to determine the flow of the Euro rates.

In economic terms, news releases focusing on employment can also play an important role in the fluctuations of euro rates. These details are easily accessible and offer vital insights into the economic condition of the Euro and the movement of Euro prices.

The Prominence of JPY

Japan’s economy has more factors that play an important role in determining the flow of currency. The basic health of the economy will play a significant role in involving a high rate of export and import trading. One uncommon factor that impacts the flow of the country’s currency is situations such as a natural disaster.

The Right Way To Trade EUR/JPY

In terms of speculative trading, CFDs provide traders and investors with easy access to a plethora of markets. They like to transact with CFDs as derivatives trading implies that buying the actual currency is unnecessary. When trading, investors and traders like to harness technical analysis and assess the EUR/JPY chart. This is done to determine the relationship of the pairing and forecast the highs and lows of the markets.

[wp_quiz id=”102014″]
Categories
Beginners Forex Education Forex Assets

Adding a Currency to Your Trading Scope – The Singapore Dollar

A common approach to forex when traders begin their trading for the first time is to focus on one asset. Cryptocurrencies are a popular choice even though not a good pick because of many factors, one being this is still not a developed market. Many books, videos, bankers advice, and mentors suggest the EUR/USD to start with, without any good reason. Liquidity is not an issue if a broker has at least a few liquidity providers, so the EUR/USD pair as the most liquid asset on the forex is not offering any real advantages even in this area.

If we take a look at the two economies, it gets complicated. The US economy, politics, and dominance create so many possibilities to surprise your trading strategies in a bad way. And the EU economy is also somewhat unpredictable to follow with so many countries. Yet beginner traders are attracted to this pair thinking it is “safe”, easy, and because “everybody is trading it”. Our previous articles describe this pair as one of the worst you can pick, mostly because of the proven contrarian trader concept. Then there is another extreme, although rare, to go with an exotic currency pair with increased volatility. We have also presented our opinion on exotics in a separate article.

According to contrarian traders, you should go will all the majors and their crosses but avoid the popular EUR/USD and GBP/USD if there is a similar trading opportunity. This way you can fine-tune your system, plan, and mindset on various playgrounds ultimately giving you versatility. Now, as you develop, expanding the scope where you trade becomes a rewarding endeavor. But it does not come without caution. How we approach this expansion is described by a technical prop trader we are going to present in this article, using the Singapore Dollar example. 

The market during most of 2019 was flat, forex had a very low activity which can be seen just by looking at the VIX, EVZ, and other Indexes that measure volatility. In this environment, it is hard to get a relevant trading sample test with the asset you want to include in your trading array. So what you might think as good before, comes to be a very bad choice once the markets return to normal. Beginner traders are not always informed about the market stages and might go into volatile, less developed, even experimental assets such as the alternative crypto market.

A similar approach before the crypto age was when traders would often go with the penny stocks trading. When a prop trader wants to see if his system is working on a new asset, testing is a must. When the forex market is flat, testing in such an environment does not reflect normal conditions. Now, in 2020 we have another abnormal condition caused by the pandemic and extremes in the state/central banking stimulus. However, whenever there are trends to follow and capture profits from, it is good enough for signals to generate and test new assets. 

Testing involves a few stages depending on how thorough you want to be. Of course, investing more time with testing will give you more reliable data but at one point you need to decide if the results are good enough. Some currencies can have special drivers and chart characteristics we may or may not spot from testing alone. Forward testing on a demo account is an unavoidable phase after backtesting. If we want to add SGD, we can start with one pair, such as USD/SGD. After favorable forward tests, we add other combinations of the SGD, if available by the broker to test the currency and expand our trading scope. Since we aim to build a universal technical trading algorithm if you follow our structure example, there are no opportunity limits, all assets are viable. Professionals have an idea of what asset they are looking at, not all are equally interesting, therefore they scan what could be a good fit for their trading system. Trend following systems needs the volume that drives trends, without too many factors a trader cannot control (risk) and a chart with minimal whipsaws, among other, less important considerations. 

Consequently, Singapore Dollar could be a good choice. The SGD is not a currency that “drives the bus”. It is not dominant in the price move, as one prop traders describe it – it is a blank canvas. In the long term and even in the midterm, it will be the other currency that moves the price you are pairing with the SGD. As for the news impact, they almost do not have any effect on this currency. When you look at the reports, the Singapore economy is a good all-arounder most of the time. Singapore is the banking hub for most of Asia and the number one banking hub for the whole world right now. A bad manufacturing report in Singapore does not have any significance, as it turns out on the price change too. The economy is not based on manufacturing here and according to some research, even the GDP report does not have a big impact too.

Our prop trader is very interested to test currencies and markets like this, it all favors his technical trading system specialized in trend following. Now we could take other countries with similar characteristics, a few of them, but then liquidity might be a big question mark. Most of the time countries, their economy, and the currency might seem a great pick if we take all the above factors into account. But this particular currency might not be traded enough to have the liquidity we need. We do not need super-liquid pairs like the EUR/USD, but enough so we do not have uncontrollable risks caused by low liquidity on the market expressed as gaps, slippage, extreme spikes, crashes, whipsaws, and so on.

The Singapore Dollar is heavily traded, it has the liquidity, USD/SGD even has more liquidity than some of the minor pairs out of the major 8. This means we do not see whipsaws that cut the trade we have opened yesterday on a daily timeframe. Some observations conclude that SGD pairs either move smoothly or do not move much, enough to trigger our volume or volatility filters. Such movements are easily followed, ensuring high probability trades just because of the currency’s typical behavior. According to our prop trader, the only pair that is a bit jumpy is the CAD/SGD while other major combinations with the SGD are smooth. 

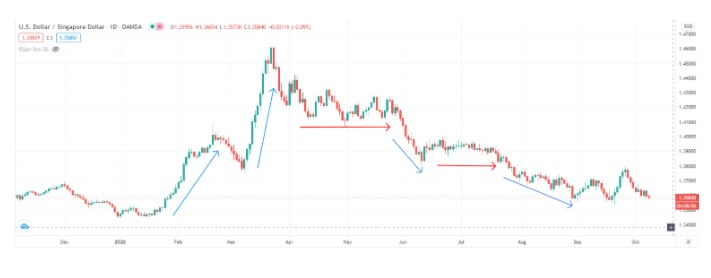
The picture above is the USD/SGD daily chart with smooth trends followed by clear flat periods even during the pandemic shock starting from march 2020. 

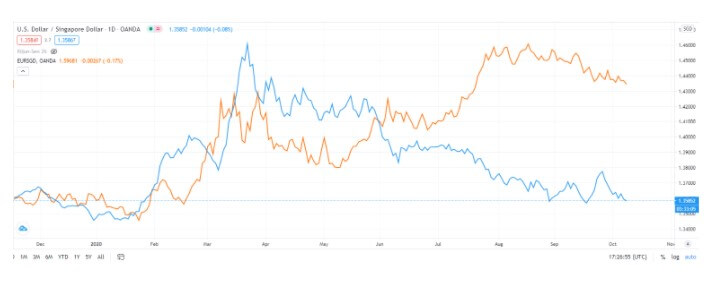
A few areas of caution, by looking at the other charts, you may think SGD pairs correlate. This may seem like a possibility but by looking at a zoomed out chart you will conclude pursuing signals out of correlation is not effective. The picture below is EUR/SGD (orange line) and USD/SGD (blue line) is showing mostly positive correlation until July 2020 when it became negatively correlated and then back again later. 

Correlations are hard to use in trading according to the experience of prop traders. Even if you notice a correlation, be it accidental or fundamental, the move should reflect in your trading system anyway. Trying to predict the movement of one asset just after another moved in the opposite direction is a hardly effective strategy. As described in our article about correlation, it is a good idea to ignore this type of analysis. 

Another factor traders might consider when looking for a new trading asset is the spread. Unless you are following a very high-frequency scalping strategy, the typical spread amount should not count as a criterium. It is a common misconception to trade nominally tighter spread currency pairs. Tighter spreads will give you a bit more if you are trading on an hourly chart, for example, although on the daily chart the spread is mostly marginal relative to the potential gain. Only highly illiquid exotic pairs have wide spreads and only on certain events. The spread dynamics during the day are not known unless measured, and rarely anyone measures it. An unaware trader can decide to trade some asset or pair just because the spread at that moment was tight, not knowing it can widen multiple times and trigger the Stop Loss. Optimal daily timeframe strategy will unlikely be affected in this way, however, the spread should not be a deciding factor in any case.

Aside from spread dynamics, which can also be dependent on the broker liquidity providers, traders also commonly forget to measure the volatility to spread ratio. Volatility is easy to measure with the ATR indicator. Now, comparing the ATR to spread ratio across assets can give us an approximate spread influence on our trades. Some currency pairs have higher spreads and lower ATRs, while some other pairs can have similar spreads but very high ATRs. NZD/CHF might have 3 pip spread but the ATR of 47 pips, meaning the spread percentage is about 6%. This percentage is one of the worst out of the 28 major currency pairs and crosses. High-frequency trading strategies on lower timeframes might have some use out of this analysis by choosing currency pairs with the best ratio (low spread with high ATR). Although if you trade on a daily chart using our algorithm structure and plan, it is completely redundant. 

Do not concern yourself with the spread, including on your search for a new currency or asset to trade. ATRs on the SGD pairs might not be very high compared to other pairs and the spread might not be as good. Still, daily timeframe traders should not care about this. If you have some criteria to trade only when the spread is lower than 3 pips, for example, missing out on a 150 pip trend because of 3 pips is a foolish decision. On the other hand, if you just randomly pick assets to add to your trading scope, you will probably find out your system cannot be as effective. Do your backtesting and then a good sample of forward testing. If the results are good, nothing is stopping you to reap the extra rewards.

To conclude, keep in mind the economy of the country behind the currency, how sensitive it can be on news events, how the charts look, is the currency liquid enough. In the next few articles, we will be covering how you can translate your forex trading system, adjust it If needed, and apply it to other markets. The Singapore Dollar is a good choice if you are looking into exotics, but it is rarely considered by traders. Currently, the SGD daily charts look smooth even during the pandemic and could even be a better choice than a pair with the majors only.

Categories
Beginners Forex Education Forex Assets

How to Choose a Currency Pair for Trading in Forex

Two mistakes that a lot of new traders make is to simply select a random currency pair to trade or to try and trade too many different pairs at once. An important thing to do when first starting out is to decide which currency pair you want to trade with, you can, of course, change this decision in the future or to pick up multiple other currencies once you have a bit of experience. However, that initial first currency pair can make a big impact on your trading. This is why we are going to be looking at how you can choose that first currency pair that you are going to trade.

Before we select the pair that we are going to be trading, we need to actually understand what a currency pair is. The currency pair is what it sounds like, it is simply a quote of two different currencies. There is the base currency which is the first currency listed so in the EURUSD pair, it would be the EUR, the quote currency pair is the second currency, so again for the EURUSD pair, it will be USD. The quoted figure is the current exchange rate of the base currency for the quote currency. For example, for the EURUSD it may be 1.11 which would mean that you get 1.11 USD for each Euro traded.

When first starting out with trading, it is recommended that you select one of the major currency pairs. This is for the simple reason that the amount of volatility is lower and the amount of liquidity is higher, this offers a much safer trading environment with less violent price movements than some of the minor or exotic currencies. Some of the major currency pairs to think about have been listed below along with some of their main characteristics, to give you an idea of what is involved in them and how they may behave.

EUR/USD

This is the world’s most traded currency, this currency pair has the highest level of liquidity out of any of the available currency pairs. Due to this, it is also one of the most stable. While it does have a lot of large trends, moving large distances, it does this at a slower pace, never jumping too far with a single tick. Many describe this pair as one of the safest pairs to trade due to it having the lowest spreads of all currency pairs. This pair is most active during the European and American sessions and can have some added volatility when there is news within the Eurozone and the United States.

USD/CHF

The US Dollar against the Swiss Franc, this pair often moves the other way to EURUSD, it has smaller movements with very few large jumps and often has a small spread making it one of the safer currencies to trade. The Swiss Franc is a safe haven currency which means that when there is a crisis or economic drop, it can also go down in value, this pair is active during both the American and European sessions.

GBP/USD

This used to be quite a safe pair to trade, but now with Brexit happening it is a little less predictable. There is still hope that once the Brexit saga is over that it will return to its old steady self. It is still incredibly popular for traders due to its increase in volatility and profit potential. It can have slime huge movements which are perfect for trend traders but also have a lot of breakouts as well as false breakouts which can catch people out. This pair reacts a lot to events in Britain and is most traded during he European and American sessions.

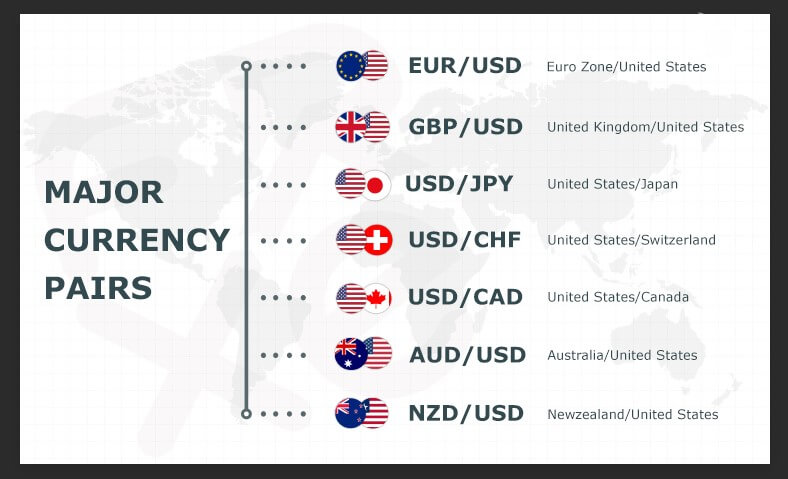
Other pairs include things like the USDJPY, USDCAD, AUDUSD, and NZDUSD, those are the other major pairs. Generally, they will have lower levels of volatility than the minor pairs but can still react quite a lot to major news events. They are often good for trend trading as they can have long drawn out movements rather than large and quick jumps.

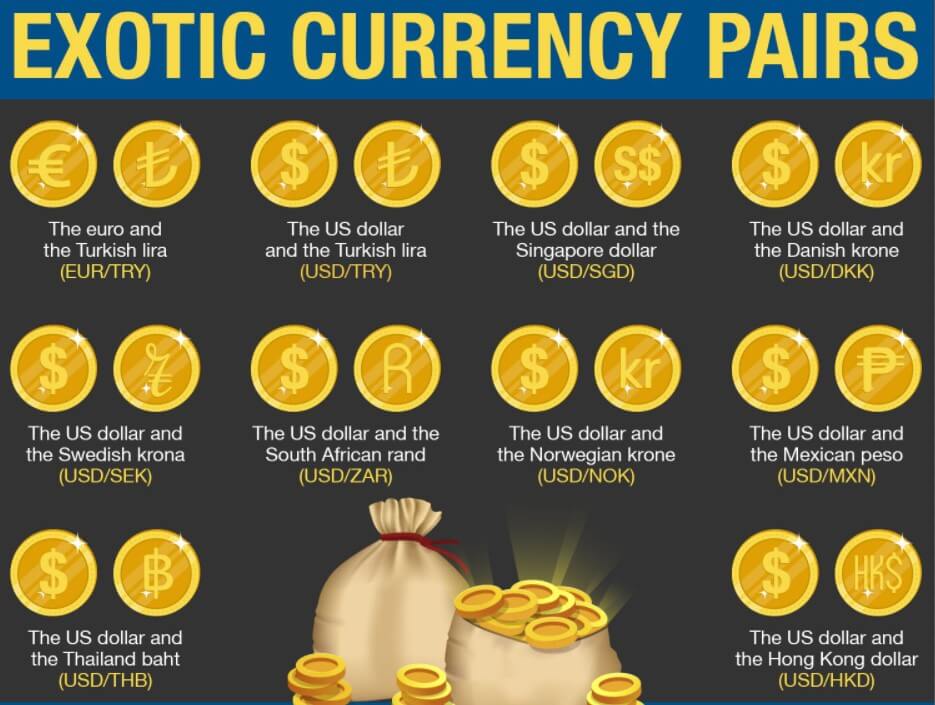
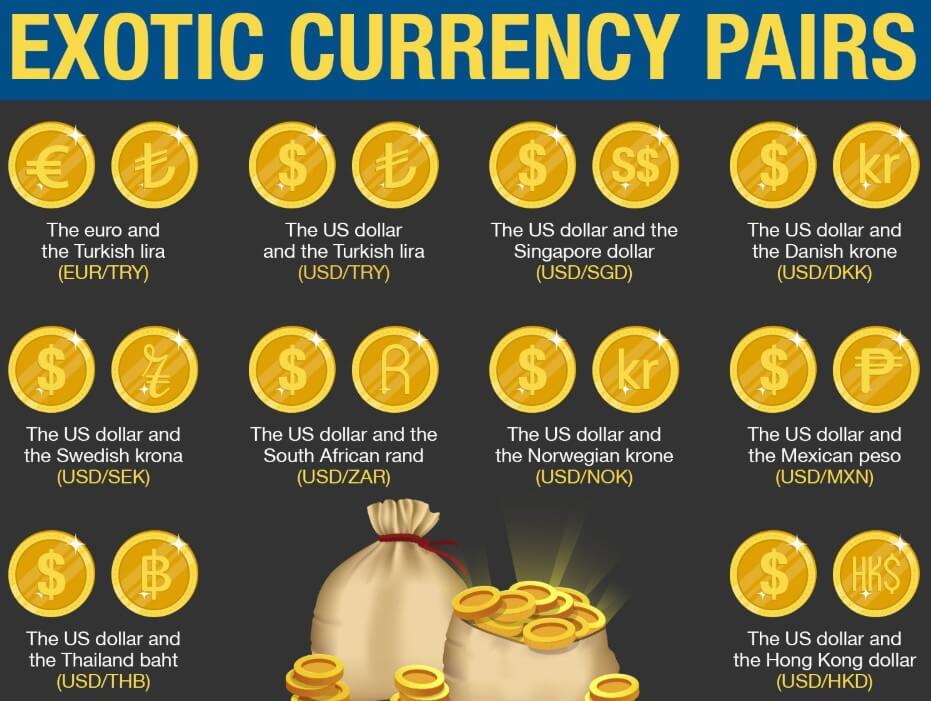
The minor pairs include things like EURJPY, GBPJPY, EURGBP, EURCHF, GBPCHF, EURCAD, and GBPCAD, these pairs can have some added volatility to them and so are often not recommended for new traders. Instead, stick to the major pairs to start. The Exotic pairs include things like USDZAR, USDMXN, USDTRY, and USDRUB. The liquidity on these pairs are lower so you cannot make as larger trades at once and they can also jump about a lot which can make them very profitable, but also very dangerous which is why they are not recommended for beginners.

We mentioned above that it is recommended that you only trade with a single currency pair to begin with, this allows you to concentrate fully on that one pair. It also means that you are able to learn more about the way that the currency pair moves, allowing you to better analyze and trade it. You can branch out afterward, but we recommend learning all that you can about one before you try looking at another. You do not want to get confused and to mix up the characteristics of different pairs as this can lead to a series of losses.

In order to select the pair that you want to trade, you will need to look at a few things. The first is the strategy that you are going to be using. Some pairs are better for longer-term trading and others for the short term. If you are a scalper then you want a pair that has more volatility. If you are a trend trader, then you want one that goes on larger and longer movements over time. You also need to consider the time that the pair is most active. If you are from the Uk, then there is no point in trading a currency pair that is most active in the middle of the night, instead of one that works for the time that you will be up and that you will be free. 

You should also consider the spreads. Different pairs have different spreads. If you are looking for short-term trades or to scalp, then we would not recommend getting a currency pair with a larger spread. This will make it very difficult for you to make a profit, so instead, you would need to go for one with a small spread. This doesn’t matter quite as much for trend traders, but it is still worth considering the impact of the cost of a currency pair when looking at your potential profits.

So those are some of the things that you should think about when you are selecting a currency pair to trade. Think about your strategy, the costs, and when you are available to trade, then think about the characteristics of the different pairs. Work on one pair at a time until you have a good understanding of it and then move on to your next one. Don’t try to do too much at once and you should get on just fine.

Categories
Forex Assets

Which Currencies Should I Be Trading With? The Secret to Asset Selection…

One of the most common mistakes made by some Forex traders is not to understand that, correctly deciding with which pairs to make trades, and in which direction, is 90% of the battle to make profits. Unfortunately, many traders focus on trying to perfect the entry methods, not realizing that if you pick correctly what you’re going to upload today, for example, then the exact input method used will not cause a noticeable difference in your trading results. You can become an expert in selecting entries in the 5-minute chart, but if you do not choose with which to trade with a broader perspective, and in the longer term, will be of little use to you. Why do some traders frequently make this mistake, and how can they choose the currency pair with each day in a smarter way?

Why Traders Do Not Consider Pair Selection Carefully

Most traders are eager to start making a lot of money. The way to make a lot of money quickly, as they are told, is trading with shorter deadlines – this is true, at least in theory. Traders realize that some currency pairs have lower spreads (such as EUR/USD) and think they should choose those low spread pairs to make trades and save costs. Another very common reasoning is that it makes sense to trade with currency pairs that are most active during the trader’s preferred trading hours. An additional argument says that each currency pair has its own “personality” and one must gain a lot of trading experience with few pairs to get to know their personalities, and thus make trades more successful.

These considerations are rational and true, at least to some extent. The problem is that they are far from being the most important consideration that should influence the choice of currency pairs for trades. I learned this a few years ago when I decided I would do full-time trades focusing on the EUR/USD and GBP/USD pairs. For several months, these two pairs barely moved, while USD/JPY took off like a rocket and provided easy money to anyone who made trades with it. Of course, I knew very well the personalities of EUR/USD and GBP/USD, I had a great strategy that had worked very well in these pairs for years, and their busiest hours fit precisely in the time zone of my geographical location. Despite all this, my linear thinking made me miss the only real trading opportunities of 2012, which came in pairs and crosses of JPY.

Factor #1 – To Decide Which Pair(s) To Make Trades With

So how should one decide with which currency pair or pairs to trade? I’m going to use an analogy with the gaming world to simplify the subject: Let’s say you go to a casino to play a game where you need other players to risk money at the table to give you the chance to make a profit, I mean, your profits will come from your losses. This is a good comparison with the Forex market, which works the same way. So, which table would you go to? The busiest, with more players and more money at the table, or a quiet one on The corner with just a couple of players? Normally, it would make more sense to choose the table with more players. So why trade in foreign exchange be different? What you want is to be doing trades with the “busiest” currencies at any given time, you want to be where the stock is. Is there any way to determine that? Well, you could try reading the financial news to spot the biggest things that are happening on the market at any time. There is a place for that, but there are easier ways that can tell you where to start focusing your search.

Although Forex trading does not have reliable centralized volume data, there are reliable statistics that tell us that currencies participate in more trades, that is, that currencies are exchanged in larger volumes. Most importantly, today, about 70% of all Forex trades are made between the US dollar, the euro, and the Japanese yen. The pound sterling and the Australian dollar represent a further 10 percent. The US dollar is by far the most dominant of all these currencies, so it is quite reasonable to focus on each of the other currencies against the US dollar. You don’t need to open the trading platform and worry about 80 pairs and crosses or wonder if the Canadian dollar/ Swiss franc is what you should include in your trades today. It’s almost certainly not, and if you ever hear someone telling you about a level of support or resistance in a couple of currencies like that, it’s good to ignore that person – no one is looking at that pair or their levels!

Reducing the Options

Now that you know it’s only worth looking at a few currency pairs, you’ll find it much easier to know which ones participate in trades any day. The method to be used to answer this question is to answer which of these currency pairs is likely to have the highest volatility? It needs volatility, because if the price doesn’t move, how is it going to make money? It is almost mandatory to buy and sell at the biggest price differences you can find, to receive the highest possible profits. There are some ways to predict where market volatility is likely to be, and if you apply the methods I describe below, you should get some good answers.

The first thing we need to find out is that by statistic, in the markets, volatility is “clustered”. Suppose that the average daily range of a currency pair is a movement of 1% of its value, taken over several days. Suddenly, one day it moves 3% of its value. Volatility clustering research conducted by data scientists like Benoit Mandelbrot tells us that this pair is likely to move by just over 1% tomorrow, most likely actually by about 3%. Therefore, when a currency pair is seen to move for more than its average volatility, that high volatility is more likely to continue to be reversed in the short term. Another method we can use is to calculate the average real range (ATR) of the last 5 or 10 days for GBP/USD, EUR/USD, and USD/JPY and to calculate these values as percentages of the price of each pair from the beginning of the period. Whoever has the greatest value, is probably the pair on which it makes sense to focus tomorrow.

Another crucial factor is the trend, or impulse (they are essentially the same thing). Major currencies, such as the US dollar, the euro, and the Japanese yen, have shown in recent years a greater likelihood of moving in the direction of their long-term trends. A good rule of thumb in trading major currency pairs is to ask is What is the lowest or highest price than 3 and 6 months ago? and make trades in most or in full in the same direction as any long-term movement, if any.

If you trade only in the course of Asian trading hours, you are likely to find that your best chances will involve Asian currencies such as the Japanese yen and the Australian dollar. It is advisable to consider whether one can develop a method to do trades on longer time horizons, as otherwise, one could be missing out on other opportunities while asleep, just as I missed out on opportunities in USD/JPY in 2012. If I had the wisdom to trade with the daily graphics at that time, I could have taken advantage of that great move in the Yen very easily, even at night while I was asleep, with the traders in Tokyo doing the heavy lifting for me!

Finally, if you look at an economic calendar to see when major central bank announcements or the most important economic data for major currencies are scheduled, you can see that if you are in a trade before those releases, They could give you the volatility that is necessary to transform your trade into a big winner, or at least show you where volatility is most likely to appear.

Therefore, it is good to limit one’s approach to major pairs and to make trades with currencies that show the greatest volatility, and see where are the greatest trends in the long run. This will give you the optimal opportunities to be profitable in Forex trading.

Categories
Forex Basic Strategies Forex Daily Topic

Trading The Forex Market Like A Pro Using The Williams %R Indicator

Introduction

In the forex market, the Relative Strength Index (RSI) is the most sought after technical indicator for measuring overbought and oversold conditions in the market. However, there are times when RSI can give misleading signals. To overcome some of these limitations of RSI, we use William’s %R (Williams Percentage Range) to help us identify when an asset is oversold or overbought.

Having determined that the asset has moved too much in one direction, we can position ourselves on the other side of the market after suitable confirmation. In today’s article, let’s discuss a strategy based on William’s %R indicator to identify when the market has become overbought or oversold. Let us first get into the specifications of the strategy.

Time Frame

The strategy works well on higher time frames such as ‘Weekly’ and ‘Daily.’ Therefore, the strategy is suitable for swing and long-term traders.

Indicators

We use the following indicators in the strategy:

  • William’s %R
  • Simple Moving Average (standard setting)

Currency Pairs

The strategy applies to all currency pairs listed on the broker’s platform, including major, minor, and exotic pairs. This is one of the distinguishing features of the strategy.

Strategy Concept

The William’s %R indicator usually ranges between 0 to -100, where a reading of 0 to -20 tells us that the asset is overbought. On the other hand, if %R falls in the range of -80 and -100, the asset is said to be oversold. As with other technical indicators, %R generates accurate trading signals when used in conjunction with other analytical tools such as chart patterns and systems.

Just because an asset may appear overbought and oversold based on the %R, this doesn’t necessarily mean that the price will reverse. Hence, we include a few concepts of the chart pattern and price action to confirm that the reversal is real. The more we wait, the higher the confirmation. But this reduces the risk-to-reward (RR) ratio moderately. This depends more on the type of trader if he is more conservative or aggressive.

In the strategy, we firstly establish a trend that is mostly in the overbought or oversold situation. This means William’s %R should indicate an overbought situation of the market for a major part of the trend during an uptrend. On the other hand, in a downtrend, William’s %R should indicate an oversold market situation for a major part of the trend. When the trend remains in the overbought or oversold condition for most of the time, the reversal tends to be sharp in nature.

This is why the above condition is important for the strategy. Next, we wait for the ‘Bullish Engulfing’ pattern to appear on the price chart, in a reversal of a downtrend. Likewise, in a reversal of an uptrend, we wait for the ‘Bearish Engulfing’ pattern to appear on the chart. This is the first sign of reversal. The reversal is confirmed when the price starts moving above the moving average, in a downtrend, and below the moving average, in an uptrend.

Stop-loss for the trade will be placed below the ‘engulfing’ pattern in a ‘long’ position and above the ‘engulfing’ pattern in a ‘short’ position.

Trade Setup

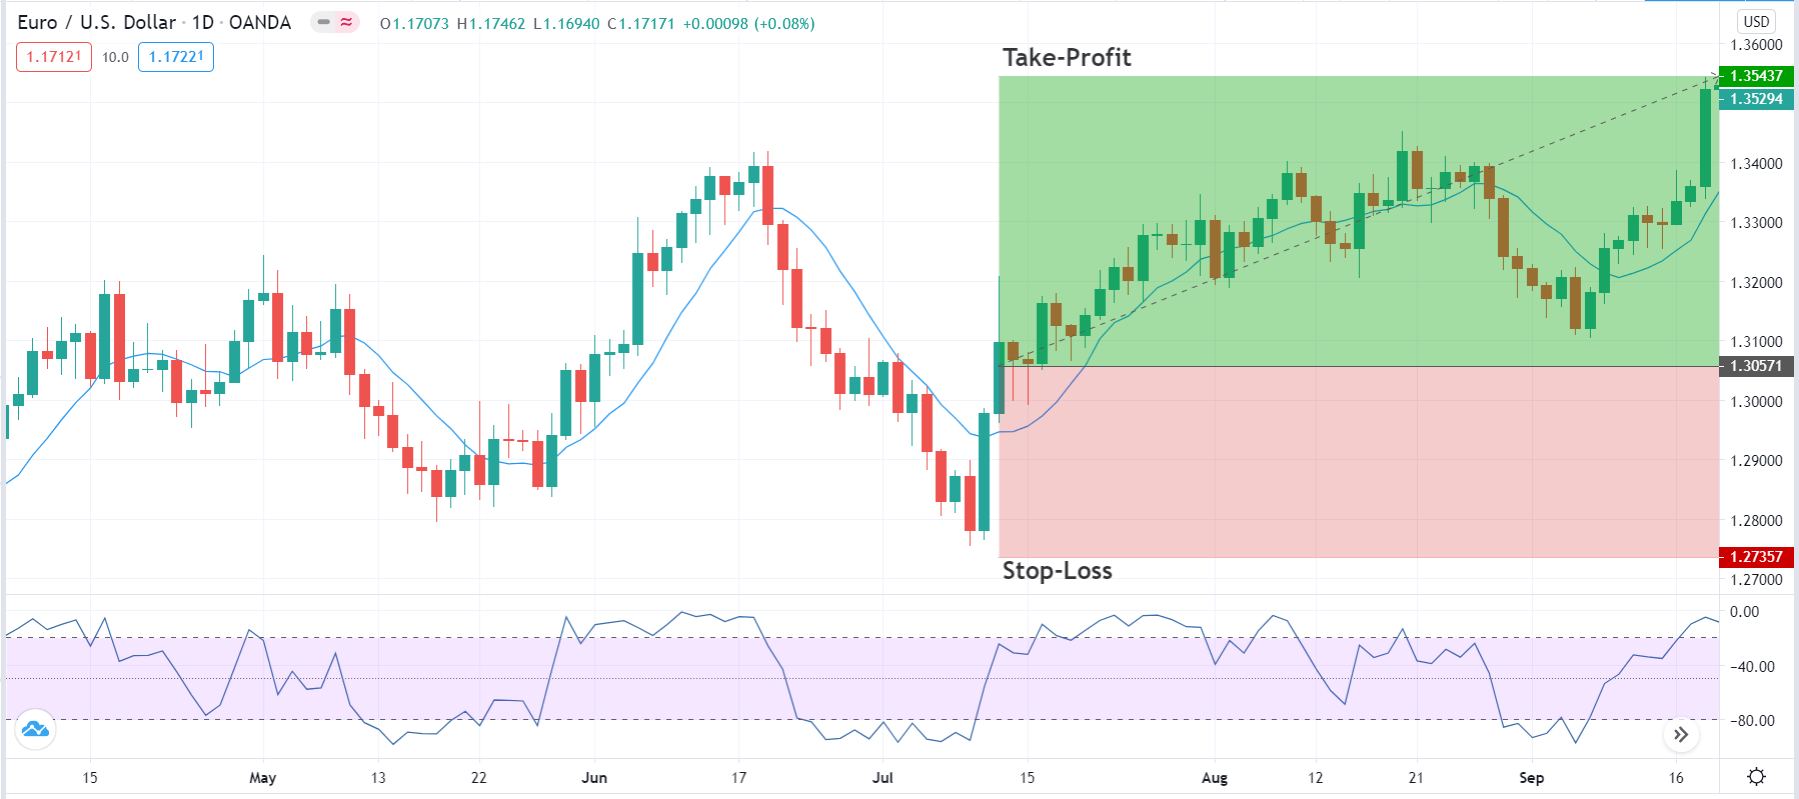
In order to explain the strategy, we will be executing a ‘long’ trade in EUR/USD currency pair using the below-mentioned rules. Here are the steps to execute the strategy.

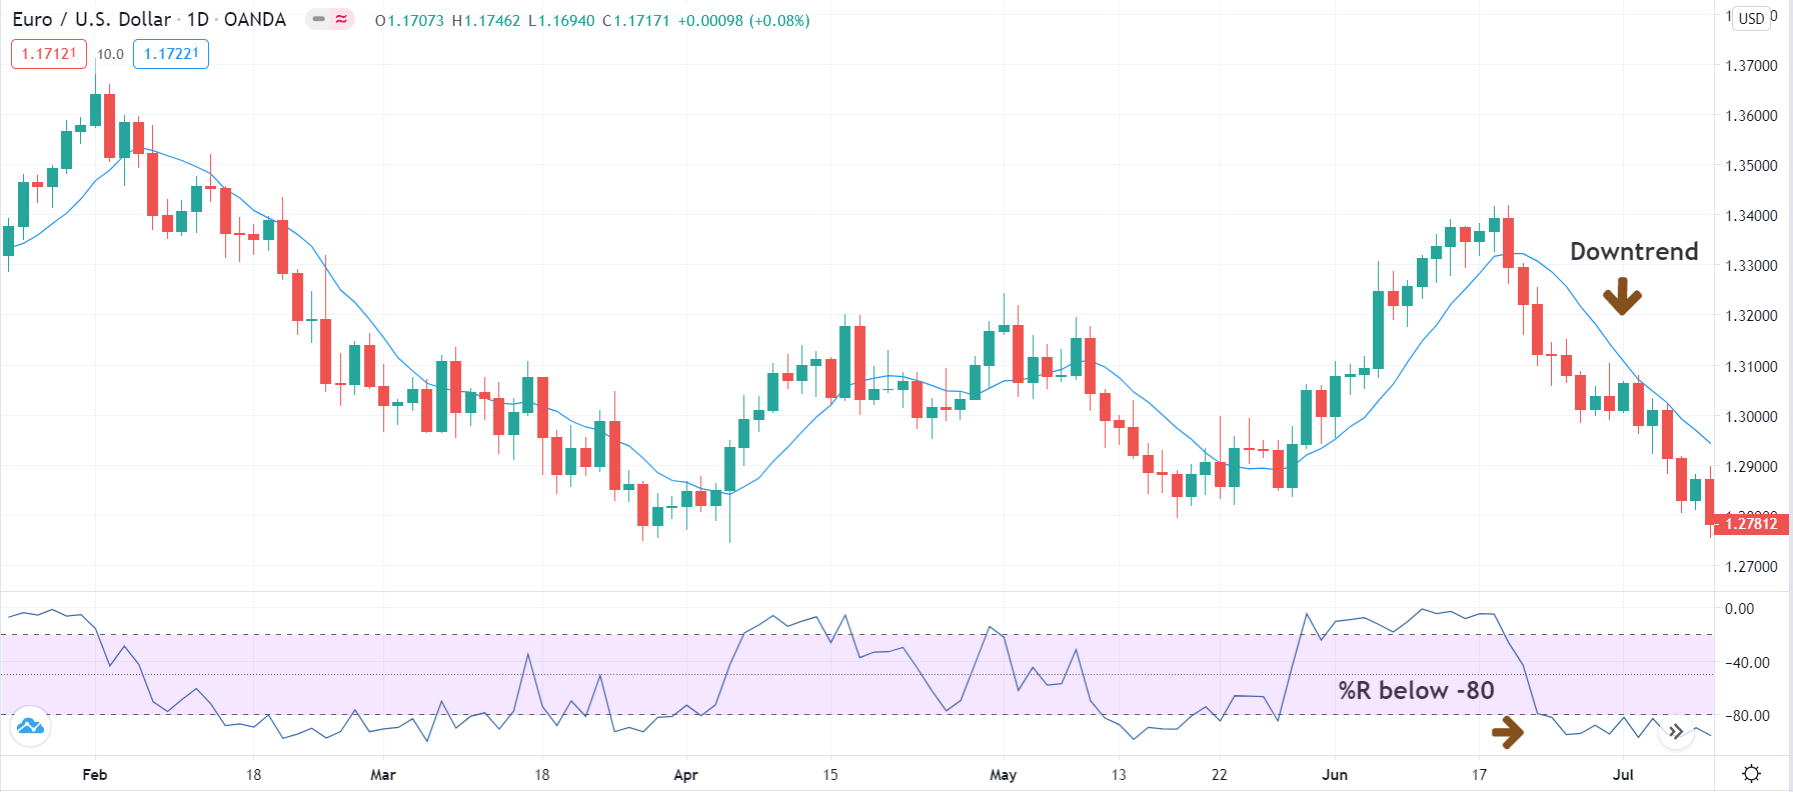
Step 1: The first step of the strategy is to identify the major trend of the trend. An easy to determine trend is if the price is below the simple moving average, the market is in a downtrend, and if the price is above the simple moving average, the market is in an uptrend. Here we need to make sure that William’s %R indicates an overbought/oversold market situation for the major part of the trend.

The below image shows an example of a downtrend that is oversold.

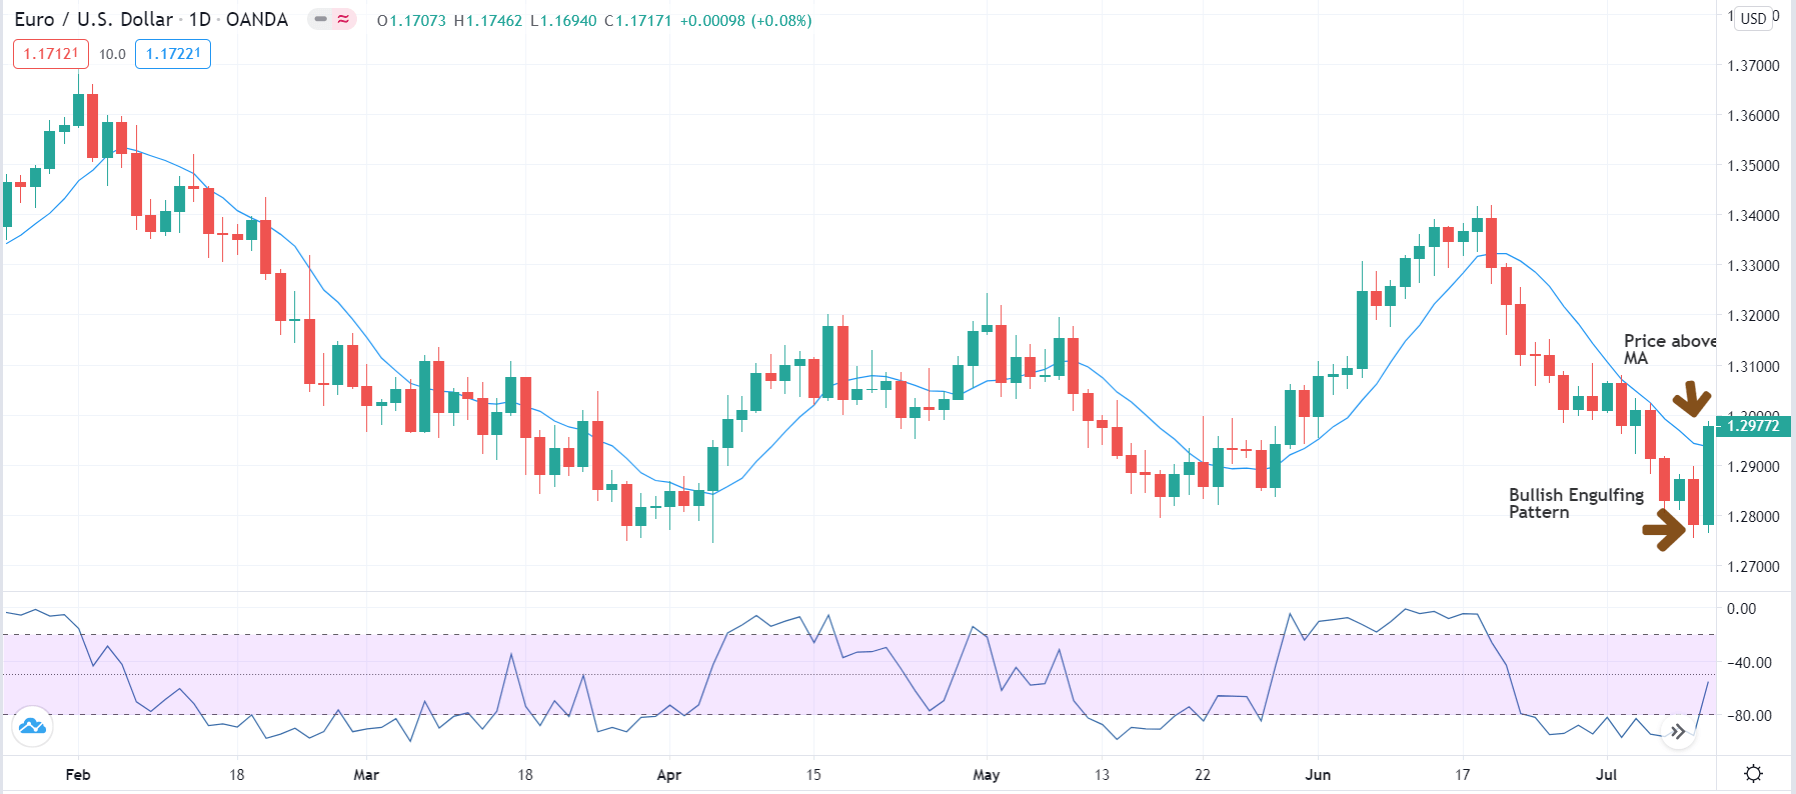
Step 2: The next step is to wait for the market to present the ‘Engulfing’ pattern on the chart. In a downtrend, the ‘Bullish Engulfing’ pattern indicates a reversal of the trend, while in an uptrend, the ‘Bearish Engulfing’ pattern indicates a reversal of the trend. If the second of the engulfing pattern closes above the MA in a reversal of the downtrend, the reversal will be more prominent. Similarly, if the second candle closes below the MA in a reversal of the uptrend, the reversal can be resilient.

Step 3: The rule of entering the trade is fairly simple. We enter ‘long’ when the price starts moving further above the moving average after the occurrence of an ‘engulfing’ pattern. Similarly, we enter ‘short’ when the price starts moving further below the moving average after the occurrence of the ‘engulfing’ pattern.

Step 4: Lastly, we need to determine the stop-loss and take-profit for the trade. In a ‘long’ position, stop-loss is placed below the ‘Bullish Engulfing’ pattern. In a ‘short’ position, it is placed above the ‘Bearish Engulfing’ pattern. The take-profit is set at a point where the resultant risk-to-reward (RR) ratio of the trade will be 1.5. However, partial profits can be taken at the opposing ‘support’ and ‘resistance’ levels that might be a hurdle for the price.

In our example, the risk-to-reward (RR) ratio of 1.5 was achieved after a period of one month since traded on the ‘Daily’ time frame.

Strategy Roundup

William’s %R is a very powerful indicator that helps us identify opportunities during a reversal phase of the market. It is important to note that %R should never be used in isolation. Combining the %R indicator with chart pattern, price action, and market trend gives us an edge in the market, which is difficult to get when applied individually. Trade executed using the above strategy can longer than expected to give desirable results since it is based on a higher time frame.

Categories
Beginners Forex Education Forex Assets

Which Currency Pairs Are Most Volatile?

One of the most prominent and most important decisions that you need to make at the start of your career is which currency pair you are going to b trading, there isn’t a right or wrong choice to make here. It will be down to your own preference, and will also need to take into account what your trading strategy is as well as your risk management plans.

One of the things that you should be thinking about when you select which currency pair is the amount of volatility within that pair. The forex markets are incredibly liquid with a lot of money going through them which normally means that there is a lower level of volatility. However, there are many reasons as to why certain currency pairs will have a lot more volatility within them than others.

The volatility of the currency pair that you decide to trade with will affect pretty much every aspect of your trading, the more volatile pairs can mean a lot bigger profits, but the other side of the coin is of course that there are opportunities for much greater losses too, as a result of this you are going to need to balance the potential gains against the potential risks. So we are going to be looking at some of the slightly more volatile currency pairs today, these pairs can offer fantastic opportunities but should be traded with caution, some are quite popular, others are a little rarer and not even found on the majority of brokers.

Just before we get into which the most volatile currency pairs are, it is important that we have a basic understanding of both what a currency pair is and what volatility is. So if we start with currency pairs, each pair is made up of two different currencies, the base currency, and the quote currency. The value of the currency pair is determined by how much of the quote currency make up a single unit of the base currency. So if we were to be looking at the GBPUSD pair, the base currency would be GMO and the quote currency would be USED due to it coming second. So you will then need to work out the price of both the base currency and the quote currency in order to work out whether that air is worth trading.

Volatility is something that is spoken about quite a lot when it comes to trading and forex, volatility is basically the amount of distance that the price fluctuates. The higher the volatility on a currency pair the more the price will move up and down, with a less volatile pair like the EURUSD moving less with each tick (movement). Price movements are of course measured in pips and so the higher the volatility, the higher each pip value and movement.

So let’s take a look at what some of the more volatile currency pairs are that you can trade…

USD / KRW: This pair is made up of the US Dollar and the South Korean Won, it has a highly inflated exchange rate which can make price fluctuations for this pair very common. Some traders seem to think that this currency pair is quite easy to trade and so more and more people are beginning to trade it, this does however mean that the volatility will only increase making it even more dangerous.

USD / BRL: The Brazilian Real falls into what is known as an exotic currency, this means that it is coming from an emerging market. These sorts of currencies often have much higher volatility so pairs such as this one with an exotic currency in it are often far more volatile.

AUD / JPY: The Australian Dollar and Japanese Yen is another very volatile pair, this is known as a commodity currency and these sorts of currencies can be very volatile. Yet the Japanese Yes is one of the least volatile currencies available on the market and people look for it to bring stability to their portfolio. The opposites of these two currencies give the currency pairing a high level of volatility making it very profitable for people looking to profit on price fluctuations.

NZD / JPY: This currency pair works very similarly to the USD JPY pair that we mentioned above with a very similar relationship between the two currencies. Once again the NZD is a commodity currency, its value is mainly tied to the exports of dairy products, honey, wood, and meat. A change in price for some of these products will cause a jump in volatility for this pair.

GBP / EUR: Ten years ago this currency pair would be on this list. However, due to the ongoing Brexit negotiations starting in 2016 this pair has become a lot more volatile, as have many of the pairs now containing the Great British Pound. Each and every news event regarding Brexit shakes up the volatility of this pair with rather large jumps and trends being caused by the news.

CAD / JPY: The Canadian Dollar is heavily dependent on oil prices, this currency pair has a similar relationship to that of AUDJPY and NZDJPY, the inverse in these currency types can cause a lot of volatility. With changes in the price of oil being quite common, it is not uncommon to see jumps in the price of the CAD and so added volatility for this currency pair. If you are thinking of trading this pair, then be sure that you are also monitoring the prices of oil.

GBP / AUD: The GBP USD pair was once again quite a stable currency pair in the past, but there has been a lot of conflict between the US and China in relation to their trade war which has disrupted the trade links between Australia and China, something that Australia really relied on and still does. Due to this, the Australian exports have dropped in value which has, in turn, made the relationship with the GBP a little more volatile.

USD / ZAR: South Africa is one of the world’s primary exporters of gold, and when selling gold around the world it is generally priced in USD. Due to this, the price of gold is highly linked to the strength of the US dollar, and so as the price of gold increases, it will mean that you will need more Arin in order to purchase USD, thus increasing the volatility of the markets.

USD / TRY: There has been a lot of political instability and disruption within Turkey which has caused the Turkish Lira to be incredibly volatile within the forex markets. During moments of political importance such as elections or coups, the volatility of this pair will spike dramatically.

USD / MXN: The relationship between the US and Mexico has been a little wobbly ever since Donald Trump was elected as the president of the US which has caused a lot of volatility within this currency pair. Even more recently, there have been some added tariffs on Mexican exports which have caused an even greater level of volatility within this currency pair.

So those are some of the most volatile pairs to trade, there can be a lot of profits in trading these pairs. However, there can also be a lot of danger, as the potential profits group, so do the potential losses, so these sorts of pairs are best left to those that have studied them or are considered to be experienced traders. Having said that, feel free to experience them on a demo account to get a feel for what it is like trading a volatile pair, you never know, it may be what is right for you.


Categories
Forex Assets

Which Are the Most Popular and Profitable Currency Pairs to Trade?

When it comes to forex trading there are a lot of pairs available to trade, a lot of them from the majors, the minors, and the exotic pairs. Some are, however, far more popular amongst traders than others. The world of Forex is attracting more and more people as time goes on, yet many of them do not know what the most popular pairs are or what the most profitable pairs are, they simply choose a random one and then start trading. So that is why we are going to be looking at what some of the most popular and most profitable forex currency pairs to trade are.

Before we do that though, let’s take a look at what a currency pair actually is. The forex market is the global market for trading currencies, it’s also the most liquid financial market in the world. Forex trading is simply the process of buying one currency while at the same time selling another, this is also the reason why the currencies are trading in pairs, one being bought and the other being sold.

There is a base currency and a quote currency, the base currency is the one that is quoted first while the quote currency is the currency symbol that is stated second. So if we were to trade the GBP/USD pair, then the GPB will be the base currency while the USD will be the quote currency. When trading there is also something known as a spread, this is the rate that you can sell a pair at and the rate at which you can buy it, the difference between these two figures is known as the spread. The final thing to point out is how they are displayed, if the GBP/USD pair is set at 1.31, this simply means that every single pound will be worth $1.31.

You also need to understand that there are different types of currency pairs, we very briefly mentioned them as the majors, minors, and exotic pairs. The defining features of the major currency pairs are that they include the US Dollar in them, examples of these major pairs include EUR/USD and USD/CHF. So this would mean that the currency pairs that do not include the USD are not majors, instead, they are known as minor pairs or crosses. They do however contain one of the world’s leading currencies such as NZD/JPY, GBP/AUD, and EUR/CAD. The final set of pairs are the exotic pairs, these often come from emerging economies around the world. They are often the least traded pairs but also some of the most volatile, some of these currencies include the Thai Baht, the Polish Zloty, and the Emirati Dirham.

So what are the most popular trading pairs available?

EUR / USD: The EUR/USD pair is the most well known and also the most popular pair to trade, it consists of the Euro as the base pair and the US Dollar as the quoted pair. It is also the most liquid currency pair available and also one of the most stable, yet it is still incredibly profitable to trade on, the spreads of this pair are also often the lowest of all the currency pairs.

USD / JPY: Another one of the most traded currency pairs traded on the markets and is also known for having its low spreads. The JPY is seen as a safe haven when the markets are in a time of uncertainty.

GBP / USD: The GBP and the USD are both among the most popular currencies and so this currency pair is also one of the most popular and profitable for traders to trade. This pair is normally quite stable, however with recent world events such as Brexit, the volatility has increased, but it remains incredibly popular to trade.

USD / CAD: There is a strong commodities link between the United States and Canada, this currency pair also has a strong link. This pair is known as the Loonie and as the Canadian dollar is linked to the export and prices of oil and grain, these commodities can influence this currency pair.

AUD / USD: The Australian dollar relies heavily on the export of the country’s gold pricing, due to this the AUD/USD currency pair can be influenced by the price of gold. This is yet another very popular trading pair.

USD / CHF: Yet another very profitable pair, the swiss franc is another currency that is seen as a safe haven, due to this the volatility is generally a little lower, yet this currency pair is still incredibly popular.

NZD / USD: The NZD/USD currency pair is another popular one, New Zealand has a strong agricultural influence around the world and so this pair relies heavily on the agricultural output and is an incredibly popular pair to trade.

EUR / GBP: This is again one of the most popular currency pairs to trade around the world due to both currencies being very popular. The Euro is used in many countries around the world making it popular to trade, normally quite a stable pair, this pair has been rocked with increased volatility due to the ongoing uncertainty around Brexit.

USD / HKD: Yet another popular trading pair, in fact, it is ranked as the 11th most traded pair, it can be seen as highly profitable with a lot of potential for smaller moves.

USD / KRW: South Korea has had some very impressive economic growth in local times. It is now the fourth-largest economy in Asia, due to this it now makes up to 2% of all trades that are made in the forex markets, due to its emerging and improving economy, this pair is becoming more and more popular as time goes on.

So those are some of the most popular trading pairs, yet you can’t really do anything with that information if you do not know how to actually trade them, having an understanding of the profitable pairs as well as how to trade them is how you can become a profitable trader. If we take the EUR/USD pair as an example, this pair often allows for a much safer trading experience due to its lower volatility, all that you really need to have when trading this pair is a basic understanding of how the markets work and some basic technical analysis know-how, this pair also often has the lowest spreads available of all currency pairs.

There is, however, absolutely no reason to limit your trading to a single pair, there are in fact over 250 different recognised countries and territories, so there is a lot to choose from when it comes to currency trading. Regardless of whether you chose to trade the majors, minors, or exotic pairs, it is important that you get your forex education done, at least the start of it, get some knowledge for analysing the markets and trade on a demo account to ensure that you are able to successfully trade before putting any real money into the account.

So those are some of the most popular pairs and also a little on what currency pairs actually are. Whichever pair you decide to choose, good luck, but if you are looking for stability combined with the potential for good profits, then go for the ones listed above, others can offer a lot more potential profits, but also a lot more risks.

Categories
Forex Assets

Shocking Facts About the GBP/USD Currency Pair

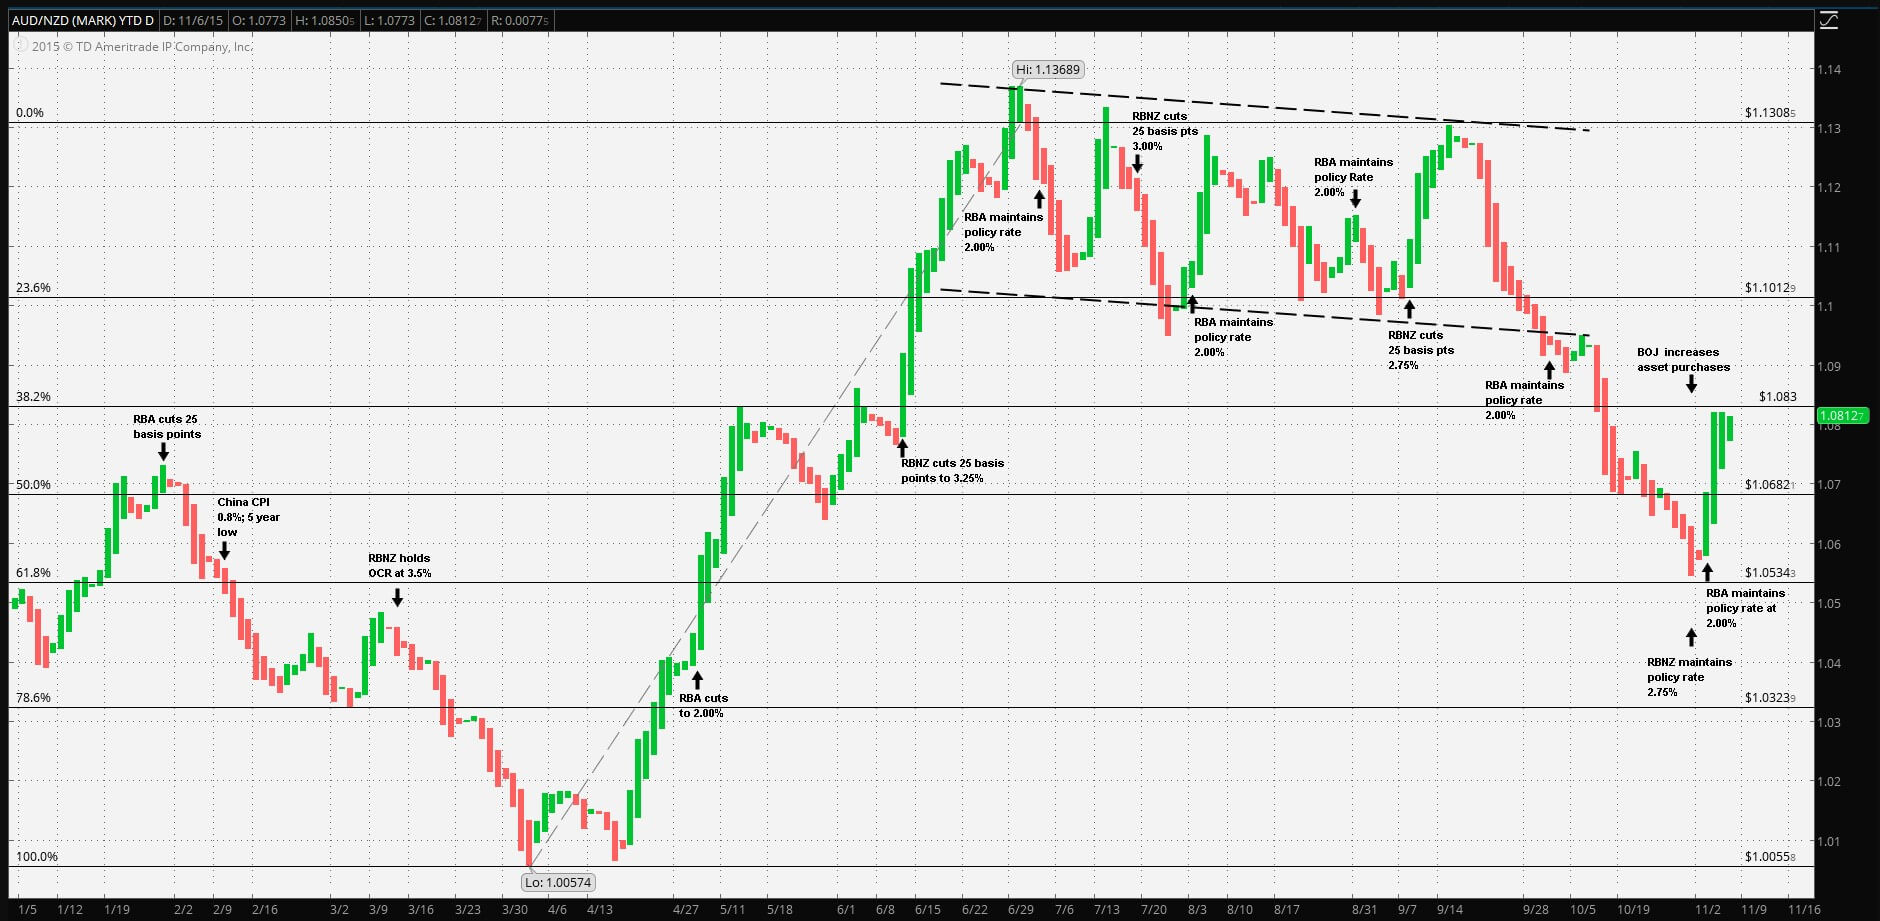
The UK and the USA always had a great relationship and similar economic views. Combining the British and American does not come out as great according to certain technical prop traders. The GBP/USD pair has some special characteristics as the third most traded currency pair. Being a very popular trading choice is not a reason for a highlight alone, even some cross pairs such as the AUD/NZD have special price action.

According to our prop trader, GBP/USD has some nuances trend following systems might have trouble with. We will focus our attention on the basic things to know about GBP/USD trading based on some very different opinions by traders, why to pay attention to additional factors on this pair, and certain trading measures. 

GBP/USD has a lot of similarities to the EUR/USD currency pair which is the worst pair you can trade described in our previous articles, according to technical traders’ opinion. Beginners should avoid the EUR/USD pair – this is certainly the opposite of what you would otherwise hear on the internet or trading books. If you are not familiar with the contrarian trader view, this is the asset most people are trading and where the big banks intervene frequently. What is even more surprising is some traders just trade this currency pair even if it does not have special advantages, the liquidity or spreads should not be a really important benefit. If we compare the two pairs we can notice they are in the top 3 most traded pairs, and both have the USD counter currency. 

The USD is the most manipulated currency yet the GBP is not far behind, it is one of the largest currency trading countries in the world after all. GBP/USD is also more volatile than the EUR/USD. Volatility is not always a bad thing, except for the scalping strategies, trend following strategies need volatility actually. Strategies, as explained in our previous articles, are volatility adaptive, making them universal to any asset. Another key characteristic for both currency pairs is USD driving the bus. In other words, the percentage change in the price or the pair is caused by the USD movements for the most part. Experienced traders know these pairs do not offer much for diversification, it is like trading the USD alone and the USD is the playground of the big banks and news events. 

About volatility, the GPB pairs are generally the most volatile if we do not count some exotics. Having a system that adapts your position sizing and protective orders accordingly to the volatility of any pair clears the risks related to it. However, expect bigger moves from GBP/USD than with EUR/USD. Interestingly, GBP/USD is also more sensitive to the news events according to measurements. Since the USD is included, events are frequent. Now, some events are more important and we are not talking just about the impact levels marked on calendars, but about the measurements each event caused the currency to move a lot. The measurements like this are not very popular, they are offered on some statistical websites for a fee, but are easily found.

You may notice if you are trading on a daily timeframe, some events are not meaningful even when regarded as highly important on calendars. As a trader, you will have to adapt your trading plans for the GBP/USD since it has peculiarities. Our technical prop traders avoid news events, so unless you have consistent results from trading the news we recommend avoiding them too, you have no control over how they are going to affect the price. Know that except for the USD, the pound is the most sensitive currency to news events. The reason comes from news aware, educated traders that react. 

Since the GBP/USD has this combo of a big mover with news event sensitivity, traders should trade this pair as they would the EUR/USD. It becomes a pair that comes after all other signals. In other words, if you have a signal from your system on EUR/GBP, and GBP/USD, do not split the position risk, trade the EUR/GBP, and ignore GBP/USD. The nature of GBP/USD increases the risk you cannot avoid if you trade it. Our articles cover some of the crosses not involving the USD so you may consult them for specialties on these currency pairs. If a system shows only the signal on GBP/USD, trade it but with reduced position size, as our prop trader recommends. 

Brexit poses a special uncertainty for the GBP, consequently also on the GBP/USD. Interestingly, EUR/GBP is still a good choice, but the GBP/USD does not follow the same system-friendly moves. Trends here are choppy, whipsaws often, and unpredictable effects ruin what you might have gained before. The events from Brexit come out of nowhere, a speech or announcements by the banks or political tensions hits the price action line like a stone drop. In 2019 the forex was pretty flat. To some opinions, the Brexit caused some much-needed volatility, allowing for trend following systems to re-engage trading, at least with reduced risk settings.

Nevertheless, caution requires us to follow the events and portals we usually do not have to if you follow our trading strategy example, also pay attention to other markets in the UK and the USA. The Brexit could be over in 2020, however, the effects and lessons from it should remain in the traders’ heads. Every country experiencing any similar long term, eventful turmoil causes the country currency value erratic. Whatsmore, the COVID-19 implications on the GBP are even more severe than in the USA if we look at the economic and pandemic measures.

When we try to make predictions, we are dealing with a very low probability we are correct. Traders that use technical trading systems do not like to predict price movements, especially not in the long term. Investors rely heavily on the fundamental analysis and they commonly make predictions based on the data, yet they react only when the results of Brexit or COVID-19 are clear. Right now the markets have multiple factors – COVID-19, Global trade war tensions and measures, very low maneuverability space left for the central banks, and an economic wave on the decline, signaling another world economic crisis. Markets never had all these very important factors at the same time which is not clearly evident on the charts. At the moment of writing this article, equities are near the record high like nothing is going on. 

The selloff on a larger scale in the equities and risk-on currencies are now very easy to trigger, posing a great opportunity for cautious forex traders. GBP is considered a mix between risk-on and risk-off currency, but nowadays a rare choice in a risk-off environment, while the USD is a risk-off currency facing presidential elections and pandemic effect. Some traders think the GBP has priced in for the worst-case Brexit scenario, the one without the agreement with the EU. This means the GBP is about to reverse but the recent COVID-19 events caused uncertainty to the point the price is actually at the right level. 

Consequently, the forex market is a bit low on volatility, as well as the equities, as before the storm. The US presidential elections are on the way making 2020 one of the most interesting years for analysis. The EUR has not priced in for Brexit, investors seem not to care about the UK-EU relations and focus on the internal struggles of the Union. The EU is facing serious doubt in the pillars that hold it together, this was especially evident during the COVID-19 pandemic where every country fought for medical supplies over other EU members. 

All things considered, technical traders do not make decisions based on these fundamental events but react only when the move on the market actually happens. However, there is an indirect pre-reaction. To conclude, GBP/USD is a more volatile version of the EUR/USD and with more news events, traders adjust their risk management accordingly. On the other hand, GBP cross pairs are great movers with quality trends. Additionally, Brexit and other major factors need to be considered and avoided, trade the GBP/USD only If there is nothing else to trade and do it with half risk. If you test your systems on this particular pair, compare the results with other GBP pairs. Systems that generate good results on EUR/USD and GBP/USD for a longer period could be worth keeping and perfecting. 

Categories
Forex Course

165. Knowing More About Trading The Euro & Yen Crosses

Introduction

In cross-currency trading, the Euro and Japanese Yen are the most traded currency. Therefore, after major currencies, EUR and JPY has the highest liquidity in the forex market. Overall, trading in the Euro and Yen crosses are secure compared to the other cross currencies.

Understand the European Economy

When trying to trade in any Euro cross pairs, we should understand the European economy even if we only follow technical analysis. In technical analysis, traders can make decisions based on previous price movements. Therefore, many traders think that there is no need for fundamental analysis.

However, in trading, we aim to increase the probability of our analysis. Therefore, when we add Europe’s economic condition, we will have a better outlook of trading Euro crosses like- EURCHF, EURAUD, EURNZD, etc.

The European economy consists of several countries, including France, Italy, Germany, etc. Therefore, trading in the Euro cross requires to know interest rate decisions, retail sales, employment export-import, GDP, and other economic releases of these countries.

Moreover, in Euro cross trading, we should focus on other currencies that combine with the Euro. For example, if we want to trade in the EURCHF pair, we should focus on Switzerland’s economic condition.

Understand the Japanese Economy

In Yen cross trading, we should have extensive knowledge of the Japanese economy. Japan is an export-oriented country. Therefore, it tries to depreciate its value against other major currencies by keeping the interest rate lower.

Overall, any increase in interest rate, retail sales, employment, and GDP are suitable for the Japanese economy.

Besides the Japanese economy, we need to understand the economic condition of the Japanese Yen combination. For example, trading in the CADJPY pair requires a fundamental analysis of both the Japanese and Canadian economies.

Conclusion

Overall, the Euro and Japanese Yen cross are mostly traded currency in currency crosses. Therefore, to trade Euro and Yen crosses, we should know these two countries’ economic conditions. Even if we don’t trade based on fundamental analysis, having good knowledge is essential to have an overall outlook of the economy. Cheers.

[wp_quiz id=”86515″]
Categories
Forex Course

164. Do You Know What A Synthetic Currency Pair Is?

Introduction

In institutional trading, traders usually take trades with a more significant volume, which often makes trading impossible in some currency pairs due to not having enough liquidity. Therefore, institutional traders create synthetic currency pairs to take trades on those pairs.

What is a Synthetic Currency Pair?

If an institutional trader finds a possibility of a decent upward movement of AUDJPY pair, but due to not having enough liquidity, they might be unable to take a buy trade. However, the alternative option to take the trade is to buy both AUDUSD and USDJPY as there is enough liquidity in these pairs. As a retail forex trader, we can take similar action as institutional traders. If we perform AUDUSD and USDJPY trades at the same time, we are trading in synthetic currency pairs.

In our current world, Internet connectivity makes trading easy; therefore, many brokers offer to trade currency pairs like CHFJPY or GBPNZD. However, these pairs have some issues regarding the spread and overnight fee. In some cases, cross-currency pairs like AUDCHF, GBPNZD, and CHFJPY move within a consolidation for a specified period. Therefore, trading in these pairs is costly, even if the broker allows.

How to Create Synthetic Currency Pairs?

Creating synthetic currency pairs need to open two trading entries with its margin. In synthetic currency trading, there is a common currency bought in one currency pair and sold in another currency pair. Overall, we will eliminate the common currency by buying and selling; therefore, the ultimate currency pair will remain that we are expecting to buy.

Is Synthetic Currency Pair Trading Profitable?

Trading in synthetic currency pair requires an additional margin, which is not wise to use. Moreover, in the present world, most brokers allow maximum currency pairs that reduce the hassle of trading two currency pairs at a time. Therefore, it is not recommended that traders trade in synthetic currency pairs if the broker has an option to take trades on the main currency pair.

Conclusion

Synthetic currency pair is a combination of the currency pairs where a single currency is bought in one pair and sold in another pair. In the present world, most Forex brokers allow trading cross and exotic currency pairs that eliminate the need for synthetic currency pairs. However, if any broker does not allow trading in a specific pair, we can use this method.

[wp_quiz id=”86510″]
Categories
Beginners Forex Education Forex Assets

The World’s Top Forex Currencies

Many Forex traders make the mistake of not thinking about what they are trading beyond price fluctuations on a screen. While it is true in trading that the price is king and also that prices are never too high or low not to be able to rise or fall any more, over time it will work better if it understands what makes the currencies it negotiates unique. Understanding Forex’s major global currencies will make you a better trader, more focused, and more profitable.

What are the World’s Leading Forex Currencies?

There are eight currencies that are the most important in the Forex universe. These are the most important, more or less, according to the consensus:

  • USD (U.S. dollar)
  • EUR (Euro)
  • JPY (Japanese Yen)
  • GBP (British Pound)
  • CAD (Canadian Dollar)
  • CHF (Swiss Franc)
  • AUD (Australian Dollar)
  • NZD (New Zealand Dollar)

In addition, the Chinese yuan (CNY) is becoming increasingly important, although it is not yet fully convertible. There is an onshore Yuan and an offshore Yuan, the last of which is offered for trading by many Forex brokers.

The ranking shown above was not simply ordered by relative GDP or any other economic indicator. Instead, the level of importance given to individual currencies takes into account convertibility, its use as a global reserve, and its correlation with important raw materials. For example, there are several countries, such as India, which have economies much larger than Switzerland or Australia. However, Australia is a major producer of gold and several other raw materials used in manufacturing, while Swiss banks hold a large share of global private capital and especially of gold, which gives their respective currencies a weight that goes beyond the national economies they represent. You must think beyond the plain economic factors to succeed in understanding the major global forex currencies.

Currencies Are National Debt

All modern currencies are backed on paper by nothing more than the nation’s central bank’s promise to meet the obligation. Currencies are 100% debt.

The USD Is The King

The first thing that the trader must take into account in order to understand the main world currencies of Forex is that the USD is of paramount importance. All other currencies are first valued on the basis of their value against the USD. Therefore, you can trade in Forex markets much more easily by simply focusing on the other 7 currencies paired with the USD instead of worrying about every possible crossing, although there are some exceptions.

The importance of the USD is due not only to the large size of the US economy, which is larger than that of any other nation and almost as large as that of the entire eurozone. It is also due to the unique position of the United States as the architect of the global financial system and the world’s only superpower. The dollar is the world’s largest reserve currency, and there is still more cash wealth in USD than in any other currency.

This means that the USD will generally be the main driver of currency market movements. If people around the world want to keep the USD, it will go up and that will tend to weigh in most other currencies and vice versa. In the last 15 years, the USD has had a more predictable and strong trend than any other Forex world currency, which is something that helps to understand the main Forex world currencies.

“Security” and “Risk” Currencies

For various reasons, the market tends to view the following currencies as safe havens, so their relative value tends to increase when there is market turbulence that is caused by fears about global economic prospects: USD, JPY and EUR. The CHF used to be the main security currency, but its role as a safe haven is now considered to be lower due to some unbridled revaluations by the Swiss National Bank and also due to its very high negative interest rate of -0.75%.

Other currencies tend to perform well when there are good prospects for global economic growth. An appreciation of the appetite for risk in the face of risk aversion is a great help in understanding Forex’s major global currencies.

Currencies Related to Commodities

Certain currencies are highly correlated positively with the prices of various raw materials, as these countries are large producers of these raw materials in question. The most important examples are the CAD, which correlates positively with the price of crude oil, and the AUD, which correlates positively with the price of gold. NZD tends to perform well when there is a growing demand for dairy and lamb products.

Liquidity

Most traders will notice that different currency pairs have different “personalities”: some are very volatile and move quickly (a good example is GBP/JPY), while others tend to move in “2 steps forward, 1 step back” mode (the perfect example is the EUR/USD pair). This is due to the liquidity of the respective currencies. There are more euros and dollars than any other currency and this is why their prices tend to move quite slowly. However, when you look at currencies like GBP, JPY, and CHF, there are much smaller amounts involved and, when they are heavily in or out of demand, a liquidity constraint can cause the price to move very quickly.

Time of the Day

In general, currency prices move more during trading hours in London and New York, but also during your local business hours. This means, for example, that the GBP tends to be rather flat during the first part of the Tokyo session, while at that session there will tend to be more activity in Australian and New Zealand dollars, except during before the opening of London and later New York, which overlap to some extent with “domestic” business hours. This is partly due to the fact that currency exchange rates are often moved by economic data publications and central bank publications which, of course, are scheduled during domestic business hours.

While the factors discussed in this article are neither the first nor the only ones that traders will think about, taking this basic information into account can help them to be more flexible and successful in trading certain currencies.

Categories
Forex Course

159. Understanding Forex Assets Classes

Introduction

The forex market is the world’s biggest financial market, where daily turnover is more than 6 trillion dollars. The most exciting feature of the forex market is that it has an enormous number of trading instruments that allow traders to diversify their portfolio. Besides significant currency pairs, cross pairs are very profitable as it can make e decent move.

What is the Currency Pair?

In the stock market, investors’ trade in a particular stock of a company. This is not similar to the currency market. In the forex market, traders usually trade on a currency pair instead of a single currency.

The combination of two currency indicates the economic condition of two separate countries. Therefore, if we want to trade on a currency pair, we should know at least two countries’ economic conditions. For example, if we want to buy EURJPY pair, our analysis should indicate that the European economy will be more durable than the Japanese economy.

Major vs. Cross Currency Pair

US Dollar is the most traded currency in the world. Therefore, any currency pair from the developed country with the US Dollars will represent the major currency pair.

A list of 6 major currency pairs are mentioned below:

  1. EURUSD
  2. GBPUSD
  3. USDJPY
  4. USDCAD
  5. USDCHF
  6. AUDUSD

If we eliminate the USD from these major pairs, we will find the cross currency pairs. Let’s say the value of EURUSD is 1.0850, and the value of AUDUSD is at 0.7150. Therefore, the value of EURAUD would be 1.39 (1/1.085X 1.085/0.7150).

Other examples of Cross currency pairs are EURGBP, EURCAD, GBPCHF, GBPAUD, CADJPY, EURJPY, etc.

The condition for cross currency pairs are-

  • The currency should be from the major pairs.
  • The cross pair should eliminate the US dollar.

Is Cross Currency Pair Trading Profitable?

Trading cross currency pairs is similar to trading major currency pairs as both technical and fundamental analysis work well in cross currency pairs.

For example, we can make a decent profit from the GBPJPY pair if we can evaluate the UK and Japan’s economic condition.

Conclusion

Trading in a currency pairs means to anticipate the price based on the technical or fundamental analysis. Therefore, if we know the two countries’ economic conditions, we can make a decent profit from cross-currency pairs.

[wp_quiz id=”86447″]
Categories
Forex Assets

Analysing The Costs Involved While Trading The CAD/INR Exotic Currency Pair

Introduction

The CAD/INR pair is considered an exotic currency pair where CAD is the Canadian Dollar, while the INR is the Indian Rupee. This article will cover the basic elements of the CAD/INR pair that you should know before you start trading the pair.

In this pair, the CAD is the base currency, while the INR is the quote currency. Therefore, the price attached to the CAD/INR pair is the amount of INR that can be bought by 1 CAD. For example, if the price of CAD/INR is 55.059, it means that for every 1 CAD, you can get 55.059 INR.

CAD/INR Specification

Spread

The price at which you can buy a currency pair is different from the price at which you can sell the same pair. This difference is the spread. The spread is considered a source of revenue for brokers and a trading cost for forex traders. The spread for the CAD/INR pair is as follows.

ECN: 39 pips | STP: 44 pips

Fees

The trading fee is the commission you pay your forex broker for every trade you make. STP accounts usually have no trading fees, while the fees charged on ECN accounts vary from broker to broker.

Slippage

Slippage represents the difference between the price at which you place a trade and the price at which your broker will execute the trade. Market volatility and the broker’s efficiency determine the amount of slippage.

Trading Range in the CAD/INR Pair

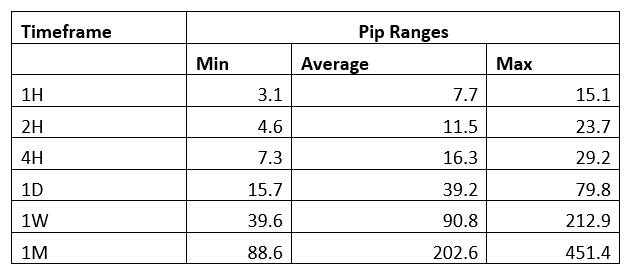
The trading range in forex helps a trader analyze the extent of a currency pair’s fluctuation during a specific timeframe. As measured in pips, this fluctuation can help determine the volatility of the pair and the expected gains or losses. For example, if in the 4-hour timeframe the CAD/INR pair has a volatility of 30 pips, a trader can expect to either gain or lose $54 since the value of 1 pip is $1.8

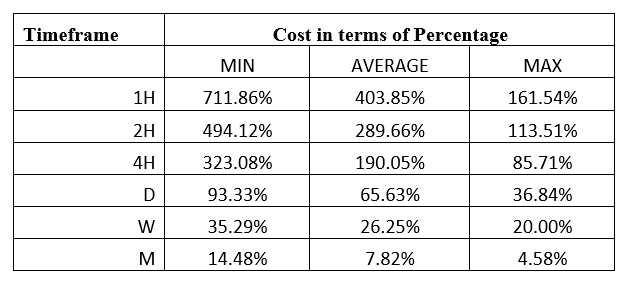
The table below shows the minimum, average, and maximum volatility of CAD/INR across different timeframes.

The Procedure to assess Pip Ranges

  1. Add the ATR indicator to your chart
  2. Set the period to 1
  3. Add a 200-period SMA to this indicator
  4. Shrink the chart so you can determine a larger period
  5. Select your desired timeframe
  6. Measure the floor level and set this value as the min
  7. Measure the level of the 200-period SMA and set this as the average
  8. Measure the peak levels and set this as Max.

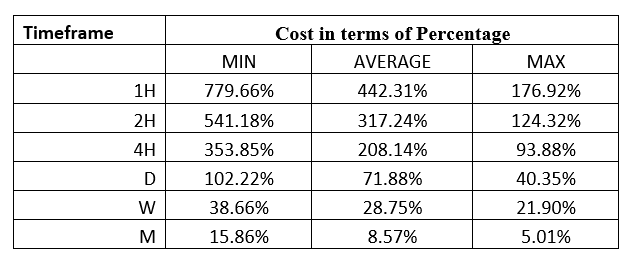
CAD/INR Cost as a Percentage of the Trading Range

The knowledge of the potential costs when trading helps determine the trading strategies to be used. Cost as a percentage of the trading range will help us understand how trading costs vary with volatility under different timeframes.

Total cost = Slippage + Spread + Trading Fee

The tables below show the analyses of percentage costs in both ECN and STP accounts.

ECN Model Account

Spread = 39 | Slippage = 2 | Trading fee = 1

Total cost = 42

STP Model Account

Spread = 44 | Slippage = 2 | Trading fee = 0

Total cost = 46

The Ideal Timeframe to Trade CAD/INR

Depending on your forex trading style, you can use the above analysis to coincide with your trade of the CAD/INR pair with moments of lower trading costs. The 1-hour timeframe for the STP and the ECN accounts has the highest trading costs of 779.66% and 711.86% of the trading range, respectively. Also, notice that the highest costs coincide with the lowest volatility of 3.1 pips.

Trading longer timeframes like the 1-week and the 1-month timeframes are associated with lower costs. However, trading when the CAD/INR pair’s volatility is above average has a lower cost. Another way of reducing trading costs is by using the limit order types, which eliminates the slippage costs. Here’s how it works.

Total cost = Slippage + Spread + Trading fee

= 0 + 39 + 1 = 40

When limit orders are used, the slippage cost becomes zero. Consequently, the trading costs are significantly reduced, with the highest trading cost dropping from 711.86% to 677.97% of the trading range.

Categories
Forex Basic Strategies

An Exclusive Strategy To Trade The Fiber (EUR/USD) Currency Pair

Introduction 

In the previous article, we discussed a trading strategy that was a combination of EMA and RSI. Presuming that all the readers easily understood it, we will now discuss a trading strategy that is a combination of three technical indicators. Today’s article will acquit us with another useful and reliable trading system that is based on the combination of Simple Moving Average, Stochastic Oscillator, and Relative Strength Index (RSI).

Time Frame

This strategy is only applicable on the 1-hour time frame. This is because all the indicators tend to sync in this time frame. Therefore, the strategy may not be suitable for day traders.

Indicators

The strategy consists of three indicators – a 150-period Simple Moving Average (SMA), Relative Strength Index (RSI) with period 3, and a Full Stochastic Oscillator with standard settings. The overbought and oversold levels for the indicators stand at 70-80 and 30-20, respectively.

Currency Pairs

As the name suggests, this strategy is exclusively meant for ‘EUR/USD.’ The liquidity and volatility of EUR/USD are extremely supportive of this strategy.

Strategy Concept

We first identify the direction of the market using the 150-period SMA and then establish a channel in the same direction. This is the first condition that has to be met before we can initiate a ‘trade.’ One could also this is a ‘channel’ based strategy as it involves going ‘long’ at the bottom of the channel and ‘short’ at the top once the indicators generate signals.

For a ‘long’ entry, we need to see if the Relative Strength Index drops in the oversold area. Once it drops, we look for a bullish crossover of the Stochastic lines, while they are also within their oversold zone. In simple words, we need a channel in a bull trend with both the indicators indicating that the market is oversold and with the Stochastic displaying a bull reversal.

Conversely, a ‘short’ trade is generated when the price starts moving in a downward channel in a bearish trend. The RSI and Stochastic should be in the overbought area that will later display a bearish reversal. As soon as the Stochastic fast and slow lines make a bearish crossover, we enter for a ‘sell’ on the next price bar. All of the above price action must happen below the 150-period SMA.

The strategy offers a high degree of capital protection as we place our stop-loss at the most recent ‘swing low’ or ‘swing high.’ As far as the ‘take-profit’ is concerned, we can use a fixed profit target, or we could scale out as the market approaches our target and protecting it with a trailing stop. An exit signal is also generated by the Stochastic indicator, which we will be discussing in the upcoming section of the article.

Trade Setup                     

In order to explain the strategy, we have considered the 1-hour chart of EUR/USD, where we will be applying the rules of the strategy to execute a ‘long’ trade.

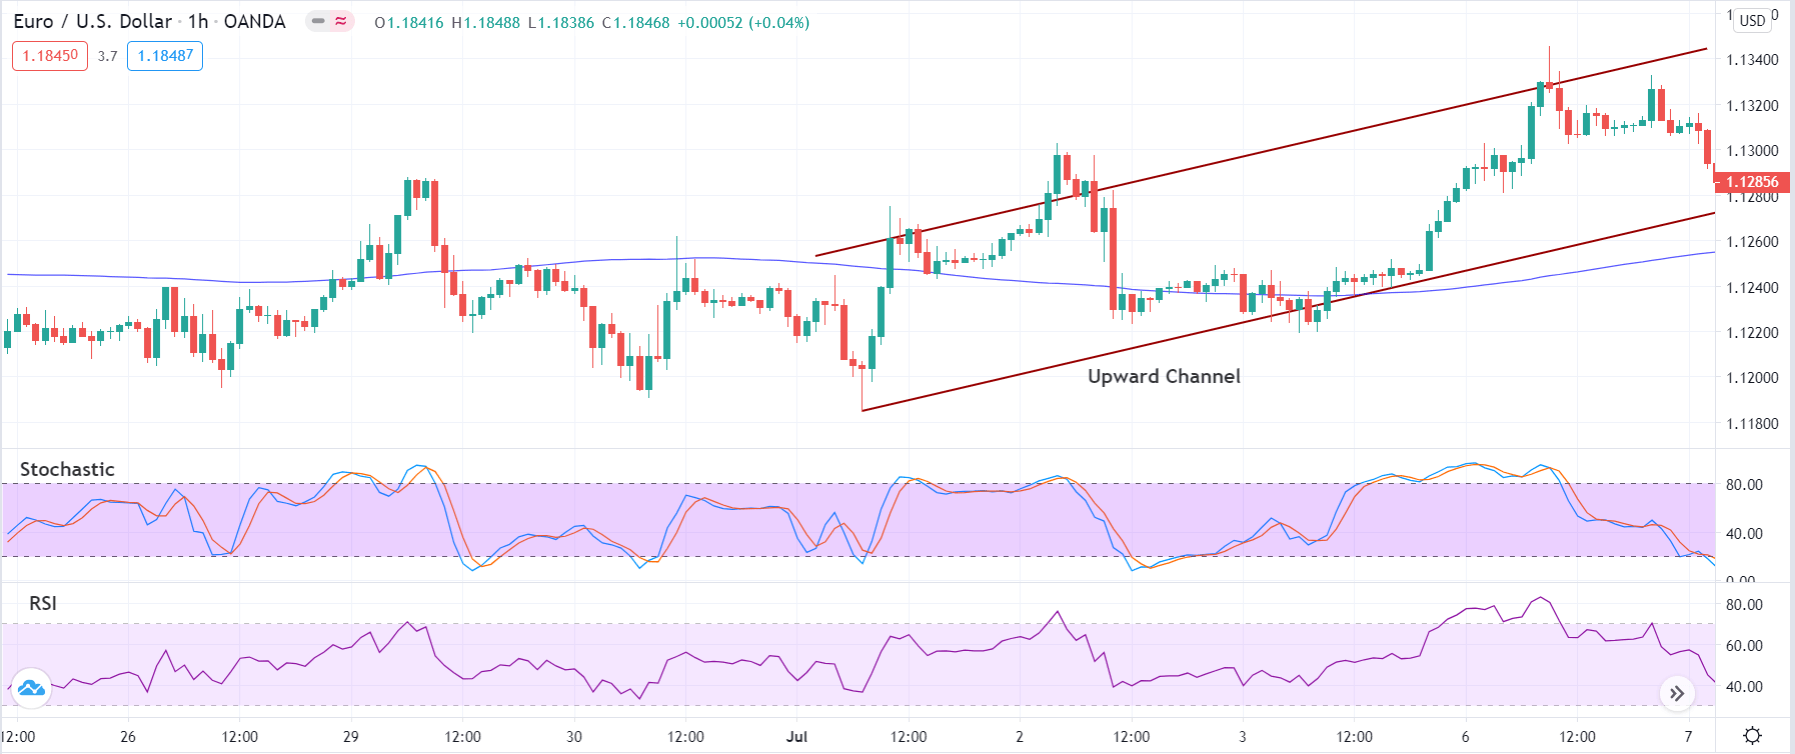
Step 1: First of all, open the 1-hour chart of EUR/USD and establish the trend of the market. Plot Simple Moving Average (SMA) with a period of 150, Stochastic and Relative Strength Index with their default settings on the chart. If the price is above the 150-period SMA, we say that the market is in an uptrend. Whereas if the price is below the 150-period SMA, we say that it is in a downtrend. Next, draw a channel within the trend. It is better to have an upward channel in an uptrend and a downward channel in a downtrend.

Step 2: This is the crucial step of the strategy, where we align the three indicators together to generate a signal. After the identification of the trend and channel, we need to wait for the price to come at the extreme of the channel. In an upward channel, the price should be at the bottom of the channel, while in a downward channel, the price should be at the top.

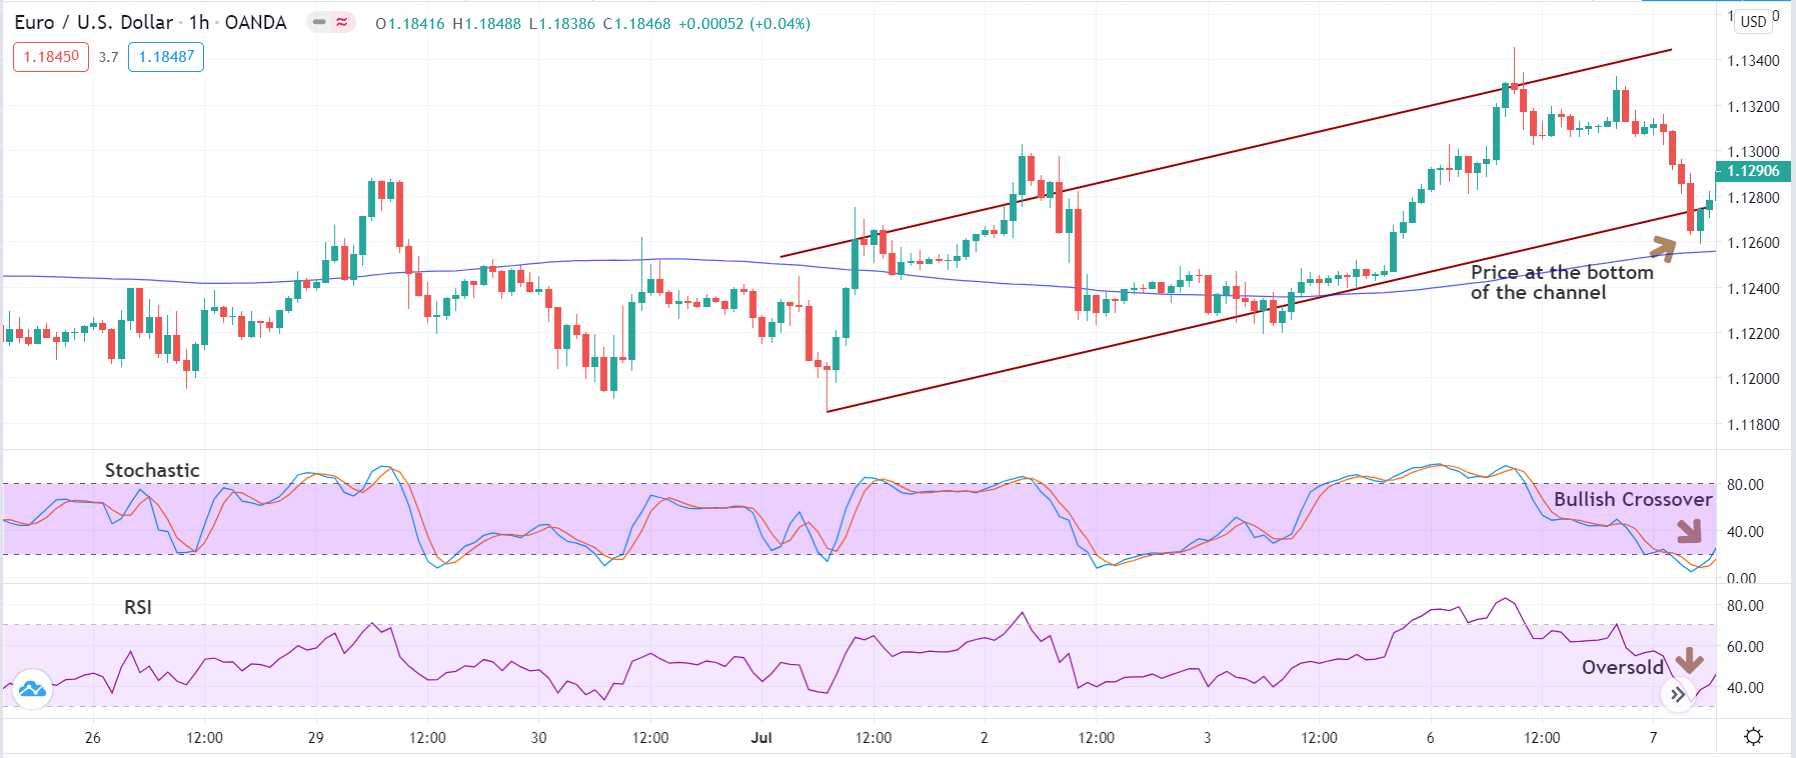
Once the price reaches these extremes, we should watch the Stochastic and RSI. We enter ‘long’ when we notice a bullish crossover in Stochastic and an oversold circumstance of RSI (below 40). This means that the price might be putting up a ‘low’ that will result in a reversal. Similarly, we will go ‘short’ in the currency pair when we notice a bearish crossover in Stochastic along with an overbought condition of RSI (above 60).

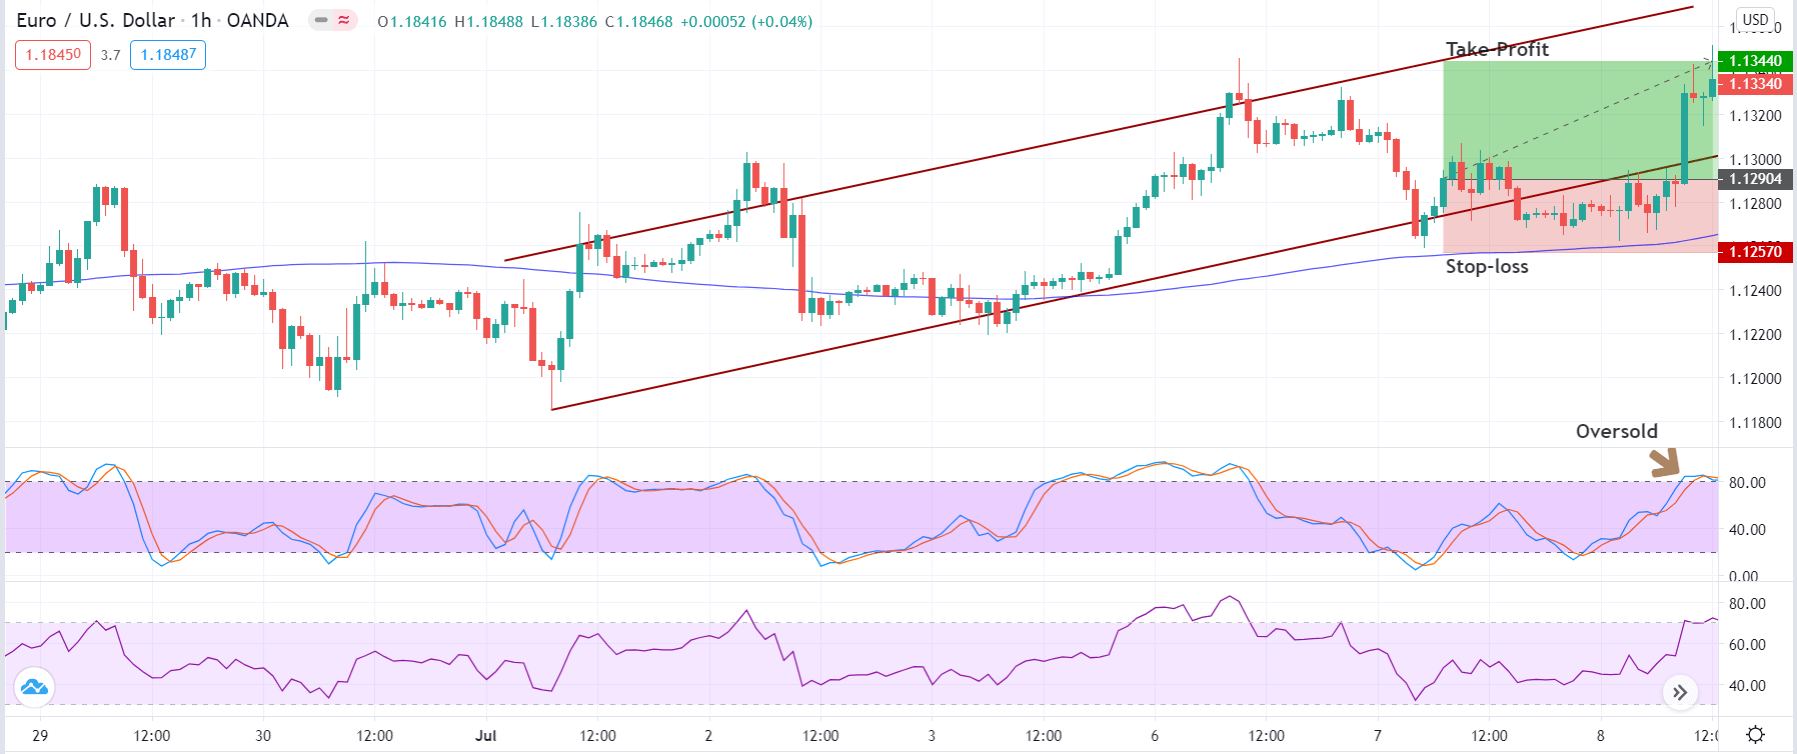
The below image shows an example where the above step is being accomplished.

Step 3: In this step, we shall determine the Stop-Loss and Take-Profit for the trade where both these levels are derived mechanically. We place the stop-loss just below the ‘swing low’ from where the reversal took place. It will be above the recent ‘swing high’ in a ‘short’ trade. When speaking of the take-profit level, there is no fixed point for it. We take our profits when Stochastic reaches the opposite overbought/oversold level. At this point, we can either exit the trade, scale-out, or use a trailing stop. This can help in increasing the risk-to-reward (RR).

In our case, the risk-to-reward (RR) ratio of the trade was 1.5, which is above average.

Strategy Roundup

The RSI+Stochastic+SMA strategy is a reliable trend trading system that accurately pinpoints the bottom of a channel in a trend. More importantly, the strategy can provide the best-with-trend entry points that are necessary to increase the probability of winning. Since we are applying this strategy on a higher time frame, it will limit the effects of whipsaws that are encountered more often these days.

Categories
Forex Basic Strategies

Generating Reliable Trading Signals Using ‘The Power of Two’ Forex Strategy

Introduction 

In the previous article, we discussed a strategy that was based on three indicators, namely the RSI, Stochastic, and SMA. It was not only a bit complex in nature but involved many rules that had to be fulfilled before we could make a ‘trade.’ Also, the probability of occurrence of the signal was lower as it involved many indicators.

In today’s article, we will discuss a setup that is observed more often in the market and has a higher probability of success. Again, the strategy may not be suitable for day traders as it used a longer time frame for analysis. In this strategy, we will be examining the 4-hour time frame chart of the currency pairs. This is simpler than the previous strategy.

Time Frame

As mentioned in the previous paragraph, the strategy yields the best results when applied on the 4-hour time frame. However, the ‘daily’ is also a suitable time frame for the strategy.

Indicators

We will be using the Relative Strength Index (RSI), with a 14-bar period. The overbought and oversold levels stand at 70 and 30, respectively. We also apply the Bollinger Band indicator with its default settings.

Currency Pairs

This is the best part of the strategy, where we can apply on all currency pairs listed on the broker’s platform, including few minor and exotic pairs.

Strategy Concept

The strategy is based on a simple concept that the RSI is a very powerful indicator of a trend. It can accurately identify the highs and lows that will give rise to a new trend. This is combined with the Bollinger Band indicator to generate exact entry points for the strategy.

The trend becomes especially reliable when the reading of RSI makes a swift jump from an oversold level to a median level (above 50) and vice-versa. The Bollinger Band indicates the formation of a ‘low,’ after which we can execute a ‘long’ trade. Similarly, when Bollinger Band pin-points a ‘high,’ we execute ‘short’ trades in the market. The exact rules of ‘entry’ will be discussed in the next section of the article.

The risk-to-reward (RR) of the trades done using this strategy is highly appealing. This is because it employs a small stop-loss with a much higher take-profit. If the market is in a strong trending state, traders can ride their profits as long as they see signs of reversal.

Trade Setup 

In order to explain the strategy, we have considered the 4-hour chart of GBP/JPY, where we will be illustrating a ‘long’ trade. Here are the steps to execute the strategy.

Step 1

The first step is to open the 4-hour timeframe of the desired currency pair and plot Bollinger Band and RSI indicator on it. Just from the appearance and basic knowledge of trends, identify the trend of the market. This means if the market is making higher highs and higher lows, the market is in an uptrend. And if we see lower lows and lower highs on the chart, it is a downtrend. We can also take the assistance of a simple moving average (SMA) to get a clear picture of the trend.

In the case of GBP/JPY, it is evident from the below image that the market is in a strong downtrend.


Step 2

Next, we need to wait for the price to go above the highest point visible on the chart, where we will be analyzing signs of a reversal to the downside. Similarly, we need to wait for the price to go below the lowest point visible on the chart, where we will be analyzing the signs of a reversal to the upside. For example, suppose the price is near its lowest point visible on the chart. In that case, we say that market may be reversing to the upside if a bearish candle closes below the lower band of the Bollinger Band, and the immediate next candle is a bullish candle that closes above the lower band. This has to be accompanied by the RSI moving into the oversold zone (below 30).

In case of a reversal of an uptrend, a bullish candle should close above the upper band of the Bollinger band with a bearish candle that closes below the upper band. At this price, the RSI should indicate an overbought situation of the market (above 70).

Step 3

This is the easiest step of the strategy where we have to only observe the movement of price following the ‘two-candle’ pattern discussed in the previous step. Essentially, we need to see that the price starts moving in the direction of the reversal, i.e., above or below the median line of Bollinger Band. This should again be accompanied by a rising RSI for ‘long’ entry and falling RSI for a ‘short’ entry.

In the below image, we can see how the rise in price above the median line goes with a sudden rise in RSI.

Step 4

In this step, we determine the stop-loss and take-profit for the trade done using this strategy. The stop-loss is placed just below the ‘low’ or above the ‘high’ from where the market reverses. However, there is no fixed take-profit level here. We exit a ‘long’ trade once RSI goes below 50 and start moving lower. While a ‘short’ trade is exited as soon as RSI goes past the level of 50.

As we can see in the image below, the market reversed fully, and the trade turned to be extremely profitable.

Strategy Roundup

When Bollinger Band and RSI are combined to generate trade signals, we can accurately identify the market top and bottom where we take advantage of the reversal. But this can only be done efficiently after practicing well. The above strategy is suitable for swing and part-time traders.

Categories
Beginners Forex Education Forex Assets

Quick Start Guide to Exotic Pairs

Currency pairs fall into one of three categories: major, minor, or exotic. Major pairs include the most traded currency pairs and always feature the US dollar. Some examples would include the EUR/USD, USD/JPY, GBP/USD, and USD/CHF. Minor pairs, otherwise known as cross-currency pairs, don’t include the US dollar. For example, GBP/JPY or EUR/AUD are both minor currency pairs. Exotic pairs typically consist of a major currency that is traded alongside a less traded currency, or a currency that comes from an emerging market. Here are some examples of exotic currencies:

  • TRY – Turkish Lira
  • HKD – Hong Kong Dollar
  • JPY – Japanese Yen
  • NZD – New Zealand Dollar
  • AUD – Australian Dollar
  • MXN – Mexican Peso
  • NOK – Norwegian Krone 
  • SGD – Singapore Dollar
  • ZAR – South African Rand
  • THB – Thailand Baht
  • DKK – Danish Krone
  • SEK – Swedish Krona 

You will see exotics traded against currencies like EUR/TRY, USD/HKD, JPY/NOK, NZD/SGD, and so on. These pairs can be more volatile and are not offered for trading by every broker. Some brokers pick and choose certain exotic pairs, while others might offer every exotic, or none at all. You can check your broker’s product list to see what is available.  

You might wonder whether it is a good idea to trade this type of currency. These pairs are undoubtedly more volatile than majors and minors, and we wouldn’t suggest trading exotics if you’re a beginner. Major and minor currencies are less risky because they are attached to stable economies, which are usually moved by interest rates and economic data. Political and economic instability have more of a driving force with exotics. The fact that less traders are trading exotics can also cause more drastic price movements and spreads tend to be wider with these instruments. After all, there’s a reason why many brokers limit their dealings with this type of instrument. 

While trading exotic pairs is risky, these types of instruments might suit one’s trading style in way that other instruments don’t. If you have a lot of experience and understand the market, then it might be worth investing in exotics with a long-term trading plan. On the other hand, traders should remember that you do not have to trade with these just because they exist. Sticking with majors and minors is a much safer option and there is nothing wrong with sticking to basics, especially where money is involved. If you’re determined to trade exotics, we would suggest practicing with a demo account first, so that you’ll be more prepared.

Categories
Forex Basic Strategies

How to Profit Using The ‘Gap and Leave’ Forex Trading Strategy

Introduction

Gap and Leave is an interesting trading strategy that utilizes one of the most distressing phenomena of the forex market, a weekly gap between the last Friday’s close and the current Monday’s open price. The gap takes its origin in the fact that the interbank currency market continues to react on the fundamental news during the weekend, which results in a kind of opening on Monday at the highest level of liquidity. Today’s strategy is based on the assumption that the gap is a result of speculations and excess liquidity. Therefore, a position in the opposite direction should become profitable after a few hours.

In the past few articles, we discussed strategies that were pertaining to ‘trend pullback.’ Now, we will shift our focus and talk about a strategy that is best suited for trading a ‘range.’

Time Frame

This strategy works well on the 15-minutes and 1-hour time frame. Traders looking to trade intraday should use the strategy on the 15-minutes time frame. While traders looking for swing trading opportunities should look at 1-hour charts.

Indicators

No indicators are being used in this strategy. It mostly relies on price action and market speculation.

Currency Pairs

This strategy is suitable for trading in currency pairs, which are volatile and liquid. Also, since the Asian market is the first one to open for trading after the weekend, we would suggest applying this strategy in currency pairs involving the Japanese yen, Australian dollar, and the New Zealand dollar.

Strategy Concept

Gap and Leave is an easy strategy that is based on simple price action and speculation. It is observed that events and occasions that occur during the weekend give rise to unfilled orders in the market, which leads to a gap on Monday. This gap is a result of speculation and sudden infusion of liquidity in the market, as an outcome of the event. Most of these events are not of great importance, which means they do not have long-lasting on the value of a currency.

This characteristic can be used to our advantage by entering at discounted prices. Here it is important to note that the gap should coincide with a technical level of support and resistance. As mentioned earlier, this is a ‘range’ trading strategy. The price must reach the extremes of the ‘range’ as a result of the ‘gap.’ The idea is to go ‘long’ at support and ‘short’ at resistance. But this is done by following all the rules of the strategy.

The strategy offers a high risk-to-reward since we are executing our trades at the lowest prices, keeping a target at the other end of the ‘range.’

Trade Setup

In order to explain the strategy, we shall consider an example where we will execute a ‘long’ trade-in GBP/NZD pair on the 15-minutes time frame. Here are the steps to execute the strategy.

Step 1

Firstly, we should identify a ‘range’ that is newly formed. By this, we mean, the price should have reacted from the top or bottom of the range at least twice and moved to the other end. At the same time, we need to also ensure that the ‘range’ is not very old. We should not be considering ‘ranges’ where the support and resistance levels have been respected more than 5-6 times.

In our example, we have identified a ‘range’ on the 15-minutes time frame where the price has reacted twice from the resistance and four times from the support.

Step 2

The next step is to watch for Friday’s closing price. The candle must close somewhere in the middle of the range. This is because if the market has to gap on Monday, the gap will take the price at one of the extremes of the range. If the candle closes at support or resistance on Friday, the price gap will lead to a breakout or breakdown that will violate the ‘range’ trade. Then we should look for a breakout strategy.

In the case of GBP/NZD, we can see that the price almost closes in the middle of the range.

Step 3

This is the most important step in the strategy. In this step, we watch the market’s behavior on Monday and see if it opens with a gap or not. If the market gaps down to the support of the range, we will look for taking a ‘long’ trade after a suitable confirmation. On the other hand, if the market gaps up to the resistance, we will take a ‘short’ trade provided we have followed all the steps discussed earlier. A bullish candle after ‘gap down’ is the confirmation for a ‘long’ trade, and a bearish candle after ‘gap up’ is the confirmation for a ‘short’ trade.

In the below image, we can see that the price forms a bullish candle after gapping down on Monday. Hence, we enter for a ‘buy’ at this close of the first candle.

Step 4

Lastly, we need to determine the stop-loss and ‘take-profit’ for the strategy. Stop-loss placement is pretty simple, where it is placed below the support when ‘long’ in the market and above the resistance when ‘short.’ We take our profits when the price reaches the other end of the range. This means at resistance when ‘long’ and at the support when ‘short.’ The risk-to-reward of trades using this strategy is above average, which is quite attractive.

Strategy Roundup

Gaps are one of the most common tools used by institutional traders due to the high probability of winning trades. This strategy is based on market movement that is only a consequence of speculation, which does not hold any value. If we are looking for a gap trading strategy in forex, the Gap and Leave strategy is a good one to start with because it is great for beginners who want a relatively easy entry, at a slow pace and not involving complex indicators.

Categories
Forex Assets

Forex Currency Pairs 101

You have probably heard about most of the available currencies such as the US Dollar, the British pound, and the Euro, the three of these currencies are traded within Forex as well as plenty of others. Each currency in the world has its own ISO code, this is often a three-letter abbreviation of the currency, on the rare occasion, this may be a four-letter abbreviation. The letters given to it are often related to the overall title of the currency, but in some cases such as with the Swiss Franc, it can be completely different as the Swiss Franc has CHF as its ISO.

We have outlined some of the major currencies below, there are of course a lot of other currencies available, however when you are starting out with trading and the foreign exchange markets, then you will most likely be concentrating on these slightly more major pairs.

So those are some of the main currencies, but when we trade in Forex, we are always trading one currency against another, these pairs of currencies are simply called currency pairs. They are the bread and butter and the buying and selling of these currency pairs is how we end up making money. So let’s have a look at what some of the main currency pairs that you should know and should be looking at trading when you are just starting out.

Major Pairs:

Euro Cross Pairs:

Pound Cross Pairs:

Yen Cross Pairs:

Other Cross Pairs:

Each currency has its own value that fluctuates up and down, the value of a US Dollar is $1, it will always be $1. However, $1 is not equal to £1. At the time of writing this £1 was worth almost exactly $1.26. So in the foreign exchange world, it would be written as GBP/USD = 1.26. It is always written as the base currency first, then the quote currency, and then the current exchange rate.

You are able to both buy and sell currencies, so let’s briefly look at what that means, thy can be summed up with a single sentence each:

Buy or Long = When you buy the base currency and sell the quote currency.

Short or Sell = When you sell the base currency and buy the quote currency.

So how do we make money? Let’s say we want to make a profit on this, we would buy into the pair, which means that we would be buying GBP with our USD for the value of 1.26 US Dollars to Great British Pounds. We would then hope that the value of your point would increase, so the exchange rate would move up to 1.27 or 1.28 (of course there are a  lot of extra decimals in there too). If that was to happen, when we sell back, we would have more dollars than we started with, giving us our overall profits.

That is in essence how the currency pairs work. Of course, there are far greater complications when we start looking at pairs that are completely different to our base currency, the good news is that you very rarely have to ever think about that, the broker that you are using will luckily be able to do all of the thinking and calculations for you, so all you need to look for is the fluctuations in the exchange rate between currency pairs. 

Hopefully, that has given you a little understanding of how things work, there’s a  lot to learn when it comes to trading, so it is good to sometimes keep things simple and to not give too much information at once. Take things one step at a time and you will manage to become successful in no time.


Categories
Forex Basic Strategies

Exploring The Forex Market Opportunities With The Help of ‘Volume’

Introduction

In the Forex market, we don’t really have a centralised exchange as we’re trading over the counter. This is the reason why it is so difficult to determine exact trading volumes in Forex. Even though there is no centralised exchange to provide us with the volume data, many forex broker’s and trading platforms keep track of the average volumes in a pair. Each retail broker will have their own aggregate trading volume. Platforms like TradingView also have a volume attached to their chart. We all have realised over time that volume in the forex market is an important indicator, which is the reason why we need the best volume indicator.

The volume indicator used to read the volume in the forex market is the Chaikin Money Flow indicator (CMF.) The CMF was developed by Marc Chaikin, who is a trader himself, and was coached by the most successful institutional investors around the world. The reason Chaikin Money Flow (CMF) the best volume indicator is that is measures institutional accumulation and distribution.

Normally, on a rally, the Chaikin volume indicator should be below zero. Conversely, on sell-offs, the indicator should be below the ‘zero’ line.

Time Frame

The strategy works well on the 1-hour and 4-hour time frame only. Therefore, we can say that it is a swing trading strategy and is not suitable for trading intraday.

Indicators

We will be using just one indicator in this strategy, and that is the Chaikin Money Flow indicator (CMF.) The rest all is based on price action.

Currency Pairs

The strategy is suitable for trading in almost all currency pairs that are listed on the broker’s platform. But we need to make sure that the forex pair has enough trading volume.

Strategy Concept

Volume trading requires us to pay careful attention to the forces of demand and supply. Volume traders look for instances of increased buying or selling orders. They also pay attention to the current price movement and trend of the market. Generally, increased trading volume leans towards heavy buy orders. These positive volume trends will prompt us to open new positions on the ‘long’ side of the market, depending on the price action.

On the other hand, if trading volumes and cash flow decrease—it indicates a “bearish divergence. This may be appropriate to sell. We will pay attention to the relative volume—regardless of the number of transactions occurring in a trading period. By learning how to use the Chaikin money flow and other relevant indicators, we will be able to identify whether to ‘buy’ or ‘sell.’

With practice, the volume trading strategy can yield a win rate of 75%!

Trade Setup

In order to explain the strategy, we have considered the chart of EUR/USD, where we will be illustrating a ‘long’ trade using the rules of the strategy.

Step 1

Firstly, look for a price reversal in the market or a price action that reverses an established downtrend or uptrend. This is an easy and simple step that requires us to have a basic understanding of price reversal. This reversal should be accompanied by the rising Chaikin volume indicator that shoots up in a straight line from below zero to above the ‘zero’ line, during the reversal of a downtrend. In an uptrend, the slope should be downwards, i.e., from positive to negative.

When the volume indicator goes negative to positive in a strong fashion, it shows an accumulation of smart money.

Step 2

Wait for the price to pullback near the previous lower low after an upward reversal. Likewise, wait for the price to pullback near the previous higher high. The Volume Indicator should also pullback in a similar manner. If the pullback is coming in slowly, the trade has a higher probability of performing. If the pullback is strong, we will exercise some caution.

When the volume indicator is decreasing and drops below zero, we have to make sure that the price remains above the swing low. If the market is satisfying all the conditions of the strategy until now, we can move on to the next step.

Step 3

Wait for the Chaikin volume indicator to break back above the zero lines. We enter for a ‘buy’ once a ‘higher low’ is confirmed, and the price starts moving in the direction of the reversal. In a reversal of an uptrend, the Chaikin indicator should break below the ‘zero’ line. We enter for a ‘sell’ once a ‘lower high’ is confirmed, and the price starts moving lower. Once the institutional money comes back in the market, we wait for them to step back and drive the market.

The below image shows a ‘higher low’ being formed along with the volume breakout.

Step 4

This brings us to the next important step, where we establish protective stop-loss and take-profit for the strategy. We place stop-loss below the ‘higher low’ that confirmed the reversal when ‘long’ in the pair and above the ‘lower high ‘when ‘short’ in the currency pair. This strategy indicates a strong reversal in the market that will change the trend of the market. This is why we set our ‘take-profit’ at the origin of the previous trend.

In our example, the risk-to-reward of the trade was over 1:2, which is great.

Strategy Roundup

The volume trading strategy will continue to work in the future; it is based on the activities of the smart money. Even though they hide all their operations, their footprints are still visible. We can read those marks by using proper tools. The Chaikin indicator will add value to our trading because it gives a window into the volume activity the same way we traded the stocks. Make sure to follow this step-by-step guide to trade properly using volume.

Categories
Forex Basic Strategies

Learning To Trade The ‘Turn To Trend’ Forex Strategy

Introduction

Although many times before, we have stressed on trading with the direction of the market, yet most traders have a hard time trading with the trend. The observation is contrary to what is said by experts and professional traders since the majority of retail traders claim to be trading with the trend but end up trading counter-trend. While everyone talks of the idiom, “the trend is your friend,” in reality, most traders love to pick tops and bottoms and constantly violate the above rule.

Time Frame

The strategy is fixed to two-time frames. The daily time frame for trend identification and the 1-hour time frame for trade entry.

Indicators

We use the following technical indicators for the strategy:

  • 20-period SMA
  • Three standard deviations Bollinger band (3SD)
  • Two standard deviations Bollinger band (3SD)

Currency Pairs

This strategy is applicable to most of the currency pairs listed on the broker’s platform. However, exotic pairs should be avoided.

Strategy Concept

This setup recognizes the desire of most traders to buy low and sell high but does so in the predominant framework of trading with the trend. The strategy uses multiple time frames and a couple of indicators as it’s a tool for entry. First and foremost, we look at the daily chart to ascertain of the pair in a trend. For that, we use the 20-period simple moving average (SMA), which tells us the direction of the market. In technical analysis, there are numerous ways of determining the trend, but none of them is as simple and easy as the 20-period SMA.

Next, we switch to the hourly charts to find our ‘entry.’ In the ‘Turn to Trend’ Strategy, we will only trade in the direction of the market by buying highly oversold prices in an uptrend and selling highly overbought prices in a downtrend. The question arises, how do we know the market is overbought or oversold? The answer is by using Bollinger bands, which help us gauge the price action.

Bollinger bands measure price extremes by calculating the standard deviation of price from its moving average. In our case, we use the three standard deviation Bollinger band (3SD) and Bollinger band with two standard deviations (2SD). These two create a set of Bollinger band channels. When price trades in a trend, most of the price action will be contained within the Bollinger bands of 2SD and 1SD.

Trade Setup

In order to illustrate the strategy, we have considered the chart of EUR/CAD, where we will be applying the strategy to take a ‘long’ trade.

Step 1

The first step is to identify the major trend of the market. This can be done using the 20-period simple moving average (SMA). If the price is very well above the SMA, we say that the market is in an uptrend. Likewise, if the price is mostly below the SMA, we say that the market is a downtrend. For this strategy, we have to determine the trend on the daily chart of the currency pair.

In our case, we see that the market is in a strong uptrend, as shown in the below image. Hence, we will enter for a ‘long’ trade at the price retracement on the 1-hour time frame.

Step 2

Next, we have to change the time frame of the chart to 1 hour and wait for a price retracement. In order to evaluate the retracement, we plot three standard deviations (3SD) and two standard deviations (2SD) Bollinger band on the chart. After plotting the two Bollinger bands, we need to wait for the price to get into the zone of 2SD-3SD BB.

In the below image, we can see that the price breaks into the zone of 2SD-3SD BB after a lengthy ‘range’ movement.

Step 3

Once the price moves into the zone of 2SD-3SD BB, we wait for the price to bounce off from the lower band of the 3SD BB to give an indication of a reversal. In a ‘short‘ set up, the price should react off from the upper band of the 3SD BB, and give an indication of downtrend continuation. During this process, we need to make sure that the price does not break below or above the 3SD BB. Because if this happens, the ‘pullback’ is no more valid, and this could be a sign of reversal. This is a crucial aspect of the strategy.

The below image shows how the price bounces off from the lower band of the 3SD BB two candles after the price moves into the zone.

Step 4

We enter the market at the first sign of trend continuation, which was determined in the previous step. Now we need to define the stop-loss and take-profit for the strategy. Stop-loss should be placed below the lower band of the 3SD BB, in case of a ‘long’ trade and above the upper band of the 3SD BB, in a ‘short’ trade. The ‘take-profit’ is not a fixed point. Instead, we take our profit as soon as the price touches the opposite band of the 3SD BB.

In the case of EUR/CAD, the resultant risk-to-reward of the trade was a minimum of 1:2, as shown in the below image.

Strategy Roundup

The beauty of this setup is that it prevents us from guessing the turn in the market prematurely by forcing us to wait until the price action confirms a swing bottom or a swing top. If the price is in a downtrend, we watch the hourlies for a turn back to the trend. If the price continues to trade between the 3SD and 2SD BB, we stay away as long as we get confirmation from the market. We can also set our first take-profit at 1:1 risk to reward to lock in some profits.

Categories
Forex Assets

Asset Analysis – Trading Costs Involved While Trading The CAD/AED Currency Pair

Introduction

CAD/AED is a Forex exotic currency pair, where CAD represents the currency of Canada, an AED is the currency of the UAE. In this exotic currency pair, CAD is the base first, and AED is the second currency.

Understanding CADAED

This pair’s price determines the value of AED, which is equivalent to one CAD. We can term it as 1 CAD per X numbers of AED. For example, if the CAD/AED pair’s value is at 2.8007; therefore, we need almost 2.8007 AED to buy one CAD.

CADAED Specification

Spread

In every financial market, Spread represents the difference between the Bid and Ask. It is usually a charge that is deducted by the forex broker. This value changes with the type of execution model.

Spread on ECN: 10 pips | Spread on STP: 15 pips

Fees

The trading fees in the forex market and stock market are the same. It is deducted from the traders’ accounts as soon as they open a new position. Note that STP accounts do not charge anything, but a few pips charges on ECN accounts.

Slippage

Slippage happens when price opens above or below the execution level. Slippage occurs because of two important reasons – market volatility and broker’s execution speed.

Trading Range in CADAED

Procedure to assess Pip Ranges

  1. Add the ATR indicator to your chart
  2. Set the period to 1
  3. Add a 200-period SMA to this indicator
  4. Shrink the chart so you can assess a large time period
  5. Select your desired timeframe
  6. Measure the floor level and set this value as the min
  7. Measure the level of the 200-period SMA and set this as the average
  8. Measure the peak levels and set this as Max.

CADAED Cost as a Percent of the Trading Range

The volatility values on the above table indicate how the cost varies with the change in market volatility. All we did is to get the ratio between the total cost and the volatility values and converted them into percentages.

ECN Model Account 

Spread = 10 | Slippage = 5 | Trading fee = 8

Total cost = Spread + Slippage + Trading Fee

= 10 + 5 + 8 = 23

STP Model Account

Spread = 10 | Slippage = 5 | Trading fee = 0

Total cost = Spread + Slippage + Trading Fee

= 10 + 5 + 0 = 15

The Ideal way to trade the CADAED

The CADAED is an exotic cross currency pair with higher volatility and liquidity. Because of this, traders may find it easy to trade in this pair. We can see that the percentage values above where the value did not move above 230% that represents a higher trading cost in the lower timeframe. However, when we move to the monthly timeframe, the average cost came to below 2%.

Therefore, trading intraday in this currency pair is risky due to the high trading cost. On the other hand, trading in a higher timeframe has less cost, but it requires a lot of patience and time. Overall, for every trader, it is recommended to stick on trading where the trading cost is at the average value.

Another way to reduce the cost is to place a pending order as ‘limit’ and ‘stop’ instead of ‘market.’ In that case, there will be no slippage in the calculation of the total costs. So, in our example, the overall cost will be reduced by five pips.

STP Model Account (Using limit orders) 

Spread = 10 | Slippage = 0 | Trading fee = 0

Total cost = Spread + Slippage + Trading Fee

= 10 + 0 + 0 = 10

Categories
Forex Fundamental Analysis

Understanding The Importance Of ‘Small Business Sentiment’ In The Forex Market

Introduction

Small Businesses and self-employed account for a large portion of the private sector. Small and medium scale businesses’ success and failure impact a large section of the country’s population. Critical economic indicators like employment rate, consumer spending, GDP are all directly affected by the performance of small scale businesses. By paying attention to small business sentiment indices, the severity of economic conditions can be assessed more accurately, helping us to form more informed investment decisions.

What is Small Business Sentiment?

Small Business

The definitions of a small business differ across corporations, regions, and countries. The Australian Bureau of Statistics (ABS) defines a small business as an independent and privately owned, managed by an individual or a small group of people, and have less than 20 employees. A business having 20-199 employees is termed a medium scale business.

Small Businesses are generally diverse, but broadly they can be segregated into a few broad categories, though. One of those sectors includes providing services to other businesses and households that can include professionals like plumbers, home doctors, electricians, etc. Another sector includes retail outlets like grocery, bars, saloons, etc. Finally, another sector that these businesses can be categorized into is the niche service and goods providers in the manufacturing, construction, and agricultural sectors.

Given the diversity, a large number of activities are taken up by these businesses. In many areas where large businesses cannot reach out due to lack of business viability, these small ones plug the gap. For instance, a remote area having a population of about 50-100 people would not be suitable for a supermarket; instead, a small private grocery shop would do the trick.

Small Business Sentiment indices try to measure the general sentiment towards the business outlook in the current and coming months. Since the sentiment is abstract, the numbers are not precisely quantifiable and differ from person to person. Still, the sentiment indices are calculated as an average of a selected sample of small businesses every month or quarter. Higher and more positive numbers indicate a positive outlook towards business prospects and indicate the economy is likely to grow and prosper. On the other hand, low and negative numbers indicate a weak business prospect, and the economy is likely to slow down.

How can the Small Business Sentiment numbers be used for analysis?

In the case of Australia, that has over two million businesses that come under the category of small businesses, which is over 95% of the entire business sector. The large and established business sectors contribute to the remaining 5%. Since the failure rate of small businesses is quite high in any economy compared to the business giants, focusing on it gives us more accurate and economy sensitive data.

While big corporations generally have their profits nearly constant with mild swings during all business cycles, the small businesses are more sensitive, and their P/L (Profit/Loss) swings quite wildly over business cycles. Small businesses are more vulnerable and take a bigger hit from economic shocks resulting in closures or filing bankruptcy. In contrast, larger businesses are more resilient and can weather economic storms.

The small businesses contribute to a large share of employment; in Australia, it accounted for 43% of total employment. Small businesses are also generally the source of innovations where the smaller size of the organization gives room for the more creative expression of employees. For instance, in the video gaming industry, some of the most innovative gameplay mechanics have come from indie studios (small remote studios) that have had humble beginnings.

Overall the small-business sentiment gives more economy-sensitive data, where the direct impact and severity of economic conditions can be easily measured. The footprint of large businesses in terms of global or nationwide presence masks the underlying weaker economic growth in particular areas. For instance, an international giant like Sony may have had poor sales in the music industry, which are not reflected in its final sales figures if they had a good sale in the electronics department.

The high failure rate of small businesses can broadly impact the employment rate, consumer spending. The large scale failure of small businesses can be in general attributed to weak economic conditions, less consumer demand, high dollar value, lack of additional or tolerant policy from the Government to support small and medium businesses.

Impact on Currency

As the currency markets deal with macroeconomic indicators, small business sentiment indicators are overlooked for the broader and more inclusive business sentiment indicators like AIG MI (Australia Industry Group Manufacturing Index). The small business sentiment is useful for a more in-depth analysis of small regional companies and is useful for equity traders focusing on small company stocks. It is also useful for the Government officials to understand and draw out any support policies to maintain employment rate, and avoid bankruptcy to small-scale businesses.

It is also worth noting that not all countries maintain sentiment indices for small businesses, which makes analysis and comparison difficult for currency traders. Currency traders generally look for economic conditions across multiple countries to decide on investing in a currency; in that case, small business indices are not useful. Overall, it is a low-impact leading economic indicator that the currency markets generally overlook due to other alternative macroeconomic leading indicators.

Economic Reports

In Australia, the National Australian Bank publishes monthly and quarterly reports on the performance of small-business and their prospects on its official website. A detailed report on how different sectors are faring during current economic conditions and probable business directions are all listed out in the reports.

The National Federation of Independent Business (NFIB) Small Business Optimism Index is famous in the United States for reporting monthly small business sentiment on its official website.

Sources of Small Business Sentiment Indices

We can find the Small Business Sentiment indices for Australia on NAB. We can find consolidated reports of Small Business Sentiment for available countries on Trading Economics along with NFIB statistics.

How Small Business Sentiment Data Release Affects The Price Charts?

As mentioned earlier, the National Australian Bank (NAB) is the primary source of business sentiment in Australia. The bank publishes monthly, and quarterly NAB Business Sentiment reports. The most recent report was released on August 11, 2020, at 1.30 AM GMT and can be accessed at Investing.com here. A more in-depth review of the monthly business survey in Australia can be accessed at the National Australian Bank website.

The screengrab below is of the NAB Business Confidence from Investing.com. On the right, is a legend that indicates the level of impact the Fundamental Indicator has on the AUD.

As can be seen, low impact is expected on the AUD upon the release of the NAB Business Confidence report. The screengrab below shows the most recent changes in business confidence in Australia. In July 2020, the index improved from -8 to 0, showing that business sentiment in Australia improved during the survey period. Therefore, it is expected that the AUD will be stronger compared to other currencies.

Now, let’s see how this release made an impact on the Forex price charts.

AUD/USD: Before NAB BC Release on August 11, 2020, Just Before 1.30 AM GMT

As can be seen on the above 15-minute chart, the AUD/USD pair was trading on a neutral pattern before the NAB Business Confidence report release. This trend is evidenced by candles forming on a flattening 20-period Moving Average, indicating that traders were waiting for the news release.

AUD/USD: After NAB BC Release on August 11, 2020, 1.30 AM GMT

After the news release, the pair formed a 15-minute bullish candle. As expected, the AUD adopted a bullish stance and continued trading in steady uptrend afterward with a sharply rising 20-period Moving Average.

Now let’s see how this news release impacted other major currency pairs.

AUD/JPY: Before NAB BC Release on August 11, 2020, Just Before 1.30 AM GMT

Before the news release, the AUD/JPY pair was shifting its trading trend from neutral to an uptrend. Bullish candles are forming above the 20-period Moving Average.

AUD/JPY: After NAB BC Release on August 11, 2020, 1.30 AM GMT

Similar to the AUD/USD pair, the AUD/JPY pair formed a bullish 15-minute candle after the news release. The pair later continued trading in a steady uptrend.

AUD/CAD: Before NAB BC Release on August 11, 2020, Just Before 1.30  AM GMT

AUD/CAD: After NAB BC Release on August 11, 2020, 1.30 AM GMT

The AUD/CAD pair was trading in a similar neutral pattern as the AUD/USD pair before the news release. This trend is shown by candles forming on and around a flat 20-period Moving Average. After the news release, the pair formed a bullish 15-minute candle and adopted a bullish uptrend, as observed in the previous pairs.

Bottom Line

Theoretically, the small business sentiment is a low-impact indicator. However, in the age of Coronavirus afflicted economies, it has become a useful leading indicator of economic health and potential recovery. This phenomenon is what propelled the NAB Business Confidence indicator to have the observed significant impact on the AUD.

Categories
Forex Basic Strategies

Combining Moving Averages with Parabolic SAR To Generate Accurate Trading Signals

Introduction

Trend trading is a great way to earn money from the forex market. Any retail trading strategy based on a trend continuation pattern works well when it moves within a trend.  Therefore, in this trading strategy, we will take trades from minor corrections using the parabolic SAR towards the trend.

Furthermore, we will use a 100-period exponential moving average to determine the trend. If the price is trading above the 100 exponential moving average, we will consider the trend as an uptrend. If the price is trading below the 100-period exponential moving average, it will consider it a downtrend. We will follow a simple logic by considering buying trades when the market moves up and considering sell trades when the market is moving to drown.

However, there are no specific rules about the period of your moving average. Some traders are comfortable with 100 EMA, while some traders are compatible with 20 EMA or SMA. Therefore, if you’re trading in a lower timeframe, you can use any moving average from 20 to 100 periods. However, we will focus on 100 EMA as it provides good profitability based on swing trading ideas.

Why Should We Use Parabolic SAR?

Parabolic SAR is a forex trading indicator that stands for “stand and reverses.” This trading indicator was devised by J Welles, represented by some dots below and above the candlestick. In an uptrend, dots remain below the price and indicates a bullish pressure once the price is rejected from these dots. Similarly, in a downtrend, the dots form above the price, and the price starts to move once it gets rejected from the parabolic SAR.

In the image below, we can see a clear chart of the candlestick pattern.

Let’s plot the parabolic SAR in the price chart and see how it looks like.

It is visible that in an uptrend, Parabolic SAR is below the price, and in a downtrend, the parabolic SAR is above the price. This is why the parabolic SAR is considered as a stop and reverse indicator.

Furthermore, the parabolic SAR has a built-in stop-loss function. Once the price moves up or down with a new candle, the parabolic SAR changes with the price. Therefore, you can move your stop loss once the price creates a new higher or lower low. Furthermore, you can edit the primary parameter of Parabolic SAR from the indicator’s setting, but in this trading strategy, we will use the default format.

Moving Average with Parabolic SAR

If we use a 100-period exponential moving average, we can catch the major trend direction from the minor correction. The forex market Moves Like a zigzag. Therefore, there is a minor correction in a major bullish trend and minor bullish correction in a major downtrend. If we know the major trend, we can quickly enter the trade from a correction to get the maximum reward from the minimum risk.

In the forex market, parabolic SAR usually provides trading signals earlier than expected, which might create a negative impact on your trading result. Overall, any trend following indicator does not provide a good result when the price moves within a range. In most of the cases, markets follow the trend of about 35% of the time. Therefore, it is essential to filter out the conditions where the market is moving within a range.

We can eliminate the unexpected market behavior by using the 100 moving average as it will provide a more significant trend that will prevent over-trading. In the image below, we can see how the parabolic SAR provides false trading signals when the market moves within a range.

In the ranging market, it would be difficult to make a profit using this trading strategy. Therefore, it is better to use the 100 moving average to get the overall direction of the trend.

Moving Average With Parabolic SAR Trading Rules

Every trading strategy has its unique rules. In the moving average with the Parabolic SAR trading strategy, our main aim is to follow the trend towards the direction of 100 EMA.

Overall, we will follow simple rules as Complex trading rules make it challenging to implement it on the chart. You can make good profits with a simple trading strategy if you can utilize it well with appropriate trade management and money management rules.

Timeframe

The moving average with the Parabolic SAR trading strategy works well in all timeframes from 5 minutes to weekly charts. The longer timeframe will provide better trading results. However, it is better to stick to the 1 hour to daily chart as it can cover fresh moves driven by banks and financial institutes.

Currency Pair

There is no obligation to use a currency pair. However, it is better to use a currency pair that does not remain within a range for a long time like EURCHF. Therefore, all major and minor pairs are good to go with this trading strategy.

Buy Entry (Inverse for Sell Entry)

  • Identify the price above the 100 periods moving average. If the price is choppy at the 100 EMA, Ignore the price chart, and move to another market.
  • Identify the parabolic SAR to point dots below the candlestick, which will be a buy signal (above the candlestick is a sell signal).
  • Later on, place a buy stop order above the candlestick high.
  • Put your stop loss below the printed dot with some buffer.

Example of Parabolic SAR Strategy

At the image below and see how parabolic SAR provided a buy trade setup.

  • Notice that the price is moving in a range at the 100 EMA area with a violation. The blue horizontal line represents the support and resistance level, where the price is consolidating. In this consolidation, we will not take any trade.
  • If you look at the price structure, you can see the price is moving within a range from their resistance to support. On the price move above the 100 exponential moving average, you should put a pending order above the range, projecting that it will break out from the resistance level and create an impulsive bullish pressure.

Stop Loss and Take Profit Set

When you put the pending order above the resistance level, you should put a stop loss below red dots that have appeared below the candlestick. While setting the stop-loss, make sure to use some buffer of 10 to 15 pips.

Later on, hold the price until it points red dots above the price. The red dot above the price will indicate that sellers are entering the market, and there is a possibility to create a new lower low. Furthermore, while sitting the stop loss and take profit, you should follow the basic rules of price action, including the breakout and pullback.

Summary

Let’s summarize the moving average with the Parabolic SAR trading strategy:

  • You should look for a fresh trending movement above or below 100 exponential moving average.
  • Parabolic dots below the price will provide buy-entry, and parabolic dots above the price will indicate sell-entry.
  • You should avoid ranging markets where the price might violate parabolic dots.

Moreover, trade management and good trading psychology are mandatory for every trading strategy. You cannot make a decent profit until you know how to minimize the risk to get the maximum benefit from trade.

Categories
Beginners Forex Education Forex Assets

Trading the AUD/NZD Currency Pair

Most traders nowadays trade pairs involving currencies such as EUR and USD because they have found such currencies to provide them with the best results. However, once paired, some of the other major currencies we trade in the forex market are said to be extremely profitable trades due to their unique traits. The AUD/NZD currency pair, for example, has been praised by a portion of professional traders who have recognized its great potential. According to these supporters, the nature of this currency pair, or what it is and what it is not in other words, is what makes it so different from all other combinations, making it to some traders’ list of favorites.

If you are a technical trader who keeps looking for ways to evade news and hectic market activity knocking traders’ stop losses, you may find this currency pair particularly interesting despite what you may have heard about it before. Especially during the times of some important events (such as Brexit) or the involvement of some important individuals and organizations (e.g. the European Union), you will find how some of the more popular currency pairs, such as EUR/GBP and GPP/CHF, are heavily encumbered by the surrounding hype and needless news popping up every minute or so. In this case, traders are faced with a few options: give in to the upcoming news events, avoid trading news, and/or avoid trading the affected currencies. What is more, with trading other currency pairs comes the danger of encounter some really choppy periods we can see for ourselves if we take a look at the daily chart. Solidation, on the other hand, is a process traders mostly accept as part of the currency market, but some other downsides of trading popular currency pairs may not always be shared transparently and objectively through all available sources of educational material.

There are quite a few reasons why traders may eventually learn to enjoy trading the AUD/NZD currency pair. Firstly, the pair in question does not involve USD, the currency that is heavily monitored by the big banks whose impact on the market is profound. Secondly, both AUD and NZD are risk-on currencies, which makes trading much easier. Some other currency pairs such as AUD/JPY or EUR/USD entail the risk-on/risk-off challenge, which ties the forex traders close to the activity in the stock market. While trading risk-on/risk-off pairs the market moves exceptionally violently and this may overthrow almost any technical expertise and, thus, affect traders. By entering such trades, you are in fact taking on the risk of not having much control because of dealing with external factors. However, when you are trading two currencies which are both risk-on, you are to an extent trading a pair with no conflicting agendas.

With AUD and NZD being both risk-on currencies, you can feel at ease knowing that you are in fact trading currencies that are both heading in the same direction, further eliminating your list of external factors you ought to be concerned about. Therefore, as you are trading AUD against NZD, you are trading a pair without needing to worry about any derailment on the path to securing your pips. What is more, despite these currencies’ similarities, they still do not exhibit much correlation in the sense that traders sometimes feel annoyed when both currencies go up and down at the same time. In such cases, the correlating movement directly impedes trading as traders cannot trade until this unnerving parallel movement comes to an end. Luckily, while the AUD/NZD pair can at times display similar behavior, it hardly occurs as often as it does with some other currency pairs.

With regard to news, the forex traders who are trading this pair feel relieved because most news comes early in the trading day. Experienced traders using the daily chart who are fond of the AUD/NZD pair claim to trade approximately 20 minutes before the daily candle closes. Such an approach typically leaves them with several hours before any relevant news comes out. In case they find the news to be going against them, they can then still have the remaining 20 hours for the price to take a different turn. According to those who are used to trading the AUD/NZD, many times the price overacts to the news but eventually corrects itself. Should the news, therefore, appear to be negative in any way, traders need not worry since the price often either returns to its initial position or takes the direction the trader favors as the close of the candle approaches.

If we compare this pair with the ones involving USD, we should take into consideration the factor of time, which is in that case reduced to only a few hours. USD-based trades entail a considerably limited amount of time for the price to change and end up going the way traders may need them to. AUD/NZD, however, does not pose a challenge in this regard due to the fact that price generally either trends or consolidates. Even if consolidation worries you, professional traders say how a good choice of a volume indicator can help traders evade most consolidation patterns even though this pair is more likely to trend than cause problems. The chart below reflects how this currency pair is not prone to creating any choppy trends we may witness in some other pairs’ charts. Nevertheless, even if you find yourself trapped in one of such unfavorable trend, experts affirm that the result would not be more than one or two losses. They also add that traders should not fear these areas in the chart because if you keep trading, such losses would eventually be eliminated, unlike with some other currency pairs.

The EUR/USD chart reflecting the same period leaves an entirely different impression. Not only is the price moving too rapidly, but traders can hardly make a profit equal to that of AUD/NZD. By relying on a useful trend indicator, you will be able to know exactly when you should start trading, thus avoiding periods of price consolidation. When a chart is too choppy and the price is moving in a hectic manner, even the best indicators may not be able to detect the activity on the chart. You can, therefore, receive false signals and take unnecessary losses just by trading a currency pair that is prone to these erratic movements. Luckily this is more common for pairs such as EUR/USD than it is for the AUD/NZD currency pair. If your system can handle trading other currency pairs, rest assured that it will take you through AUD/NZD trades with ease. Nonetheless, this does not imply that you should not have a set plan for this currency pair regardless of the benefits that naturally come along.


Traders should primarily be prepared to take each trade for which they get a signal even though they may at times get several signals at the same time. Should you need to decide whether to trade AUD/NZD long and AUD/JPY long with a 2% risk, professional traders would advise you to enter the AUD/NZD trade without splitting the risk because of the increased chance of winning. Even though you are taking on the entire risk on one currency pair, understand that the likelihood of winning is much greater. What is more, even when you are testing your system, you can skip this currency pair because it commonly provides favorable trading conditions. Therefore, if you would like how your system operates on some more difficult currencies, you can test USD pairs, but testing AUD/NZD is assumed to be needless because of everything we have discussed earlier. You can also test AUD/NZD first to assess your algorithm because, if it does not work properly with this currency pair, it is much more likely to cause a disaster with some other currency pairs.

It seems that AUD/NZD is not talked about at great lengths in forex traders’ favored media, but the sources that do go into details appear to be extremely satisfied with the results they get from trading this currency pair. Some professional traders even say how the only reason this pair makes the second (and not the first) place is that they cannot enjoy any giant moves with AUD/NZD. Traders’ experiences and trading methods may differ, but this article still reflects an innovative approach to trading and making use of the two currencies. If you have yet to test this currency pair, you will hopefully discover the same benefits professional traders claim to exist, finding reasons to keep trading AUD/NZD. Last but not least, whether you learn to love AUD/NZD for the ability to test your algorithm or the opportunity to avoid choppy trends, trading this currency pair will surely be an interesting experience, especially for those of you who favor calm waters over some news-heavier or more unpredictable currency pairs.

Categories
Forex Assets

Asset Analysis – Trading The NZD/SEK Exotic Cross Currency Pair

Introduction

NZD/SEK is the acronym for the currency pair New Zealand dollar versus the Swedish Krona. It is marked under the exotic cross-currency pair category. In this pair, NZD will be the base currency, and SEK will be the quote currency. In this article, we shall understand everything about trading this currency pair.

Understanding NZD/SEK

The price of this pair in the foreign exchange market determines the value of SEK comparable to one NZD. It is quoted as 1 NZD per X SEK. So, if the value of this pair is 5.8296, these many Swedish Kronor (SEK) are required to purchase one NZD.

Spread

Trading the Forex market usually does not involve spending a lot of fees like the Stock market. Here, Forex brokers make profits through spreads. It is nothing but the difference between Bid – Ask prices of an asset. Some broker has the cost inherent into the buy and sell prices of the currency pair; instead of charging a separate fee. Below are the spread values of ECN and STP brokers for the NZD/SEK pair.

ECN: 48 pips | STP: 53 pips

Fees

A Fee is the charges we pay to the stockbroker for executing a particular trade. The fee fluctuates from the type of broker we choose. For example, the fee on the STP accounts is zero, but we can expect a few additional pips on ECN accounts.

Slippage

Slippage is the contrast between the price expected by the trader for execution and the price at which the agent executed the price. There is this variation due to the high market volatility and more passive execution speed.

Trading Range in NZD/SEK

The trading range is used at this point; to measure the volatility of the NZD/SEK pair. The amount of money we will gain or lose in an allotted timeframe can be evaluated using the trading range table. The minimum, average, and maximum pip movement of the currency pair is exemplified in the trading range. This can be evaluated simply by using the ATR indicator combined with 200-period SMA.

Procedure to assess Pip Ranges

  1. Add the ATR indicator to your chart
  2. Set the period to 1
  3. Add a 200-period SMA to this indicator
  4. Shrink the chart so you can assess a large time period
  5. Select your desired timeframe
  6. Measure the floor level and set this value as the min
  7. Measure the level of the 200-period SMA and set this as the average
  8. Measure the peak levels and set this as Max.

NZD/SEK Cost as a Percent of the Trading Range

The rate of trade varies on the stockbroker and fluctuates according to the volatility of the market. This is because the trading cost includes fees, slippage, and the spread. The rate of variation in terms of percentage is given below.

ECN Model Account

Spread = 48 | Slippage = 5 |Trading fee = 8

Total cost = Slippage + Spread + Trading Fee = 5 + 48 + 8 = 61

STP Model Account

Spread = 53 | Slippage = 5 | Trading fee = 0

Total cost = Slippage + Spread + Trading Fee = 5 + 53 + 0 = 58

The Ideal way to trade the NZD/SEK

The NZD/SEK is termed as an exotic-cross currency pair and has a low volatile market. Looking at the pip range table, the average pip movement on the 1H timeframe is 115 pips, which implies high volatility. As we know, the higher the volatility, the smaller will be the cost to implement the trade. Nonetheless, this is not a benefit to trading in a volatile market; it involves higher risk.

For instance, in the 1M time frame, the Maximum pip range value is 1938, and the minimum is 503. When we evaluate the trading fees for both the pip movements, we notice that for 503 pip movement fees is 12.13%, and for the 1938 pip movement, fess is only 3.15%. Therefore, from the above instance, we can determine that trading the NZD/SEK currency pair will be on the expensive side.

Categories
Forex Assets

NZD/PLN – Analyzing This Exotic Forex Currency Pair

Introduction

NZD/PLN is the short form of the currency pair New Zealand dollar vs. Polish Zloty. Here, the New Zealand dollar (NZD) is the base currency, and the Polish Zloty (PLN) is the quote currency. In this article, we intend to comprehend everything you need to know about trading this currency.

Understanding NZD/PLN

The price of NZD/PLN signifies the value of the Polish Zloty corresponding to one New Zealand Dollar. It is estimated as 1 NZD (New Zealand Dollar) per X PLN (Polish Zloty). So, if the market value of NZD/PLN is 2.4940, these many Polish Zloty are required to buy one NZ dollar.

Spread

The distinction between the ask & bid costs is recognized as the spread. It changes with the implementation model used by the stockbrokers. Further down are the spreads for NZD/PLN currency pairs in both ECN account models & STP account models:

ECN: 30 pips | STP: 35 pips

Fees

There are certain charges levied by the broker to open every spot in the trade. These charges can be referred to as the commission or fees applicable to the trade. Note that these charges are only applicable to the ECN accounts and not on STP accounts. However, a few additional pips are changed on STP account models.

Slippage

Due to high market volatility and the broker’s slow implementation speed, slippage is common. It is a variance in price intended by the trader and price implemented by the broker.

Trading Range in NZD/PLN

The trading range is essentially a tabular interpretation of the pip movement in the NZD/PLN currency pair for distinct timeframes. These figures can be used to ascertain the trader’s risk as it helps us determines the approx. gain/loss that can be incurred on a trade.

Procedure to assess Pip Ranges

  1. Add the ATR indicator to your chart
  2. Set the period to 1
  3. Add a 200-period SMA to this indicator
  4. Shrink the chart so you can assess a large time period
  5. Select your desired timeframe
  6. Measure the floor level and set this value as the min
  7. Measure the level of the 200-period SMA and set this as the average
  8. Measure the peak levels and set this as Max.

NZD/PLN Cost as a Percent of the Trading Range

The total cost consists of slippage, trading fee, and the spread. This fluctuates with the volatility of the market. Therefore, traders need to place themselves to avoid paying high costs. Below is a table demonstrating the variation in the costs for various values of volatility.

ECN Model Account

Spread = 30 | Slippage = 5 |Trading fee = 8

Total cost = Slippage + Spread + Trading Fee = 5 + 30 + 8 = 43 


STP Model Account

Spread = 35 | Slippage = 5 | Trading fee = 0

Total cost = Slippage + Spread + Trading Fee = 5 + 35 + 0 = 40

The Ideal way to trade the NZD/NOK

NZD/PLN is an exotic-cross currency pair. In this case, we can see, the average pip movement in 1hr timeframe is 46, which signifies higher volatility. The smaller the volatility, the higher is the risk, and lesser is the cost of the trade and the other way around. For example, we can see from the trading range that when the pip movement is lesser, the charge is higher, and when the pip movement is higher, the charge is smaller.

To further decrease our costs of trade, the costs can be reduced even more by placing orders as a limit or stop as an alternative to the market orders. In executing so, the slippage will become zero and will lower the total cost of the trade further. In doing so, the slippage will be eliminated from the computation from the total costs. And this will assist us in decreasing the trading cost by a significant margin. An instance of the same is given below using the STP model account.

STP Model Account (Using Limit Orders)

Spread = 35 | Slippage = 0 | Trading fee = 0

Total cost = Slippage + Spread + Trading Fee = 0 + 35 + 0 = 35

Categories
Forex Assets

Asset Analysis – Comprehending The NZD/NOK Exotic Forex Pair

Introduction

NZD/NOK is the abbreviation for the currency pair New Zealand dollar versus the Norwegian Krone. It is referred to as an exotic cross-currency pair. In this case, NZD is the base currency, and NOK is the quote currency. In this article, we shall learn about everything you need to know about this currency.

Comprehending NZD/NOK

Understanding the value of a currency pair is simple. The value of NZD/NOK verifies the Norwegian Krone that must be paid to buy one New Zealand dollar. It quoted as 1 NZD per X NOK. For instance, if the current value of NZD/NOK is 6.0549, then 6.0549 NOK is required to buy one NZD.

Spread

Spread is the keyway through which stockbrokers make income. The selling price and buying price are different; the distinction between these prices is termed as the spread. It ranges from broker to broker and their implementation type. Below are the spreads for NZD/NOK currency pairs in both ECN & STP account models:

ECN: 20 pips | STP: 25 pips

Fees

For every execution, there is a cost levied by the broker. This cost is also indicated as the commission/fee on a trade. This fee/commission does not apply to STP accounts; however, a few additional pips are charged.

Slippage

Slippage is the difference in the price executed by you and the price you indeed received. It occurs on market orders. Slippage varies on two factors:

  • Market’s volatility
  • Broker’s execution speed

Trading Range in NZD/NOK

The trading range is a tabular description of the pip movement in a currency pair in a variety of timeframes. These values help in evaluating the risk-on trade as it defines the minimum, average, and maximum profit that can be made on a trade.

Procedure to assess Pip Ranges

  1. Add the ATR indicator to your chart
  2. Set the period to 1
  3. Add a 200-period SMA to this indicator
  4. Shrink the chart so you can assess a large time period
  5. Select your desired timeframe
  6. Measure the floor level and set this value as the min
  7. Measure the level of the 200-period SMA and set this as the average
  8. Measure the peak levels and set this as Max.

NZD/NOK Cost as a Percent of the Trading Range

The total cost of the trade shifts/changes based on the volatility of the market; hence we must figure out the instances when the costs are less to place ourselves in the market. The table below exhibits the variation in the costs based on the change in the market’s volatility.

Note: The ratio signifies the relative scale of costs and not the stable costs on the trade.

ECN Model Account

Spread = 20 | Slippage = 5 |Trading fee = 8

Total cost = Slippage + Spread + Trading Fee = 5 + 20 + 8 = 33 

STP Model Account

Spread = 25 | Slippage = 5 | Trading fee = 0

Total cost = Slippage + Spread + Trading Fee = 5 + 25 + 0 = 30

The Ideal way to trade the NZD/NOK

NZD/NOK is an exotic currency pair, and hence we can see, the average pip movement in 1hr timeframe is 120, which indicates higher volatility. The greater the volatility, the higher is the risk, and smaller is the cost of the trade and the other way around. Taking an instance, we can see from the trading range that when the pip movement is smaller, the charge is elevated, and when the pip movement is higher, the charge is lower.

To further decrease our costs of trade, we may place trades using limit orders as an alternative to the market orders. In the below table, we will see the interpretation of the cost percentages when limit orders are applied. As we can see, the slippage is zero. In doing so, the slippage will be excluded from the calculation from the total costs. And this will help us in lowering the trading cost by a sizeable margin. An example of the same is given below.

STP Model Account (Using Limit Orders)

Spread = 25 | Slippage = 0 | Trading fee = 0

Total cost = Slippage + Spread + Trading Fee = 0 + 25 + 0 = 25

Categories
Forex Basic Strategies

Forex Trading Using ‘Commodity Correlation Strategy – 2’

Introduction

A correlation coefficient is a number that describes the extent to which two instruments are correlated to each other. The number ranges between -1 and +1. This number moves from periods of positive correlation to periods of negative correlation. Located on one end of the scale, +1 is considered a state of the positive correlation between two instruments.

If the number is anywhere between 0 and +1, the two assets are said to move in the same direction, with a certain degree of positive correlation. On the other end of the scale, -1 is considered a state of negative correlation between two instruments. If the number is anywhere between 0 and -1, the two instruments are said to move in the opposite direction, with a certain degree of negative correlation.

The strategy we will be discussing today seeks to exploit the inverse correlation between the dollar index and Gold’s price. According to the World Gold Council, Gold tends to rise when the U.S. dollar falls. It is observed in the past that the correlation coefficient for Gold and the dollar index was between -0.6 and -0.8. This means if the dollar index is up, there is a 60% to 80% chance that gold prices would come down. In contrast, if the dollar index is down, there is a 60% to 80% chance that gold prices would come down. Let us see how the strategy works.

Time Frame

The commodity correlation strategy works well in the Daily (D) time frame. This implies that each candlestick on the chart represents the price movement of one day.

Indicators

We will be using the ATR indicator in the strategy. No other indicators are required for the strategy.

Currency Pairs

There are two charts we need to focus on in this strategy. The first one is the spot Gold or XAU/USD, and the second one is the chart of the dollar index.

Strategy Concept

The dollar index’s price action is used as a reference to initiate a trade on the XAU/USD. Technical levels of support and resistance on the dollar index chart are used to spot long and short trades on XAU/USD. If the price closes below the support on the dollar index chart, a long trade is initiated on the XAU/USD the following day. Similarly, if price closes above resistance on the dollar index chart, a short trade is initiated on the XAU/USD the following day. The risk-to-reward of this trade is 1:2. A bigger target can be achieved by allowing the trade to run its course.

The strategy is very simple for those who have a basic understanding of support and resistance. Another reason behind its popularity is that it does not involve the usage of complex indicators. The trade setups are not formed too often as we are using the daily time frame charts. Hence, a lot of patience is required for the application of the strategy.

Trade Setup

Here are the steps to implement the commodity correlation strategy. In both the instruments, we will be using the daily time frame chart only.

Step 1

The first step of the strategy is to open the dollar index’s daily time frame and mark key areas of support and resistance on the chart. If one is looking for ‘long’ trades, the identification of the support area is crucial. And if one is looking for ‘short’ trades, identification of ‘resistance’ trade is crucial. After marking out of the lines, wait for the price to breakout or breakdown. In case of a breakout, we will look for ‘short’ trades in ‘gold,’ and in case of a breakdown, we will look for ‘long’ trades in ‘gold.’

We have taken an example of a ‘long’ trade where we will be executing the steps of the strategy. In the below image, one can see that the price has broken below the long term support.

Step 2

Next, we open the chart of XAU/USD, where we look for ‘long’ or ‘short’ entry. We enter for a ‘long’ in ‘gold’ on the following day of the dollar index’s break of support. Similarly, we enter for a ‘short’ in ‘gold’ on the following day of the break of resistance in the dollar index. The entry is taken right at the opening candle on the next day.

In our case, we are entering for a ‘long’ in ‘gold’ on the following day since the price had broken the dollar index’s support on the previous day.

Step 3

In this step, we determine the take-profit and stop-loss for the strategy. The stop loss is mathematically calculated where it is placed at the amount obtained after multiplying 2 to the value of the ATR indicator on the previous day. This means if the ATR value is 30, then stop loss will be set 60 points away from the current market price (CMP). The take-profit is extended up to a point where the trade results in a risk to reward ratio of 1:2. As mentioned earlier, since this is a long-term chart, the trade has the potential to give higher returns.

We can see in the below image that trade has almost reached our ‘take-profit’ where this is the current state of the market.

Strategy Roundup

Part II of the commodity correlation strategy seeks to take advantage of the negative correlation between the dollar index and gold prices. Using the dollar index as a reference, we are activating trades on the XAU/USD pair, which is nothing but the price of spot gold.

However, the interest rates announcement by the Federal Reserve will try to keep the inverse relationship between the U.S. dollar and Gold. This strategy is ideal for traders around the world who do not have time to watch the markets on a daily basis. The strategy can also be used to look for investment opportunities in Gold.

Categories
Beginners Forex Education Forex Assets

How Many FX Currency Pairs Should We Trade?

Last month a private symposium was held in Las Vegas, Nevada, sponsored by a narrow circle of international forex traders. The event hosted more than seventy high-profile traders from around the globe. Traders were debating about some of the most sensitive topics and the ways of risk managing. What came up as the most important topic was: On how many currencies should we focus on during the trading session? What is the right balance between our abilities and the optimal number of seized opportunities? And does more trades mean more profits if we are consistent?

Among all the exotic currencies that are out there, here we want to focus on eight majors: the USD, Euro, Pound, Aussie, CAD, NZD, JPY, CHF. If we take a combination of those eight major currency pairs and minus one, we will end up with twenty-seven. Yes twenty-seven, all the cross pairs, minors, and majors, however, you name them.

Why minus one? According to some professional prop traders, EUR/CHF is the least trending pairs, therefore in a positive correlation. The euro/Swissy has been tied together for such a long time that it doesn’t really trend in a way where it can trip our algorithm and where we can actually earn money. It is simply not worthy of our time, it might be a headache for now if you are a trend following trader as these professionals are. Focusing on this question from a different kind of angle might just be integral in changing our forex trading forever, regardless of how long we are trading, how successful or just in the process of learning.

For those people who trade a lot less than twenty-seven, like just one, three, four, we want to explain why that might be a gigantic mistake and how the mentality behind that approach might seem downright silly. What could be profitable about trading this way is, after we dive deep into our algorithms, little tools, and indicators that we use, we would have potentially a twenty-seven really good chances for success. Many people don’t do that. Someone who only trades a few different currency pairs or sometimes only one currency pair. Some people only trade euro/dollar because they’re assured that’s the most liquid pair, or they believe that the correct path to benefit is mastering at one currency pair before they move on to a different one.

Liquidity stands for the ability of assets to be sold and bought immediately closest to the market price. The Euro/dollar is the most liquid currency pair which accounts for around 29% transaction volume in the forex market. Therefore many don’t even consider trading with other pairs of currencies. Here we think that the euro/dollar isn’t a great pair to trade, especially if you are a newly-born fish in the sea. For somebody who is a beginner in trading, it has so many obstacles against you. So if you really insist to trade only one pair, don’t make it the euro/dollar. That might be the last pair you should be trading with.

Next thing, the fact that people who trade only one pair because they want to be good at those before moving on the other ones mean they don’t know much. Just because the GBP/USD likes to stay in range or AUD/JPY likes to trend, that doesn’t mean it’s going to do that into the future. A currency pair trends, it falls into a range, it consolidates, it might go crazy right after that…just like every other currency pair out there. If we think that some currency pair is range-bound, the one time it stops being in a range we could be doomed, so we better erase that conviction from our heads.

Currency pairs don’t have their own unique movement, the volatility might be specific but not the movement. If somebody did well trading with euro/Chinese yuan, for example, it is not going to be like that forever, it might be moving through the path that strongly supports the way that particular person likes to trade. All of that is going to change, we need to be careful and pay close attention. We don’t want to develop bad habits.

Further on, we want to trade the daily chart exclusively according to certain trade experts. They believe more than anything that the daily chart is the far superior chart to trade when you are using the trend following strategies. Trend following is also statistically proven to be the best method of trading. Every technical tool, everything that we use works better and more consistently on the daily chart than any other chart out there, according to their experience. Every single time the daily chart turned more consistent results even if we use horrible tools. Trades win more often, and we shouldn’t spend more than twenty minutes managing our positions. So maybe we should consider making that switch or start trading this way from the very beginning.

Probably the biggest reason why we should be trading many more currency pairs than we currently are is that we’re severely limiting ourselves by only trading one, two, three, or four pairs. We want to have a well-balanced system in place and make a lot more money than others who trade with just a few currency pairs. If we trade with twenty-seven pairs we would have much more opportunity for success, we want to open our trading horizons. We need to warm up our algorithms, our little scales that we put together for ourselves on a technical level, we need to duplicate them on twenty-seven different currency pairs on the daily chart and we are always going to be in a comfortable position.

This is how we are going to create the best chance of making the most money possible in the market in the long run. Most of the money-making leading lecturers in a symposium agree on this. If we try to use those trading principles and go trade twenty-seven different currency pairs, all combination of eight majors, exclusively trade daily chart, we might be a lot further ahead than many other traders. Our goal should be to set up our best chances of winning in the forex because, in the end, it is all about winning.

Categories
Forex Assets Forex Trade Types

Trend Trading With Exotic and Volatile Pairs

Is there really anything to fear when trading exotic currencies and volatile pairs?

People tend to approach exotic currencies and volatile currency pairs with a kind of irrational, knee-jerk reaction. They’re either revolted and back away or they’re mysteriously drawn in like a moth circling a porch light. Is this irrationality merited? Does it get you anywhere? Let’s take a look. To unpack this properly, it’s best to approach these two ‘monsters’ separately – starting with exotic currencies.

Exotic Currency Pairs

So, is it worth trading exotic currency pairs? To the untrained observer, it might look like the short answer is simply ‘no, it isn’t worth it’. But this answer has to come with a disclaimer because, in reality, it depends on two other things. First thing’s first, what do we mean when we say “exotic currency? The problem is that one man’s exotic currency is another man’s daily bread. Ask any two traders what their definition of an exotic currency is and you’ll likely get two different answers because there is no actual definition that everybody sticks to. Some people will quite happily identify a less commonly traded combination of the eight major currencies as being exotic.

Take, for example, the euro-AUD combination. It’s easy to understand why they would think of that as exotic since the EUR-AUD pair is traded very rarely indeed compared to just about any pairing with the dollar that you can think of. Even if you pair the dollar with come currencies outside the major eight, like the Swedish krona or the Mexican peso, you will have a combination that is more frequently traded than euro vs. the Aussie dollar.

A better working definition – and one which we’re going to go with here – might be to say that any combination outside the eight major currencies should be considered exotic. And here’s why. The eight major currencies are all part of a network of developed, first-world economies. This isn’t a judgment call, by the way. We’re not saying here that any one country is better than another – what we’re looking for here is stability in terms of the news cycle and unpredictable fluctuations. The fact of the matter is that if you trade outside the major eight currencies, you run a greater risk of an anomalous news event sending the price spinning off in an unpredictable direction and blowing out your stop/loss.

That is simply bad news if you are a good technical trader. To be clear, it’s actually bad for any forex trader. When you step outside of the major eight currencies, it becomes increasingly difficult to keep on top of the news cycle. Of course, unusual news events are going to pop up from time to time no matter what currency combinations you trade but as you move outside the major eight, they will be both more frequent and more violent.

That is not to say that there isn’t something tempting about trading exotic currencies. Many readers will know that when you take a look at exotic pairs, it can look very exciting. This applies even to the currencies that you will most commonly encounter outside the eight major currencies. These include the Chinese yuan, of course, the Mexican peso, the Swedish krona, the Turkish lira, the Russian rouble, and the Indian rupee. Sometimes a pair with one of these can move thousands of pips at a time. It’s easy to look at a movement like that and say to yourself, “If I could just enter one big trade here for a few thousand pips, I could walk away rich!”

Unfortunately, that’s not how it works. It’s easy to get drawn into easy-looking trades like that but the problem – and it’s a big problem – is that some of these currencies can move very dramatically and with no warning and for no clear reason. A big win can be truly tempting but a big loss has the potential to completely wipe you out. The Chinese yuan is interesting here for a couple of reasons. There is no denying that it is traded against the dollar much more than it used to be. However, while we’re still in the US-China trade war, it is best to steer clear of trading the Chinese yuan. The ongoing trade war introduces too much risk into the equation.

How Does One Approach Trading Exotic Currencies?

Firstly, you should venture beyond the eight major currencies and all of the combinations of them only if you have a sufficient amount of experience. In short, there is not a whole lot of benefit to expanding beyond the 28 currency pairs that the eight major currencies offer unless you have completely mastered these first. If you have only been trading for a couple of years or less even, then you are not ready but, if you have a lot of experience under your belt, then venture a little further by all means. But proceed with caution.

Caution being the watchword here, because another thing you will have to do before you do try your hand at trading exotic currency pairs, is a little risk mitigation. One of the ways you can do this is to select a currency outside the major eight that you feel good about exploring and start testing it on demo mode. Your first step is to backtest it by applying your trading methodologies to it historically. Your next step is to forward test it by demoing it for a few months until you have built up both a good sense of how it behaves – especially in terms of its spread vs. ATR. Forward testing is a good way to iron out the kinks in your risk profile and to minimise any surprises that could crop up.

Where to Begin?

If you are determined to expand beyond trading the eight major currencies and feel ready to do so, your first task will be to identify a good currency to get started with. A good place to start might be the Singapore dollar. There are a few reasons that make SGD a good choice. For starters, in many ways, it behaves in a way that’s similar to the Japanese yen, at least for now. It is less volatile than the Japanese yen but we’ll touch upon volatility later in the article and you’ll see that it isn’t a big problem. As with the yen, the main advantage of SGD is that it is impervious to news events that relate specifically to it.

This means that it essentially acts as a kind of blank canvas for the currency you are pairing it with. In a sense, this releases you from having to worry about two currencies simultaneously and allows you to focus your attention on just one. This is as true for the Japanese yen as it is for SGD. Of course, this is how things are at the moment and how they have been historically. If Singapore were to be plunged into any kind of turmoil, this would change but, for now, it is surprisingly stable. News events just do not affect it at all.

A Note of Caution

The only real alarm bell regarding the Singapore dollar is that it has a high percentage of spread as compared with its ATR. It is, in fact, likely to have a more lopsided spread vs. ATR percentage than most other currencies you will be trading or even looking at right now. However, as we will cover later in this article, that does not necessarily have to be a problem. Particularly if you do your due diligence and backtest and forward test the currency as discussed. So, don’t let the spread vs. ATR percentages scare you off immediately and take a look at the Singapore dollar if you are keen on exploring exotic currencies.

Managing Volatility

Another one of those things that in many cases gives traders the heebie-jeebies, is trading volatile pairs. Fear is almost certainly a big factor. It’s almost as though it’s the word itself – volatility – that causes a lot of that fear. The good news is that that fear is irrational and can be managed and molded into something useful.

Speed-Phobia

Aside from the word volatility sounding scary, there are two main reasons that traders have an aversion to trading volatile pairs. We will tackle both of them here in turn. The first is that volatile pairs of currencies move fast. They move faster than currency combinations you are comfortable with and that, it seems, makes a lot of people back away. The thing is, there is no real reason it should. Understanding the percentages here and using them to your advantage is key. It sounds easy enough, doesn’t it? The thing is, if you understand the percentages then you will understand that trading a currency combination that moves slowly is exactly the same as trading one that moves quickly.

The key is risk profiling. If you are trading a fast pair, you will have to manage the risk by trading less per pip than you would on a slow pair. If you can manage the risk in that way, you should arrive at a situation where you stand to lose the same on a fast pair as you would on a slow pair, if things go south on you and you hit your stop/loss. Of course, you should never trade the same amount per pip on a slow pair of currencies and a fast pair – if you do, your trading problems are bigger than just accounting for volatility. So, to close down the risk of trading a faster pair of currencies, you have to have a good, well-thought-out risk profile in place. If you can do that, then trading fast-moving currencies should be almost the same as trading slower combinations.

Fear of Spreads

The second thing about volatile currencies that gives most traders pause is something we saw earlier with the Singapore dollar. Volatile currencies will have a high spread vs. ATR ratio. The way to combat that is to pull away from your five-minute chart and trade on a longer time-scale like your daily chart. Trading on a daily chart will negate almost all of the effects of spread vs. ATR from volatile currency pairs. If you trade the daily chart, particularly for volatile combinations, you just won’t have to worry about spreads anymore. You will never again look at a currency pair and decide not to trade it because it looks too volatile based on its spread vs. ATR. If you’re looking at it from a five-minute chart perspective, then the high spread vs. low ATR is certainly something you will want to avoid. But don’t forget that it is a hurdle that can be overcome with a different approach. That approach is to go to trade your daily chart.

So by applying the right kind of risk profiling and modifying your trading to take in the daily chart, you can turn the fear of volatile currency pairs into gold. And it won’t be because you overcame your fears like some zen master, through meditation and self-improvement, it will be because you’ve applied smart trading techniques and knowledge to overcome something that was otherwise irrational with a well-considered, methodological approach to a problem.

Time to Recap

Approach exotic currencies with a dose of caution. Make sure you have the experience to know what you are doing and do not trade outside the eight major currencies until you know the risks that go with exotic currency pairs and the knowhow to overcome them. Carefully choose your starting currency and make sure you do your due diligence by properly back and forward testing it thoroughly. Ultimately, if you’ve only been trading for a couple of years, there is no good reason to trade outside the major eight currencies.

Finally, there is no reason to fear volatility. If you approach what initially looks scary with a rational, considered approach, including careful risk profiling and an awareness of when to trade the daily chart, you never need fear volatility ever again.

Categories
Forex Assets

Analyzing The ‘CHF/AED’ Forex Exotic Pair

Introduction

CHF/AED is the short form for the Swiss Franc against the United Arab Emirates Dirham. It is considered an exotic currency pair. Currencies are always traded in pairs in the Forex market. The main currency in the pair is considered the base currency, while the sequential one is the quote currency.

Understanding CHF/AED

The market value of CHF/AED determines the value of AED required to buy one Swiss Franc. It is priced as 1 CHF per X AED. Hence, if the market price of this pair is 3.8835, these many United Arab Emirates Dirham units are necessary to buy one CHF.

Spread

The spread is the distinction between the ask-bid price. Mostly, these two prices are set by the stockbrokers. The gap between the pip values is through which brokers generate revenue. Below are the ECN & STP Spread values of CHF/AED pair.

ECN: 19 pips | STP: 24 pips

Fees

The fee is the minimum commission you pay to the broker on every single spot you open. There is no fee to be paid on STP accounts, but a few additional pips on ECN accounts.

Slippage

Slippage is the distinction between the price at which the trader implemented the trade and the original price he got from the broker – this changes based on the volatility of the market and the broker’s implementation speed.

Trading Range in CHF/AED

The trading range table will help you determine the amount of money that you will win or lose in every timeframe. This table signifies the minimum, average, and maximum pip movement in a currency pair.

Procedure to assess Pip Ranges

  1. Add the ATR indicator to your chart
  2. Set the period to 1
  3. Add a 200-period SMA to this indicator
  4. Shrink the chart so you can assess a large time period
  5. Select your desired timeframe
  6. Measure the floor level and set this value as the min
  7. Measure the level of the 200-period SMA and set this as the average
  8. Measure the peak levels and set this as Max.

CHF/AED Cost as a Percent of the Trading Range

The price of the trade alters based on the volatility of the market. Hence, the total cost comprises slippage and spreads, excluding from the trading fee. Below is the analysis of the cost difference in terms of percentages.

ECN Model Account

Spread = 19 | Slippage = 5 |Trading fee = 8

Total cost = Slippage + Spread + Trading Fee = 5 + 19 + 8 = 32 

STP Model Account

Spread = 24 | Slippage = 5 | Trading fee = 0

Total cost = Slippage + Spread + Trading Fee = 5 + 24 + 0 = 29

Trading the CHF/AED

The CHF/AED is not a very volatile pair. For example, the average pip movement on the 1H timeframe is only 42 pips. If the volatility is more significant, then the cost of the trade is low. Nevertheless, it involves a higher risk to trade highly volatile markets.

Also, the higher/lesser the proportions, the greater/smaller are the costs on the trade. We can then determine that the costs are higher for low volatile markets and high for highly volatile markets.

To reduce your risk, it is recommended to trade when the volatility is around the minimum values. The volatility here is low, and the costs are slightly high, corresponding to the average and the maximum values. But, if the priority is towards reducing costs, you could trade when the volatility of the market is near the maximum values.

Benefits on Limit orders

For orders that are implemented as market orders, there is slippage applied to the trade. But, with limit orders, there is no slippage valid. Only the spread and the trading fees will be accounted for estimating the total costs. Therefore, this will bring down the cost noticeably.

STP Model Account (Limit Orders)

Spread = 24 | Slippage = 0 | Trading fee = 0

Total cost = Slippage + Spread + Trading Fee = 0 + 24 + 0 = 24

Categories
Forex Assets

Everything About EUR/TRY Forex Currency Pair

Introduction

EUR/TRY is the abbreviation for the Euro area’s euro against the Turkish Lira. This pair is classified as an exotic-cross currency pair. In this pair, EUR is the base currency, and TRY the quote currency.

Understanding EUR/TRY

The price of this pair determines the value of TRY, which is equivalent to one euro. It is quoted as 1 EUR per X TRY. For example, if the value of this pair is 6.5552, then about 6.5 Turkish Liras are required to purchase one euro.

EUR/TRY Specification

Spread

Spread is simply the difference between the bid price and the ask price in the market. This value is controlled by the brokers. This value varies on the type of execution model used for executing the trades.

Spread on ECN: 40 pips | Spread on STP: 44 pips

Fees

The fee in Forex is similar to the one that is pair to stockbrokers. Note that, there is no fee on STP accounts, but a few pips on ECN accounts.

Slippage

The slippage on a trade is the difference between the price that is demanded by the trader and the price that is actually executed by the broker. Market volatility and the broker’s execution speed are the reasons for slippage to occur.

Trading Range in EUR/TRY

A trading range is the representation of the minimum, average, and the maximum volatility of this pair on the 1H, 4H, 1D, 1W, and 1M timeframe. Using these values, we can assess our profit/loss margin of trade. Hence, this proves to be a helpful risk management tool for all types of traders.

Procedure to assess Pip Ranges

  1. Add the ATR indicator to your chart
  2. Set the period to 1
  3. Add a 200-period SMA to this indicator
  4. Shrink the chart so you can assess a large time period
  5. Select your desired timeframe
  6. Measure the floor level and set this value as the min
  7. Measure the level of the 200-period SMA and set this as the average
  8. Measure the peak levels and set this as Max.

EUR/TRY Cost as a Percent of the Trading Range

With the volatility values obtained from the above table, we can see how the cost varies as the volatility of the market varies. All we did is, got the ratio between the total cost and the volatility values and converted into percentages.

ECN Model Account 

Spread = 40 | Slippage = 3 | Trading fee = 3

Total cost = Spread + Slippage + Trading Fee = 40 + 3 + 3 = 46

STP Model Account

Spread = 44 | Slippage = 3 | Trading fee = 3

Total cost = Spread + Slippage + Trading Fee = 44 + 3 + 0 = 47

The Ideal way to trade the EUR/TRY

The EURTRY is a pair with enough volatility and liquidity. Hence, this makes it simpler to trade this exotic-cross currency.

From the above table, we can see that the percentage values are all within 200%. This means that the costs are low irrespective of the timeframe and volatility you trade.

Digging it a little deeper, the costs are higher when the volatility of the market is low and lower for higher volatilities. However, we cannot ignore the fact that this pair is highly volatile. For example, the maximum volatility on the 1H timeframe is as high as 456. So, traders must be cautious before trading this pair.

When it comes to the best time of the day to trade this pair, it is ideal for entering this pair during those times of the day when the volatility is in between the average values because this will ensure decent volatility as well as low costs.

Furthermore, traders can easily reduce their costs by placing orders as ‘limit’ and ‘stop’ instead of ‘market.’ In doing so, the slippage on the trade will not be considered in the calculation of the total costs. So, in our example, the total cost will reduce by three pips.

Categories
Forex Fundamental Analysis

What Is ‘Inflation Rate’ & Why Is It One Of The Most Important Fundamental Indicators?

Introduction

Based on the current inflation rate and future monetary policies, we can effectively gauge the current economic situation of a country. Using the Inflation rate data, we can also get an insight into the current currency’s value and in which direction the economy is heading towards. Hence we must look at this key indicator in its depth to solidify our fundamental analysis.

What is Inflation?

In Economics, Inflation is the increase in the prices of goods & services, and the resultant fall in the purchasing power of a currency. What this means, in general, is that when a country experiences Inflation, the prices of the most commonly used goods & services by the citizens of a country increase. Because of this, the average person has to spend more money to buy the same amount of goods which cost less in the previous period.

For instance, if John went to a grocery store to purchase his monthly groceries, and it cost him 100$ in 2018. Next year, i.e., in 2019, John goes to the same store to buy the same set of goods, and it had cost him 105$. Now John either has to remove some items or pay more to make the same purchase. Here John has experienced Inflation of 5%.

What is Inflation Rate?

The percentage increase in the price of goods & services over a period (usually monthly or yearly) is called the Inflation Rate. In our previous example of John, we see we have an inflation rate of 5%.

Inflation Rate is compounding in nature, i.e., it is always calculated with reference to the most recent statistic and not any particular base year or a base inflation rate. For example, if John were to buy the same goods in 2020, if it costs him 110$, then John has experienced 4.54% of Inflation and not 10% inflation.

Why is Inflation Rate important?

Inflation, in general, when kept in check, is good for an economy as it fuels growth. The increase in the prices of common goods and services means people have to compete and work better to earn more to meet their needs. But as in any case, excess or high Inflation can be crippling for an economy.

Because the citizens of the country get poorer when the purchasing power of the currency falls due to a high increase in prices, inflation Rates can be used to gauge the current financial health of an economy and what the citizens of a country are currently experiencing.

How does Inflation Occur?

A general view in the economic sector is that steady Inflation occurs when the money supply in the country outpaces economic growth. It means more currency is being circulated into the economy than its equivalent activity (revenue-generating practices). Inflation occurs mainly due to the rise in prices. But in brief, Inflation can occur due to the following situations:

Demand-Supply Gap: When the demand for a particular good is higher than the supply or production of the same, then there is a natural surge in the price of that good.

Increased Money Supply: When more money is in circulation in the economy, it means an individual has more disposable cash. This increases consumer spending due to a positive future sentiment resulting in increased demand, which ultimately increases the price of goods.

Cost-Push Effect: When the cost of inputs to the process of manufacturing good increases, it coherently increases the overall cost of the finished good. This results in a higher selling price of goods, which ultimately results in Inflation.

Built-In: Built-in inflation happens when there is a sort of feedback loop in the prices of goods and incomes of people. As people demand higher wages to meet the needs, it results in higher prices of goods and services to fund their demand and vice-versa. This adaptive price and wage adjustment automatically feed off each other and result in an increase in prices.

How is Inflation measured?

Based on different sectors, the costs of different sets of goods & services are used to calculate different inflation indexes. However, there are some most commonly used inflation indices in the market, like the Consumer Price Index (CPI) and Producer Price Index (PPI) in the United States.

Consumer Price Index (CPI): The Bureau of Labor Statistics (BLS) surveys the prices of 80,000 consumer items to create the Index and publishes it on a monthly basis. It is a measure of an aggregate price level of most commonly purchased goods and services like food, shelter, clothing, and transportation fares. Service fees like water and sewer service, sales taxes by the urban population, which represent 87% of the US population, are weighted into the percentage, based on their importance in terms of need.

Changes in CPI are used to ascertain the retail-price changes associated with the Cost of Living, and hence it is used widely to assess Inflation in the USA. In this Index, there are many subcategories wherein certain goods are either included or excluded to give a more accurate picture of Inflation in absolute or relative terms. For example, Core CPI strips away food, gas, and oil prices from the equation whose prices are volatile in nature.

Producer Price Index (PPI): It measures the average change in the selling prices received by domestic producers for their output over a period of time (usually monthly). Unlike CPI, which measures retail prices from the viewpoint of end customers who purchase the items, PPI measures the prices at which goods and services are sold to outlets from the manufacturer. PPI measures the first commercial transaction, and hence it does not include the various taxes and service costs that are associated and built into the CPI.

PPI vs. CPI

PPI measures the change in average prices that an initial-producer or manufacturer receives whilst CPI estimates the change in average prices that an end-consumer pays out. The prices received by the producers differ from the prices paid by the end-consumers, on the basis of a variety of factors like taxes, trade, transport cost, and distribution margin, etc.

Sources of Inflation Indexes

The US Bureau of Labor Statistics releases all the above-mentioned indexes here:

Consumer Price Index | Producer Price Index 

Inflation Rates of some of the major economies can be found below.

United Kingdom | Australia | United States | Switzerland | Euro Area | Canada | Japan 

How ”Inflation Rate” News Release Affects The Price Charts?

In this section of the article, we shall find out how the Inflation rate news announcement will impact the US Dollar and notice the change in volatility after the news is released. As discussed above, CPI is a well-known indicator of Inflation as it measures the change in the price of goods and services consumed by households. Therefore, the data which we should be paying attention to is the CPI values and analyze its numbers. We can see that the Inflation Rate does have a high impact on the currency of the respective country.

Below, we can see the month-on-month numbers of CPI, which is released by the US Bureau of Labor Statistics. The data shows that the CPI was increased by 0.1% compared to the previous month, which is exactly what the analysts forecasted.

Now, let’s see how this news release made an impact on the Forex price charts.

USD/JPY | Before The Announcement - (Feb 13th, 2020)
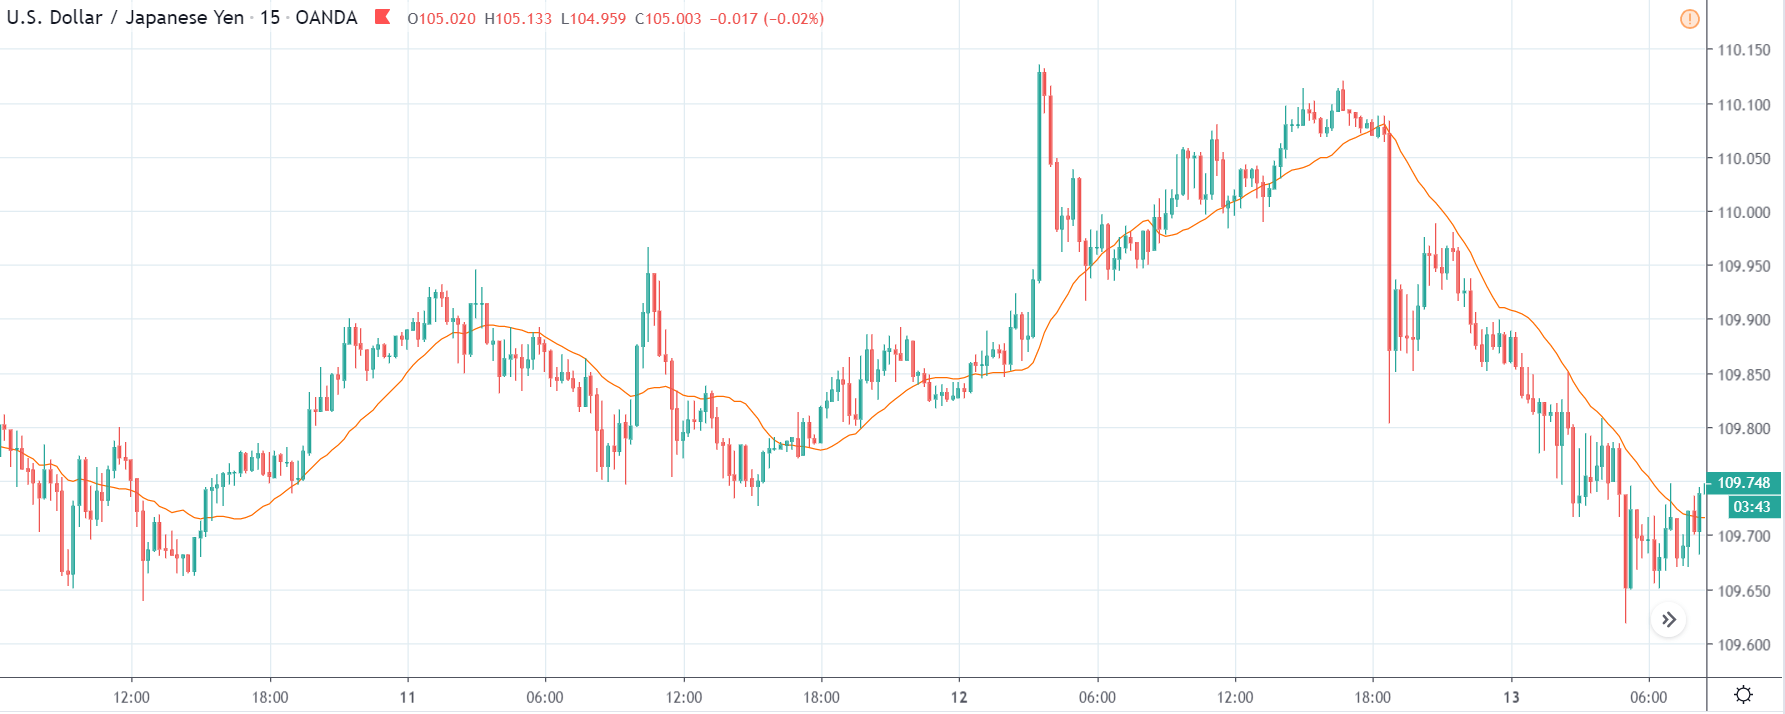
On the chart, we have plotted a 20 ”period” Moving Average to give us a clear direction of the market. From the above chart, it is clear that the US Dollar is in a strong downtrend, which is also evident from the fact that the price remains below the ”Moving Average” throughout. Just before the news announcement, we see a ranging action, which means the market is in a confused state.

Now we have two options with us, one, to ”long” in the market if there is a sudden large movement on the upside and, two, to take advantage of the volatility in either direction by trading in ”options.” We recommend to go with the first option only if you have a large risk appetite, else choose the second option by not having any directional bias. Let us see which of the above options will be suitable after the news announcement is made.

USD/JPY | After The Announcement - (Feb 13th, 2020)
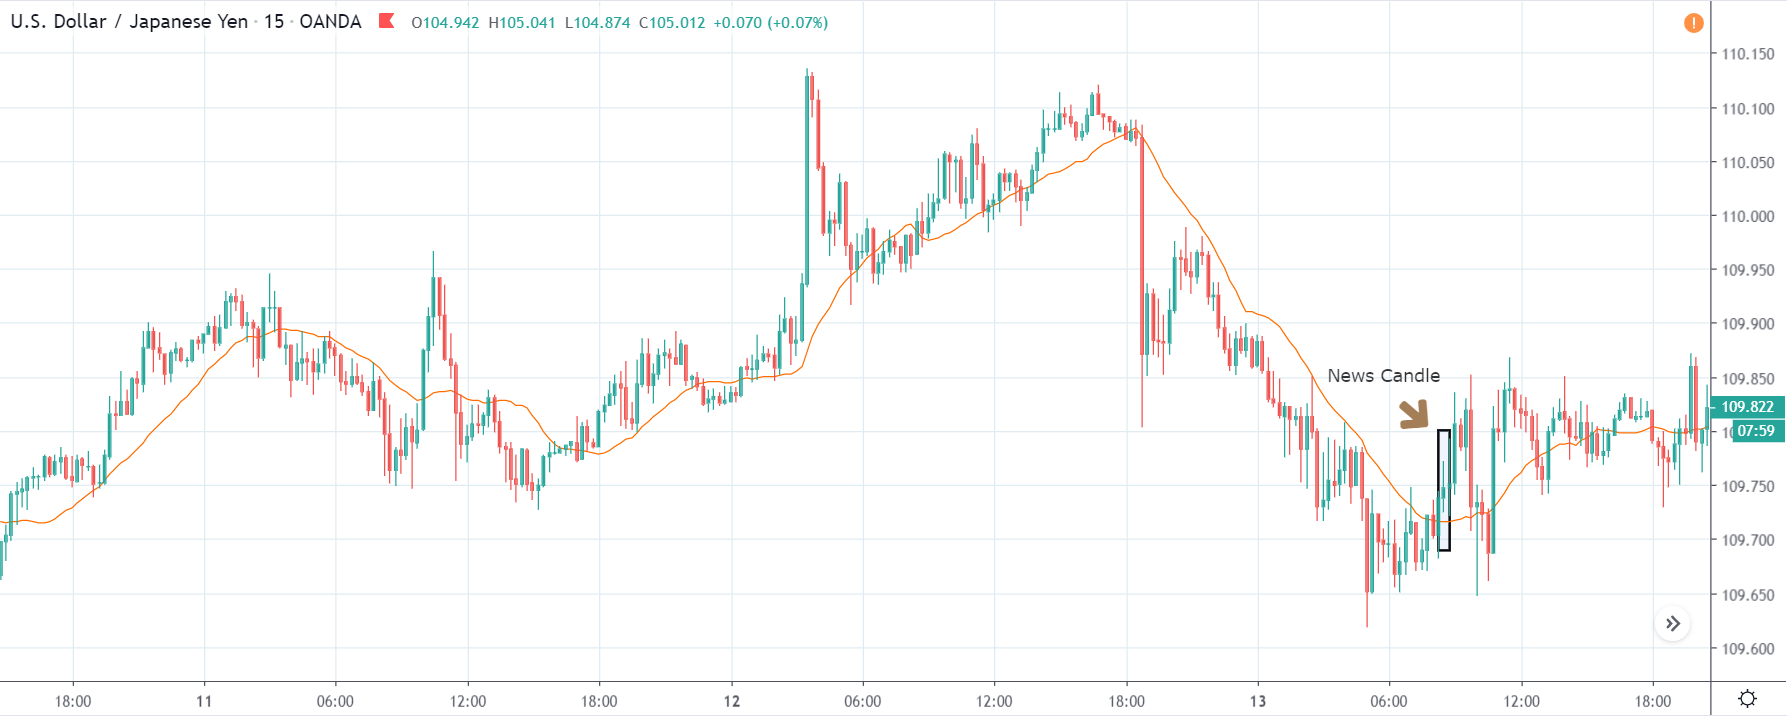
After the CPI numbers are announced, we see that the price does not go up by a lot, and it creates a spike on the top and falls below the moving average. It is very apparent that the news did not create the expected volatility in the above currency pair. From the trading point of view, in the two options discussed above, the first one is completely ruled out as the market did not show a strong bullish sign, and if we had gone with the second option, we would land in no-loss/no-profit situation.

The reason for extremely low volatility after the news announcement can be explained by the fact that the CPI numbers were merely increased by 0.1%. Since an increase in CPI is positive for the US Dollar, the market does not fall much and continues to hover around the same price.

AUD/USD | Before The Announcement - (Feb 13th, 2020)
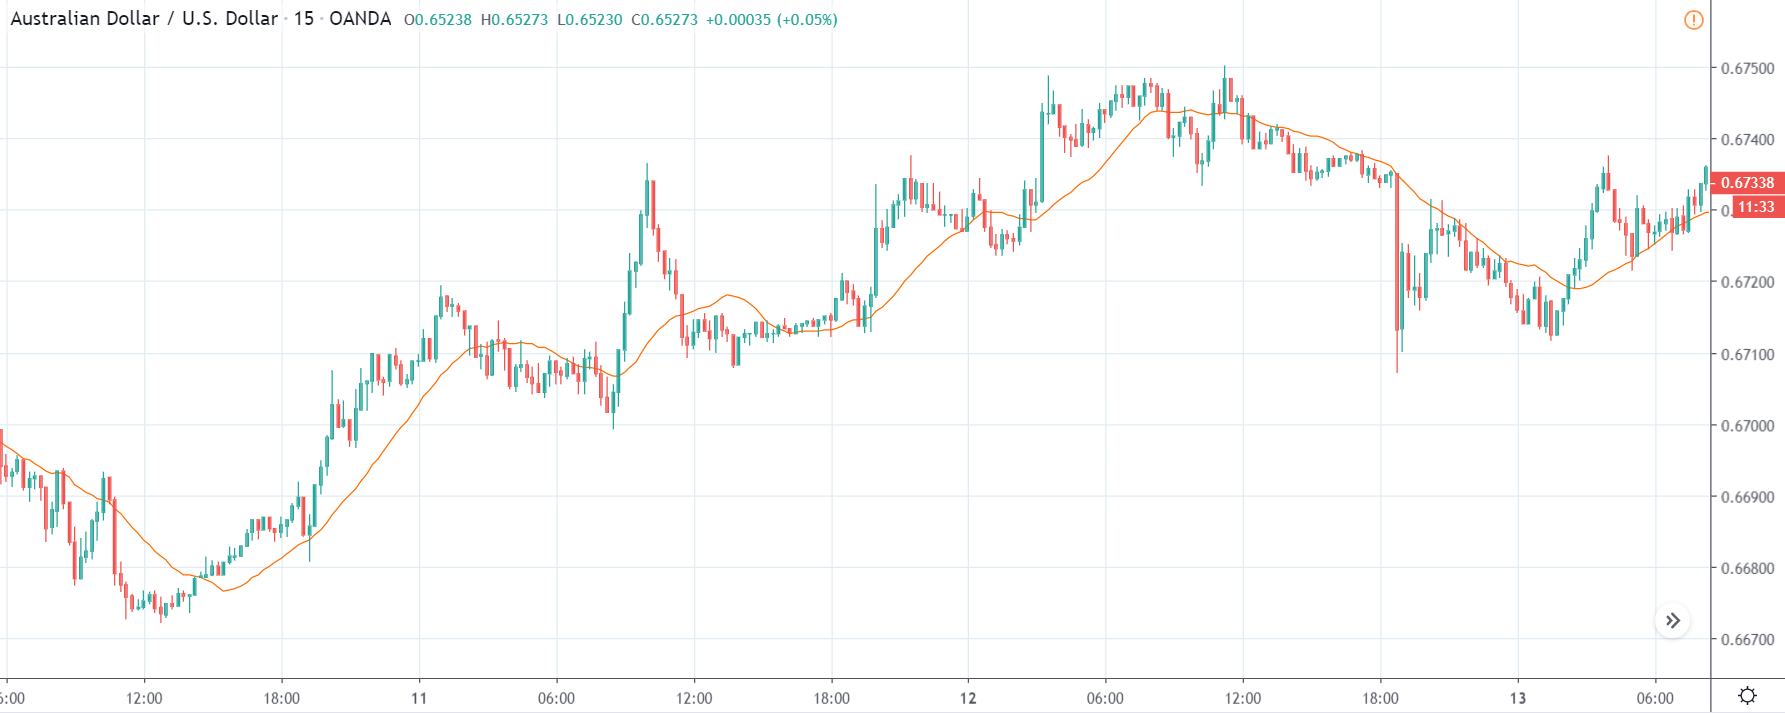
AUD/USD | After The Announcement - (Feb 13th, 2020)
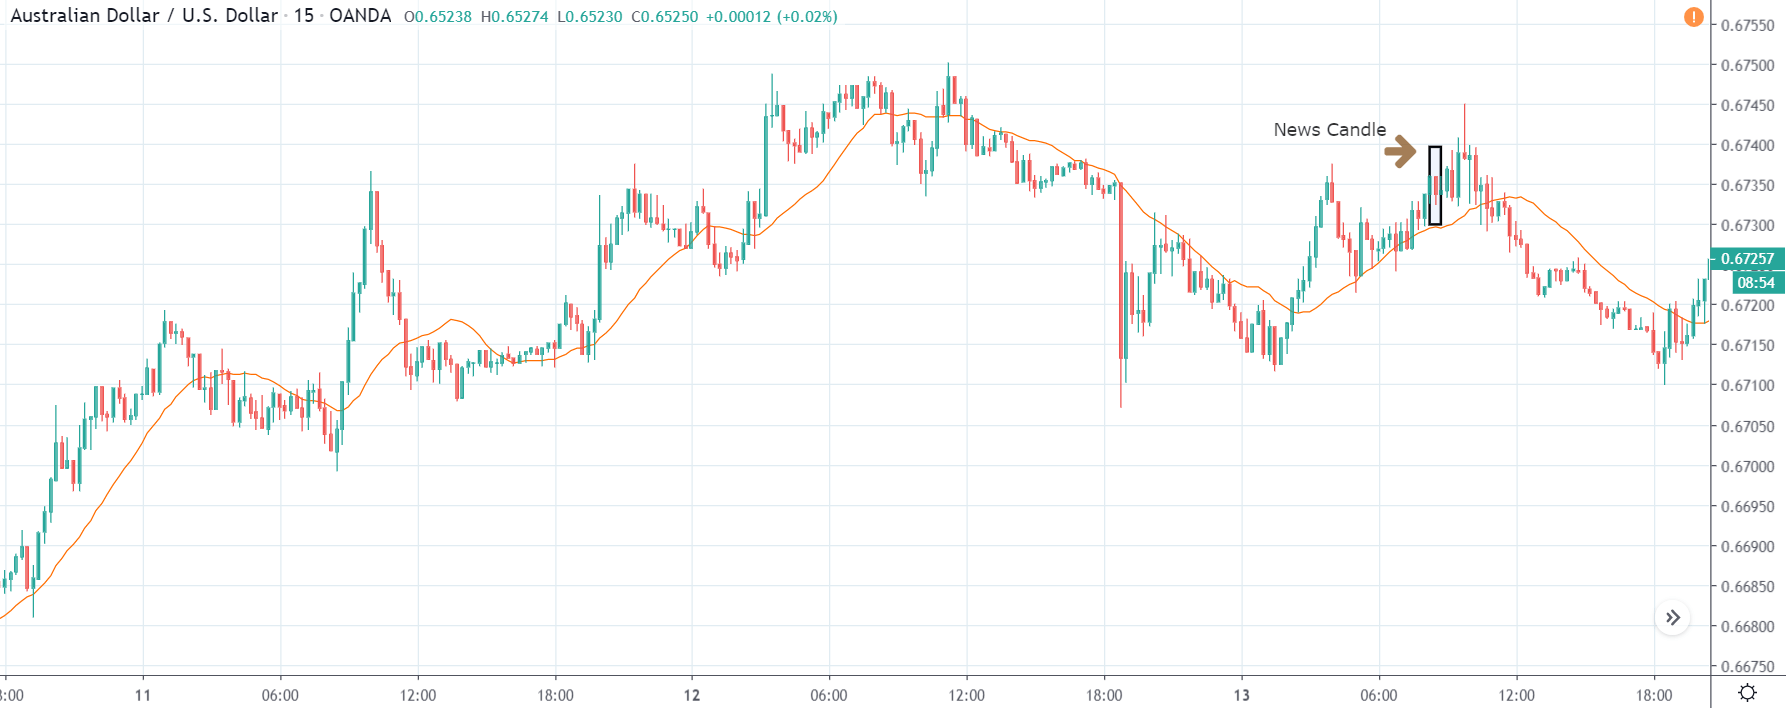
The above charts represent the currency pair of AUD/USD. Here since the US dollar is on the right side, we should see a red candle after the news release since the CPI data was good for the US dollar. By looking at the reaction of the market, we can say that the volatility did increase after the news announcement, which means AUD/USD proved to be better compared to USD/JPY.

A mere rise in the CPI number was good enough for the currency pair to turn into a downtrend from an uptrend. One can also see that the price goes below the moving average indicator. This means that the Australian Dollar is a very weak pair compared to the US dollar, the reason why the US dollar became so strong after the news release. Hence one can take a ”short” trade in the currency pair after the price breaks the MA line.

NZD/USD | Before The Announcement - (Feb 13th, 2020)
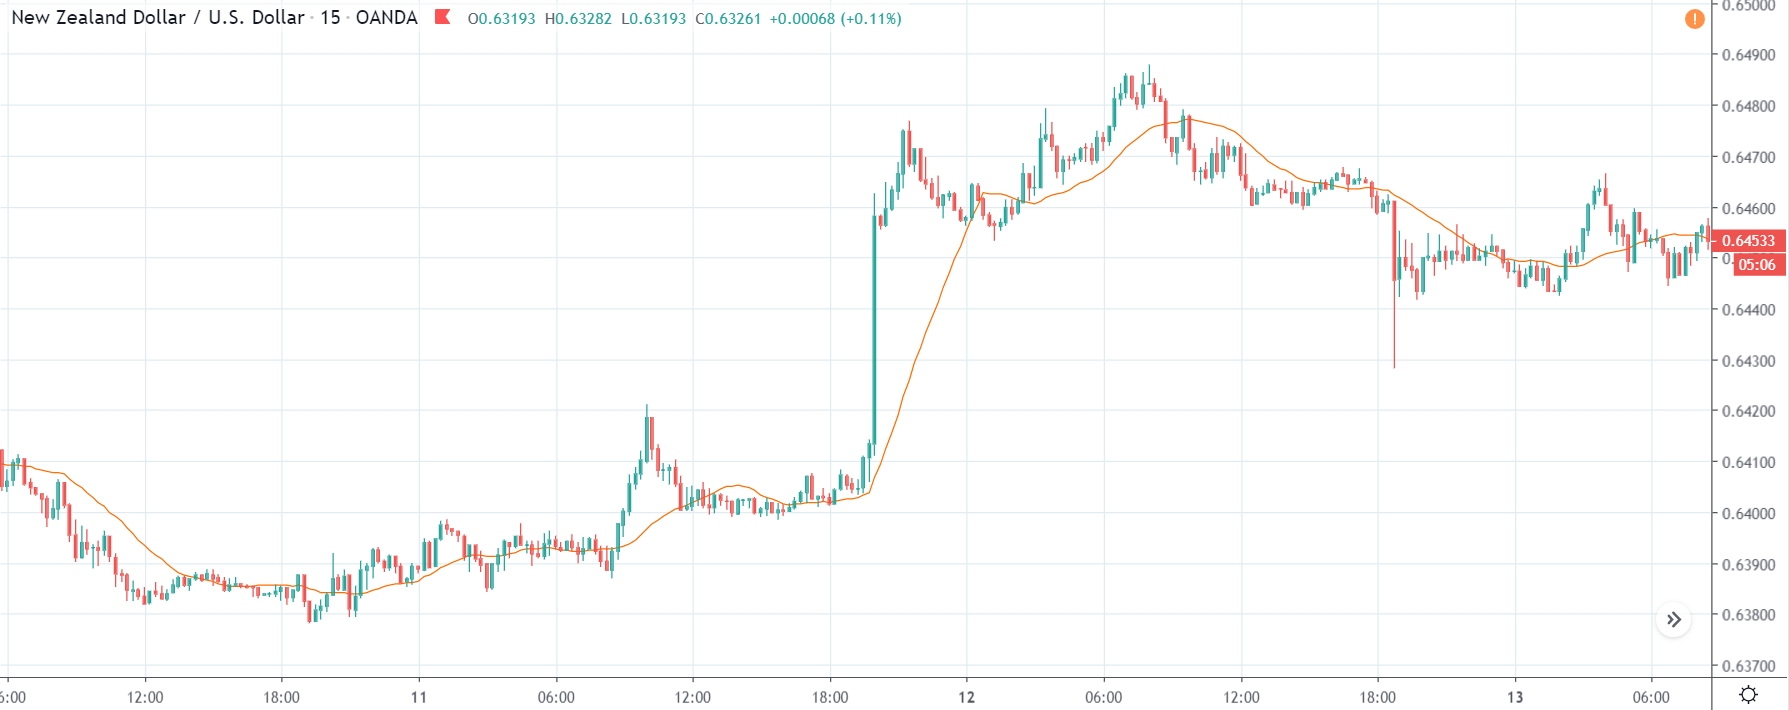
NZD/USD | After The Announcement - (Feb 13th, 2020)
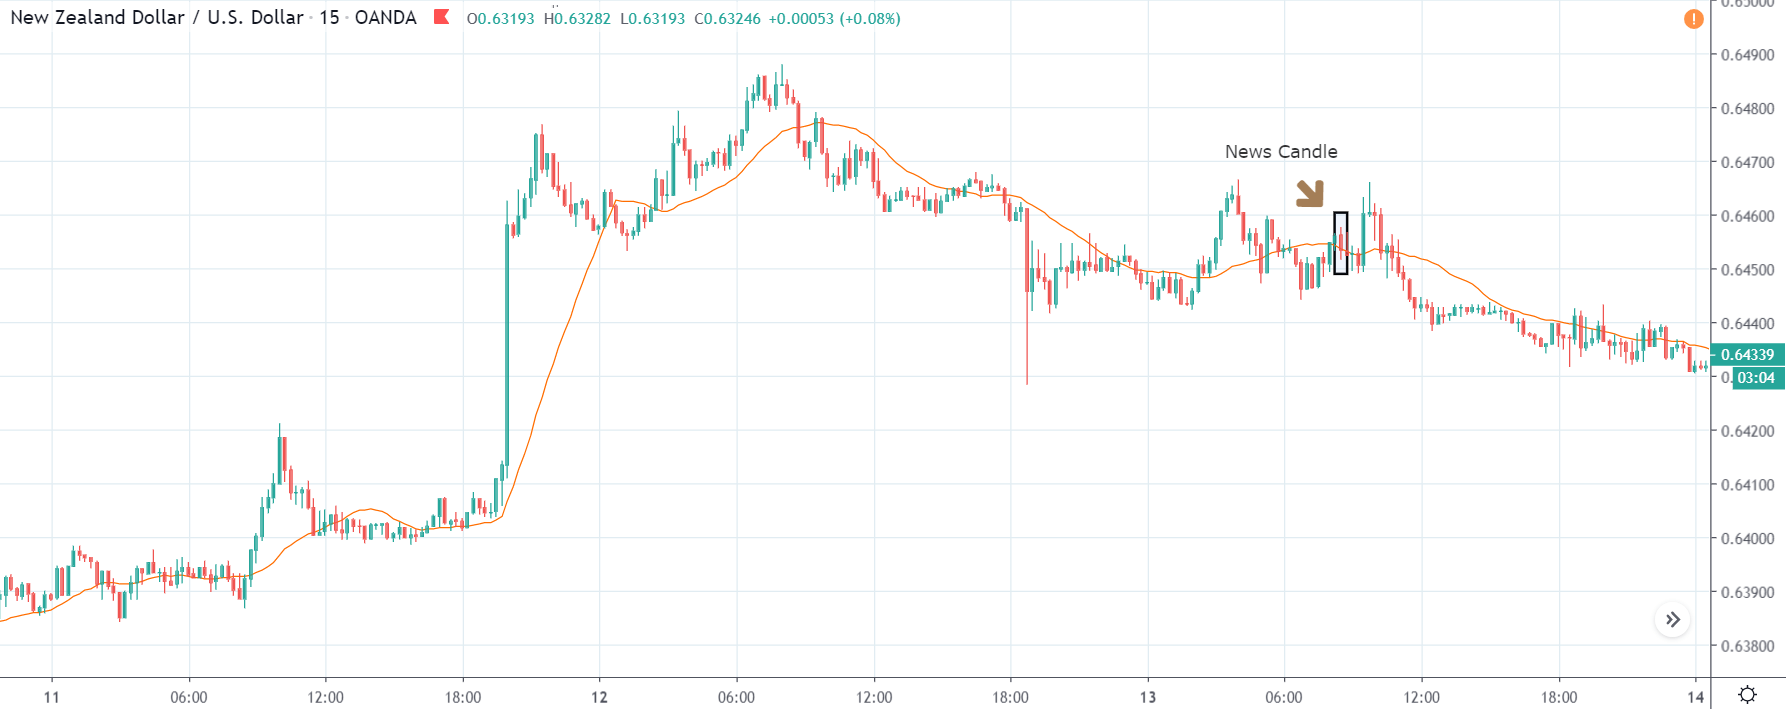
The above charts represent the currency pair of NZD/USD. It shows similar characteristics as that of the AUD/USD pair before and after the news announcement. The CPI data caused the US dollar to strengthen against the New Zealand dollar, where the volatility change can be seen when the market turns into a downtrend.

The CPI data did have a positive impact on the currency pair, but the pair did not collapse. This means the data may not be very positive against the New Zealand dollar, where the price just remains on the MA line after news release and does point to a clear downtrend. Hence, all traders who went ”short” in this pair should look to take profits early in such market conditions as the market can reverse anytime.

That’s about Inflation Rates and its impact on some of the major Forex currency pairs. If you have any queries, please let us know in the comments below. Cheers.


Categories
Forex Assets

Analyzing The USD/SGD Forex Currency Pair

Introduction

US dollar versus the Singapore dollar, in short, is referred to as USDSGD. USD stands for the US dollar and is the base currency, and SGD stands for the Singapore dollar and is the quote currency. This currency pair comes under the sack of exotic currency pairs. Unlike the major and minor currencies, exotic currencies tend to have high volatility and low volumes.

Understanding USD/SGD

Comprehending the value of USDSGD is simple. The number of SGD equivalent to one USD is the value of the currency pair USDSGD. It is quoted as 1 USD per X SGD. So, if the value of this pair is 1.3641, then 1.3241 units of SGD are to be produced to purchase one USD.

Spread

Spread is a term given to the difference between the bid price and ask price of a currency pair. This value varies from broker to broker and on the type of execution model.

ECN: 7 | STP: 9

Fees

The fee is similar to the commission that is paid on each trade. This value, too, varies based on how the brokers execute a trade. Note that there is no fee on STP accounts. However, there is a fee on ECN accounts. And for exotic pairs, the fee is pretty high.

Slippage

Slippage is the difference between the price that a trader expected to receive and the price he actually got. There is always this difference due to the volatility of the market and the broker’s execution speed.

Trading Range in USD/SGD

Assessing the profit or loss that a trader is liable for is considered to be a vital factor in trading. This can easily be determined using the table below, which represents the pip movements in the currency pair in a given timeframe.

Procedure to assess Pip Ranges

  1. Add the ATR indicator to your chart
  2. Set the period to 1
  3. Add a 200-period SMA to this indicator
  4. Shrink the chart so you can assess a large time period
  5. Select your desired timeframe
  6. Measure the floor level and set this value as the min
  7. Measure the level of the 200-period SMA and set this as the average
  8. Measure the peak levels and set this as Max.

USD/SGD Cost as a Percent of the Trading Range

The total cost on a trade does not remain static even though you’re trading with the same broker. It varies depending on the volatility of the currency pair. To find the variation of these costs, we consider the values in the pip movement table and find the ratio with the total cost, and represent in percentage.

ECN Model Account

Spread = 7 | Slippage = 3 |Trading fee = 3

Total cost = Slippage + Spread + Trading Fee = 7 + 3 + 3 = 13

STP Model Account

Spread = 9 | Slippage = 3 | Trading fee = 0

Total cost = Slippage + Spread + Trading Fee = 9 + 3 + 0 = 12

The Ideal way to trade the USD/SGD

As mentioned, exotic pairs are pretty expensive to trade. However, it can still be traded in some moments when the costs are low.

It can be ascertained from the above table that the percentages are maximum in the min column and minimum on the max column. This means that the costs are high when the market’s volatility is low and vice versa.

Now, to ensure moderate volatility with affordable costs, it is ideal to trade when the volatility of the market is somewhere around the average values of the volatility table.

Slippage is a variable in the total cost that can be erased by trading using limit orders instead of market orders. In doing so, the costs will be reduced by a significant value. For example, if the total cost on the trade was 13 (including slippage=3), then the costs would be reduced to 10 as slippage is not considered.
Categories
Forex Assets

Knowing The Fundamentals Of NZD/USD Currency Pair

Introduction

New Zealand dollar versus the US dollar, in short, is referred to as NZD/USD or NZDUSD. This currency pair is classified as a major currency pair. In NZDUSD, NZD is the base currency, and USD is the quote currency. Trading the NZDUSD is as good as saying, trading the New Zealand dollar, as NZD is the base currency.

Understanding NZD/USD

The value (currency market price) of NZDUSD represents units of USD equivalent to 1 NZD. In layman terms, it is the number of US dollars required to purchase one New Zealand dollar. For example, if the value of NZDUSD is 0.6867, then 0.6867 USD is required to buy one NZD.

NZD/USD Specification

Spread 

The algebraic difference between the bid price and the ask price is called the spread. It depends on the type of execution model provided by the broker.

Spread on ECN: 1

Spread on STP: 1.9

Fees

Similar to spreads, fees also depend on the type of execution model. Usually, there is no fee on the STP model, but there is a small fee on the ECN model. In our analysis, we shall fix the fee to 1 pip.

Slippage

Slippage is the difference between the price asked by the trader for execution and the actual price the trader was executed. Slippage occurs on market orders. It is dependent on the volatility of the market as well as the broker’s execution speed. Slippage has a decent weight on the cost of each trade. More about it shall be discussed in the coming sections.
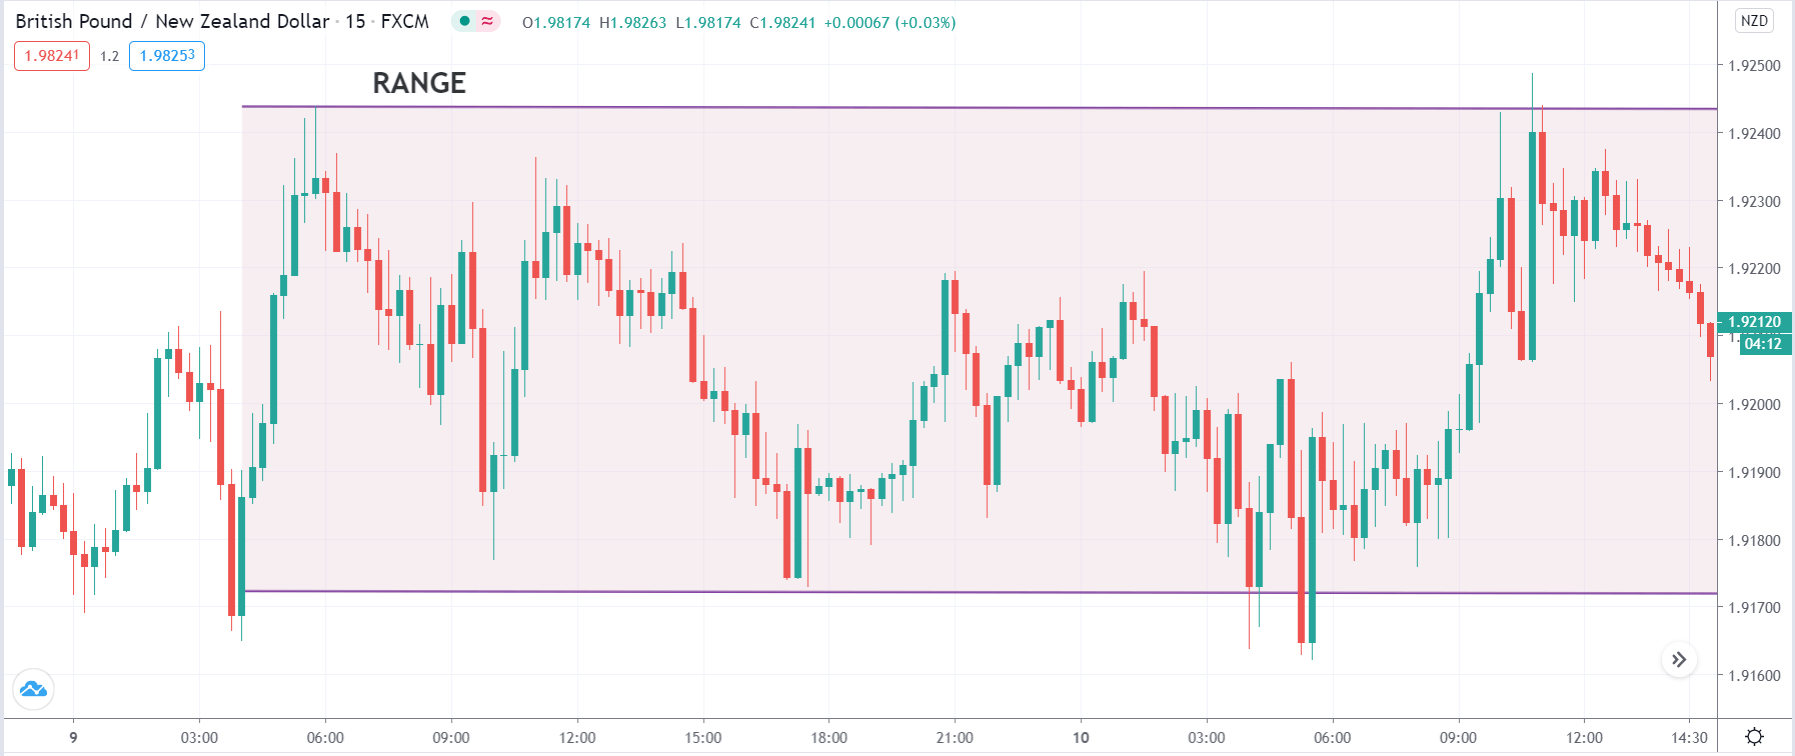
Trading Range in NZD/USD

The volatility of a currency pair plays a vital role in trading. It is a variable that differs from timeframe to timeframe. Understanding the range (min, avg, max) is essential for a trader, as it is helpful for reducing the cost of each trade.
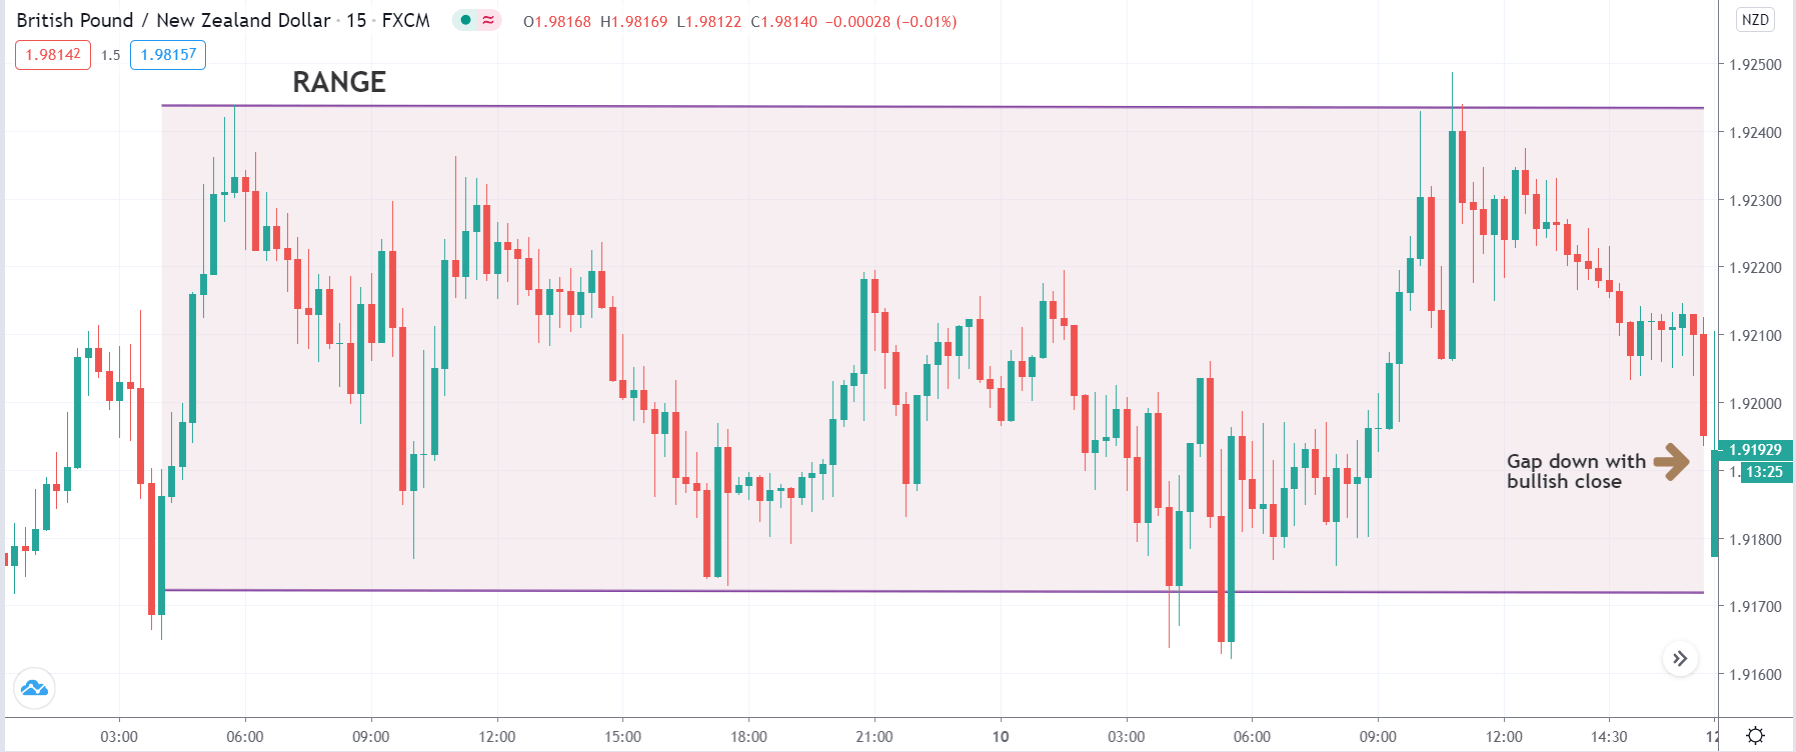
The volatility gives the measure of how many pips the pair has moved on a particular timeframe. This, in turn, gives the approximate profit or loss on each timeframe. For example, if the volatility of NZDUSD on the 1H timeframe is 10 pips, then one can expect to gain or lose $100 (10 pips x $10 [pip value]) within an hour or two.

Below is a table that depicts the minimum, average, and maximum volatility (pip movement) on different timeframes.

AUD/USD PIP RANGES 

Procedure to assess Pip Ranges

  1. Add the ATR indicator to your chart
  2. Set the period to 1
  3. Add a 200-period SMA to this indicator
  4. Shrink the chart so you can assess a large time period
  5. Select your desired timeframe
  6. Measure the floor level and set this value as the min
  7. Measure the level of the 200-period SMA and set this as the average
  8. Measure the peak levels and set this as Max.

NZD/USD Cost as a Percent of the Trading Range

With the volatility values obtained in the above table, the total cost of each trade is calculated on each timeframe. These values are represented in terms of a percentage. And these percentages will determine during what values of volatility it is ideal to trade with low costs.

The total cost is calculated by adding up the spread, slippage, and trading fee. As a default, we shall keep the slippage at 2 and the trading fee for the ECN model at 1.

ECN Model Account

Spread = 1 | Slippage = 2 | Trading fee = 1

Total cost = Slippage + Spread + Trading Fee = 2 + 1 + 1 = 4

STP Model Account

Spread = 1.9 | Slippage = 2 | Trading fee = 0

Total cost = Slippage + Spread + Trading Fee = 2 + 1.9 + 0 = 3.9

The Ideal Timeframe to Trade NZD/USD

The very first observation that can be made from the above two tables is that the total costs in both the model types are more or less the same. So trading on any one of the two accounts is a fine choice.

From the minimum, average, and maximum column, it can be ascertained that percentages (costs) are the highest on the minimum column of all the timeframes. In simpler terms, when the volatility of the currency pair is very low, the costs are usually on the higher side. Conversely, when the volatility is high, the costs are pretty low. Hence, it is ideal to trade during those times of the day when the volatility of the pair is at or above average. For example, a day trader can trade the 1H timeframe when the volatility of the currency pair is above 8.8 pips. This will hence assure that the costs are pretty low.

Another way to reduce the costs is by nullifying the slippage. This can be done by placing a limit order instead of executing them by a market order. This shall reduce the total costs by a significant percentage. An example of the same is given below.

Total cost = Slippage + Spread + Trading fee = 0 + 1 + 1 = 2

From the above table with nil slippage, it is evident that the costs have reduced by about 50%. Hence, to sum it up, to optimize the cost, it is ideal to trade when the volatility is above average and also enter & exit trades using limit orders rather than market orders.

Categories
Forex Course

18. What Should You Know About Trading The New York Session

Introduction

After the Asian and the London session, the big fishes enter into the market, i.e., the New York market. When London’s session is halfway through its trading, the New York markets make an entry into the market. Precisely, the New York session begins at 8:00 AM EST. This session is also referred to as the North American session. The liquidity during this session is pretty high.

As we have discussed the average pip movement in the Tokyo session and the London session, let us compare the pip movement by considering all the three sessions. The London session tops the table, which is then followed by the New York session and, finally, the Tokyo session.

Average Pip Movement

London session > New York session > Tokyo session

Now, let us see the average pip movement for some of the extensively traded currencies in the market.

How to trade the New York session

The New York session opens at 8:00 AM EST, which is during the London session. That is, there is an overlap between the two sessions. Since the world’s two largest markets are trading in the forex market, one can expect a high volume of orders flowing into the markets. Hence, this is an ideal time to enter the market as the spreads are quite low during this phase of time.

During the New York session, the economic news begins to drop. And as a matter of fact, 85% of the news is related to the US Dollar. So, news traders can keep a close watch on all the US Dollar pairs as the news typically moves the market drastically.

During the market open, the liquidity of the market is excellent, but as the noon approaches, it begins to drop. That is, during lunch hours, the market goes into a consolidation phase.

Another interesting fact to consider is, the market loses its momentum on Friday afternoon as the weekend begins for the Asian and the European markets. Hence, it is not a good idea to trade on Friday afternoons. Apart from momentum, it is possible for the markets to reverse its direction as the traders might look to square their positions off.

Which pairs should you have on your watchlist

The liquidity during the start of the session is excellent, as the London markets are open as well. So, during this time, you can choose to trade any pair. However, it is recommended to concentrate more on the major and minor currency pairs.

Several news events come in during this session. So, a news trader can take advantage of them, although a novice trader should stay away from pairs affected by such events, as it requires abilities unrelated to technical analysis.
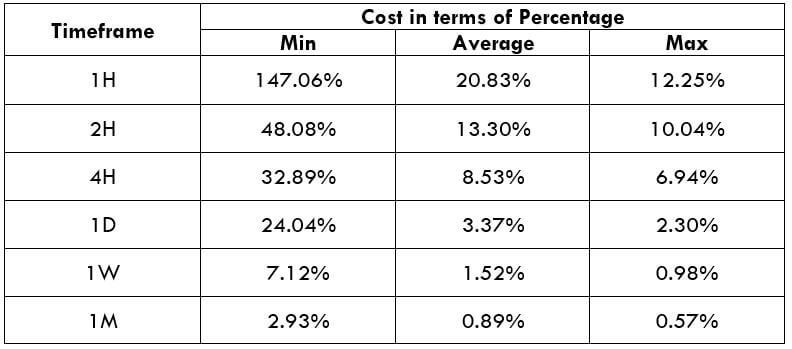
Therefore, all in all, the New York session is a session that can be profitable for all types of traders. The volatility of the market during this session stands in between the London session and the Asian session. Hence, if you’re a novice trader, it is a good idea to start off with the New York session.

We have completed this short tutorial in the New York session. And in the next lesson, we shall go more precisely into when exactly to trade the Forex market. Let’s see if you have understood this lesson correctly by answering the questions below.

[wp_quiz id=”47122″]
Categories
Forex Course

16. Trading The London Session

Introduction 

The London session, also referred to as the European session, is the session where a significantly high amount of trading happens. The London session opens at 3:00 AM EST and is rigorously traded for eight hours straight.

There are several big financial institutions in Europe. So, the trading volume in the FX market during this session is extremely high. Due to this, many retail traders also show massive participation during this session. Hence, the London session was named the forex capital of the world.

There are thousands of transactions every minute during this session. As per sources, 30% of all forex transactions are executed during the European session.

In the previous lesson, we saw the average pip movement in the Tokyo session for some majorly traded currencies. The average there came to around 53. Now, coming to the London session, the average is much higher than the Tokyo session. The number stands at 72. During this session, the FX majors, as well as minors, tend to move by large amounts.

The below table gives you an idea of the average pip movement for some intensively traded currencies.

More about the London Session

As mentioned, London is considered as the Forex capital of the world. The majority of the volume in the market comes during the London session. Hence, there is high liquidity during this session.

The London session opens during the closing time of the Asian market. During the Asian session, the market usually goes through a consolidation phase. But, when London opens its shops, the consolidation comes to an end, and the market begins to move in a trend state. However, during the middle of this session, the market slows down and begins to consolidate. This could perhaps be due to the fact that the traders are waiting for the New York market to open. It has also been observed that the market reverses its direction at the end of the session. This could mean that the large players are booking their profits.

As far as trading in this lesson is concerned, this is the ideal session for the trend traders. A trend trader can analyze the markets during the Asian session and gear up to take trades when the London market opens.

The best currencies to trade during the London session

It is clear from the table that we can trade any pair in the market. There is sufficient liquidity in most of the currency pairs. Specifically speaking, one can keep a close eye on pairs such as EURUSD, GBPUSD, USDCHF, USDCHF, GBPJPY, EURJPY, etc. Moreover, as there is a heavy volume of trading in these pairs, the spreads here are very tight.

Thus, this brings us to the end of this lesson. In the next lesson, we shall discuss the New York session. For now, test your learning by taking up the quiz below.

[wp_quiz id=”46939″]
Categories
Forex Market

What Is Pip & Why Should You Know About It?

What is a pip?

Essentially, a pip represents the price interest point. It is known to be the smallest numerical price move in the forex market. As you know that most currencies are priced to 4 decimal places, obviously, any change in price would start from the last decimal point. For example, in the price quote, $1.0002, ‘2’ indicates the pip value. A pipette means the 5th decimal place, while pip is the 4th decimal place.

For most pairs (except JPY), it is equivalent to 0.01% or 1/100th of one percent. In the forex market, this is referred to as Basis Point (BPS). One BPS is equal to 0.01% and denotes the percentage change in the exchange rate.

Calculation of move

Now that you know what pip means, let us see how it changes the profit and loss in your trading account. Large positions will have greater monetary consequences in your balance. The formula for calculating the value of the position is:

Position size x 0.0001 = Monetary value of pip

Let us use the above formula and apply it in some real pairs. If you open a position of 1000 units, the pip value can be calculated as 1000 (units) x 0.0001 (one pip) = $0.1 per pip.

When you open buy positions and market reacts in your favor, for every pip movement, you will earn $0.1, and the same is the case for a sell position. If the market moves against you after you buy or sell, $0.1 will be lost per pip movement as the trend continues in the opposite direction. Increasing or decreasing the number of positions will have the exact effect on the pip value.

Different currencies and their pip value

Pip value varies per currency as they are dependent on how it is traded. It also depends on the trading platform and the price feed. It is important to know that there are brokers who show four digits as pip, and some show five. One of the most important points you need to know is the average daily trading range, in order to gauge volatility in the market.

Average daily pip movement of major currency pairs

Conclusion

To conclude, pips are the smallest increment by which a currency pair can change in value and represents the fourth decimal of a currency pair other than the Japanese yen. In the case of Japanese yen, the pip is located at the second decimal place. Proper knowledge of pips will help you determine your stop loss size, as it is a major part of any strategy. One should never underestimate the simplicity of pip. Now that you have learned what a pip means, you can proceed to more trading concepts. Cheers!

Categories
Forex Course

10. Understanding Lots & Different Types Involved

Introduction

In the stock market, securities are traded in a number of shares. Similarly, in the Forex market, currencies are traded in units of the currency. And these units are combines into different tradable sizes, and they are called as ‘Lots.’ Hence, to buy and sell currency pairs, you must trade in the form of lots. There are different lot sizes depending on the number of units you trade. For example, 10,000 units are referred to as a mini lot and 100,000 units as a standard lot. Now, in this lesson, we shall understand other lot sizes along with some examples.

What is a lot in Forex?

A lot in Forex is the number of units of a currency pair. Note that one unit is not equal to one lot. Instead, a collection of units of a currency pairs make a lot. And depending on the number of units that are involved in making up a lot, there are different lot sizes in the market.

Different Types of Lots in Forex

Depending on the number of units, we can classify Lots in four types.

Standard Lot

The size of this lot is 1 and is made up of 1000,000 units of a currency pair. So, buying 100,000 units of EURUSD is as good as saying you have bought 1 lot of EURUSD.

Mini Lot

In terms of lot size, the quantity of ‘lots’ in a mini lot is 0.1. And one mini lot consists of 10,000 units of a currency pair.

Micro Lot

The quantity of lots in a micro lot is 0.01. And this lot is made up of 1,000 units. So, buying is 1 micro lot means, buying 0.01 lots or 1,000 units.

Nano Lot

0.001 lots make up one nano lot, and it consists of 100 units of a currency pair.

Now, let us take some examples and clear out the differences in these types.

Examples

E.g., 1: Buying 5 standard lots.

Lot size distribution = 5 * 1 standard lot

Number of units = 5 * 100,000 = 500,000 units

E.g., 2: Selling 1.5 standard lots

Lot size distribution = 1 * 1 standard lot + 5 * mini lots

Number of units = 1.5 * 100,000 = 150,000

E.g., 3: Buying 3.2 mini lots

Lot size distribution = 3 mini lots + 2 micro lots

Number of units = 3.2 * 10,000 = 32,000

Leverage trading

You must have seen brokers who let traders trade with as low as $100. In fact, they let you trade mini lots with it. Now, you must be wondering how one can trade 10,000 units with just $100 in their account. Well, this is facilitated by the brokers as they offer to trade with ‘leverage.’

In leverage trading, brokers let you take positions larger than the capital you possess. And as far as the mechanism of this is concerned, a broker lends you with the required money to take a position. And for this, they keep some amount of your capital as deposits. This deposit stays with them until your trade is open. When the trade is closed, the complete deposit is returned back to you. Leverage, also referred to as margin, is usually measured in ratios or in percentages. A detailed explanation of this shall be discussed in further lessons.

Hence, this completes the lesson on Forex lots and its types. And below is a quiz to help you check if you have grasped the concept better.

[wp_quiz id=”45130″]
Categories
Forex Market

Everything You Need To Know About The Forex Currency Pairs

In the previous articles, we have discussed the overview of the Forex industry as a whole. In this article, let us understand in detail about the currency pairs which Forex is fundamentally about.

How does it work? 

A currency pair is a code representing the interaction of two different currencies. In that pair, the first currency is known as the Base currency, and the second one is called the Quote currency. When you are buying a currency pair, you are essentially buying the base currency and selling the quote currency. It is vice-versa for selling.

When you see a currency quoted as 1.32., it means you can exchange 1 unit of base currency for 1.32 units of the quote/counter currency. When the value of currency changes, it is always relative to another currency. If the value of GBP/USD changes from 1.26345 to 1.26460 the next day, it means that the Pound has appreciated relative to U.S. dollar or U.S. dollar has depreciated relative to Pound as it will cost more USD to purchase 1 Pound.

What are the major currency pairs?

The most liquid currency pairs are known as major currency pairs. These are the pairs where USD is involved either as a quote currency or base currency. Some of the most popular currency pairs include EUR/USD, USD/JPY, GBP/USD, USD/CHF, and USD/CAD. They represent some of the largest economies of the world and are traded in high volumes. These currencies also have low spreads, which is good for traders.

Minor or cross-currency pairs

Cross-currency pairs are nothing but the crosses of major currencies. They do not include the USD in them. Some of the popular cross-currency pairs include EUR/GBP, EUR/JPY, and EUR/CHF. Even though the trading volume of these pairs is significantly low compared to the major currency pairs, they do contribute with a large amount of volume to the Forex market. Let’s understand more about the volatilities and preferences of these minor currencies.

  • Predicting the EUR/GBP currency pair is most difficult compared to other currencies.
  • Traders prefer trading EUR/JPY as they believe it is easier to forecast, thus making it a popular cross-currency pair.
  • EUR/CHF is also popular because of the fact that the Franc is a safe-haven currency. It is traded during times of high volatility.

Here we have only discussed the EUR crosses. We recommend you to explore more cross-currency pairs and understand each of their volatilities. There is another type of currency pair known as Exotics. In this type of currency pairs, one currency is Major while the other an upcoming currency. Examples – USD/TRY & USD/MXN.

Commodity currencies

Australian dollar and New Zealand dollar are the currencies that are greatly influenced by commodity prices. The Australian dollar is greatly affected by mining commodities, beef, wool, and wheat. Aussie (AUD) is strongly influenced by China as these two countries are huge trading partners. USD/CAD is also one currency that is affected by commodities like oil, timber, and natural gas. The Canadian dollar price movement is strongly related to the U.S. economy. New Zealand, however, is heavily influenced by news release of agriculture and tourism. Along with commodities, the effect of central banks and reserve banks shouldn’t be underestimated. Changes in monetary policy from either of the country’s banks will lead to huge volatility.

The point we are trying to make here is that each of the currency pair’s price movements is influenced by some of the other external factors. As you start your journey in trading Forex markets, you will understand these influencing factors in detail.

What moves these currency pairs?

As discussed above, there a lot of independent factors that move the price of these currencies. But the fundamental factors are interest rates, economic data, and politics. Let’s understand these in detail.

Interest rates – Central banks raise or reduce interest rates to maintain financial stability. This increases demand for currencies whose interest rates are high, as investors get a higher yield on their investments.

Economic data – Economic releases are reports that give a glimpse of the nation’s economy. Relevant economic data include CPI, Non-farm payroll, GDP, Retail sales, and PMI. This data will have a positive or negative effect on that country’s currency.

Politics – Trade wars, elections, and changes in the ruling government introduce instability, which reflects in the Forex market. The decision the government’s take can boost or depreciate the economy.

Which currency pair should you trade? 

If you are new to forex, choose the currency pair which has the most liquidity. Always start with Major pairs before exploring the others. Analyze the fundamentals of a currency. If you know technical analysis, you can combine it with technical indicators to know and understand when to trade. Do not use leverage; even if you do, use appropriately so that you don’t wipe out your account. To learn more about Forex trading from the very basics, you can sign-up for our free Forex course here. Cheers!

Categories
Forex Course

3 – Reading & Understanding The Currency Pairs

Introduction 

From the previous lesson, we know that global currencies are traded in the Forex market. These currencies are exchanged in pairs. We also understood what Major, Minor, and Exotic pairs are. In this lesson, let’s discuss more characteristics of these currency pairs.

Out of the three types of currency pairs, the most traded type are Majors. These major pairs contribute more than 85% of the total Forex trading volume. Prices in these pairs move in tighter spreads, but they are a bit volatile during market opening hours. Major pairs are those who have USD in them. Some of the major pairs are EUR/USD, USD/JPY, GBP/USD, and USD/CHF. The other vital pairings which do not include the US dollar are known as ‘cross currencies.’ Some of these are GBP/EUR, EUR/CHF, EUR/JPY, etc.

Reading a Currency Pair

Since we are talking about currency pairs and the Forex market, it is essential to learn how to read them. Every currency has a three-letter symbol defined by the International Organization for Standardization(ISO), which is straight forward. Below is the terminology for some of the major currencies.

  • British Pound for GBP
  • US dollar for USD
  • Japanese Yen for JPY
  • Swiss Franc for CHF
  • Euro for EUR

To understand the reading of a currency pair, you need to know the meaning of base and quote currencies. The first currency in a Forex pair is called base currency, and the second one is called quote currency. As we know, trading the Forex market involves selling one currency to buy the other. For instance, we sell the base currency to buy the quote currency. Let’s say you are trading USD/CAD. USD is your base currency, and CAD is your quote currency. Here, when we are executing a sell trade on this pair, we are primarily selling USD to buy CAD. And vice-versa if you are placing a buy trade.

How much one unit of the base currency is worth against the quote currency defines the price of a pair. In the above example, if USD/CAD is trading at 1.32267, that means one US dollar is worth 1.32267 Canadian dollars.

Liquidity of Major Pairs

Liquidity in these pairs is the highest when compared to other pairs. The larger the import/export value between two nations, the more liquid the currency pair of these countries will become. EUR/USD is the most liquid pair in the world. Major currency pairs should not be confused as the best currency pairs to trade. Trading a particular currency pair depends more on strategy and market sessions. When we say ‘major,’ we mean the most actively-traded Forex pair. The six most actively-traded Forex pairs are:

  • EUR/USD
  • USD/JPY
  • GBP/USD
  • USD/CAD
  • USD/CHF
  • AUD/USD

One of the reasons behind these currencies being traded so extensively is the political and economic stability associated with these currencies. Big investors feel it is safe to park their money in such economies.

What Should You Trade?

If a currency pair has high liquidity, the volatility of that pair decreases. Currency pairs that are linked with the market openings should be our first choice. For example, it is recommended to trade the US dollar during New York open or trading the Australian dollar during Asia opening, as there will be good volatility during this time. Also, consider economic news releases, technical chart analysis, and other events while choosing the currency pair to trade. For people who have just begun their Forex trading journey, it is recommended to start trading major currency pairs before experimenting with minors and exotics. Now try answering the below questions.

[wp_quiz id=”41992″]