
Introduction
In the Forex market, we don’t really have a centralised exchange as we’re trading over the counter. This is the reason why it is so difficult to determine exact trading volumes in Forex. Even though there is no centralised exchange to provide us with the volume data, many forex broker’s and trading platforms keep track of the average volumes in a pair. Each retail broker will have their own aggregate trading volume. Platforms like TradingView also have a volume attached to their chart. We all have realised over time that volume in the forex market is an important indicator, which is the reason why we need the best volume indicator.
The volume indicator used to read the volume in the forex market is the Chaikin Money Flow indicator (CMF.) The CMF was developed by Marc Chaikin, who is a trader himself, and was coached by the most successful institutional investors around the world. The reason Chaikin Money Flow (CMF) the best volume indicator is that is measures institutional accumulation and distribution.
Normally, on a rally, the Chaikin volume indicator should be below zero. Conversely, on sell-offs, the indicator should be below the ‘zero’ line.
Time Frame
The strategy works well on the 1-hour and 4-hour time frame only. Therefore, we can say that it is a swing trading strategy and is not suitable for trading intraday.
Indicators
We will be using just one indicator in this strategy, and that is the Chaikin Money Flow indicator (CMF.) The rest all is based on price action.
Currency Pairs
The strategy is suitable for trading in almost all currency pairs that are listed on the broker’s platform. But we need to make sure that the forex pair has enough trading volume.
Strategy Concept
Volume trading requires us to pay careful attention to the forces of demand and supply. Volume traders look for instances of increased buying or selling orders. They also pay attention to the current price movement and trend of the market. Generally, increased trading volume leans towards heavy buy orders. These positive volume trends will prompt us to open new positions on the ‘long’ side of the market, depending on the price action.
On the other hand, if trading volumes and cash flow decrease—it indicates a “bearish divergence. This may be appropriate to sell. We will pay attention to the relative volume—regardless of the number of transactions occurring in a trading period. By learning how to use the Chaikin money flow and other relevant indicators, we will be able to identify whether to ‘buy’ or ‘sell.’
With practice, the volume trading strategy can yield a win rate of 75%!
Trade Setup
In order to explain the strategy, we have considered the chart of EUR/USD, where we will be illustrating a ‘long’ trade using the rules of the strategy.
Step 1
Firstly, look for a price reversal in the market or a price action that reverses an established downtrend or uptrend. This is an easy and simple step that requires us to have a basic understanding of price reversal. This reversal should be accompanied by the rising Chaikin volume indicator that shoots up in a straight line from below zero to above the ‘zero’ line, during the reversal of a downtrend. In an uptrend, the slope should be downwards, i.e., from positive to negative.
When the volume indicator goes negative to positive in a strong fashion, it shows an accumulation of smart money.

Step 2
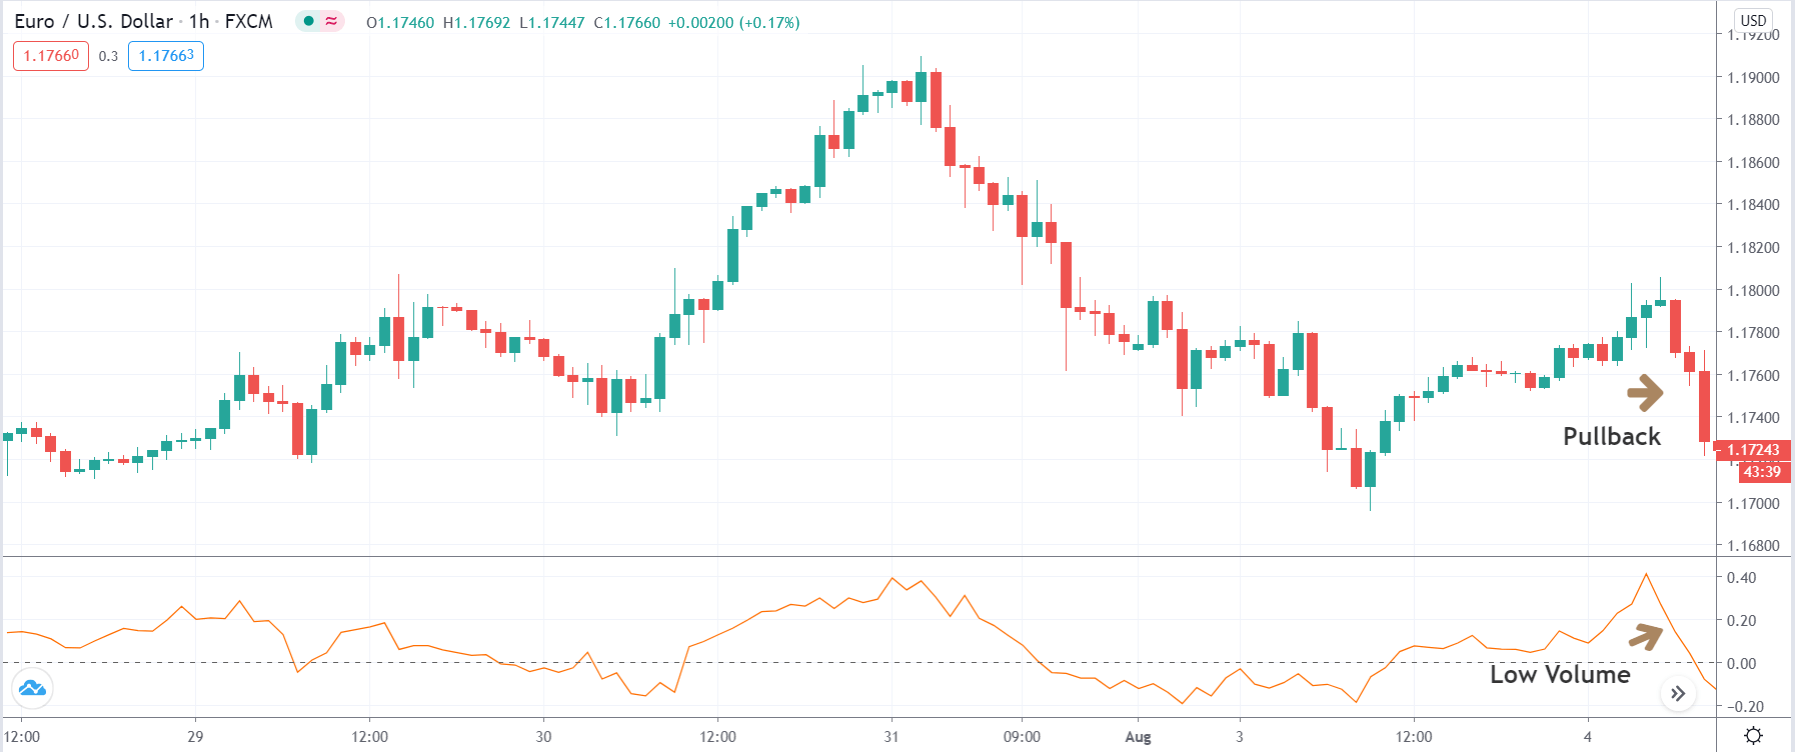
Wait for the price to pullback near the previous lower low after an upward reversal. Likewise, wait for the price to pullback near the previous higher high. The Volume Indicator should also pullback in a similar manner. If the pullback is coming in slowly, the trade has a higher probability of performing. If the pullback is strong, we will exercise some caution.
When the volume indicator is decreasing and drops below zero, we have to make sure that the price remains above the swing low. If the market is satisfying all the conditions of the strategy until now, we can move on to the next step.
Step 3
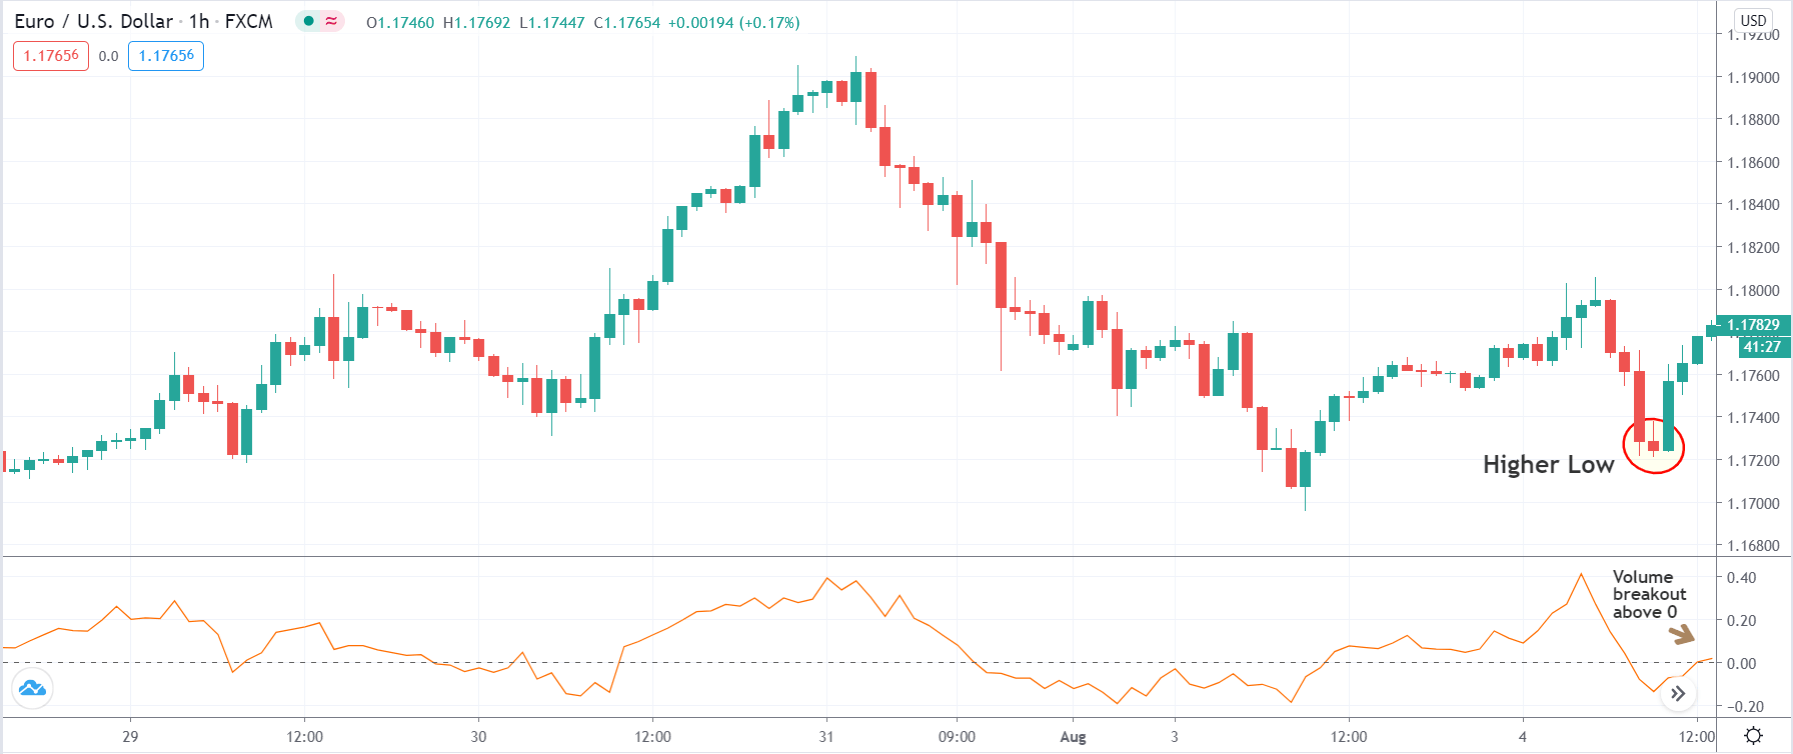
Wait for the Chaikin volume indicator to break back above the zero lines. We enter for a ‘buy’ once a ‘higher low’ is confirmed, and the price starts moving in the direction of the reversal. In a reversal of an uptrend, the Chaikin indicator should break below the ‘zero’ line. We enter for a ‘sell’ once a ‘lower high’ is confirmed, and the price starts moving lower. Once the institutional money comes back in the market, we wait for them to step back and drive the market.
The below image shows a ‘higher low’ being formed along with the volume breakout.
Step 4
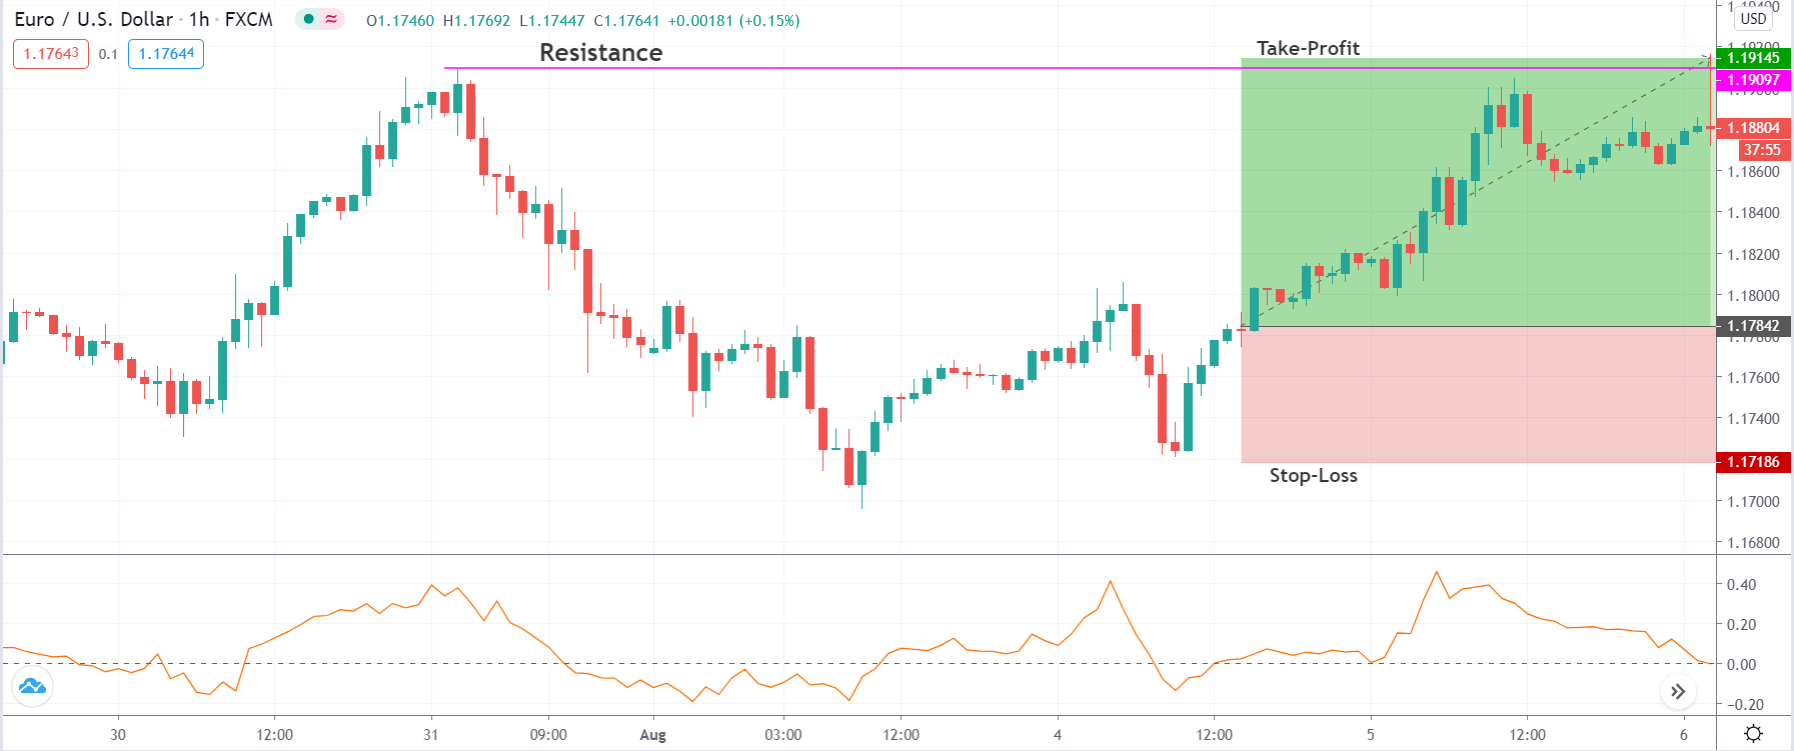
This brings us to the next important step, where we establish protective stop-loss and take-profit for the strategy. We place stop-loss below the ‘higher low’ that confirmed the reversal when ‘long’ in the pair and above the ‘lower high ‘when ‘short’ in the currency pair. This strategy indicates a strong reversal in the market that will change the trend of the market. This is why we set our ‘take-profit’ at the origin of the previous trend.
In our example, the risk-to-reward of the trade was over 1:2, which is great.
Strategy Roundup
The volume trading strategy will continue to work in the future; it is based on the activities of the smart money. Even though they hide all their operations, their footprints are still visible. We can read those marks by using proper tools. The Chaikin indicator will add value to our trading because it gives a window into the volume activity the same way we traded the stocks. Make sure to follow this step-by-step guide to trade properly using volume.