Introduction
CAD/AED is a Forex exotic currency pair, where CAD represents the currency of Canada, an AED is the currency of the UAE. In this exotic currency pair, CAD is the base first, and AED is the second currency.
Understanding CADAED
This pair’s price determines the value of AED, which is equivalent to one CAD. We can term it as 1 CAD per X numbers of AED. For example, if the CAD/AED pair’s value is at 2.8007; therefore, we need almost 2.8007 AED to buy one CAD.
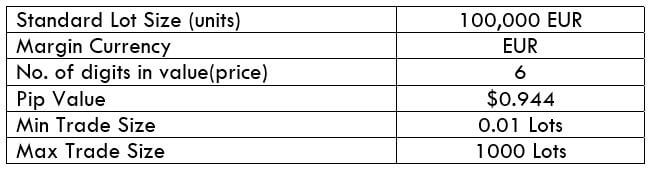
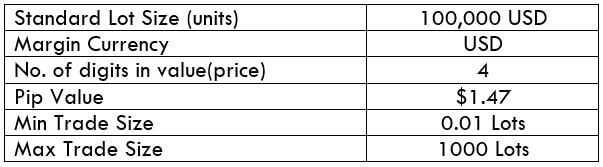
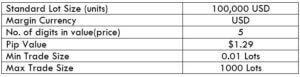
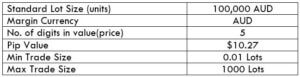
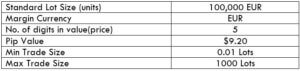
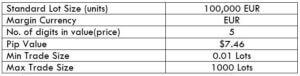
CADAED Specification
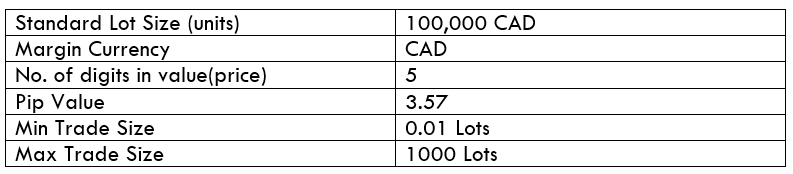
Spread
In every financial market, Spread represents the difference between the Bid and Ask. It is usually a charge that is deducted by the forex broker. This value changes with the type of execution model.
Spread on ECN: 10 pips | Spread on STP: 15 pips
Fees
The trading fees in the forex market and stock market are the same. It is deducted from the traders’ accounts as soon as they open a new position. Note that STP accounts do not charge anything, but a few pips charges on ECN accounts.
Slippage
Slippage happens when price opens above or below the execution level. Slippage occurs because of two important reasons – market volatility and broker’s execution speed.
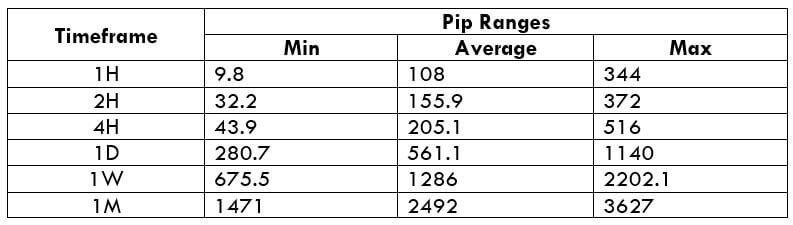
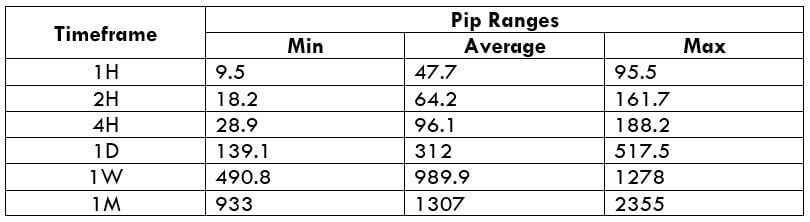
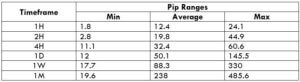
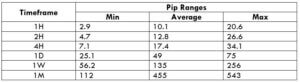
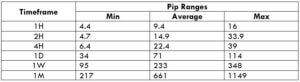
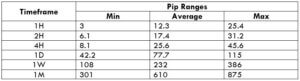
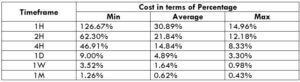
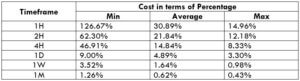
Trading Range in CADAED

Procedure to assess Pip Ranges
- Add the ATR indicator to your chart
- Set the period to 1
- Add a 200-period SMA to this indicator
- Shrink the chart so you can assess a large time period
- Select your desired timeframe
- Measure the floor level and set this value as the min
- Measure the level of the 200-period SMA and set this as the average
- Measure the peak levels and set this as Max.
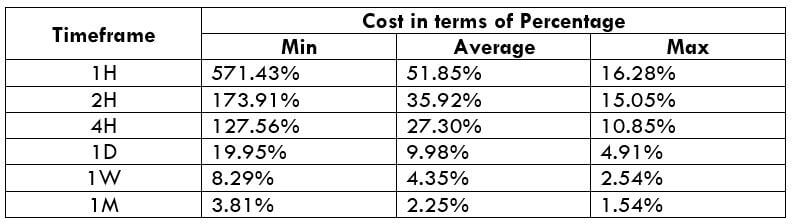
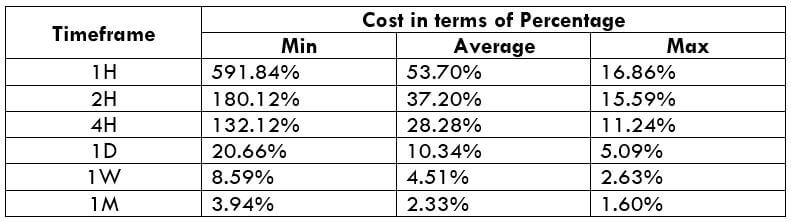
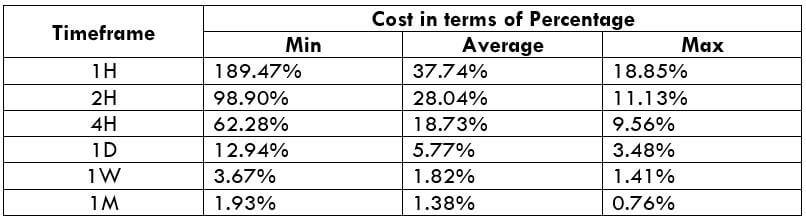
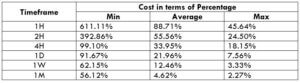
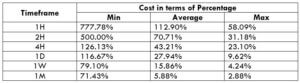
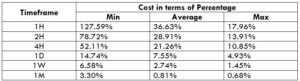
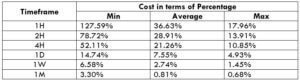
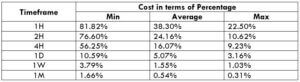
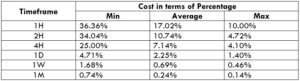
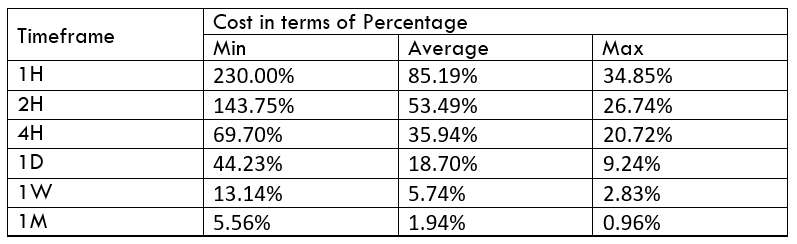
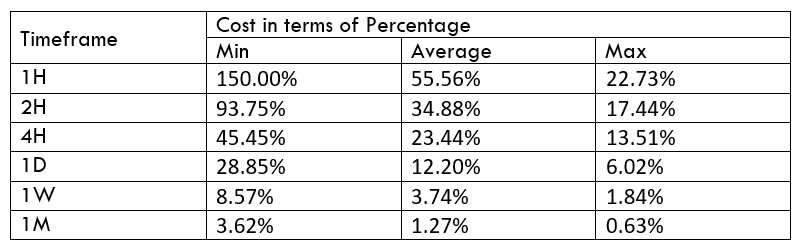
CADAED Cost as a Percent of the Trading Range
The volatility values on the above table indicate how the cost varies with the change in market volatility. All we did is to get the ratio between the total cost and the volatility values and converted them into percentages.
ECN Model Account
Spread = 10 | Slippage = 5 | Trading fee = 8
Total cost = Spread + Slippage + Trading Fee
= 10 + 5 + 8 = 23
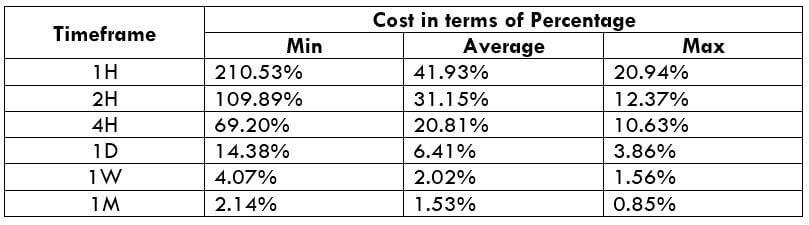
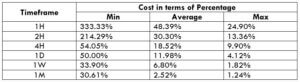
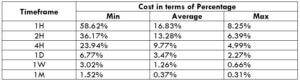
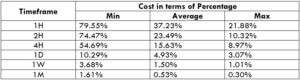
STP Model Account
Spread = 10 | Slippage = 5 | Trading fee = 0
Total cost = Spread + Slippage + Trading Fee
= 10 + 5 + 0 = 15
The Ideal way to trade the CADAED
The CADAED is an exotic cross currency pair with higher volatility and liquidity. Because of this, traders may find it easy to trade in this pair. We can see that the percentage values above where the value did not move above 230% that represents a higher trading cost in the lower timeframe. However, when we move to the monthly timeframe, the average cost came to below 2%.
Therefore, trading intraday in this currency pair is risky due to the high trading cost. On the other hand, trading in a higher timeframe has less cost, but it requires a lot of patience and time. Overall, for every trader, it is recommended to stick on trading where the trading cost is at the average value.
Another way to reduce the cost is to place a pending order as ‘limit’ and ‘stop’ instead of ‘market.’ In that case, there will be no slippage in the calculation of the total costs. So, in our example, the overall cost will be reduced by five pips.
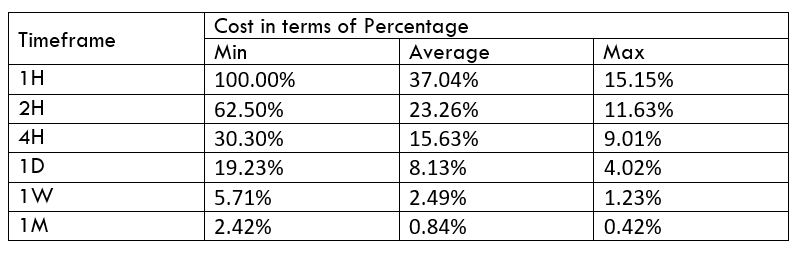
STP Model Account (Using limit orders)
Spread = 10 | Slippage = 0 | Trading fee = 0
Total cost = Spread + Slippage + Trading Fee
= 10 + 0 + 0 = 10