Understanding CADDKK
CADDKK is an exotic currency pair where CAD is the major currency Canada and DKK is the currency of Denmark. In this currency pair, CAD is the first currency, and DKK is the quote currency.
The price of CADDKK determines the value of DKK that is equivalent to one CAD. We can term it as 1 CAD per X amount of DKK. For example, if the CADDKK pair’s value is at 4.7712, we need almost 4.7712 DKK to buy one CAD.
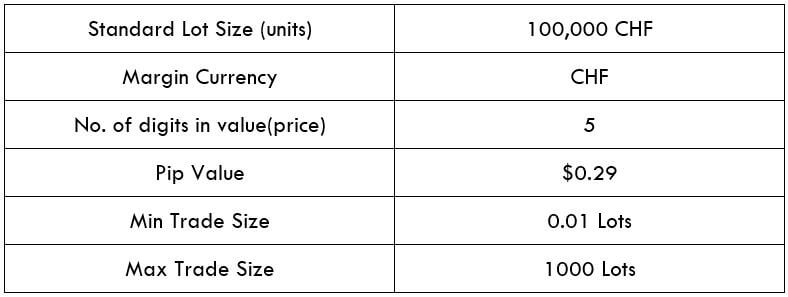
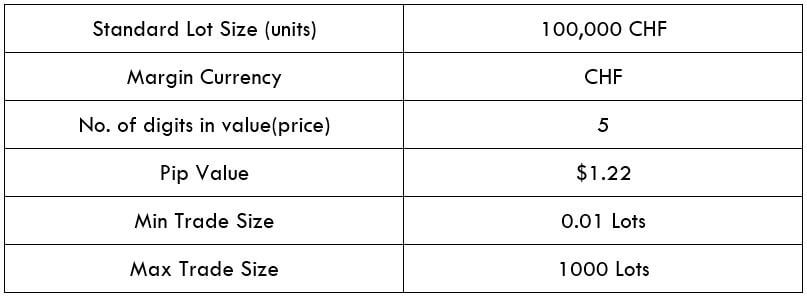
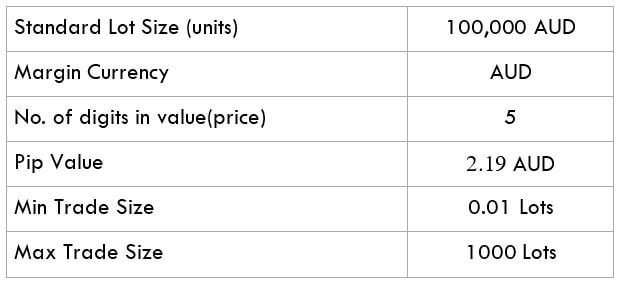
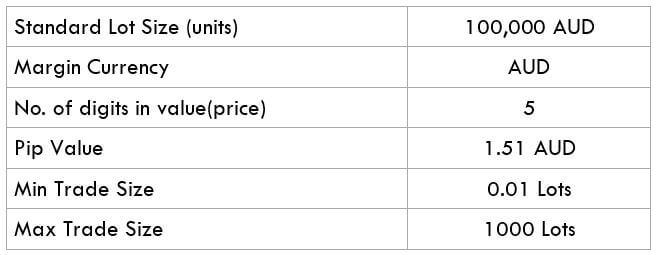
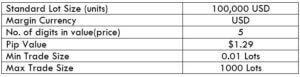
CADDKK Specification
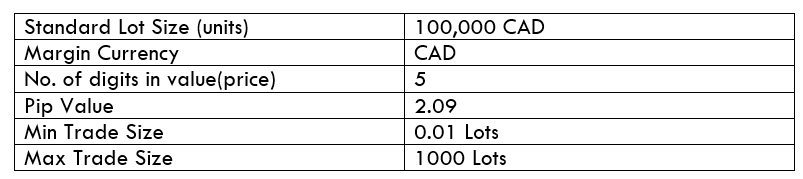
Spread
When we subtract the Bid price and the Ask price, we will find the Spread. Spread is a trading cost that is controlled by the broker. Therefore, traders don’t have to do anything with this. This value changes with the change in execution.
Spread on ECN: 19 pips | Spread on STP: 24 pips
Fees
Trading fees in the forex market is the cost that the broker takes from traders. It is automatically deducted from traders’ trading account. Note that a few pips charges on ECN accounts but there is no fee on STP.
Slippage
Spread is the difference between the execution level and the open price level when it is an excessive level of volatility in the price. Market volatility and execution speed of your broker mainly contributes to the degree of slippage.
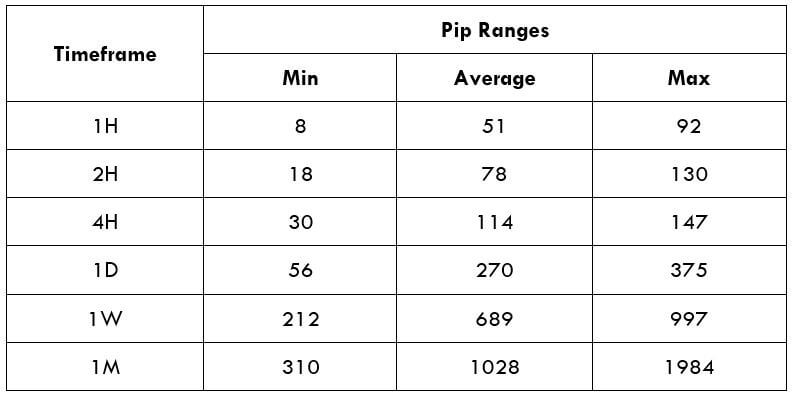
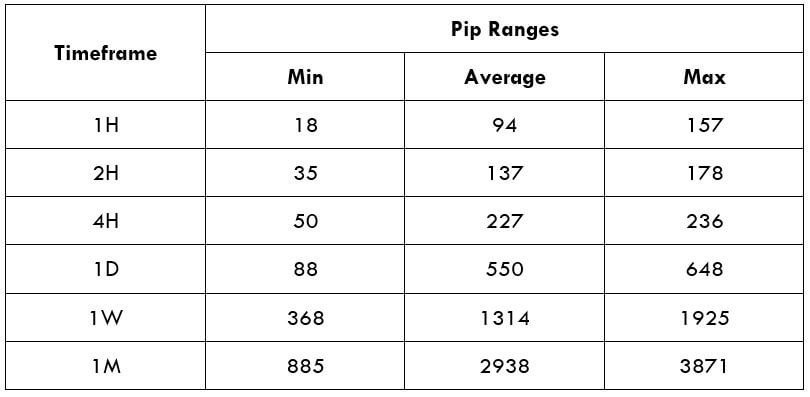
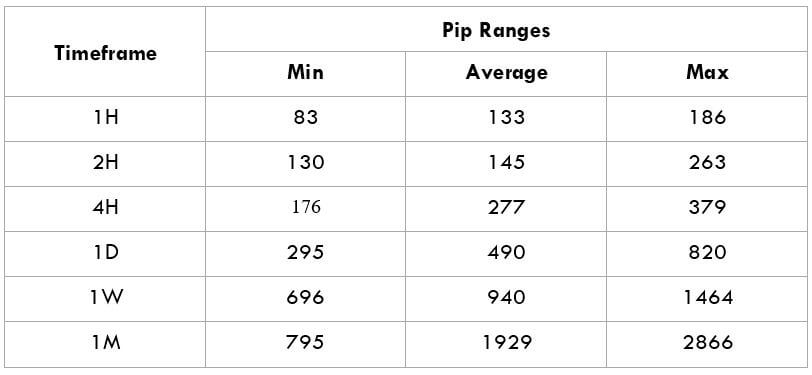
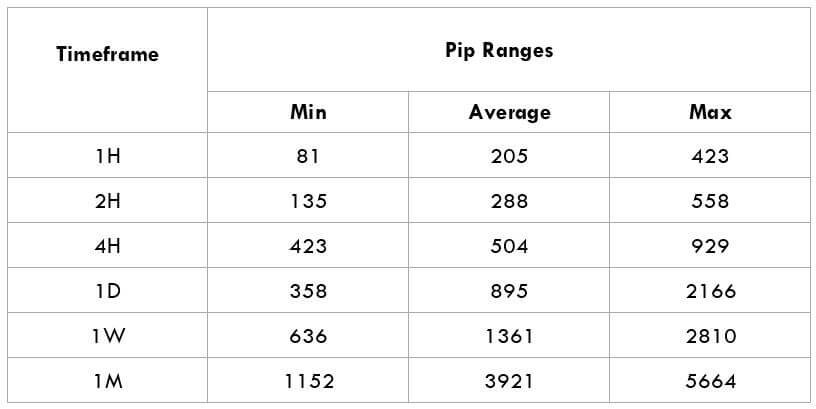
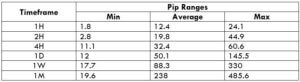
Trading Range in CADDKK
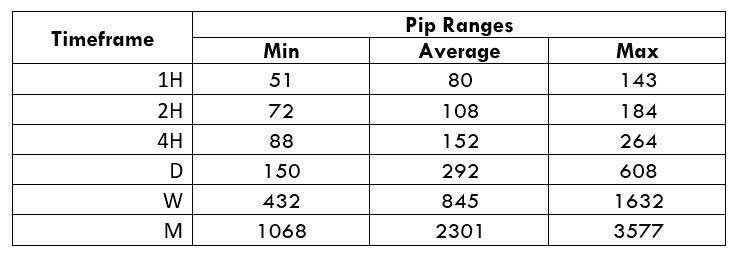
Procedure to assess Pip Ranges
- Add the ATR indicator to your chart
- Set the period to 1
- Add a 200-period SMA to this indicator
- Shrink the chart so you can assess a large time period
- Select your desired timeframe
- Measure the floor level and set this value as the min
- Measure the level of the 200-period SMA and set this as the average
- Measure the peak levels and set this as Max.
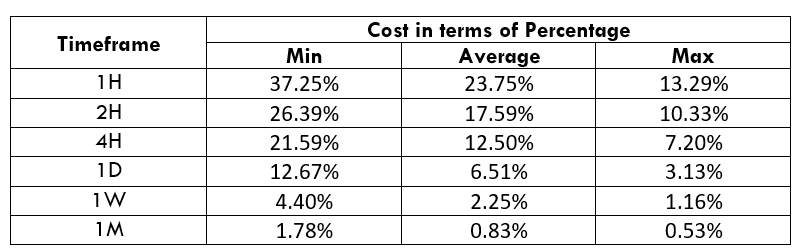
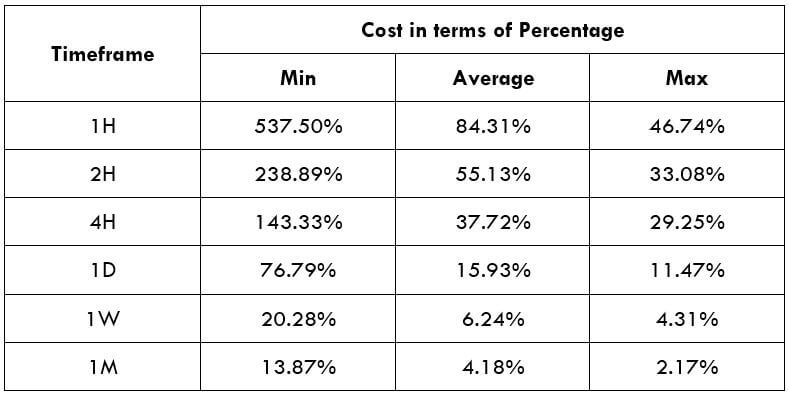
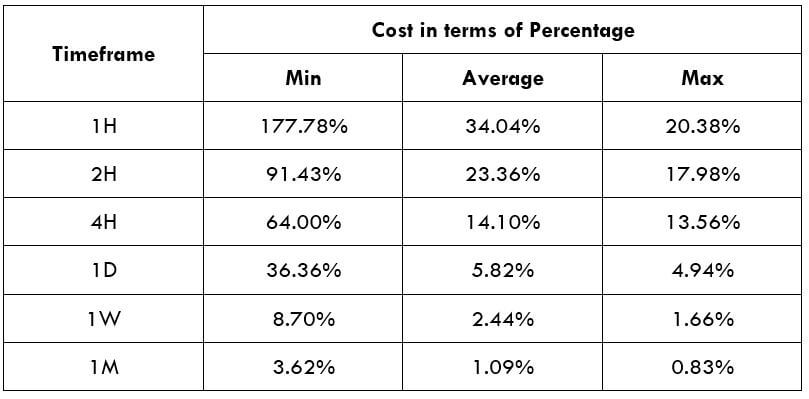
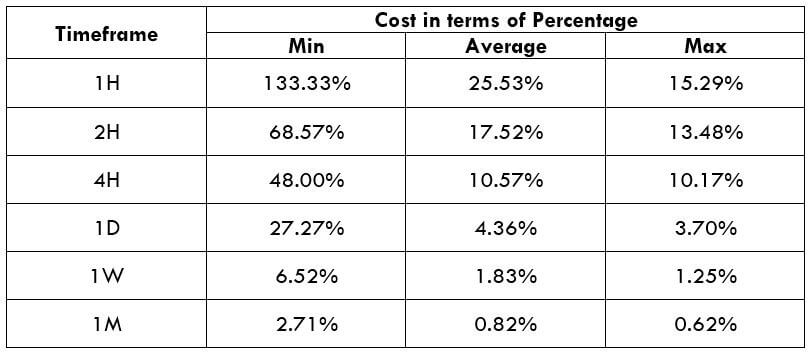
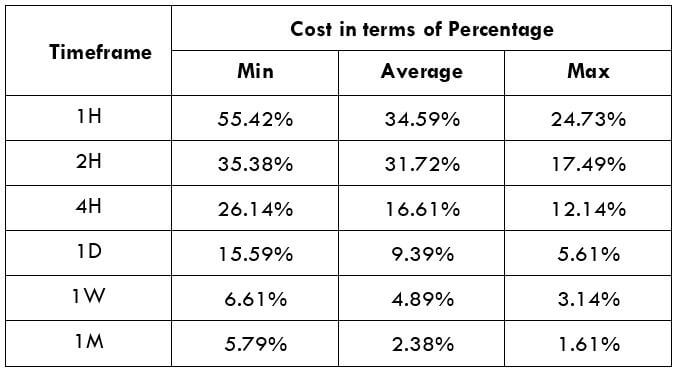
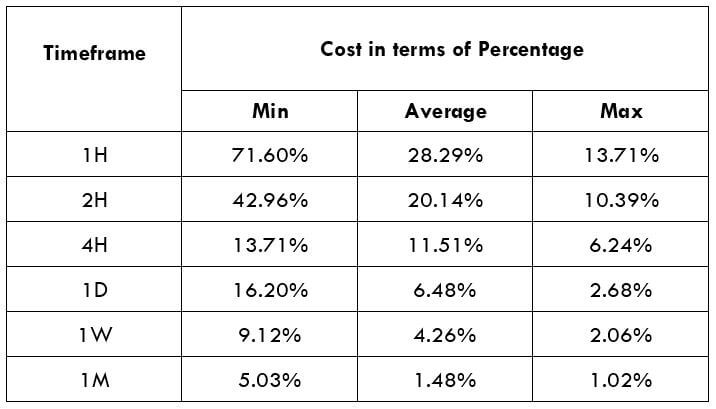
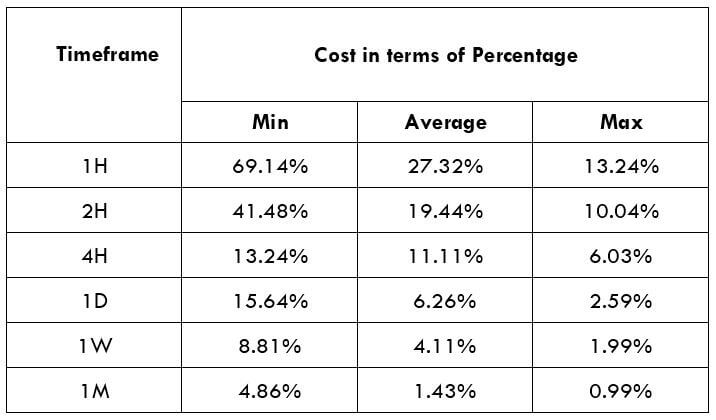
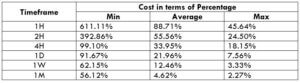
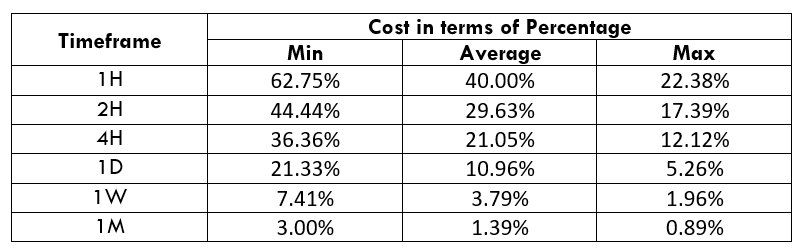
CADDKK Cost as a Percent of the Trading Range
With the volatility, values provide an indication of how the cost varies with the change of volatility. We got the ratio between the cost and volatility and converted into percentages.
ECN Model Account
Spread = 19 | Slippage = 5 | Trading fee = 8
Total cost = Spread + Slippage + Trading Fee
= 19 + 5 + 8
Total cost = 32
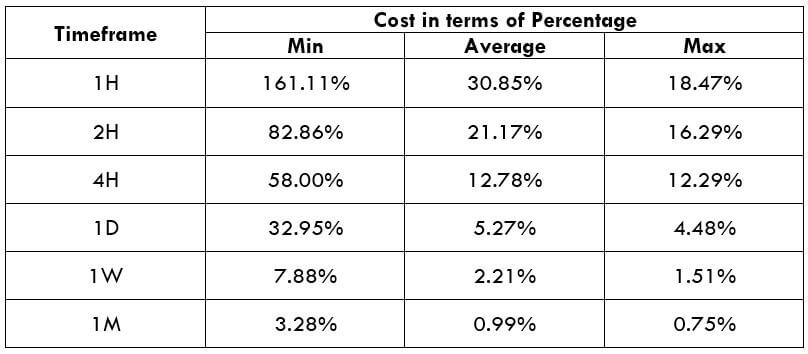
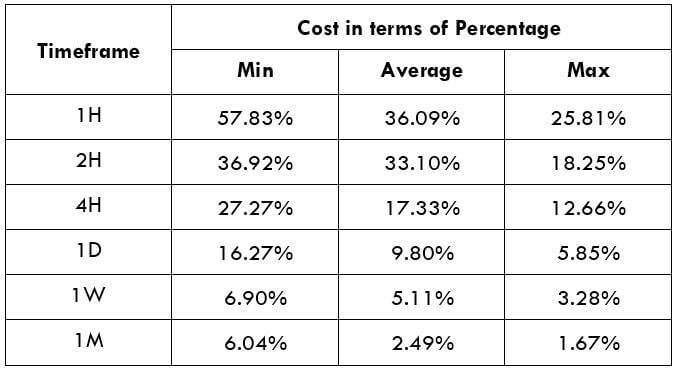
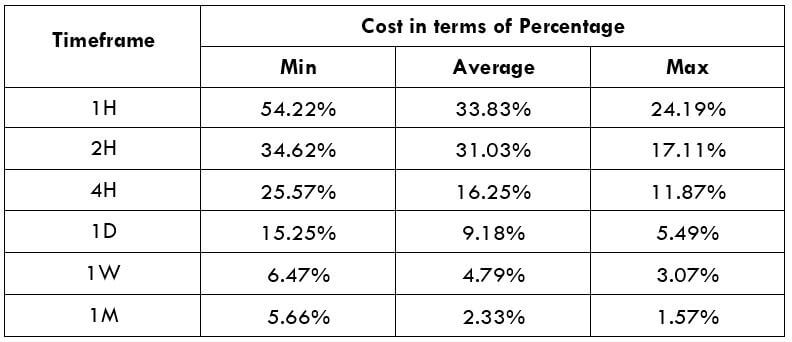
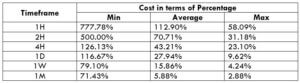
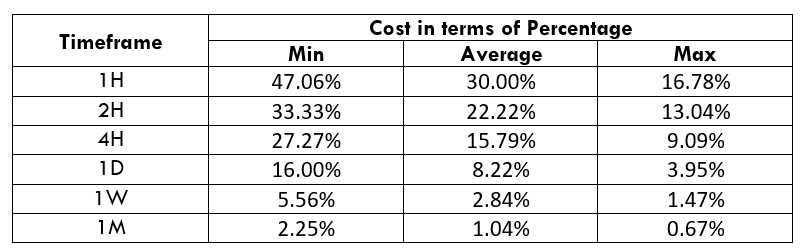
STP Model Account
Spread = 19 | Slippage = 5 | Trading fee = 0
Total cost = Spread + Slippage + Trading Fee
= 19 + 5 + 0
Total cost = 24
The Ideal way to trade the CADDKK
The CADDK is an exotic currency pair with stable volatility in the price. Therefore, it may provide a decent movement even in intraday trading. The percentage of values did not move above 64%. Therefore, we can say that that CADDKK is nicely tradeable even if in the lower timeframe. However, the trading risk is an essential factor that most of the traders should consider while making a trading decision.
Overall all traders should trade when the cost is at an average value. The increase in volatility is risky for the possibility of unwanted stop loss hit, while the decrease in volatility might make trading worthless. To reduce the cost, furthermore, you can place either a ‘limit’ or ‘stop’ order. In this case, there will be no slippage, and in this example, our total cost will be reduced by five pips.
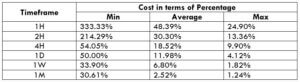
STP Model Account (Using Limit Orders)
Spread = 19 | Slippage = 0 | Trading fee = 0
Total cost = Spread + Slippage + Trading Fee
= 19 + 0 + 0
Total cost = 19