Categories
Forex Market Analysis

EURCAD Looks Bouncing from Demand Zone

The EURCAD cross is still moving in a likely incomplete triangle pattern, developing since mid-March when the price found resistance on 1.59914. As pictured by the following 12-hour chart, the mid-term Elliott Wave structure shows the incomplete progress of a contracting triangle of Minor degree labeled in green.

Technical Overview

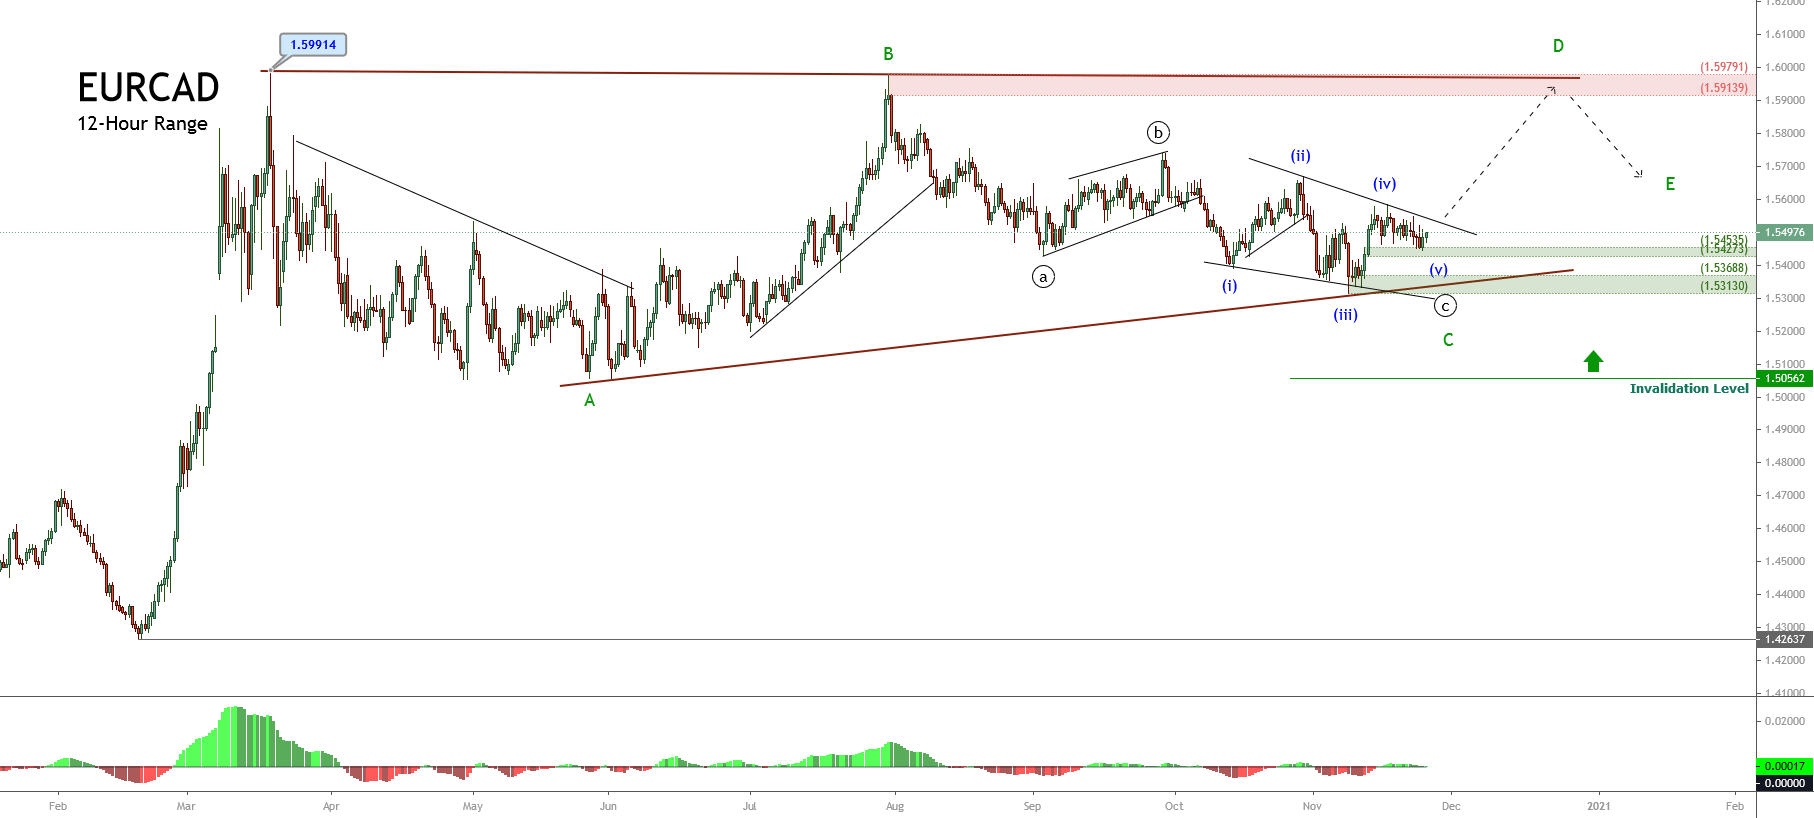
According to the Elliott wave theory, the triangle pattern follows an internal structure subdivided into 3-3-3-3-3 waves. In this context, the EURCAD triangle appears to be completing its third internal segment and start developing a new rally corresponding to wave D of Minor degree, identified in green.

On the other hand, considering the Alternation Principle, and in view that the movement developed by the wave C, in green seems like a complex corrective sequence, which took an extended time span, the following move -corresponding to wave D, could develop in a shorter time range. In this regard, it is possible that the cross would create an aggressive rally.

Short-term Technical Outlook

The short-term view displayed in its 12-hour chart (shown above) shows that the EURCAD reacted mostly upward in the demand zone identified in green between 1.54535 and 1.54273. This situation leads to expect that market participants could continue pushing it higher.

An alternative scenario considers the possibility of a new limited decline toward the next demand zone between 1.53688 and 1.53130. In this zone, the cross could find fresh buyers and complete its wave C of Minor degree, identified in green.

On the other hand, before taking any position on the bullish side, it is convenient to wait for the descending upper-line breakout that connects the waves (ii) and (iv). This would confirm the cross’s bullish bias. As for the targets, the suggested following movement, corresponding to wave D, in green, could rise till the next supply zone, located between 1.59139 and 1.59791.

Finally, the bullish scenario has its invalidation level at the end of wave A in green, located at 1.50562

Categories
Forex Elliott Wave Forex Market Analysis

EURCAD Advances in an Incomplete Triangle Pattern

The EURCAD cross reveals a mid-term consolidation formation that looks like an incomplete triangle pattern. This pattern continues in development since March 18th, when the price topped at 1.59914. In this context, this chartist pattern suggests the continuation of the previous movement, in the

The following 12-hour chart depicts the EURCAD action consolidating after a sharp rally, the cross began on February 19th when it found fresh buyers on 1.42637 and ended on 1.59914 on March 18th.

In terms of the Elliott Wave Theory, the corrective pattern presents a three-wave subdivision; the last downward move of Minute degree identified in black began at 1.59791, and current advances in its wave ((c)) in black. Likewise, its internal structure unveils four internal moves of the Minuette degree labeled in blue. 

Considering that the wave ((c)) in blue looks unfinished, the EURCAD cross could develop a new decline corresponding to its fifth wave. On the other hand, the breakout of the line that connects the end of waves (ii) and (iv) should confirm the new upward sequence that could boost the price likely toward the psychological barrier of level 1.59.

Short-term Technical Outlook

The short-term Elliott wave view unfolded in the following 4-hour chart, reveals the incomplete descending wave ((c)) of Minute degree labeled in black, which could start to advance in its fifth internal leg marked in blue.

In this context, the price could decline and found fresh buyers in the demand zone between 1.5471 and 1.5451; it even could extend its retracement to the area of 1.5408 and 1.5389, where the EURCAD cross could start to bounce.

If the price reacts mostly upward and surpasses the supply zone between 1.5538 and 1.5549, the EURCAD bias should start to turn primarily bullish. Likewise, the short-term bullish target can be found in the supply region bounded by 1.5718 and 1.5739.

Finally, if the price penetrates and closes below 1.5312, the bullish scenario will be invalid, and likely, the cross could extend its declines in “free fall.”


Categories
Forex Signals

EURCAD Breakout Retest BUY

Flow Assessment

  • Price has reached a key H4 sellers area (pink line) so we anticipate down-flow to continue, however the sellers so far have not shown much strength relative to buyers, hence we anticipate intermediate buys

Location Assessment

  • Price is reacting at a key high volatility buyers area, where there are some signs that they are defending the level

Momentum Assessment

  • Price has had a SL hunt, where some sellers have been trapped. This gives us our entry trigger.
Categories
Forex Signals

EURCAD Swing Failure BUY

Categories
Forex Signals

EURCAD Breakout Retest SELL

Categories
Forex Signals

EURCAD Swing Failure SELL

Categories
Forex Signals

EURCAD Piercing Pattern and Breakout

EURCAD has been moving in a slightly descending channel, here shown as a linear regression channel.  The last iteration of the Price drove it from the top of it to near the bottom. There, it made a double bottom figure and headed up again. After being rejected by the central regression line (dotted line), the Price retraced slightly, then, four hours ago, The Price made a piercing candlestick followed by a large candlestick that went above the last high.

A trade can be made with the entry at 1.5191, a stop below the recent low (1.5110), and a profit target neat the last high of 1.5374. for a reward/risk ration of over 2.

The technical factors ate in favor of the trade. The price moves above the +1 sigma line of the Bollinger bands, and the bands are heading up. Also, the Stochastic oscillator has triggered a buy signal near the oversold level.

The Setup

Buy Entry: 1.5191

Stop-loss:1.5110 or lower

Take-profit: 1.5374

Reward/Risk: 2

Dollar risk: $575 on one lot. $57.5 on a mini lot, and $5.75 on a micro lot

Dollar reward: $1,150 on a lot.

It is recommended not to go above 1 percent of your balance in a single position. Thus, traders should not take more than two micro lots for every $1000 in their trading account.

Categories
Forex Assets

Everything About EUR/CAD Currency Pair

Introduction

EURCAD is the abbreviation for the currency pair Euro area’s euro and the Canadian dollar. This is a cross-currency pair, as it does not involve the US dollar. In EURCAD, EUR is the base currency, and CAD is the quote currency. The price of this pair basically tells the value of CAD w.r.t EUR.

Understanding EUR/CAD

The current market price of EURCAD determines the required Canadian dollars to purchase one euro. It is quoted as 1 EUR per X CAD. For example, if the CMP of EURCAD is 1.4700, it is as good as saying that 1.4700 CAD is needed to buy one EUR.

EUR/CAD Specification

Spread

The algebraic difference between the bid price and the ask price set by the broker is known as the spread. Spread varies from time to time and broker to broker. The approximate spread value on an ECN account is 0.8, and on an STP account is 1.8.

Fees

For every position that a trader opens, there is some fee associated with it. And it depends on the type of account model. It is seen that there is no fee on STP accounts and a few pips on ECN accounts.

Slippage

Slippage is terminology in trading, which, by definition, is the difference between the trader’s wished price and the real executed price. That is, the trader does not get the exact price he had intended for. There is some variation due to the volatility of the market and the broker’s execution speed. It usually varies from 0.5 to 5 pips on these minor currency pairs. The slippage is typically lesser on major currency pairs.

Trading Range in EUR/CAD

The trading range is an illustration of the minimum, average, and maximum pip movement in EURCAD. It determines the volatility of the market. The volatility of the market is a vital piece of information in trading, as one can assess the time that can be taken on each trade. And by applying more variables to it, one can determine the cost varies on the trade as well.

Procedure to assess Pip Ranges

  1. Add the ATR indicator to your chart
  2. Set the period to 1
  3. Add a 200-period SMA to this indicator
  4. Shrink the chart so you can assess a large time period
  5. Select your desired timeframe
  6. Measure the floor level and set this value as the min
  7. Measure the level of the 200-period SMA and set this as the average
  8. Measure the peak levels and set this as Max.

EUR/CAD Cost as a Percent of the Trading Range

Cost as a percent of the trading range is a simple yet very effective application of the above volatility table. There is a cost on every trade you take. The total cost of a trade is the sum of slippage, spread, and trading fee. This total cost is divided by the volatility values and is expressed in terms of a percentage. And the percentage values are used to figure out the best times of the day to enter and exit a trade with marginal cost.

ECN Model Account 

Spread = 0.8 | Slippage = 2 | Trading fee = 1

Total cost = Slippage + Spread + Trading Fee = 2 + 0.8 + 1 = 3.8

STP Model Account

Spread = 1.8 | Slippage = 2 | Trading fee = 0

Total cost = Slippage + Spread + Trading Fee = 2 + 1.8 + 0 = 3.8

The Ideal way to trade the EUR/GBP

To determine the ideal way of trading the EURCAD, let us first comprehend what the percentage means.

High percentage => High cost

Low percentage => Low cost

Min column => Low volatility

Max column => High volatility

From the table, we can infer that the percentages are high in the min column and low for the max column. So,

Min column => High percentage

Thus, Low volatility => High cost

Max column => Low percentage

Thus, High volatility => Low cost

It is not ideal during low volatility as costs are high. Also, trading during high volatility is not a good idea as it is quite risky. Hence, to have a balance between both volatility and cost, it is ideal to trade when the pip movement on the currency pair is at the average values.

Another simple hack to reduce the costs is to trade using limit orders instead of market orders. Doing so, the slippage will be automatically cut off from the trade, and the total cost will significantly reduce.

Categories
Forex Market Analysis

Forex and Indices – Daily Update – 06.08.18


Fundamental Overview


The U.S. Dollar leads the market sentiment.

Monday’s trading session starts with the US Dollar Index gaining 0.21 per cent against the main currencies. The Aussie Dollar dips 0.19 per cent expecting for the Reserve Bank of Australia (RBA) interest rate decision which will take place in the overnight session. The analysts’ consensus does not expect changes in the monetary policy decision which should remain at 1.5 per cent, this despite the inflation (YoY) reached the 2.1 per cent, beating the 2 per cent RBA’s target.

source: tradingeconomics.com


Technical Analysis


EURUSD


The EURUSD pair in the 1-hour chart is moving bearish, below the first daily support located at 1.1547 and the second daily support at 1.1528. For long positions, the price should close above the breakdown candle at 1.1566, with a potential profit target in the first daily resistance at 1.1597. In the short position case, the second daily support breakdown could drive to the confluence between the third daily support and the first weekly support at  1.15015. Consider that this level could act as a potential reversal level.


GBPUSD

The Cable is moving bearish and is the worst performer of the session falling more than 0.5 per cent. The GBPUSD pair is testing the first weekly support at 1.2924. The bearish movement continuation could send the price to the third daily support at 1.28999, consider this level as a potential reversal zone. For bullish positions, the price should break above the breakdown candle at 1.2968 level, with a potential profit target in the daily pivot level at 1.30055.


USDCHF


The Swiss currency, from the past week, has moved bullish in five clear moves, currently is testing the confluence zone between the first weekly resistance and the second daily resistance on the 0.9986 area. A breakout of this level could carry to the price to reach the third daily resistance located at 1.0007 level. In the opposite case, the reversal move from the current zone could drive to fall to the weekly pivot level situated at 0.99238.


EURCAD

After the Friday 03 breakdown candle, the EURCAD cross consolidates between the daily pivot at 1.50490 and near to the first daily support at 1.50113. A breakdown below 1.50113 as a bearish continuation, could pull the price to touch the second daily support located at 1.4967 level. For the contrary, the breakout and close above 1.50490, could lead to the EURCAD to re-test the previous high at 1.51009 level.


EURNZD

EURNZD cross is running slightly bullish inside of an upper degree sideways structure. The price is testing the zone between the weekly pivot and the daily pivot on the range between 1.7166 and 1.7170. For long positions, the price should break and close above 1.7170, with a potential target in the first weekly support at 1.7210. For short positions, the breakdown and close below 1.7133 should drag the price to the second weekly support at 1.70546 level.


FTSE 100

FTSE 100 in the first trading session of the week, is moving in a limited range between 7,635 and 7,679 pts., which could be characterised by the stational August lower volatility. For long positions the price should break above 7,679 pts., and could push to the British index to the HHL level at 7,740 pts. For the contrarian, the selling side should be valued if the price breaks under 7,635 pts., with a potential target in the first daily support located at 7,601 pts.


DAX 30

In the last four hours, DAX 30 is moving below the weekly pivot level, in a range between the 12,541 and 12,615 pts. After the DAX made the “V-Turn” in the first hours of the Monday session, testing the low of the Tuesday 02 session at 12,706 pts., we foresee that this level will be relevant short-term so we need to stalk it. Long positions should be considered as long as the price breaks and close above 12,615, with a potential target on the first weekly resistance at 12,653 pts. For short positions, the German index should breaks under the low of the day at 12,541, with a potential target on the first weekly support at 12,452 pts.


Categories
Forex Educational Library

Forex.Academy 2018-2019 Outlook – CAD Group


Summary


Forex Daily News: In this post, we analyse the Canadian Dollar group against their main currencies. As a summary, the second half of the year and 2019, we foresee a corrective movement in the Canadian currency, which could come supported for a correction in oil prices to, then, give way to a new rally. After this correction, our central vision for the Canadian Dollar is a new appreciation scenario.

Additionally, we observe that it is likely that GBP and EUR would show the best performance against the CAD; on the opposite side, the Japanese currency and the Swiss Franc could have the worst performance against the Canadian Dollar.


USDCAD

The USDCAD is developing a complex corrective structure of a second bullish impulsive wave. The corrective structure has a bearish bias, which could find support in the area between 1.29607 to 1.28371. The key level to watch out is 1.2884, this level should convert on a critical pivot level (HHL).


EURCAD

EURCAD cross in the short-term has a bearish bias, probably could see new lows in 1.50 zone. In the mid-term, the cross moves sideways as a complex corrective. In the long-term, we foresee that the EURCAD could find fresh lows in the area between 1.47822 to 1.45662, from where the cross could start a new rally as a fifth bullish wave. Invalidation level is at 1.4442.


GBPCAD

Probably the GBPCAD cross shows the clearest movement of the CAD Group. The price is moving in a bearish A-B-C sequence, which could find support at 1.6410 level, from where the price could create a new connector and then initiate a rally. The new bullish sequence has a target the area between 1.8533 and 1.9266. Invalidation level is at 1.5837.


CADJPY

The CADJPY cross has been commented in a previous analysis, and we maintain the main idea which consists in to seek only long positions with a long-term profit target in the area between 94.69 and 95.30. Is probably that the cross makes a retrace to the area between 85.45 to 83.73 from where we could find new opportunities to incorporate us into the trend. Invalidation level is located at 82.17.


CADCHF

In the CADCHF cross, the lemma is “Buy the Dips” or “Watch the Breakout.” CADCHF is running sideways in an upper degree consolidation structure. The key level to control is 0.7636, after the breakout of this level, we expect more upsides to the zone between 0.7992 and 0.8245. In case that the price makes a false breakdown to the area between 0.7394 and 0.7289, it could be an attractive opportunity to look for the long side. Invalidation level is at 0.7124.


NZDCAD

In the long-term, NZDCAD is running sideways and making lower highs. The long-term pivot level is at 0.8640. For this cross, we expect only short positions; if the price makes a bullish move, the potential movement is limited to the area between 0.9253 to 0.9461. The long-term target area is between 0.8401 to 0.8098.


AUDCAD

Probably the AUDCAD cross is the less attractive to trade. As we can see in the weekly chart, it is running sideways since the second half of 2013. The price is moving inside a bearish cycle, which could find support in the “long-term pivot level” at 0.8919, from where AUDCAD could start to bounce. The invalidation level for the bearish cycle is at 1.0397.


Forex Daily News: Finally, as a technical note, considering that the AUDCAD is mostly bearish, by correlation, the CAD should perform better than the AUD for the period foreseen.

Categories
Forex Market Analysis

Forex and Indices – Daily Update 26.07.18


Fundamental Overview


Forex News: The market sentiment of the session was led by the US Dollar (DXY), which advanced against the main currencies group climbing 0.68 per cent. The Dollar boost was aided on the one hand, by the labour market data, in the Thursday session the Initial Jobless Claims data rose 217,000, which despite the increase of 9,000 from the previous week’s revised level, continue showing optimistic levels for the American economy. On the other hand, the ECB interest rate decision continues without changes for the common currency, contributing to the strength in the USD appreciation. The worst performer currency of the session was in the “commodities currencies group”; the Aussie (AUD) fell 1.04 per cent dragged by the dive in Copper price which retraced 1.59 per cent.

Forex News – Daily Performance

Forex News - Daily PerformanceSource: Forex.Academy Collection.


Technical Analysis


EURUSD

EURUSD made a false breakout which could not reach the first daily resistance, turning to the daily pivot and even falling below the weekly pivot point changing the market sentiment from bullish to bearish. For long positions, we need to see the breakout above the bearish breakdown candle at 1.1710, with a first potential profit target placed at the first daily resistance at 1.1756, the second potential target is the confluence level between the second daily resistance and the first weekly resistance at 1.1785. Short positions should be valued as a continuation of the breakdown, with a profit potential target at 1.1615. Pay attention to this area because the confluence with the third daily resistance at 1.16077 could be a potential buy zone.


GBPUSD

The GBPUSD pair in the 30-minutes chart tested the first daily resistance of the intraday trading session at 1.3214, After this, the price made a re-test, from where the pound started to fall and found support in the weekly pivot point at 1.31257. For long positions, the price should break over the daily pivot level at 1.31739 with a potential profit target at 1.3215 (first intraday resistance). Short positions should be valued as the continuation of the previous movement when the price breaks under the weekly pivot level (1.31257) with a potential target in second daily support at 1.31065.


USDCHF

The Swiss currency in the 30-minutes chart continues moving sideways between the first daily support (0.99007) and below the first daily resistance (0.9942). For long positions, the USDCHF should break above the first daily resistance at 0.9942 level with a short-term target at 0.9960 (weekly pivot level); for bearish positions, we need to see that the price to close below the intraday range at 0.9910 with a potential profit target in 0.9877 (first weekly support.)


EURCAD

The EURCAD cross in the 30-minutes chart is moving bearish, testing the second weekly support located at 1.52488. For bullish positions, the price should break and consolidate above 1.5278 with a potential target is at the first weekly support at 1.5325. For bearish positions, as a continuation of the trend, the price could drop to the third weekly support at 1.51778.


GBPCAD

The GBPAUD cross is moving bearish nearly above the first weekly support at 1.71211. For long positions, the price should breakdown candle at 1.7185 with a potential target on the daily pivot level at 1.7232. If we are looking bearish continuation, the price could see the bottom at the 1.70067 level (confluence zone between the third daily support and second weekly support.)


FTSE 100

FTSE 100 in the 30-minutes chart is moving in a narrow range below the daily pivot level (7,669.8 pts) and above the weekly pivot level (7,649 pts.) For bullish positions, the price should break above 7,686 pts, with a potential target on the first weekly resistance at 7,735 pts, which is the convergence zone with the second daily resistance. Bearish positions should be considered if FTSE 100 index breaks below the weekly pivot level at 7,649 with a potential profit target at the first weekly support (7,593 pts.), the second profit target is the HHL at 7,521 pts.


DAX 30

The DAX index 30 in the 30-minutes chart soared to the third daily resistance (12,827 pts), from this zone we have two options. Long positions could extend to the second weekly resistance at 12,912 pts, only if the price breaks above the 12,827 pts. The second option is for short trades; it could be considered if the price breaks below 12,715 pts with a profit target located at 12,604 pts.


Categories
Forex Market Analysis

Forex and Indices – Daily Update – 13.07.18


Fundamental Forex Trading Overview


BoE’s Deputy Governor Cunliffe suggests a delay in a rate hike.

The Bank of England’s (BoE) Deputy Governor, Sir Jonathan Cunliffe, said on Friday that we should be cautious in an interest rate increase and that there are still arguments for a “stodginess” policy. Cunliffe suggests a delay in a rate hike due, despite the economic growth, to the wage rate is not increasing to the 3 per cent that the BoE had initially forecasted.

The BoE’s next Monetary Policy Committee meeting will be on August 2, for this meeting most economists polled expect the rate to increase.


Technical Analysis


 EURUSD

The EURUSD in the 2-hour chart is bouncing from the Potential Buy Zone as expected in our previous Daily Update on Thursday 12th when we commented that EURUSD was making higher highs and higher lows. Now when the pair is testing support in the green box, we expect new upsides to 1.19067 (orange box – maturity area) completing a major degree connector. Invalidation level is 1.15080.


GBPUSD

The GBPUSD in this 2-hour chart is completing a new bearish leg in the Potential Buy Zone. We foresee a breakout of the short-term trendline and the continuation of the previous bullish cycle with a target placed in the 1.3475 area. Also, the exhaustion area is the target area of the inverted head and shoulders pattern which will be active once time the short-term pivot level was surpassed. Invalidation level of the new bullish cycle is 1.30494.


USDCHF

As noticed in our last Forex and Indices daily update, the Swiss currency is being the weakest currency. The USDCHF in the 2-hour chart soars to the highest level since May 2017. Using the correlations in the US Dollar group with DXY, EURUSD and GBPUSD, we could suspect that this is a false breakout.


EURCAD

The EURCAD cross in the 2-hour chart has broken down the short-term pivot level at 1.53684 and made a pullback to the same level turning the support into resistance. We expect more falls with a target placed in the area between 1.5144 to 1.5061. Invalidation level is 1.55225.


GBPCAD

The GBPCAD cross in the 2-hour chart is consolidating testing the 1.73 psychological support level. It is likely that the price moves bullish making a false breakout before to continue the previous bearish impulse. Invalidation level is at 1.76907.


FTSE 100

The FTSE 100 in the 2-hour chart continues to consolidate, developing a complex corrective structure and testing around the 7,700 level. We foresee a limited upside for the British index to 7,792 pts. Invalidation level is 7,508.


DAX 30

The DAX 30 in the 2-hour chart is moving bullish, testing the 12,600 pivot level. We expect more climbs to the area between 12,695 to 12,742. The critical level to watch is the 12,807 pts, from where if the price surpasses it, DAX could rise to 13,020 pts. Invalidation level is 12,104.


Categories
Forex Market Analysis

Analysts Expect Raises on Inflation and Retail Sales Data – Forex and Indices – Daily Update – 21.08.18


Fundamental Overview


Analysts expect raises on inflation and retail sales data.

The Canadian Dollar will be the driver currency of this Friday 22nd trading session, with the release of Inflation and Core Retail Sales data. Analysts expect the Consumer Price Index (CPI) for the month of May to rise to 0.4%, driven mainly by the increase in fuel and food prices; with this increase, the CPI (YoY) estimated should reach 2.5%, being higher than the 2.2% reported in April.

On the other hand, analysts foresee that core retail sales (MoM) would rise to 0.5% during the month of April, which represents an optimistic scenario since the contraction of 0.2% reported in March.

This data could contribute to the scenario of a possible hike in the interest rate by the Bank of Canada (BoC), being in line with what was commented by the BoC Governor Stephen Poloz, who stated that he expects an increase in the interest rate soon.


Technical Analysis


EURUSD

EURUSD bounced from the lowest level in three weeks from 1.1507 to 1.1633. Our vision is that the common currency could make a limited recovery to the 1.17 area before we see fresh lows likely in the 1.1425 zone. Invalidation level of the mid-term bearish cycle is 1.1852.


GBPUSD

GBPUSD bounced from the PRZ forecasted at 1.3109 aided by the Bank of England (BoE) monetary policy decision. Now we should see fresh higher highs and lower highs to validate the change in bias. The short-term resistance level is at 1.3298.


USDCHF

The USDCHF pair broke down the short-term ascending trendline. Now we expect that the price tests the long-term ascending trendline. Our main vision for USDCHF is that it could make a new bearish leg with first support at the 0.98 level, and 0.9788 as the second support.


EURCAD

EURCAD could make a new higher high in the upper line of the ascending channel with a target in the 1.5533 area. After this move, if the price breaks down the short-term ascending trendline, we should see a flag pattern as a continuation of the previous movement.


GBPCAD

GBPCAD is developing in an ascending wedge, which could see fresh highs at the 1.7732 level, as a false breakout before it falls to the long-term ascending trendline. The first support level to watch out for is 1.7455.


FTSE 100

FTSE 100 continued falling for the fifth consecutive week. In the current session, it tested support at 7,548, the low reached on June 18th. Our vision for the British index is that it could complete the corrective sequence in the 7,400 area, from where FTSE could build a new bullish connector.


DAX 30

As was commented in our previous Daily Update, the DAX 30 is moving bearish, developing a Dead Cat Bounce Pattern. In the current trading session, the German index has fallen below the May 31st low at 12,547.6. The next support level is in the 12,300 area, from where we foresee the DAX should start to bounce.


Categories
Forex Market Analysis

U.S. Housing Starts Soars – Forex and Indices – Daily Update 19.06.18


Fundamental Overview


U.S. Housing Starts soars to 2007 highs in May.

Daily Forex Technical Analysis: The U.S. Housing Starts surged 1.35 million in May, the highest level in near to 11-years and over the 1.31 million forecasted. Building permits fell to 1.301 million, under the 1.35 million expected by the analysts.

This buoyant data is attended by the housing market sentiment which fell to 68 points in June from the 70 points reported in June. This decrease in the homebuilder’s sentiment is produced mainly by the rising costs in lumber prices.

On the other hand, the 20-City Home Price Index in the US reported by S&P/Case-Shiller in May soared to the record high 208.62 points, the highest level previous to the 2008 financial crisis.


Daily Forex Technical Analysis


EURUSD

Tha pair EURUSD is moving sideways finding to test the May 29th level support at 1.15102, and it looks like the price is making a bottom pattern. For it to place us on the bullish side in EURUSD, we expect the short-term resistance breakout at 1.16445.


GBPUSD

The Pound broke down the low of the May 29 (1.32045 level)  losing the 1.32 psychological level. Now we expect that the price will complete the bearish cycle in the area between 1.3109 and 1.2936, from where the price should start to bounce at least to the 1.3298 level.


USDCHF

USDCHF is running bullish to the parity making a flag pattern. Our vision for the Swiss currency is that it could make a new bearish leg with a mid-term target on 0.98 level.


EURCAD

EURCAD is developing an expanding triangle inside an ascending channel; we expect that the cross makes a new high to the 1.555 area before we see more drops to the 1.49 zone.


EURAUD

EURAUD reached the mid-term target zone in the 1.57 area. We foresee that if the cross breaks down the short-term trendline, EURAUD will complete a flag pattern, which should drive to new lower lows, likely to 1.53 area.


DAX 30

DAX 30 is moving laterally in a major degree structure testing the long-term pivot level at 12,652.2. A breakdown of this level could drive the price to test the short-term support at 12,547.6, it could even fall to 12,300 area, from where we expect the start of a new rally.


FTSE 100

FTSE 100 broke down the May-29th low making a new lower low; this makes us foresee that the British index should see a new lower low, probably to the 7,400 area, from where FTSE should build a new bullish connector.


Categories
Forex Market Analysis

Forex and Indices – Daily Update – 12.06.18


Fundamental Overview


The exposure of the historic meeting and agreement reached between the U.S. President Donald Trump and the North Korean leader Kim Jong Un for the “denuclearisation” of the Korean peninsula have already been discounted. However, currently, the uncertainty is being headed by the statements of IMF’s Director Christine Lagarde, who has said that the escalation in trade tensions are affecting the global economy, commenting that clouds over global economy are ‘getting darker by the day’ after the G7 summit.

World Trade Organization General Director, Roberto Azevedo, also echoed the comments made by Lagarde adding that the increase in commercial tensions that we are witnessing involves a high economic impact, which can undermine the strength of economic growth since the last financial crisis.”


Forex Technical Analysis Signals


EURUSD

EURUSD is consolidating, developing a pennant pattern bounded by the levels 1.173 and 1.184. A breakout of this pattern could lead the price to the 1.196 level. Invalidation level keeps in 1.1616.


GBPUSD

GBPUSD moves in a corrective structure as a flag pattern testing the blue box area as a support level. The breakout of the 1.342 level should lead to the pound to 1.359 resistance. The invalidation level of this scenario is 1.3254.


USDCHF

The structure of the Swiss currency looks like an Irregular Flat Elliott Wave. If this scenario is valid, and for inverse correlation with EURUSD, the USDCHF pair could reach 0.99 level before it drops again. Invalidation level is 0.9983.


EURCAD

EURCAD moves inside a pennant pattern; we expect a breakout of this structure to lead the price to new higher highs at least to 1.5533 level where we foresee the start of a new downward move for to build a new bearish leg.


EURAUD

In the same way as EURCAD and EURUSD, the EURAUD cross is consolidating, but in this case, the price is moving inside a pennant pattern. In the short-term, if EURAUD breaks above 1.5621, we expect fresh highs that should reach the 1.5761 level. Invalidation level for this scenario is 1.5282.


DAX 30

DAX 30 continues driving sideways, in the current session it has touched the blue box reaching the 12,948 pts level, rejecting to the downside. We maintain our scenario on which a price decline below 12,652 pts should activate a bearish second leg, with a target of 12,000 pts. Invalidation level is 13,102 pts.


FTSE 100

A lateral channel of 112 pts bounds the FTSE 100; our vision is that the British index should make a false bullish breakout before continuing its previous downward movement to complete the corrective structure. The potential target is 7,390 with an extension at the 7,073 level. The invalidation level of the bearish scenario is 7,903.5.


Categories
Forex Market Analysis

Indices Broke Down Their Bullish Trendlines

Hot Topics:

  • Indices Broke Down Their Bullish Trendlines.
  • Euro Group Close to Find a Short-Term Bottom.
  • US Dollar Climbs Before Minutes Release.


Indices Broke Down Their Bullish Trendlines

Trend Line Analysis: Indices in the early trading hours of the session opened lower breaking down its bullish trendlines. However, FTSE and DAX did not crumble below their invalidation levels. Likely, both indices could make a 1-2-3 pattern. Invalidation level in FTSE is at 7,753.3 points.


On the other hand, DAX has paid its bearish divergence in 12,958 points, as said in a previous Daily Update. Invalidation level of the bullish structure is at 12,918. We expect the German index to have a consolidation structure and reveal the new potential move.


Euro Group Close to Find a Short-Term Bottom

The Euro group, in general, is moving bearish. Currently it is consolidating and showing signals of a potential reversal; however, we expect a brief price recovery, to then see more downward moves long-term.

EURUSD continues its downtrend and has two new potential bearish targets in the short-term: 1.16734 and 1.15637. From this zone, the pair could create a new bullish connector. Invalidation level is moved at 1.18298.


EURAUD continues above the Control Level and is moving sideways. For the oceanic cross, we have two scenarios:

  • First scenario: the price breaks below the control level and finds new lower targets in 1.53074 or 1.52952.
  • Second scenario: the price breaks above the invalidation level at 1.56192 and sees new highs, the first resistance is 1.57233 level.


EURCAD is bouncing from the first bearish cycle target level at 1.50373. The invalidation level for this bearish cycle is 1.51385. If the price breaks above this level, the price could see the 1.5533 level again.


US Dollar Climbs Before Minutes Release

Trend Line Analysis: The US Dollar Index raises at the halfway point of the trading session while it waits for the Minutes of the FOMC. GBPUSD still moves at the potential reversal zone, where the price should make a new connector. Invalidation level of the bearish sequence is 1.34918.


In the same way, the USDCHF moves higher making a pullback to the breakdown zone. Probably, the pair will move higher as an ascending A-B-C pattern before to collapsing again, building a new leg long-term. Invalidation level of the bearish cycle is at 1.00561.


Categories
Forex Market Analysis

Negotiations Between US-China Support Indices Advances

FINANCIAL MARKET UPDATE TODAY

Hot Topics:

  • Indices continue soaring boosted by US-China negotiation progress.
  • UK Government seeks to pay its national debt.
  • The price action between EURUSD and USDCHF show divergences.
  • EURCAD and EURAUD are moving on critical zones.

Indices continue soaring boosted by U.S.-China negotiation progress

The advance in negotiations between the U.S. and China maintain the optimism in markets for the second consecutive session. The FTSE 100 consolidated in the record highs. Despite the fact that RSI shows a little bearish divergence, this does not mean a reversal sign of the trend. We keep our bullish vision for the FTSE in 8,000 pts as the next target.


DAX 30 adds to the market optimism by the progress between the U.S. and China negotiations. The index climbs near to the first target level proposed in previous updates (Daily Update – May 15th). The RSI oscillator does not show movement exhaustion signals.
– First target level 13,250.5.
– Second target level: 13,497.7.
– Invalidation level: 12,918.3


UK Government seeks to pay its national debt

The UK Government will appeal to the High Court for access to a National Fund untouched since 1928 to pay its National Debt. The “National Fund” was opened in 1928 by an anonymous donation of £500,000 with the condition that it must keep untouched until the U.K. have enough money to pay its national debt entirely. Currently, the fund ascends to £475 million, but the U.K. debt rises to £1.7 trillion.

The pound is moving sideways, in this session has tested the 1.348 resistance. RSI shows bullish divergences signals; we expect that the RSI moves above the 60 level for it to start to change the current bearish bias to bullish. Consider that the price action must confirm the new bias. For the moment we maintain neutral our position in GBPUSD.


The price action between EURUSD and USDCHF show divergences

USDCHF is moving bearish and has paid its bearish divergence falling to the 0.99203 level. It is likely that the price continues moving bearish to 0.9875 and start to bounce for it to make a new connector for a major degree bearish cycle. Invalidation level remains on 1.00561.


On the other hand, EURUSD keeps moving sideways. In the current session, the common currency has tested the resistance level at 1.18257 without success. However, RSI is showing reversal signals but it is necessary that the oscillator breaks above the 59.06 level and the price soar above the key resistance level 1.18257. Invalidation level is below 1.1717.


EURCAD and EURAUD are moving on critical zones

EURCAD has touched the first long-term bearish target level at 1.50373. The RSI oscillator shows bullish divergences as a bearish trend exhaustion signal. Now is the time to expect what the price action does, if the cross moves to the second long-term bearish target at 1.4866 or makes a reversal pattern. In this zone, our position turns from bearish to neutral.


Similarly to EURCAD, EURAUD moves below our second bearish long-term target placed in 1.5552 level. RSI shows bullish divergence as weakness in the bearish cycle. Now we are watching the control level in 1.54673, and waiting to see what will the price action will do. We have two scenarios:

– First scenario: The price breaks below the control level. In this case, it is likely that the cross continues its bearish momentum. For this scenario, the new bearish targets are placed at 1.5307 and 1.5195 levels. Invalidation level is 1.57279.

– Second scenario: The price makes a bullish reversal pattern, in this case, we have 1.5727 as the target.


Categories
Forex Market Analysis

Forex and Indices – Daily Update May 17th, 2018


Hot Topics: 


  • Main currencies consolidate levels against the Dollar.
  • Is a new strength cycle to the Euro upcoming?
  • Indexes continue rising

Main currencies consolidate levels against the dollar.

EURUSD

EURUSD continues to move laterally in a potential reversal zone. We still expect the price to visit the level 1.1737 as a cheat pattern (see 2B Pattern), before making a new bullish cycle.

Daily Forex Market Update


GBPUSD

GBPUSD continues to consolidate around the 1.35 level; we foresee that the price could create a false break down to 1.3423, from where it should make a connector and start a bullish process, probably as an ABC.


USD/CHF

USDCHF continues to move laterally in the parity zone without showing signs of change. By its correlation with EURUSD, we cancel the scenario proposed of the potential double top, and we project a last bullish movement, which could reach 1.0101.


Is the new cycle of strength for the Euro upcoming?

EURCAD

After breaking down its bullish trend line, we expect that the EURCAD can make a new lower low in the area between 1.5037 to 1.4866. In case it falls below 1.4818, which corresponds to our level of invalidation of the main upward cycle, we could see deeper declines to the 1.4519 level.

Daily Forex Market Update


EURAUD

EURAUD continues consolidating at its potential reverse zone, as in the case of EURCAD. We anticipate that the cross could make a new lower low at 1.5610 before returning to create a new bullish move. If EURAUD goes below 1.5467, the price could see more drops in the area between 1.5037 and 1.5159.


Indexes continue upwards.

FTSE

FTSE 100 continues its bullish rally for the eighth consecutive week and is approaching record highs reaching 7,788.2 points. It is likely that we will see the British index reach the psychological barrier of 8,000 points and may even reach 8,155 points.


DAX

As we mentioned yesterday, DAX broke up the consolidation structure and goes towards the 13,250 points, pending bullish objective level to reach. While the index does not complete its bullish cycle, all indices will continue with the bullish momentum.


Categories
Forex Market Analysis

EUR Moving Sideways, UK PMI Services Rebound, and DAX Bearish

Hot Topics:

  • UK PMI Services rebound from the lowest level for 21 months.
  • DAX is moving bearish as commented previously.
  • The Euro stagnates while waiting for employment data release of the United States.
  • EURCAD: Follow-up of the bearish cycle continuation.

UK PMI Services rebound from the lowest level for 21 months.

Business activity in the United Kingdom increased modestly in April reaching 52.8, bouncing from 51.7, the lowest level recorded 21 months ago. Chris Williamson, Chief Business Economist at IHS Markit, noted that “The economic growth rate remained decelerated moderately at the start of the second quarter.” Finally, he added that “the performance of the economy has continued to deteriorate”.

The FTSE 100 index has reacted downwards from our potential reversal zone, breaking down the rising wedge pattern, where we are already positioned short (Suggested in advance to our premium members).

The pound continues with the bearish bias consolidating below 1.36. We still expect sterling to make a new low in the area from 1.35 to 1.3481. The level of invalidation of the bearish bias is above 1.365.

DAX is moving bearish as commented previously.

The DAX 30 follows the bearish bias in a similar way the FTSE 100 did. This corrective move was also commented to our subscribers in our previous updates. We expect the German index to move down to the 12.622 pivot level, which by traditional technical analysis, should switch from resistance to support.

The Euro stagnates while waiting for employment data release of the United States.

The single currency is moving in a range between 1.195 and 1.20 pending the employment data that will be published tomorrow by the U.S. Bureau of Labour Statistics. The EURUSD pair could make a new lower low, likely near to 1.190, from where it could bounce up to 1.207.

The USDCHF is forming a double top pattern, which would be activated if it breaks below 0.995. By inverse correlation with the EURUSD pair, and considering that it still has space to make a new lower low, the Swiss currency could make a higher move as a buyer trap or 2B Pattern.

EURCAD: Follow-up of the bearish cycle continuation.

On April 20th we commented to our subscribers that the cross EURCAD had a new lower low to develop, whose target could be in the area from 1.54 to 1.5310. Today, we see that the cross has reached our forecasted area. Now we should start to take profits and wait for the price action to show a new trading opportunity.

EURCAD updated:

©Forex.Academy

Categories
Forex Market Analysis

Indices: Bull traders still could have space to go up?

Hot Topics:

  • Monitoring the indices alignment before a correction.
  • Euro group: weakness will continue against its main pairs.

Monitoring the indices alignment before a correction.

As we have said in previous daily updates, the markets are correlated, and big moves occur when they are all aligned. The FTSE 100 continues making a bullish extended cycle and is near to reaching critical levels for a reversal (7,500 to 7,600 area.)

In this session, for the fourth time, the DAX 30 couldn’t soar above the critical resistance level 12,622. It is likely that the German Index climbs up above the resistance before we expect it to fall.

Finally, as we can see, the NIKKEI 225 could still reach the area between the 22,620 to 22,800, before starting a corrective move. In conclusion, Indices still have space to see a new high, but we expect limited bullish moves.

Euro group: weakness will continue against its main pairs.

The Euro currency is developing a bearish move after the rally that started in 2017. The EURUSD pair continues the bearish cycle reaching the first blue box, testing the 1.2071 level. Before the Employment data release in the US, we expect a downward continuation to the zone between 1.1869 to 1.1815. From this area, it could start to bounce but it is too soon to foresee that move.

Looking at the Euro crosses, EURAUD is moving as we anticipated in our last Short-Term Pick (24th April), We expect the price to drop down to the region between 1.5748 and 1.5650. Invalidation level is at 1.6192.

EURCAD could not reach the 1.5811 zone; this situation makes us think that the bearish force could accelerate to our target level which is 1.54.

On the other hand in the money market, the USDCHF pair is still on an upward trend which is near to completing the bull cycle. In the zone between 0.9943 to 0.9993, the pair could make a new connector, then, start developing a bearish cycle.

The Pound has dropped to the 1.375 level, from where we expect the cable to start a bounce and make a consolidation move. The retracement could reach the area between 1.39 to 1.40. Invalidation level is at 1.4246.(c) Forex.Academy

Categories
Forex Market Analysis

The Positive Data Reported in Canada could support a rate hike soon

Hot Topics:

  • The positive data reported in Canada could support a rate hike soon.
  •  The Greenback rally continues.
  • FTSE maintain the bull trend, DAX waits for ECB meeting?

Positive data reported in Canada could support a rate hike soon.

The consumer inflation (YoY) in March increased to the highest level in three years reaching 2.3%, climbing from the 2.2% reported in February. The Core Inflation (YoY) descended to 1.4% in March from the 1.5% in February. The higher oil prices have influenced inflation to rise. On the other hand, retail sales in February have increased to 0.4% from 0.1% reported in January. The Bank of Canada maintains a 2 percent inflation target; this scenario could signal an interest rate hike soon. In the last Monetary Policy meeting, the Bank of Canada decided to maintain the rate at 1.25%.

In the technical context, a correction for the Canadian Dollar group could show soon. In the EURCAD cross, we expect a bullish movement with a target placed in the 1.58 level before making new lows.

In the same way, GBPCAD is developing a bullish retracement process that could reach 1.805 – 1.81, the area from where it could make the bearish continuation of the main trend.

The Greenback rally continues.

For the fourth consecutive session, the US Dollar saw advances compared to its main competitors. The Euro has broken down its short-term consolidation structure but has been stopped by the lower trend-line of its long-term triangle pattern.

The Pound tested the 1.40 psychological level again, from where it is bouncing. We expect a retracement to a Fibonacci level before we decide to sell this pair.

The Swissy could visit the area between 0.9765 and 0.9836 before it makes a bearish cycle.

FTSE maintains the bull trend, DAX waits for ECB meeting?

The main European indices have closed with a mixed sentiment. The FTSE 100 closes the last trading session of the week climbing above the pivot level 7,326. We expect more upsides until the 7,450 – 7,520 area before it makes a bearish leg.

On the opposite side, DAX 30 could not climb up above the pivot level of 12,622. The German index could make a new bearish leg, likely to be around the 12,100 – 12,200 area before the ECB Monetary Policy Meeting and continue the bullish cycle.

© Forex.Academy

Categories
Forex Market Analysis

Daily market overview: busy day

Events and Volatility

A rise in volatility is expected to take place today as many announcements are going to be published

Wednesday’s main focus will be the Bank of Canada’s monetary policy announcement. We don’t expect any policy change, but the price action on  Canadian dollar tells us that investors are anticipating positive comments from the BoC. A lot has changed since their last March’s meeting. Six weeks ago, they raised concerns about lower wage and household credit growth, but since then, oil prices hit a 3-year high, retail sales rebounded, the unemployment rate declined, job growth accelerated, housing market activity improved, inflation increased, and manufacturing activity expanded at a robust rate. Both U.S. President Trump and Canadian Prime Minister Trudeau have said they are close to reaching a NAFTA deal, and, according to Mexico’s Economy Minister, the negotiation team could meet again on Thursday in Washington to start working on their issues again, and hopefully move the process forward

On the other hand, economic sanctions appear to be a very effective tool for challenging rivals in the market. A couple of weeks ago, the U.S. pushed Rusal to the brink of survival by limiting its services, banning the maintenance of its dollar accounts, and prohibiting Americans from conducting any business with the company. Although these steps may be seen as an attempt to influence the Russian position in Syria, they also make sense from an economic viewpoint.

For the first time, the Minutes revealed that the RBA board explicitly recognizes  “it was more likely that the next move in the cash rate would be up, rather than down” (news.com). This may not seem significant since the RBA governor has been stating this for some time. Still, this is the first time the board has expressed its support for this kind of view and now confirms the RBA’s bent towards a tightening bias, in line with what we observe across the majority of G10 central banks.

GBP remains in play on Wednesday with U.K. CPI scheduled for release. Price pressures are expected to ease. Investors think that the Bank of England will raise interest rates next month but they need to see data validate that view before extending the pair’s gains.


GBP/USD

On the daily chart, the price had done a big effort to reach a pivotal level at 1.4335

there’s a special price action with a hammer, by forming a descending wedge

If a retracement is confirmed, then it might be a correction on its way to 1.409

 EUR/CAD

On the daily chart, the price has broken the down trendline from the low of 2018

The price is located at a very sensitive area, as it reached the lower trendline connecting the highs and the resistance zone between 1.566-1.553

Any breakthrough would expose it to 1.61 level, any continuation of the bears would retest 1.52 level


EUR/AUD

The price was moving in up channel on 4H until it has broken it last Friday

The pair needs a motivating momentum to go down further, so it retested the broken channel with rebounding from the lower trendline connecting the highs as it shown.

It is  also respecting the 200 moving average, and provided us with an AB=CD harmonic pattern.

The price is expected to visit 1.5825 again then to 1.574.


© Forex.Academy