Introduction
The Month-over-Month Retail Sales figures are one of the closely watched statistics in the financial markets and have a lot of volatility in the markets around these figures. An increase in sales is one of the earliest signs of growth for businesses that can imply a multitude of things for the economy. It is a closely watched high impact leading indicator. Hence, an understanding and analysis of Retail Sales are paramount for our fundamental analysis.
What is Retail Sales Month-over-Month?
Retail Sales
In the purest sense, it is just the dollar amount of purchase of goods and services made by end-consumers for a given period. Here, the period is MoM, which stands for Month-over-Month. It is the sale of durable and non-durable goods at the retail outlets to consumers.
It can also be defined as the purchase of finished goods and services by consumers and businesses. The goods and services have reached the end of the supply chain. The chain generally starts with the manufacturer or provider and ens up at the retailer where the general population or other businesses consume it.
The Retail Sales figures are often presented in two ways: including and excluding auto and gas sales. As the Auto (vehicle purchase) figures and Oil prices fluctuate frequently, the exclusion helps to identify the trends better once the volatile components are removed. The excluded version is called the Core Retail Sales report.
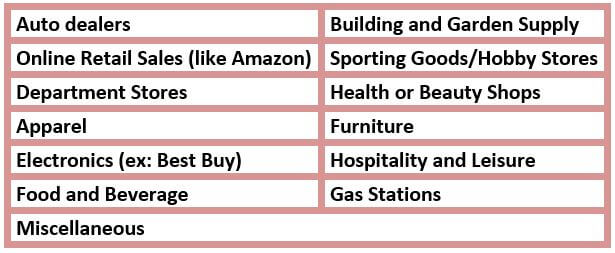
Retail Sales statistic covers the in-store (retail) sales, catalog sales, and out-of-store sales of durable (goods that last more than three years) and non-durable goods (that have short-life span). The major categories include:
Retail Stores have the following categories:
How can the Retail Sales MoM numbers be used for analysis?
The Retail Sales figures provide us a reliable measure of CURRENT economic activity. It is essential to an objective assessment of the need for and impact of a broad range of policy decisions. Hence, the policymakers use this statistic to keep a pulse-check on the economy’s health.
The Retail Sales figures are significant statistics for many as the Consumer Spending makes up 66% of the United States Gross Domestic Product. The remainder is from Government Spending, Business Spending, and Net Exports. It is also essential as it represents the end of the supply chain figures. All the statistics that precede the Retail Sales figures like Inventory Changes or Manufacturing Production figures all lead up to the Retail Sales, which confirms and triggers the next wave in the trend change in the other indicators, in a feedback loop.
In other terms, once Retail Sales figures improve, businesses see an increase in their revenue and correspondingly demand their products, which leads to an increase in their Manufacturing Production figures, and that would later translate to Change in Inventory statistics. So, we see how the Retail-Sales figure operates amongst the economic indicators in a feedback loop cyclical pattern.
Once Retail Sales figures improve, businesses see profits that encourage expansionary plans, that would increase investment in their business, employment, or even wage growth. It is necessary to understand, Sales improve business, once business improves, wage growth or employment increase is a possibility. Hence, the Retail Sales figure is an essential leading macroeconomic indicator for our fundamental analysis.
The US Bureau of Economic Analysis releases quarterly GDP statistics. If the Month-over-Month Retail Sales figures have been influential, then there is a good chance that the GDP print will be higher. The only downside to the Retail Sales figures that we need to be careful of is that it does not account for inflation, and the increase in the Retail Sales figures could also be a by-product of inflation.
To be noted: The Retail Sales figures are seasonal. It generally tends to increase around the holiday season. Hence, care must be taken during analysis that the decline in stats is due to a business slowdown or seasonal effects. In this case, the Retail Sales figures Year-over-Year is also another parameter that we can use to compare the current conditions with the preceding year to understand the growth trend better, as the GDP is also compared with the last year.
Although data is available in the seasonally adjusted format, to account for the seasonal patterns but it does not adjust for inflation. Hence, it is essential for users of the data to check for the seasonally adjusted figures.
Impact on Currency
Retail Sales is a leading macroeconomic high impact indicator. An increase in Retail Sales is the first sign of growth for businesses in monetary terms. Due to a multitude of economic factors that are affected by the Retail Sales figures, the volatility around the release of these figures is generally high.
It is a proportional indicator, meaning that a consistent or significant increase in the Retail Sales figures translates to increased profits for the businesses, indicates reasonable Consumer Confidence and Consumer Spending, and in turn it will also translate to increased employment, and wage growth. It is a cyclical effect that further promotes spending, and business booms and the economy prospers. It translates to higher GDP prints, which is appreciating for the currency.
Low Retail Sales figures are indicative of a slowdown of business, bearish Consumer Sentiment, where consumers are saving more and spending less. It stagnates the businesses, in the worst case, could lead to lay-offs, and ultimately recession. It will translate to lower GDP prints, which is depreciating for the currency.
Economic Reports
In the United States, the Census Bureau publishes monthly reports of the Retail Sales figures on its official website under the section “Monthly Retail Trade.” The report is released at 8:30 AM about two weeks after the reference month (13-15th day of the month). The schedule for the year is already posted on the website for the user’s convenience. The report details the total sales, percentage changes, and also YoY (Year-over-Year) changes.
Sources of Retail Sales MoM
- The Month-over-Month Retail Sales statistics can be found here
- Both advance estimates and Retail Sales figures are available in aggregated format in St. Louis FRED website here
- We can find Retail Sales monthly figures for various countries here
Impact of the ‘Retail Sales – MoM’ news release on the Forex market
In the previous section of the article, we understood the Retail Sales economic indicator and its consequences on the economy. We will take this discussion forward in identifying the impact of Retail Sales on the value of the currency. Retail Sales is an important economic indicator because consumer spending drives much of our country.
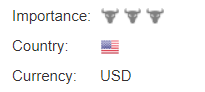
When consumers spend more, the economy tends to hum along, whereas if consumers are uncertain about their financial future, they hold off their purchases that lead to the slow down of the economy. The release of Retail Sales numbers is said to have a large impact on the currency, as shown in the below image.
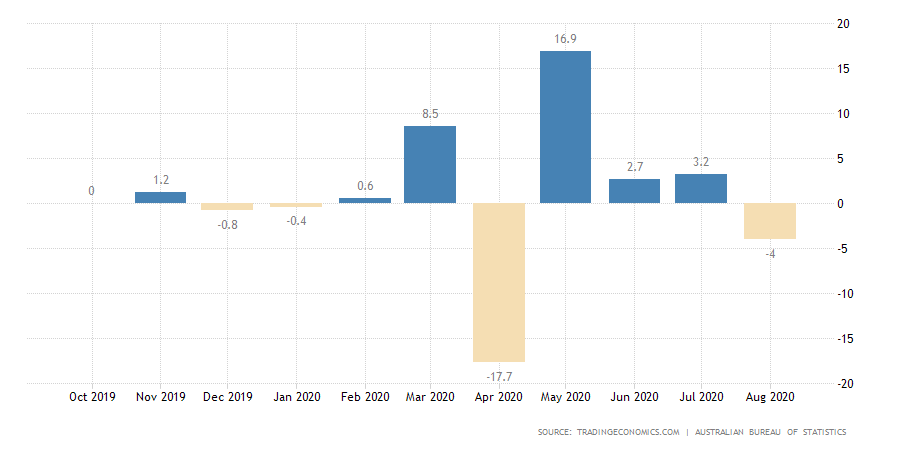
In this section, let’s analyze the Retail Sales data of the Unites States that was gathered in the month of March. The below image shows that there was a big drop in the Retail Sales compared to the previous month indicating a major disruption in the economy. Let’s see how the market reacts to this data.

USD/JPY | Before the announcement
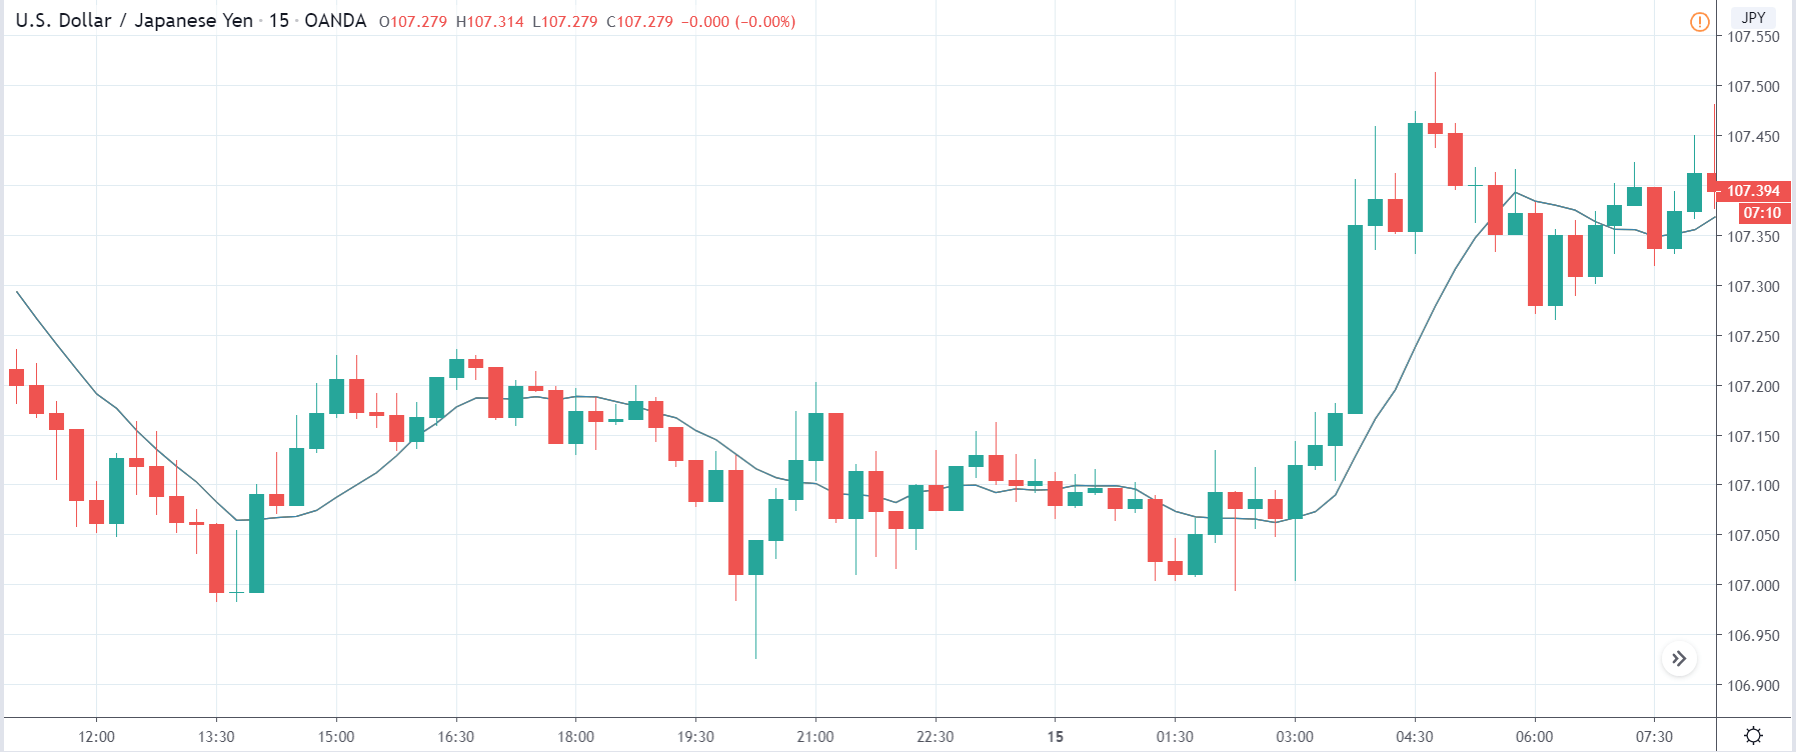
We will start with the USD/JPY currency pair to witness the impact of the news announcement. The above image shows the state of the chart before the news announcement, where we see that the overall trend of the market is up, and currently, the price is on the verge of continuation of the trend. Depending on the impact of the news, we will position ourselves in the currency pair.
USD/JPY | After the announcement
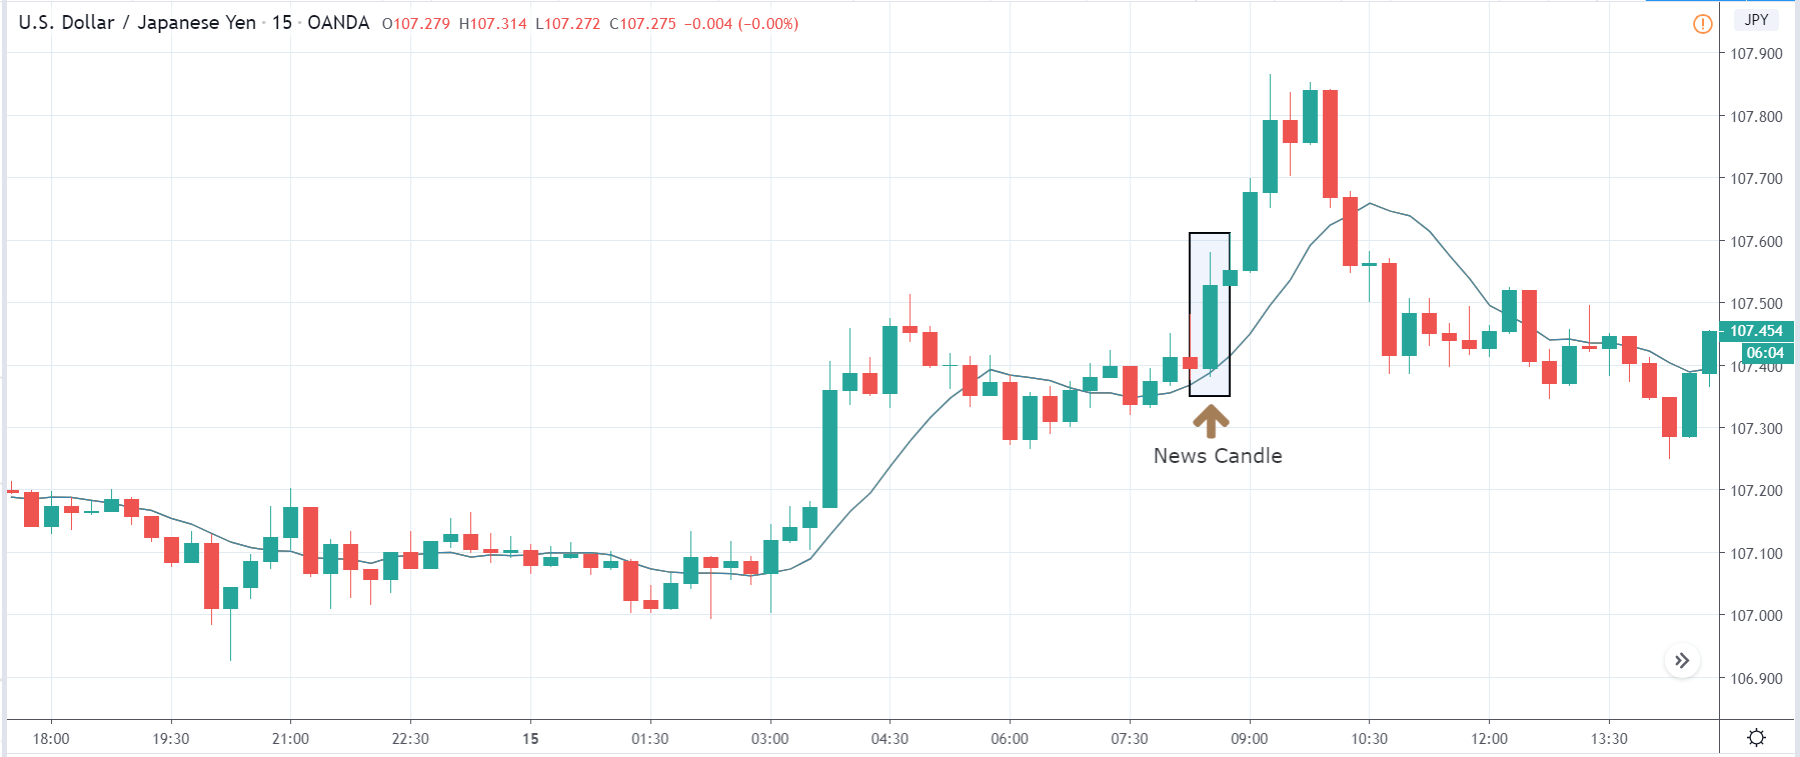
After the news announcement, there is a surge in the price, and volatility jumps to the upside. Even though the Retail Sales were very poor in the month, the market reaction was opposite to what was expected. After the news release, traders bought US dollars and strengthened the currency much more. The bullish ‘news candle’ shows the impact of the news on the currency. Since the market reacted very positively to the data, we should take a ‘buy’ trade only after a price retracement.
EUR/USD | Before the announcement
EUR/USD | After the announcement
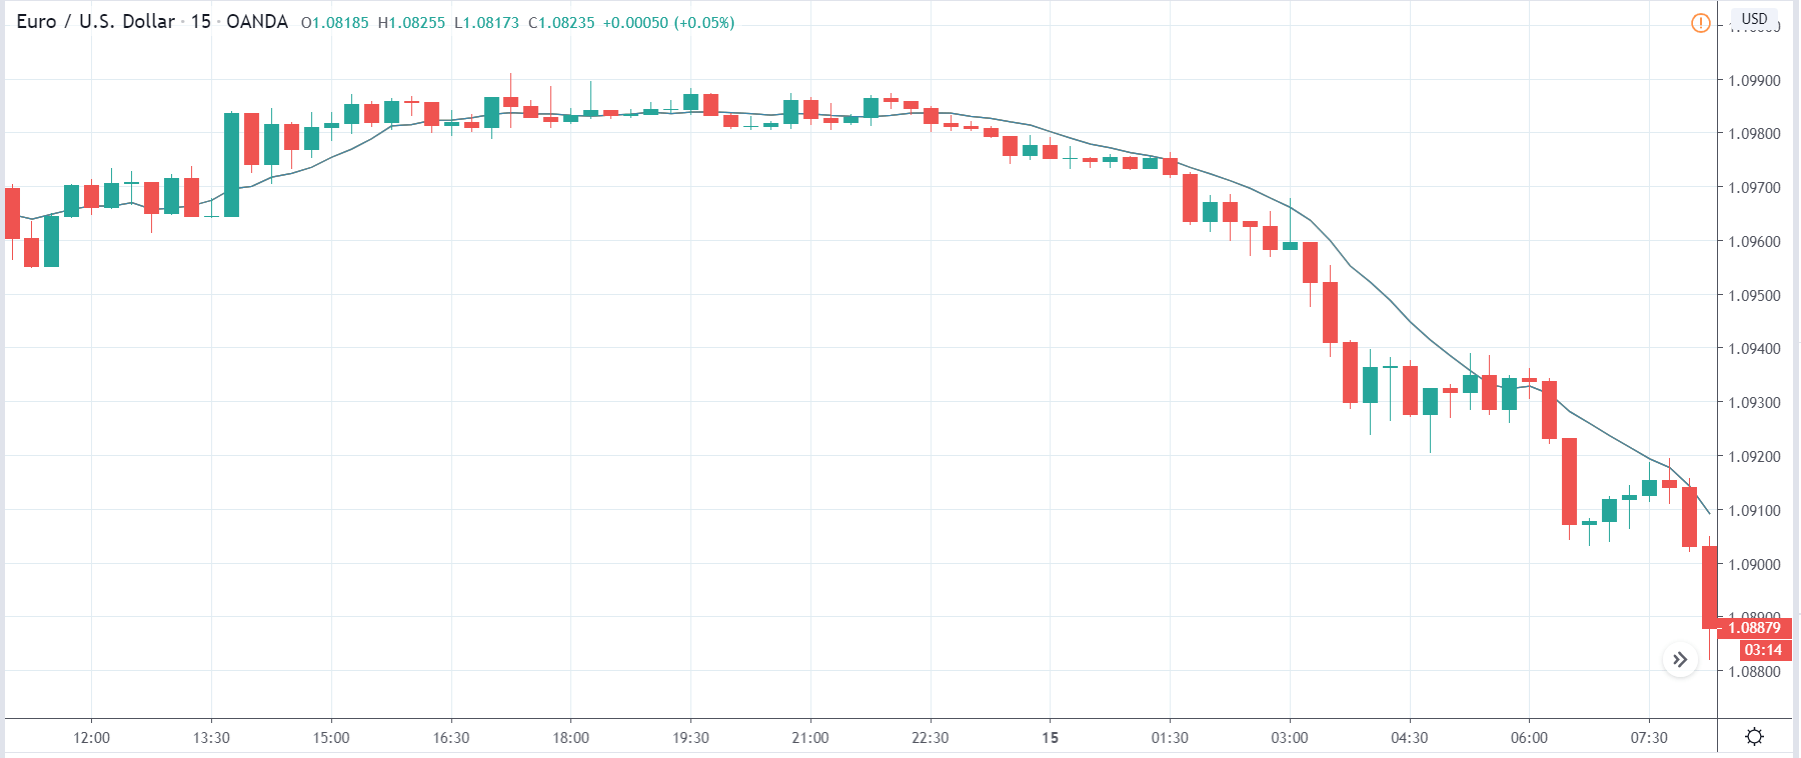
The above images represent the EUR/USD currency pair, where we see that the market is in a significant downtrend indicating the great amount of strength in the US dollar. The price is currently is at its lowest point, which means we need a pullback in the market to join the trend. If the news announcement results in a retracement of the price, this could be taken as an opportunity for taking a ‘short’ trade.
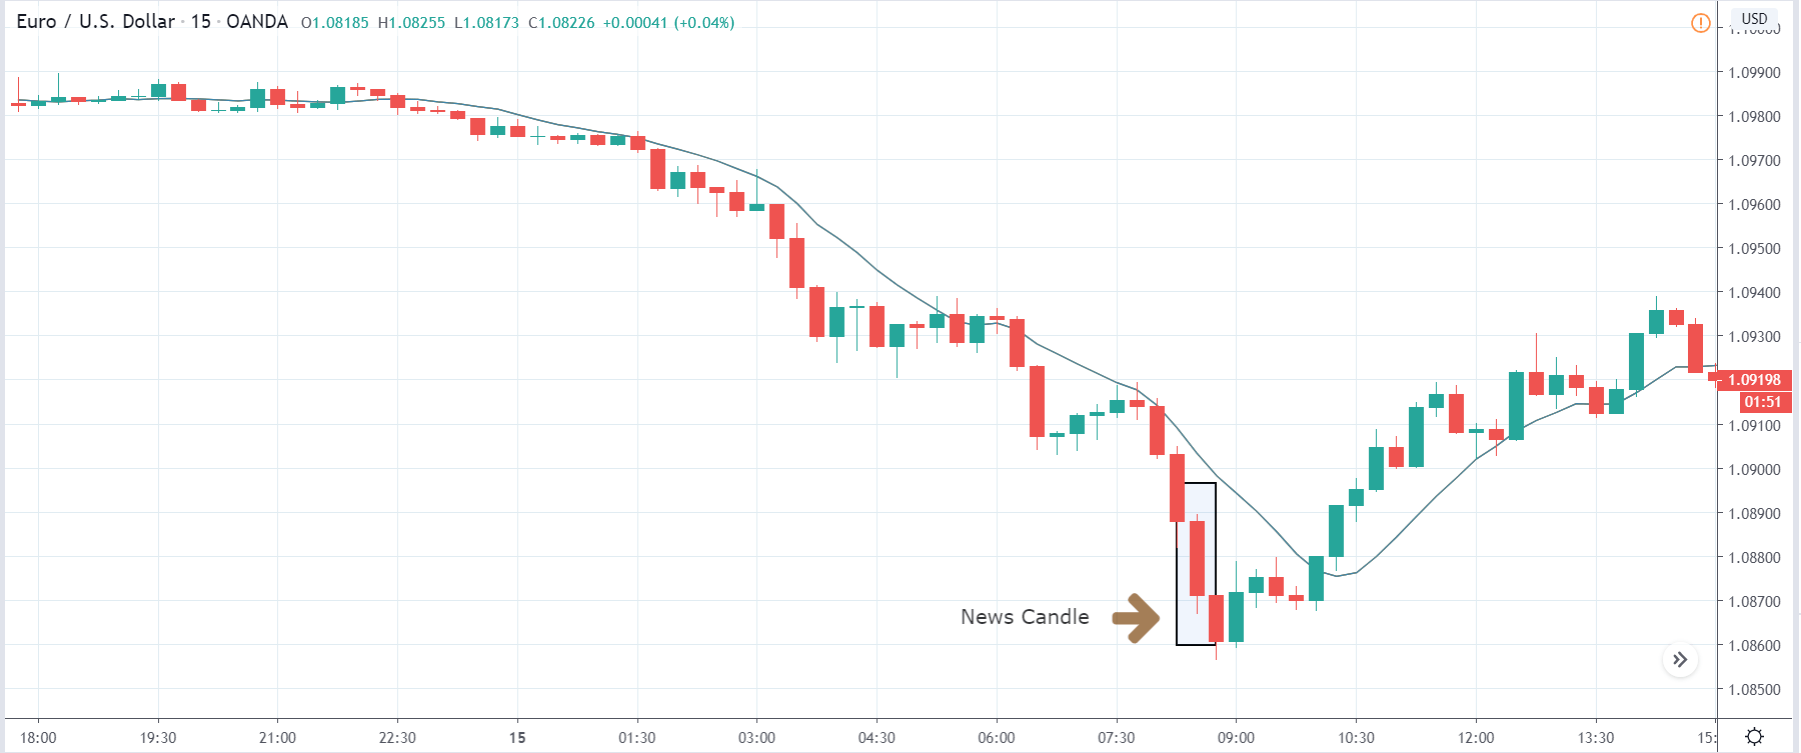
After the news announcement, the market moves lower, and volatility increases to the downside. Although the Retail Sales data was weak, it did not result in weakening of the currency, but rather the US dollar strengthened. This means the news data was not bad enough to turn the markets to the upside. We will still be looking to enter the market only after a price retracement to a key technical level.
USD/CAD | Before the announcement
USD/CAD | After the announcement
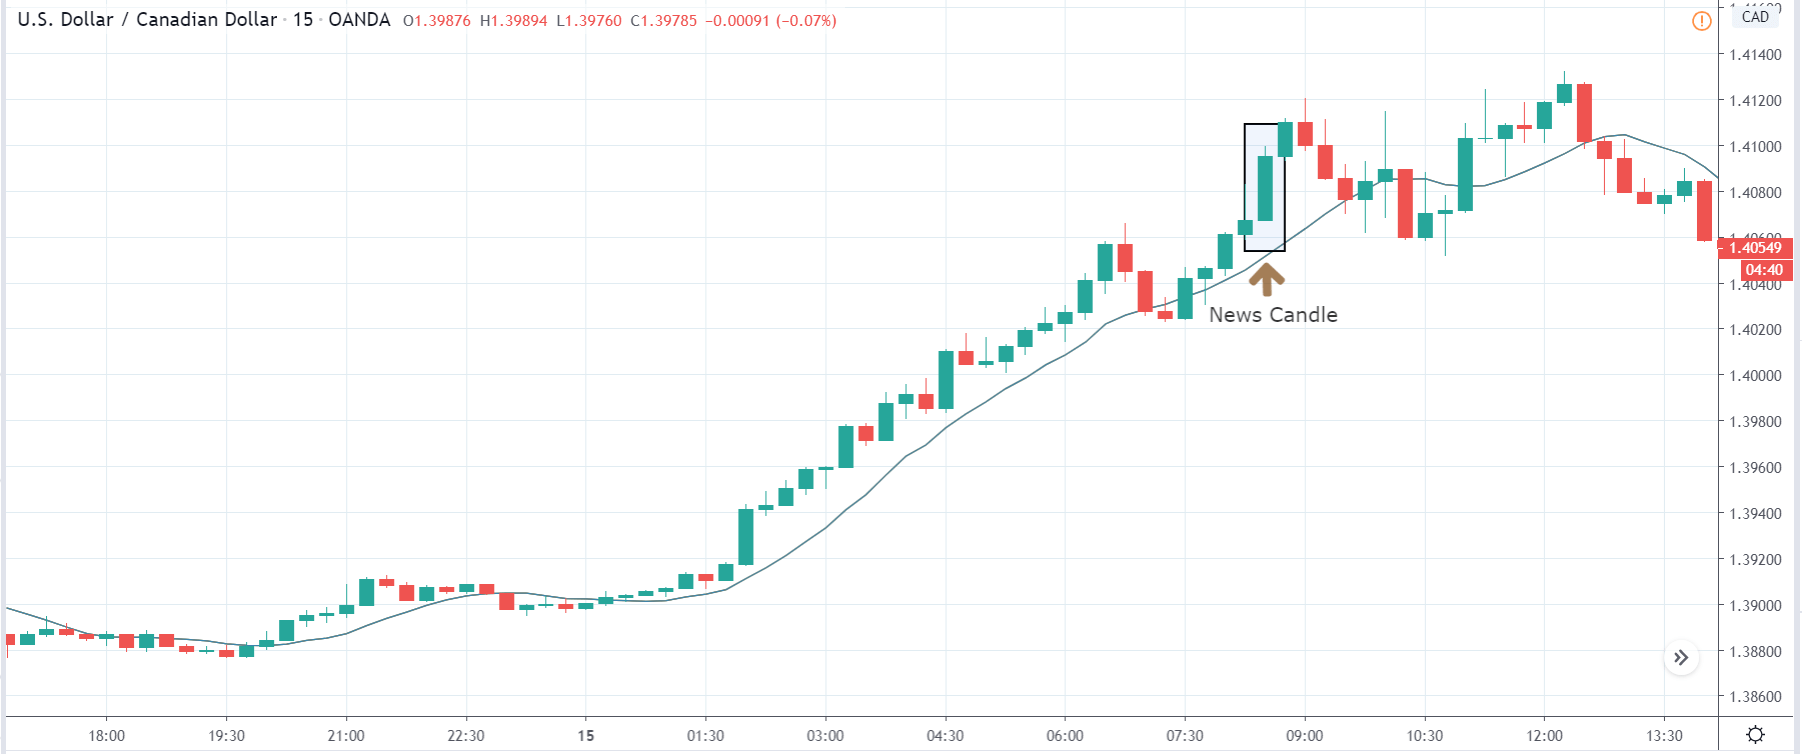
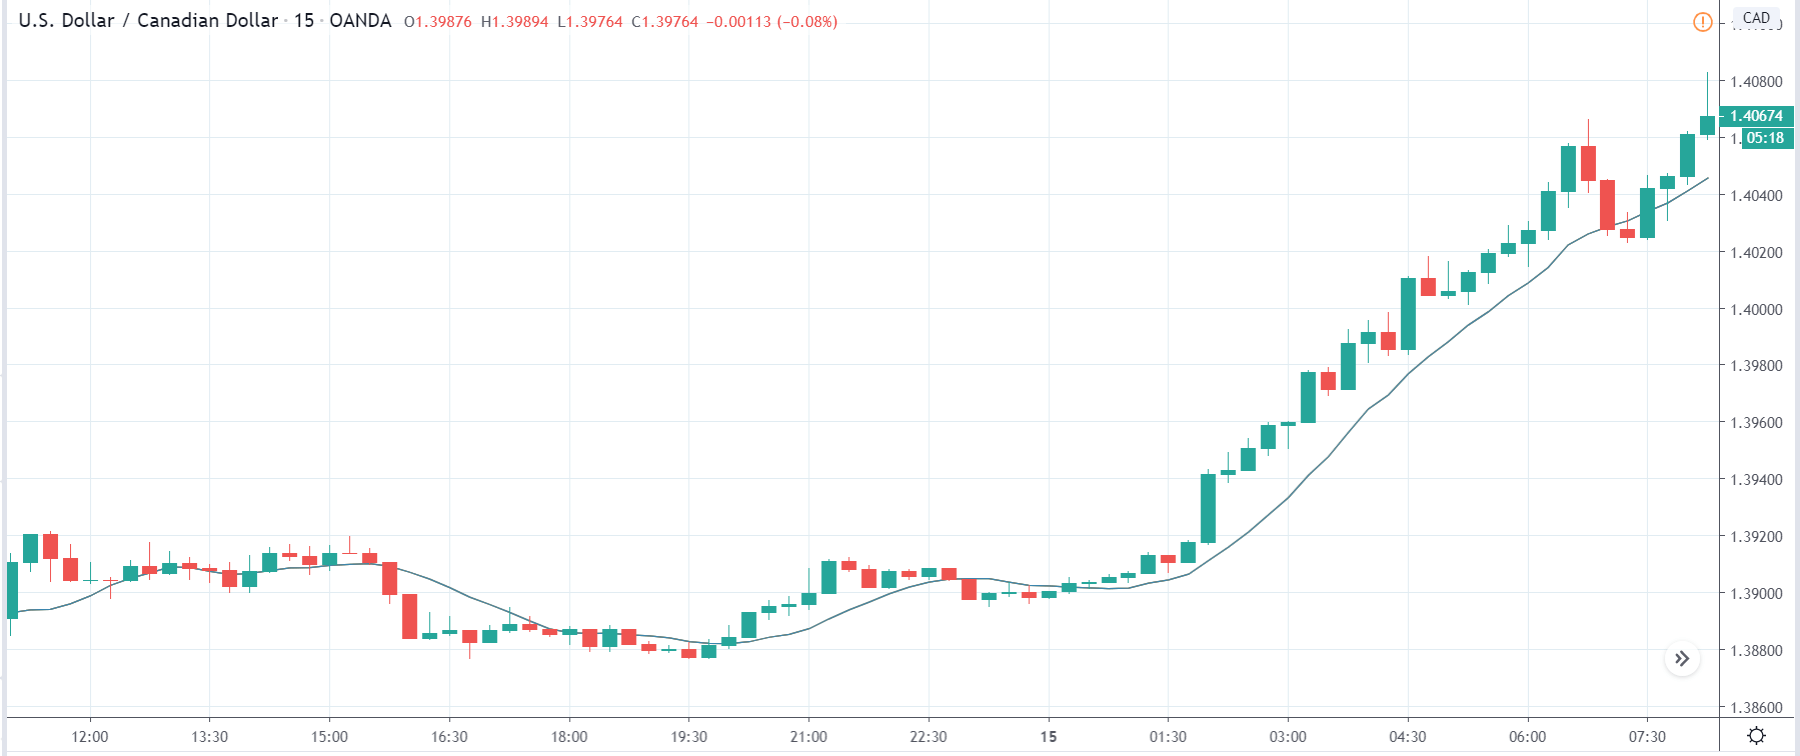
The above price charts are of the USD/CAD currency pair, where we see that the market is aggressively moving up with almost no price retracement. This indicates the US Dollar is very strong, or the Canadian dollar is weak. In any case, we will join the trend only if the price retraces to a ‘support’ or ‘demand’ area.
After the news announcement, volatility expands on the upside, and the price closes, forming a bullish ‘news candle.’ Here too, the Retail Sales data has an opposite impact on the currency as the market reacts positively to the data even though the Retail Sales were largely lower in this quarter. It is advised not to chase the market after the news release since it against the rules of risk management.
We hope you understood Retail Sales MoM fundamental Forex driver and the relative impact of its news announcement on the Forex price charts. Cheers!