Introduction
If you are a trader, you should have some good ideas about the forex market. After having the basic knowledge and related stuff, you, as a trader, need to find a profitable forex strategy. After that, you need to find a proven track record of your strategy.
Therefore, you can easily implement it and start earning through your trades within a short time. However, it would help if you kept in mind that the forex is an uncertain and unstable trading market. Therefore, you must have a profitable and excellent trading strategy if you want to sustain here.
If you search on the internet, you will find thousands of proven strategies out there. The good thing is that experienced traders or mathematicians have created most of the strategies. You have to choose the best one for you.
However, the momentum-based strategy is profitable and famous too. Lots of traders are using this one as their primary trading strategy. However, if you find another suitable strategy, you can go for it besides the momentum trading strategy to boost your probability.
What is The Momentum Trading Strategy?
Momentum is a term that refers to buying a currency pair when it goes up and selling when it goes down. It is a very popular trading strategy among most professional traders.
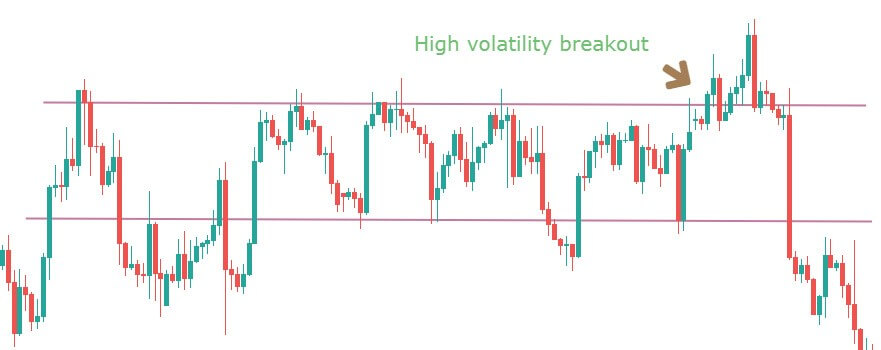
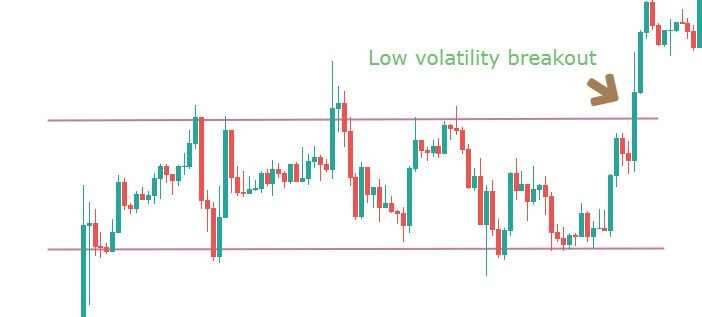
When a big volume starts a movement, it creates a reliable market trend. Therefore, market momentum will be towards the trend that we can identify by reading the chart. In a strong bullish momentum, the price will aggressively create higher highs with a constant speed.
Similarly, in a strong bearish momentum, the price will create lower lows. After identifying the market momentum, we will move to one timeframe lower to take the trade.
However, forex trading always has an uncertain environment. No one can guarantee a 100% movement of price. However, when the market is in a trend, we can make a decent profit by using the momentum-based trading strategy.
Momentum Trading Strategy
Here is the most important part that you are looking for passionately. You will find the best momentum trading strategy for both the newbie and experienced traders. This guideline will answer all your queries.
Let’s have a look at the step by step approach of the momentum trading strategy.
Select the Currency Pair
First, you need to determine the price change from the last three months of some selected currency pairs. Also, don’t forget to do this calculation for the weekend. Once you find the last three months’ price changes, you need to research the last 13 weeks’ price movement.
In terms of currency pair, there is no clear indication of how much pair you should choose. Nevertheless, the ideal and wise option is to go through seven major currency pairs and cross pairs. It is better to put less importance on exotic pairs as they are risky because of their volatility.
After calculating the last three months’ price changes, it’s time to select the currency pair that moved much more than the others. As it is a proven profitable trading strategy, a currency pair can provide a 17% average annual profit. As per the last seven years of market observation, three months’ price has become a reliable factor while selecting the momentum-based strategy.
Entry
As we have a predetermined trend, you need to implement a trend continuation trading strategy to improve your overall trading result better. Moreover, many trend continuation strategies are there for you; you need to select a suitable one. In this trading strategy, we will use 20 Dynamic Exponential Moving Average (EMA) as a trend continuation indicator.
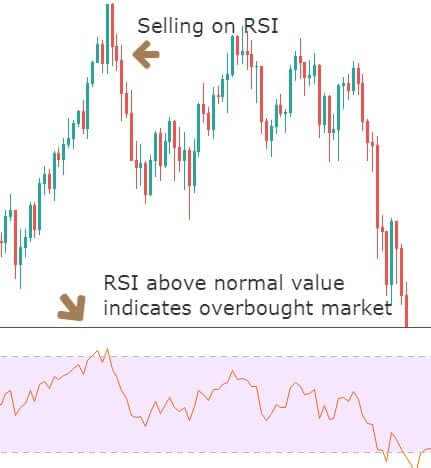
You should enter the trade towards the direction based on market momentum once the price rejects the 20 EMA with its body. Moreover, there is a good and effective solution for determining the trends’ strength: RSI. RSI is a good indicator, as well.
RSI stands for the Relative Strength Index. It has a 0-100 levels indicator. If the price goes below 30 levels, the price is likely to reverse towards the upside. On the other hand, if the price moves above the 70 RSI, it is likely to move down.
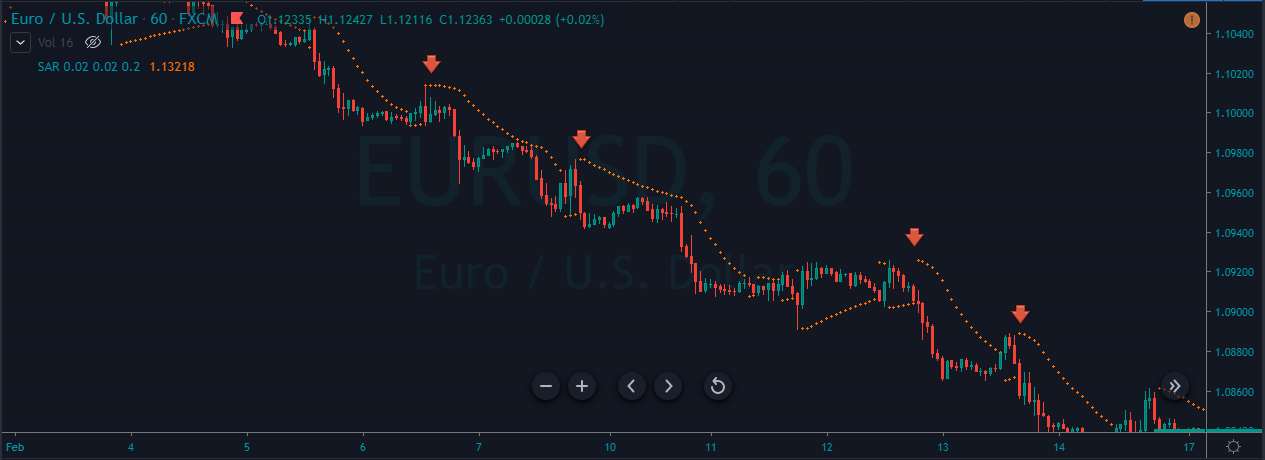
For a sell trade follow the following condition:
- The price is moving towards the direction set in the market momentum.
- The RSI is moving down from the 70 or 80 levels.
- Price rejects the 20 EMA with a reversal candlestick formation.

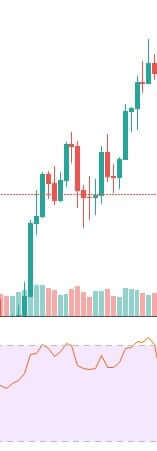
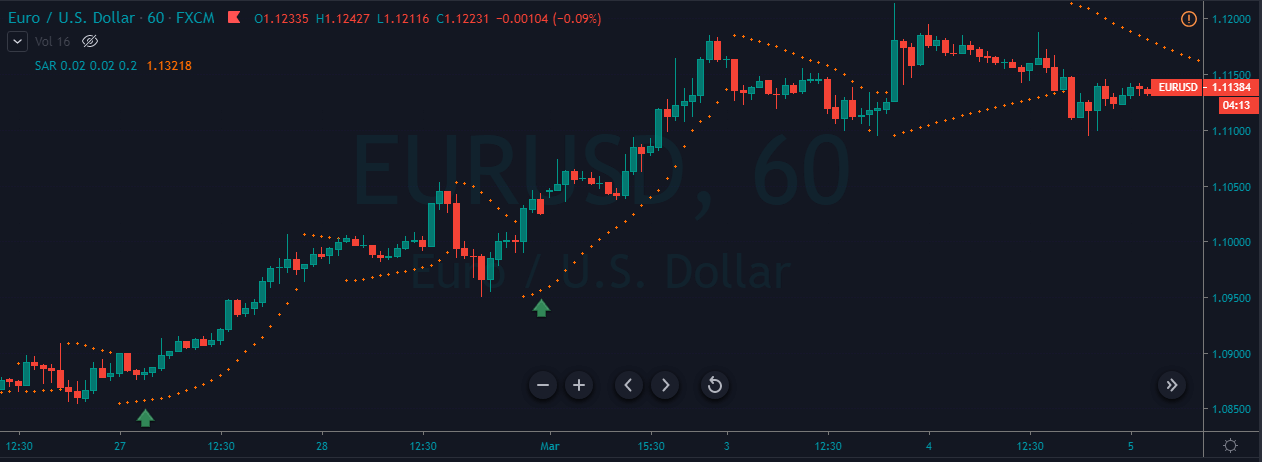
Similarly, for a buy trade follow the following condition:
- The price is moving towards the direction set in the market momentum.
- The RSI is moving up from the 20 to 30 levels.
- Price rejects the 20 EMA with a reversal candlestick formation.
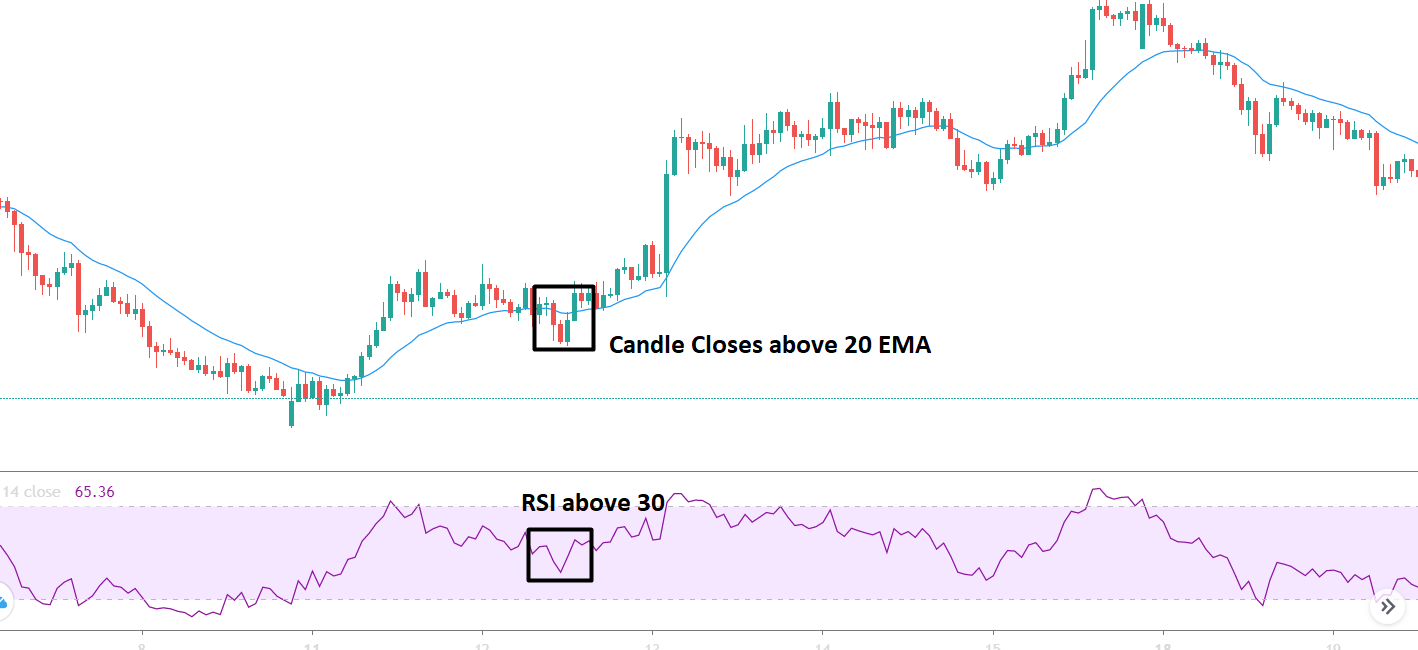
Later on, enter the trade as soon as the candle closes above or below the dynamic level.
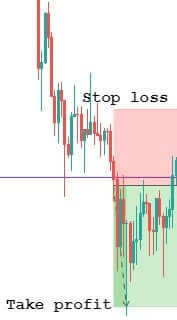
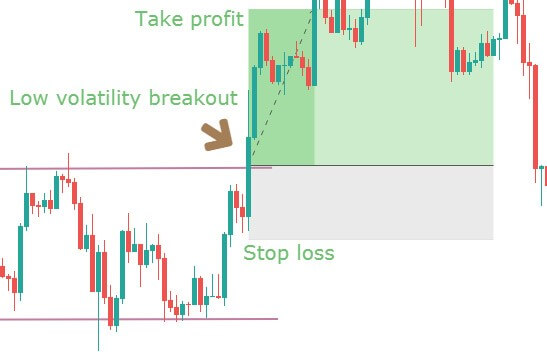
Stop Loss and Take Profit
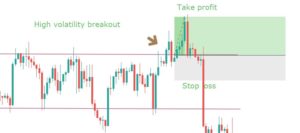
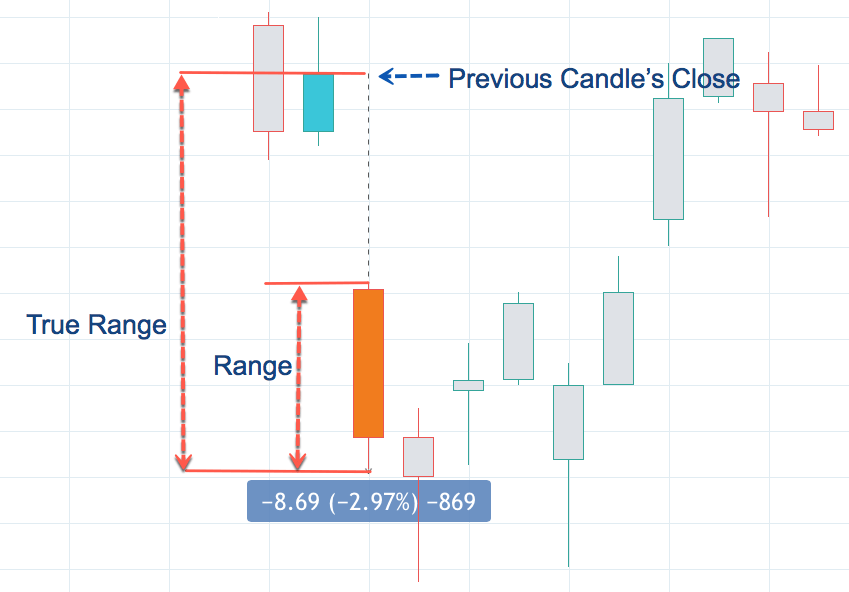
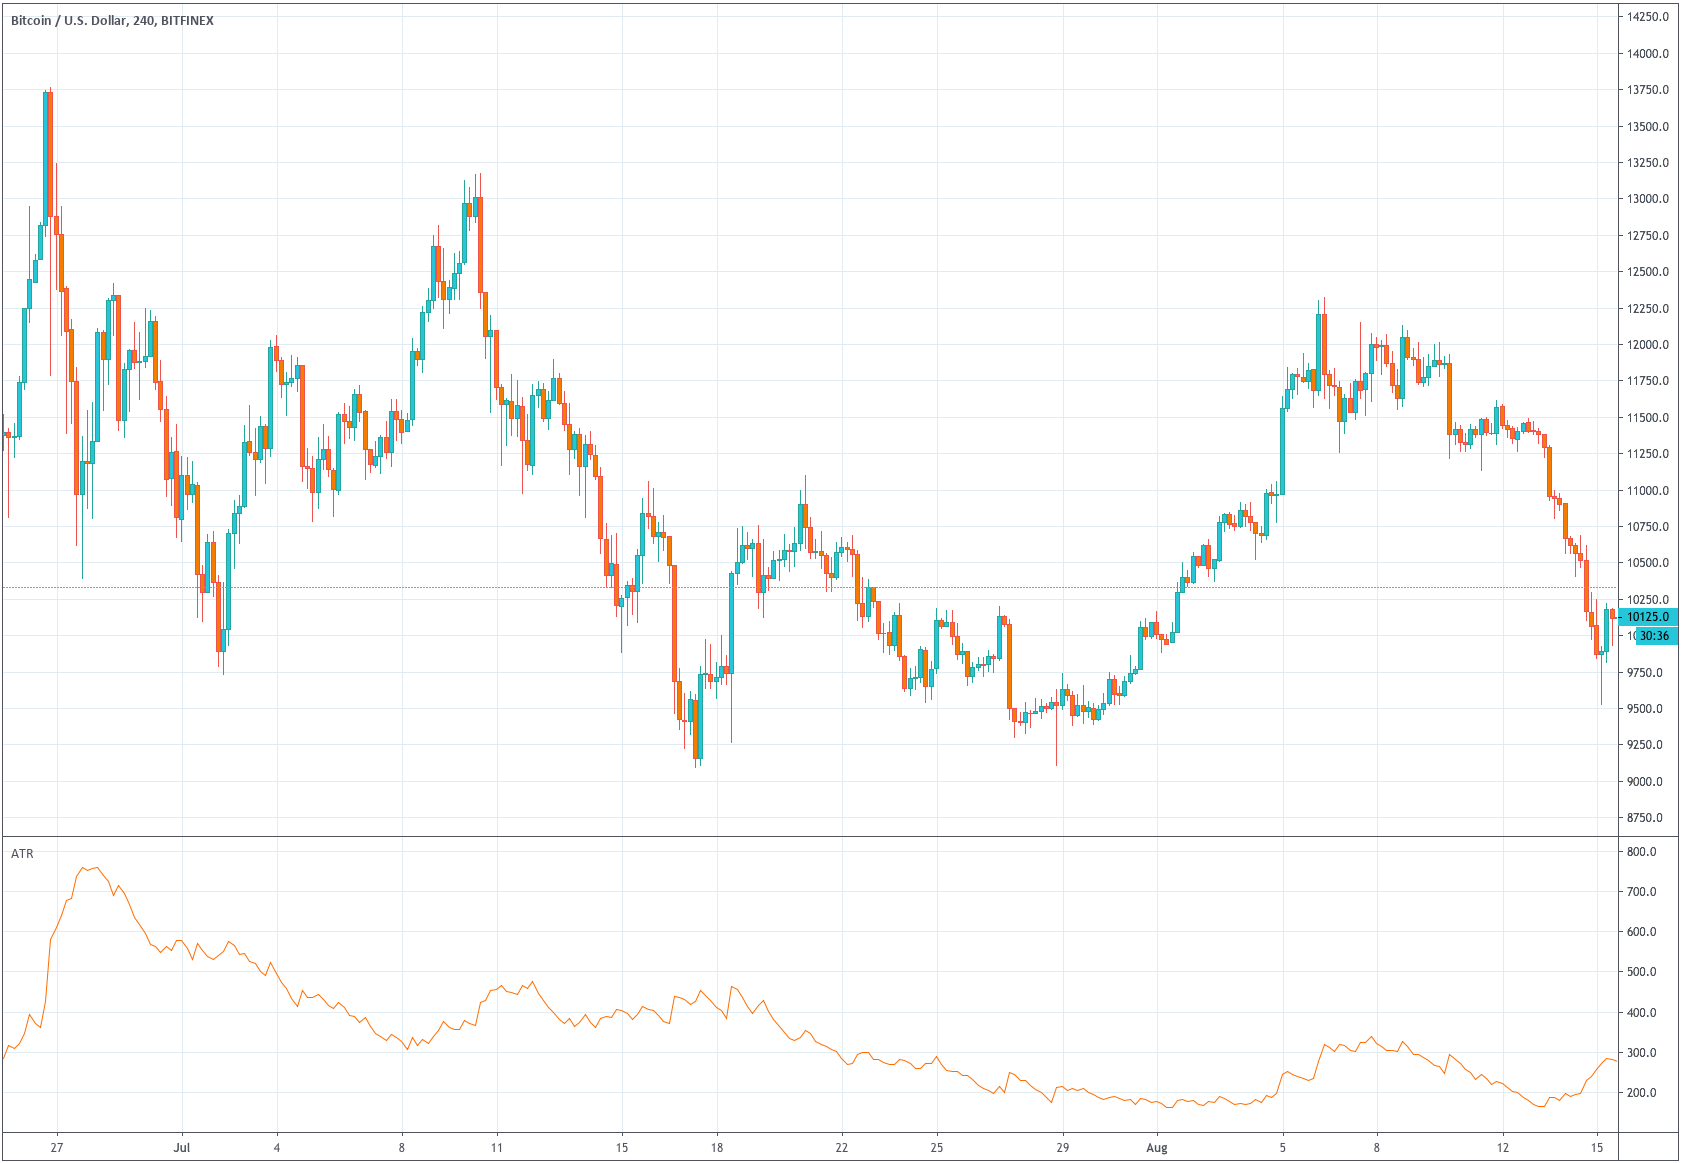
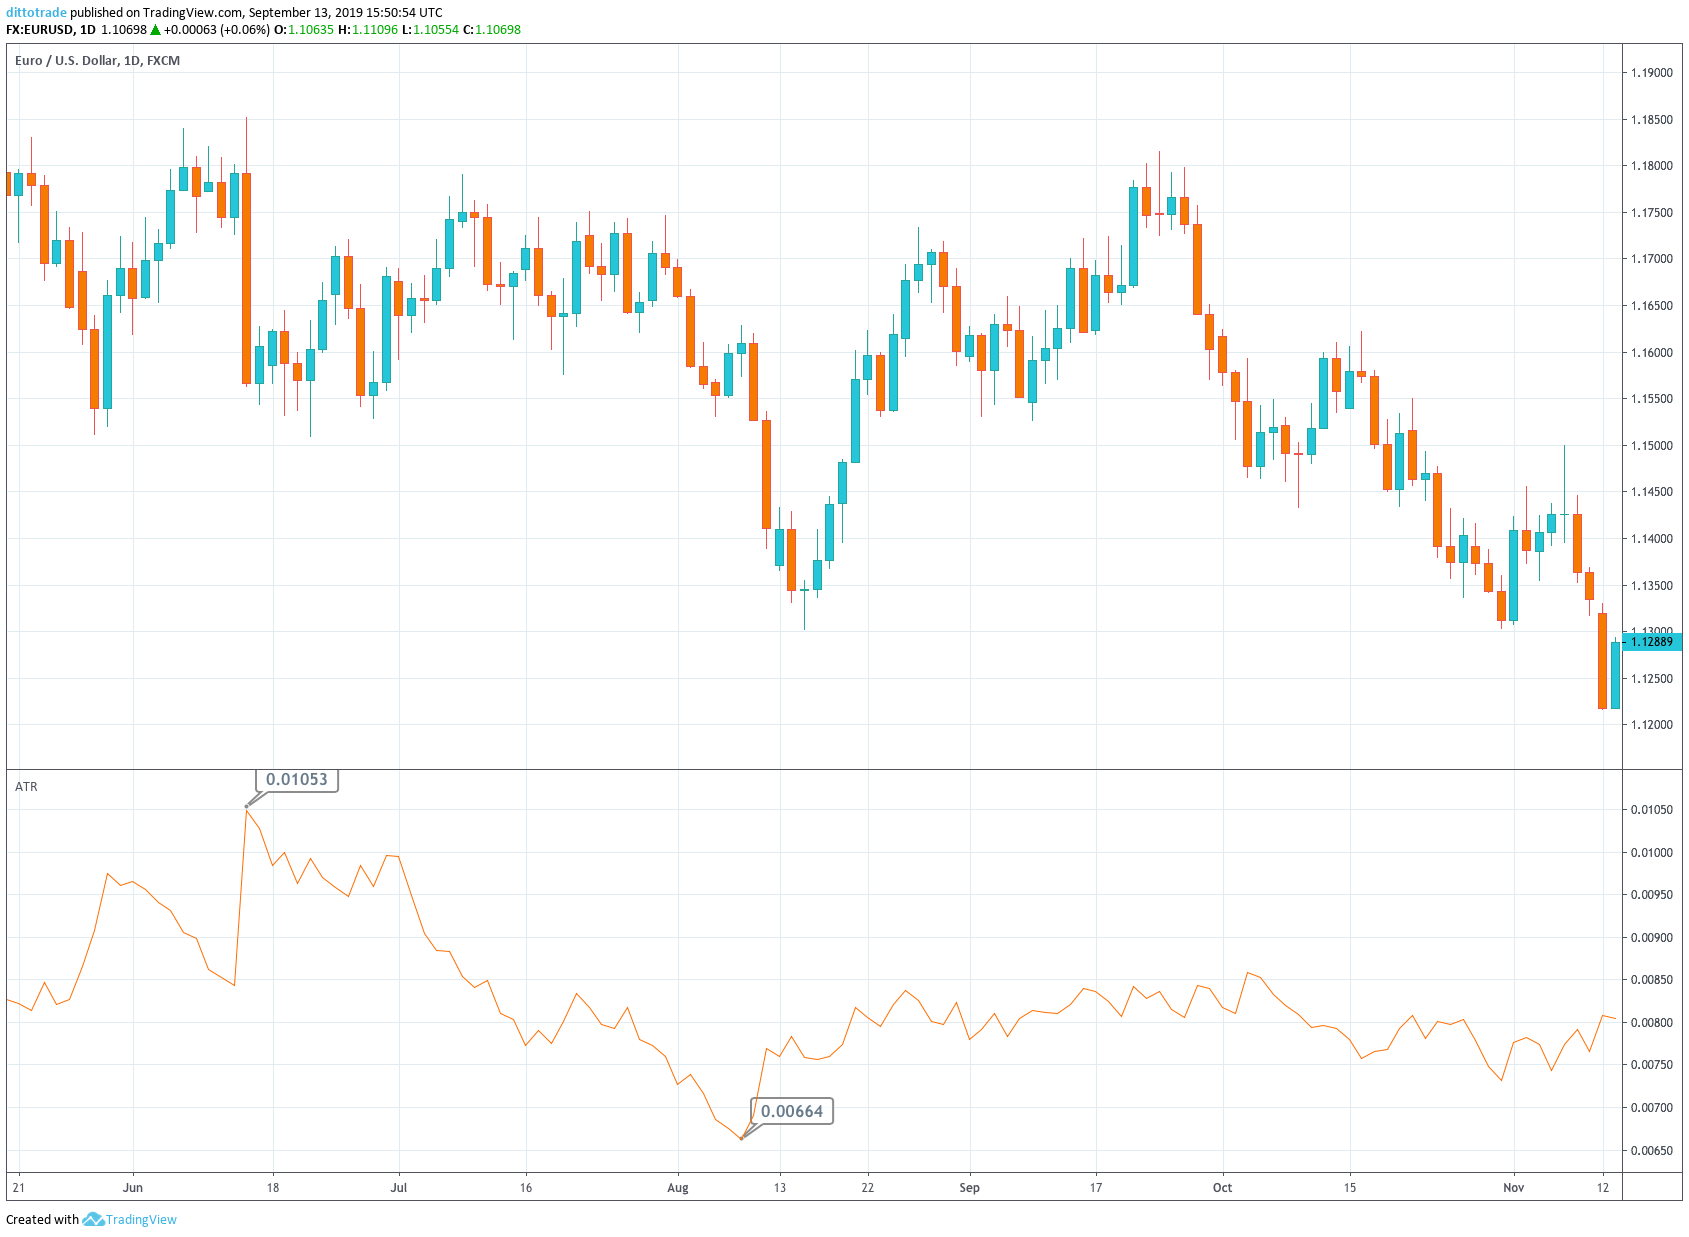
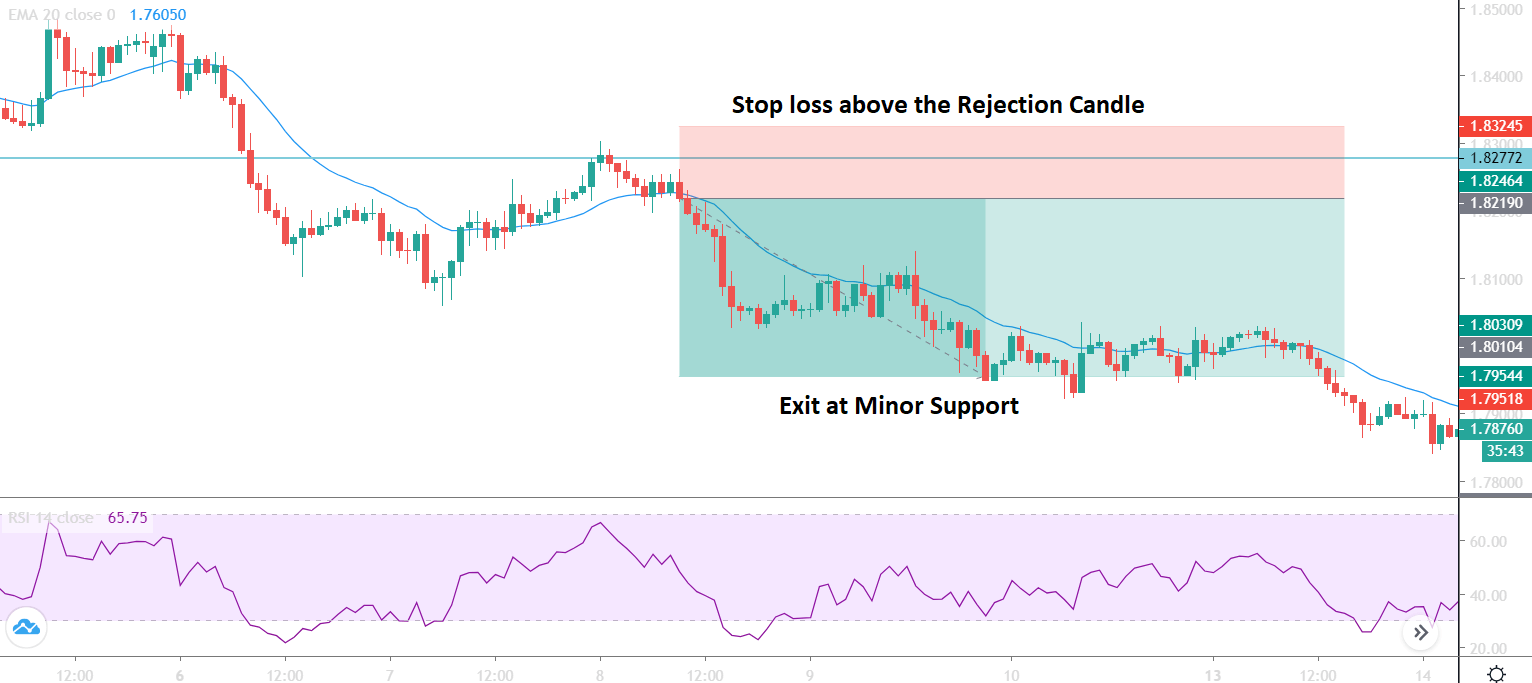
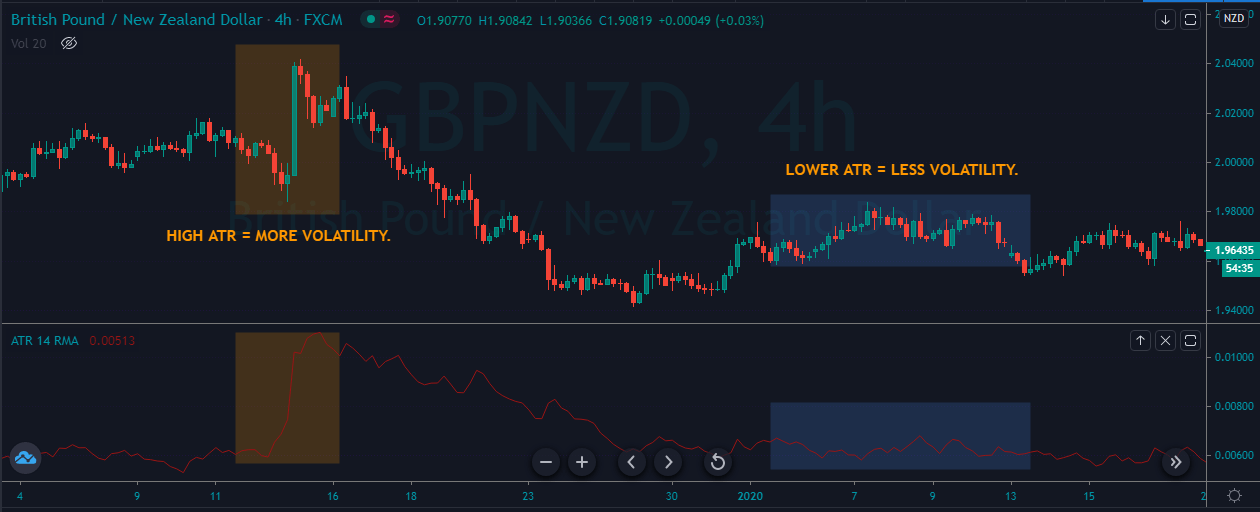
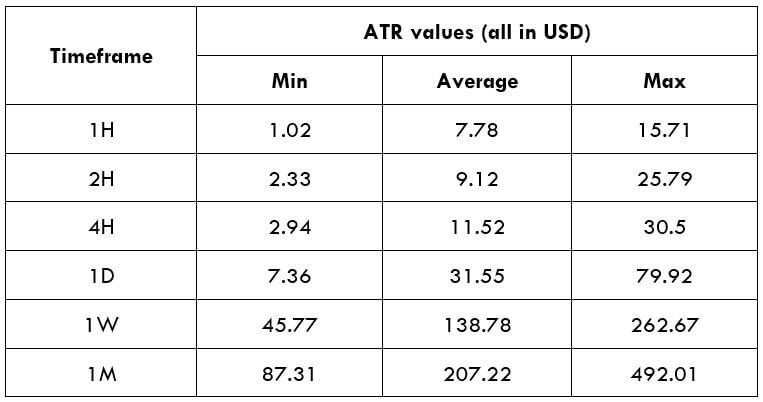
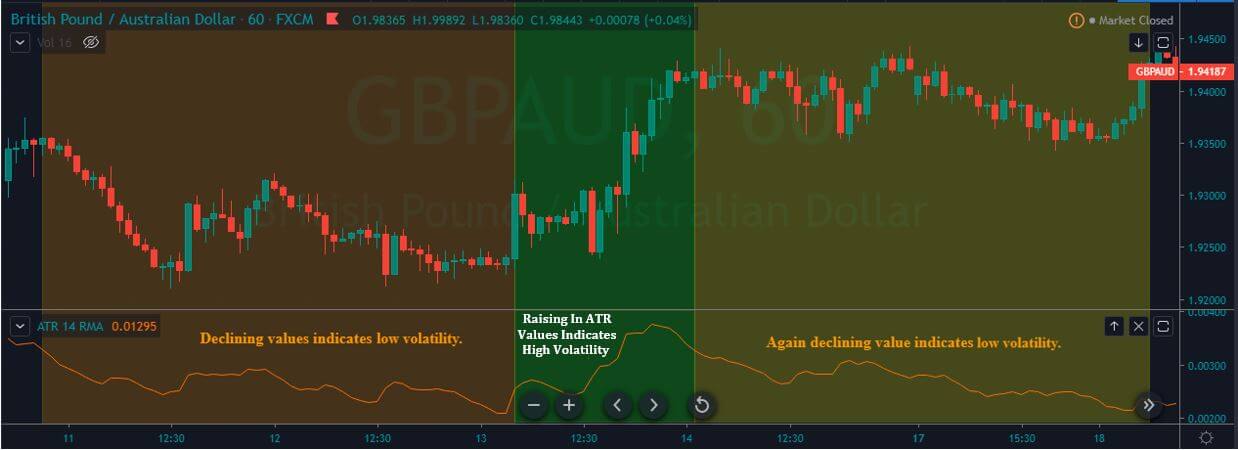
After taking a trade, you need to determine the strength of the trend. You can set the stop loss 15 pips above or below the reversal candle or 20 days Average True Range (ATR).
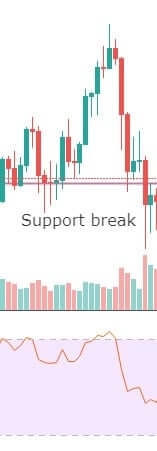
To set the take profit, you need to determine how strong the running trend is. Moreover, impulsive pressure will indicate that the price may break the near-term support or resistance level. In that case, you can increase your take profit level. Alternatively, you can book some profit once you see the price stalling at the support or resistance levels.
Summary
In a nutshell, the summary of the entire guideline is here-
- Find out the direction by calculating the last 13 weeks of market momentum.
- Follow the market direction using a dynamic and hourly candle level of 20 EMA with a proper candlestick pattern.
- According to the price action or ATR, set your stop-loss.
- Following the market movement, you can set your take profit.
In this momentum trading strategy, trade management is the most challenging part as it requires to follow the market trend strongly. Since we know the forex market is uncertain, we should follow the market trend robustly. Moreover, you should follow an appropriate money management system that goes with your personality, and for each trade, it is wise to take less than 2% risk.


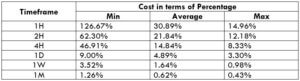
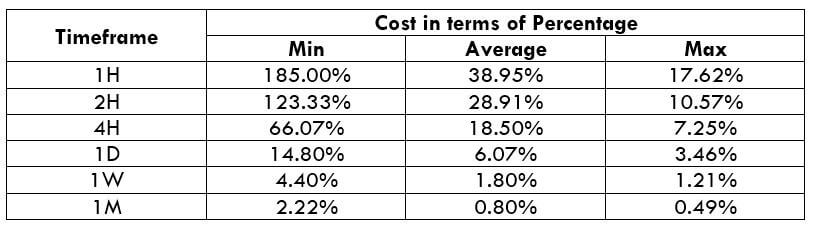
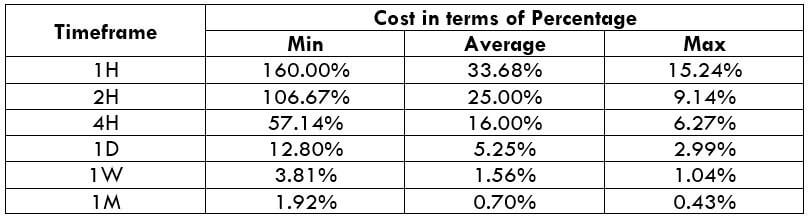
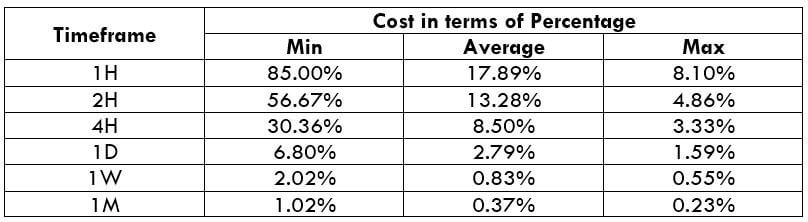
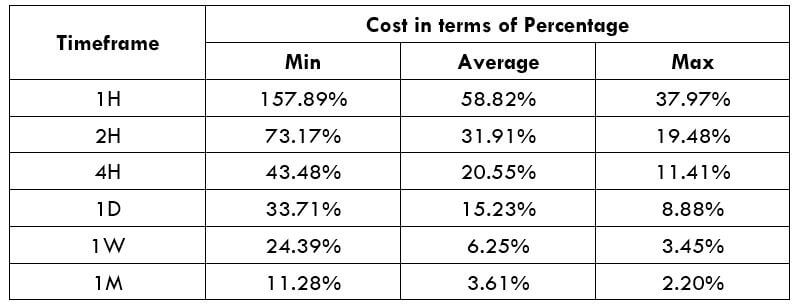
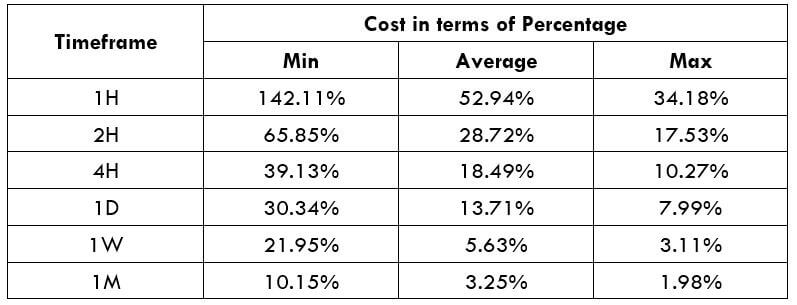
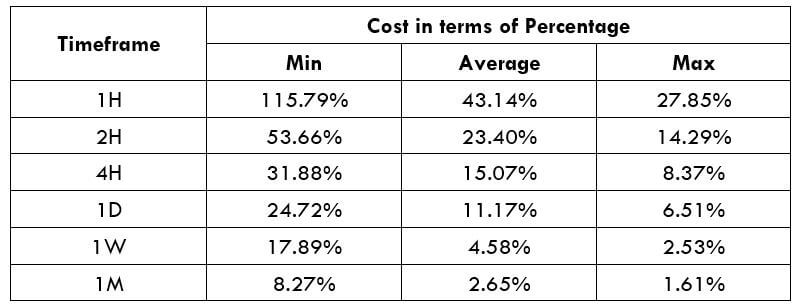
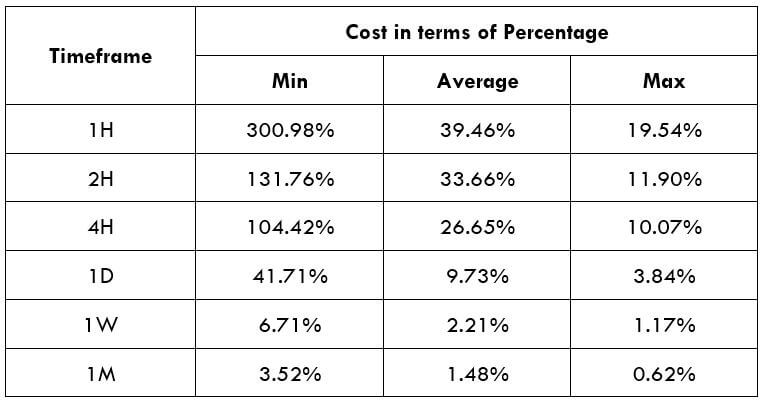
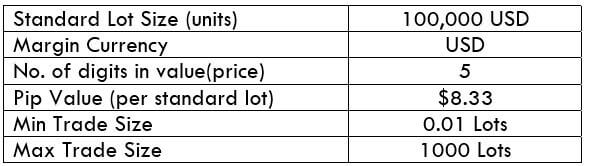
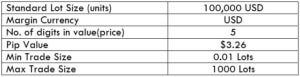
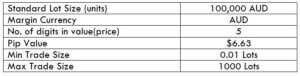
 Spread
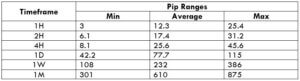
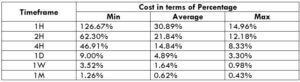
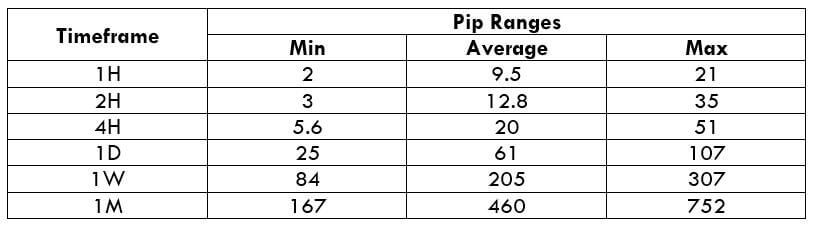
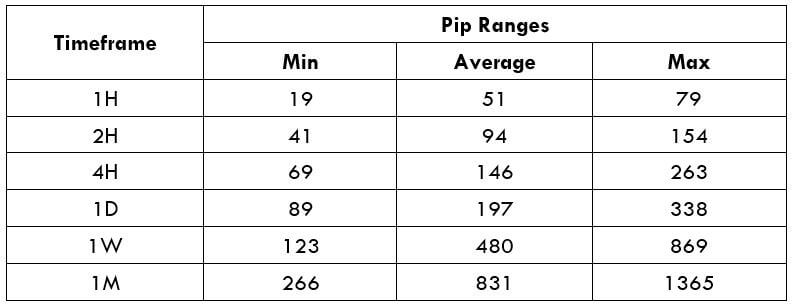
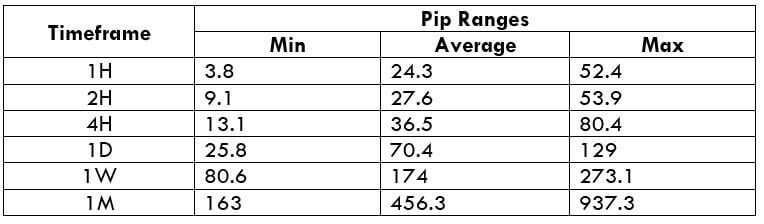
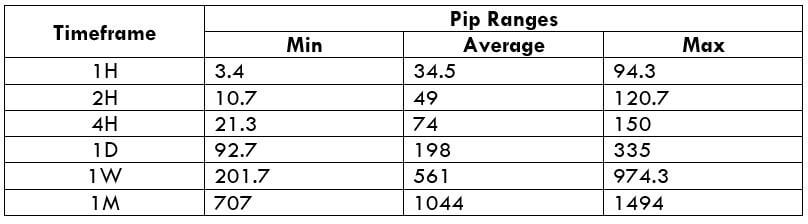
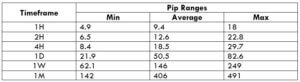
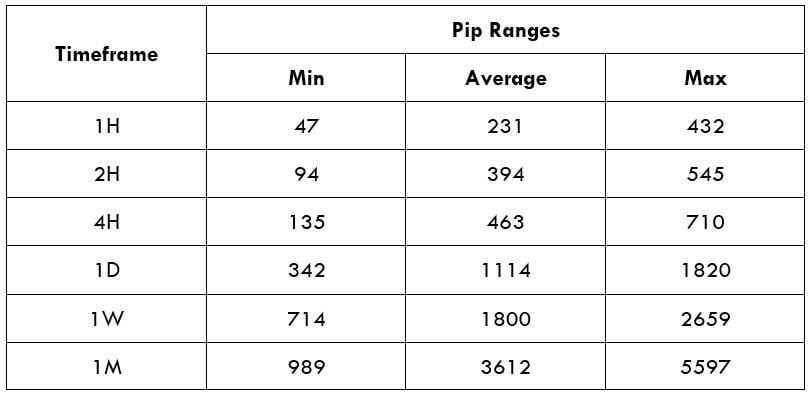 Procedure to assess Pip Ranges
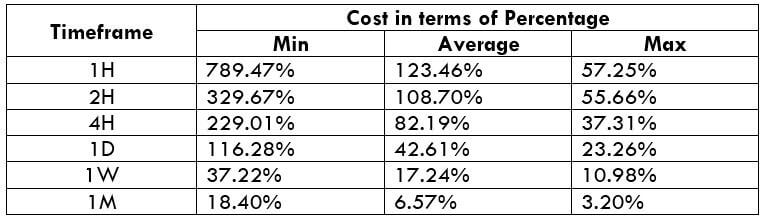
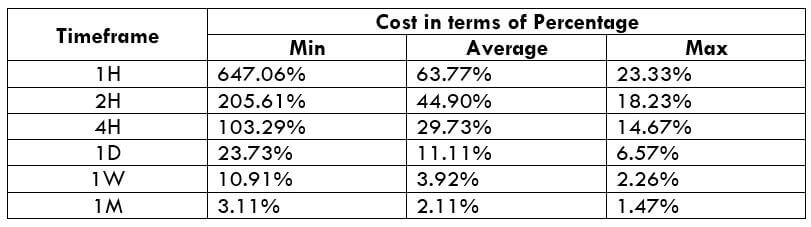
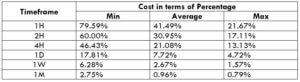
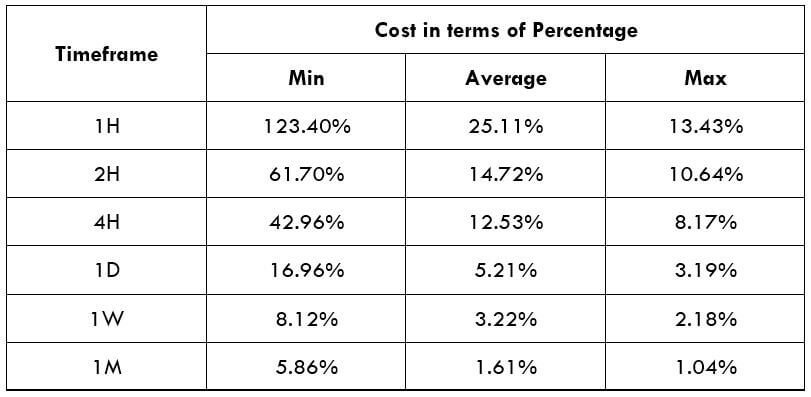 STP Model Account
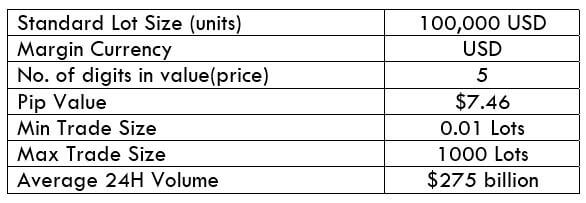
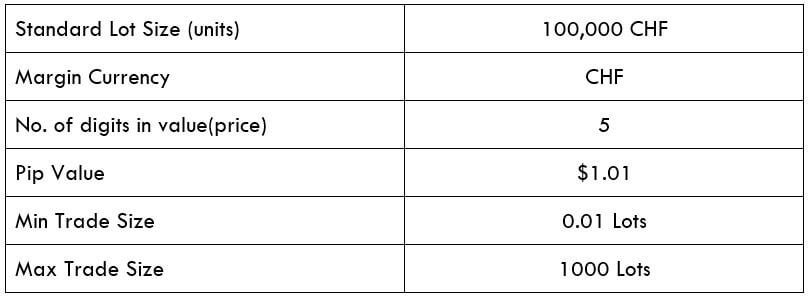
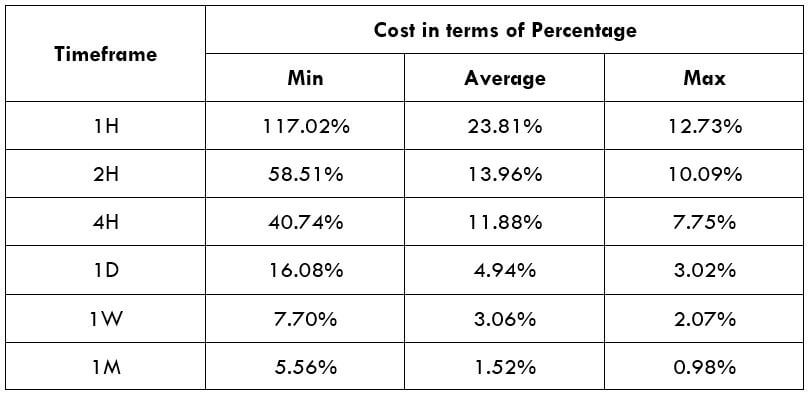

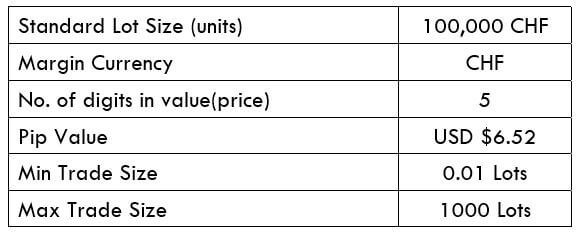

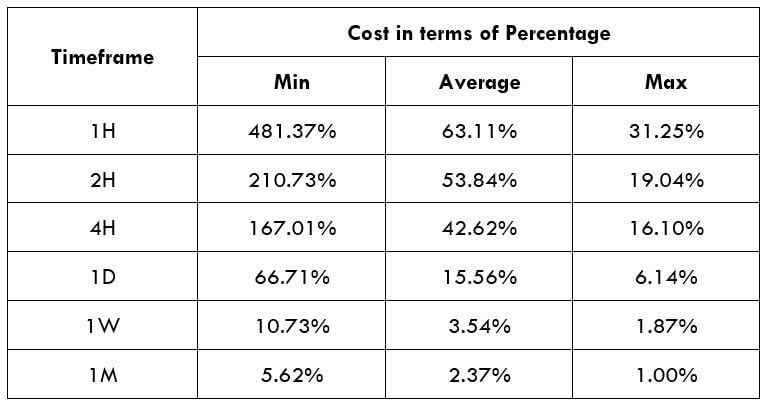

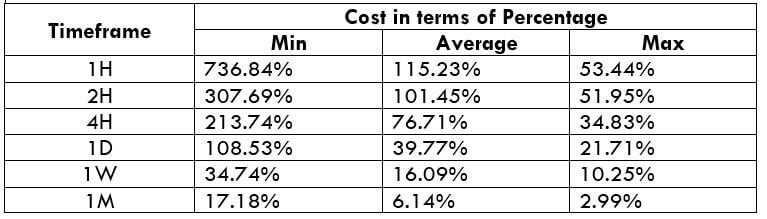

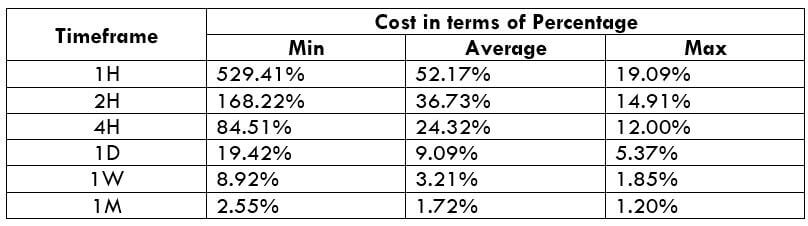

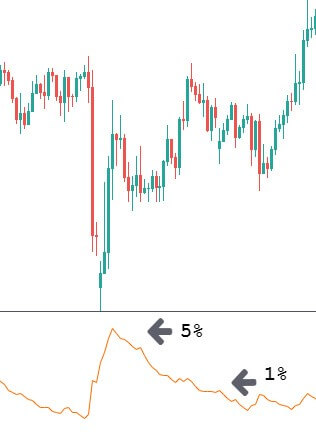
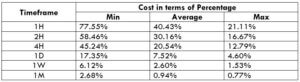 The Ideal way to trade the AUD/NZD