Categories
Forex Basic Strategies

Momentum Trading

Introduction

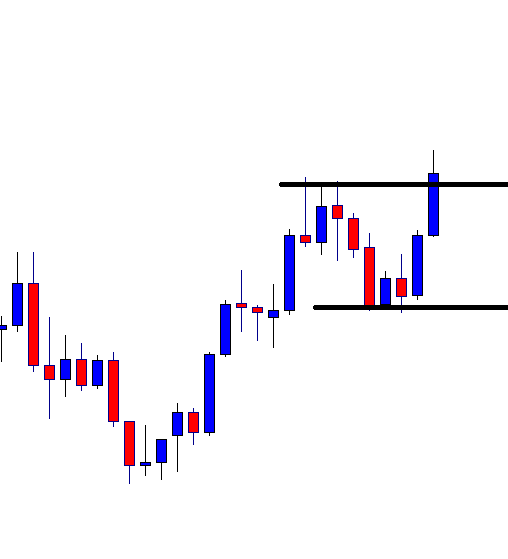
There are two approaches to address the market, even when trading in favour of the primary trend.

The first one is buying weakness and the second one is trading strength on a bullish trend, and the opposite on a downward trend. This one is the buy low sell high philosophy.  But there is a second way of doing business. The buy high and sell higher.

The first methodology is for smart guys. They see a piece of cheese, and they want to be the first mouse to catch it. But it may be just a trap, and they might become a victim of their audacity.

The second methodology means you are part of a crowd of mice that take the cheese after a bunch of pioneer rats took it, and was confirmed that it wasn’t a trap.

Here we are going to talk about this second way of doing business, called Momentum Trading.


Momentum


So what is Momentum and why is it different from other indicators?

Momentum is the change in price over an interval. This is a relation between the price change and the time it takes to achieve it. It measures the speed of change.

If we imagine a ball thrown out vertically,  its speed declines as it goes up until it stops and starts falling down. If we measure the amount of altitude traveled every second we could observe that the value decreases until it stops in mid-air.

The formula for momentum is:

Momentum = Price (0) – Price(n)

Where n is the price n bars earlier. Therefore, Momentum is an indicator of the speed of the price movement.
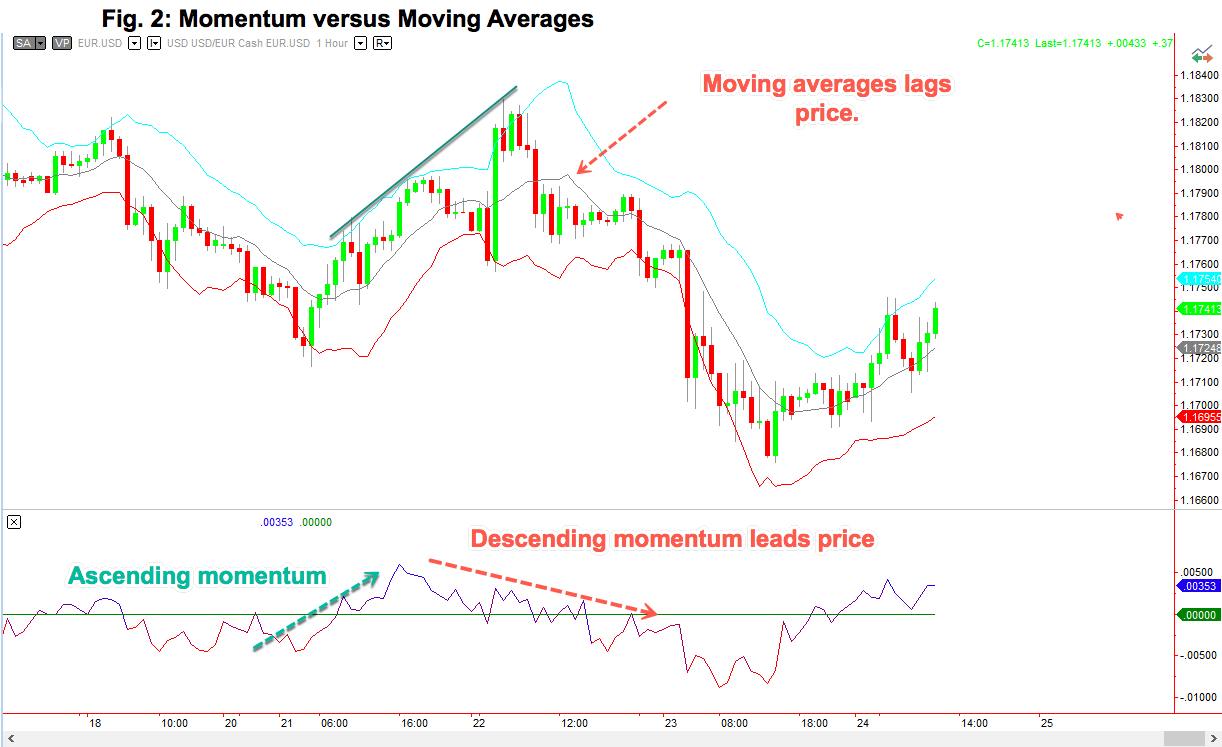
Grasping Momentum

The most remarkable feature of Momentum is that it doesn’t show lag. A moving average turns down after the market peaks, Momentum turns instantly. Momentum just answers the question of how high or low the price moves compared to n periods ago

Momentum as a leading indicator

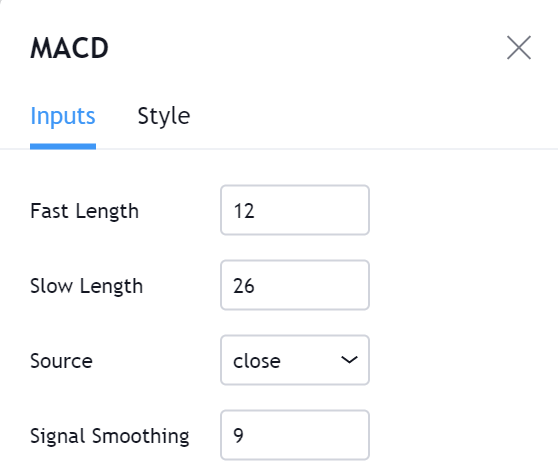
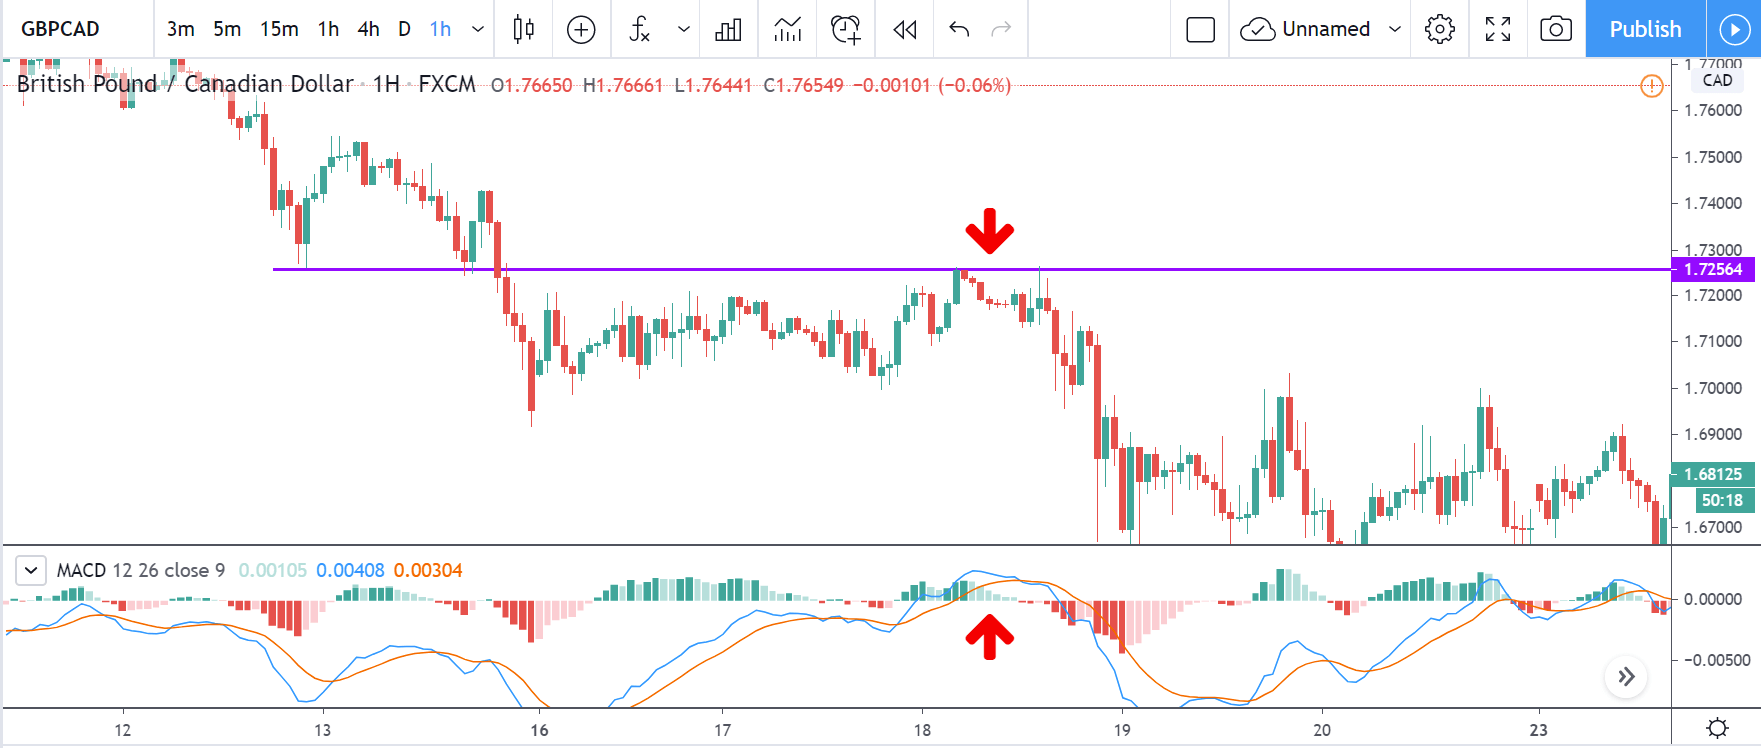
A technical indicator that is an average of the price has to show a lag, the longer the period, the larger the lag. On MACD we could reduce it by subtracting another moving average,  but it still has some lag because one period is shorter than the other.

But Momentum is a subtraction of the price, so we get the speed, which leads the movement. That is, first comes speed before any movement is produced. Therefore, Momentum leads to price movement.

Momentum as an Overbought and Oversold indicator

The distribution of price follows a bell-shaped curve (see the figure). We observe that the volume is centred around the mean of this bell curve, and the extremes are overbought and oversold areas. Near these extremes, the price stops and bounces back towards the mean. The Momentum indicator shows this phenomenon pointing to a sharp change in speed.
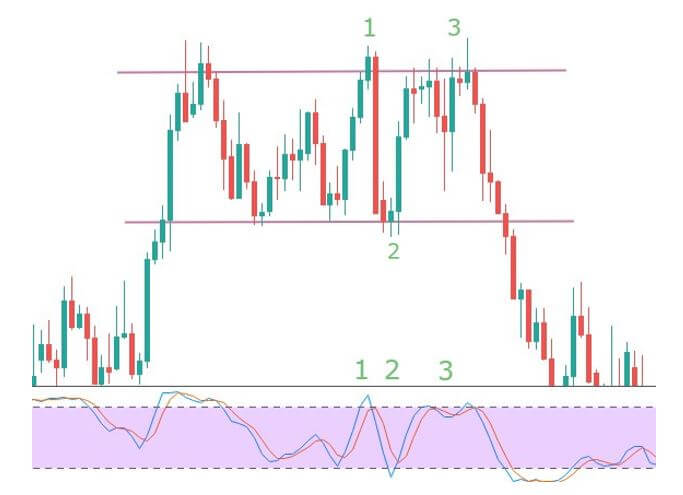
Divergences

This indicator is especially indicated to divergences. When the price is making maximums and Momentum is slowing down, it is a sign that the trend is ending and a correction is due, although it can be a retracement or a simple sideways movement.

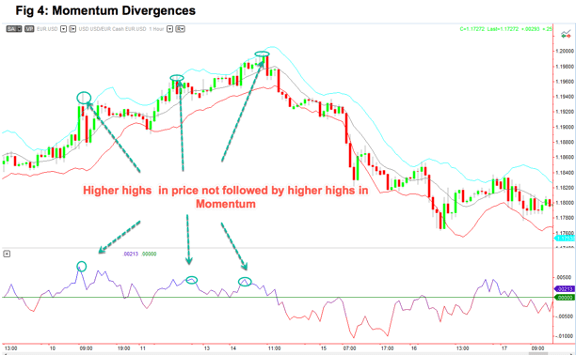
It is important to note that divergences are just warning flags we must pay attention to, not actual trading signals.

In the next article, we’ll analyze a simple Momentum system.


Categories
Forex Course

168. Learning To Trade Multiple Timeframes In The Forex Market

Introduction 

In our previous lesson, we discussed multiple timeframe analysis in forex means. Now, let’s find out what forex trading with multiple timeframes means. In case you are wondering, trading multiple timeframes in forex does not mean that a trader is opening several positions using different timeframes. We are not saying you can’t do this, you if you have the money; but that is not what trading with multiple timeframes in forex means.

Trading multiple timeframes in Forex means using different timeframes to establish the trend and support and resistance levels of a currency pair to determine the best point of entry and exit of a trade. Let’s use a few examples to show how trading with multiple timeframes in forex occurs.

As we had mentioned in our previous lesson, the timeframes you use for your analysis depends on which type of forex trader you are. The best way of trading multiple timeframes in the forex market is by using the top-down technique. With this approach, you first observe the longer timeframes for the general market trend, then use the smaller timeframes to establish more current trends.

Let’s take the example of a forex day trader. You will start by using the 1-hour timeframe to establish the primary market trend. Say, a day trader wants to open a position on September 9, 2020, at 11.00 AM GMT, using the 4-hour timeframe, the market shows an uptrend.

4-hour timeframe for EUR/USD

1-hour timeframe for EUR/USD

The 1-hour timeframe confirms that the pair’s intermediate trend is consistent with the uptrend observed in the 4-hour timeframe.

15-minute timeframe for EUR/USD

The 15-minute timeframe can then be used to select the best entry point.

Determining the market limits: the longer timeframes will enable you to determine the support and resistance levels of a currency pair. The resistance levels help you set your exit points while the support levels will help you timing your market entry.

Establish the trend momentum: While the larger timeframe gives you the overall market trend, the smaller timeframes will help you establish the spikes in the price of the currency pair. These spikes will help you to establish the short-term strength of the trend compared to the longer-term trend.

Helps avoid the lagging effect of some technical forex indicators: Most technical Forex indicators are lagging, meaning trend changes signaled by the indicators lags the real change in the price of the currency pair. Therefore, price-action can be said to be leading the technical indicators in the forex market.

We will cover these three reasons in detail in our subsequent lessons.

[wp_quiz id=”89146″]
Categories
Forex Basic Strategies

Forex Momentum Trading With The Help of RSI & MA Indicators

Introduction

If you are a trader, you should have some good ideas about the forex market. After having the basic knowledge and related stuff, you, as a trader, need to find a profitable forex strategy. After that, you need to find a proven track record of your strategy.

Therefore, you can easily implement it and start earning through your trades within a short time. However, it would help if you kept in mind that the forex is an uncertain and unstable trading market. Therefore, you must have a profitable and excellent trading strategy if you want to sustain here.

If you search on the internet, you will find thousands of proven strategies out there. The good thing is that experienced traders or mathematicians have created most of the strategies. You have to choose the best one for you.

However, the momentum-based strategy is profitable and famous too. Lots of traders are using this one as their primary trading strategy. However, if you find another suitable strategy, you can go for it besides the momentum trading strategy to boost your probability.

What is The Momentum Trading Strategy?

Momentum is a term that refers to buying a currency pair when it goes up and selling when it goes down. It is a very popular trading strategy among most professional traders.

When a big volume starts a movement, it creates a reliable market trend. Therefore, market momentum will be towards the trend that we can identify by reading the chart. In a strong bullish momentum, the price will aggressively create higher highs with a constant speed.

Similarly, in a strong bearish momentum, the price will create lower lows. After identifying the market momentum, we will move to one timeframe lower to take the trade.

However, forex trading always has an uncertain environment. No one can guarantee a 100% movement of price. However, when the market is in a trend, we can make a decent profit by using the momentum-based trading strategy.

Momentum Trading Strategy

Here is the most important part that you are looking for passionately. You will find the best momentum trading strategy for both the newbie and experienced traders. This guideline will answer all your queries.

Let’s have a look at the step by step approach of the momentum trading strategy.

Select the Currency Pair

First, you need to determine the price change from the last three months of some selected currency pairs. Also, don’t forget to do this calculation for the weekend. Once you find the last three months’ price changes, you need to research the last 13 weeks’ price movement.

In terms of currency pair, there is no clear indication of how much pair you should choose. Nevertheless, the ideal and wise option is to go through seven major currency pairs and cross pairs. It is better to put less importance on exotic pairs as they are risky because of their volatility.

After calculating the last three months’ price changes, it’s time to select the currency pair that moved much more than the others. As it is a proven profitable trading strategy, a currency pair can provide a 17% average annual profit. As per the last seven years of market observation, three months’ price has become a reliable factor while selecting the momentum-based strategy.

Entry

As we have a predetermined trend, you need to implement a trend continuation trading strategy to improve your overall trading result better. Moreover, many trend continuation strategies are there for you; you need to select a suitable one. In this trading strategy, we will use 20 Dynamic Exponential Moving Average (EMA) as a trend continuation indicator.

You should enter the trade towards the direction based on market momentum once the price rejects the 20 EMA with its body. Moreover, there is a good and effective solution for determining the trends’ strength: RSI. RSI is a good indicator, as well.

RSI stands for the Relative Strength Index. It has a 0-100 levels indicator. If the price goes below 30 levels, the price is likely to reverse towards the upside. On the other hand, if the price moves above the 70 RSI, it is likely to move down.

For a sell trade follow the following condition:

  • The price is moving towards the direction set in the market momentum.
  • The RSI is moving down from the 70 or 80 levels.
  • Price rejects the 20 EMA with a reversal candlestick formation.

Similarly, for a buy trade follow the following condition:

  • The price is moving towards the direction set in the market momentum.
  • The RSI is moving up from the 20 to 30 levels.
  • Price rejects the 20 EMA with a reversal candlestick formation.

Later on, enter the trade as soon as the candle closes above or below the dynamic level.

Stop Loss and Take Profit

After taking a trade, you need to determine the strength of the trend. You can set the stop loss 15 pips above or below the reversal candle or 20 days Average True Range (ATR).

To set the take profit, you need to determine how strong the running trend is. Moreover, impulsive pressure will indicate that the price may break the near-term support or resistance level. In that case, you can increase your take profit level. Alternatively, you can book some profit once you see the price stalling at the support or resistance levels.

Summary

In a nutshell, the summary of the entire guideline is here-

  • Find out the direction by calculating the last 13 weeks of market momentum.
  • Follow the market direction using a dynamic and hourly candle level of 20 EMA with a proper candlestick pattern.
  • According to the price action or ATR, set your stop-loss.
  • Following the market movement, you can set your take profit.

In this momentum trading strategy, trade management is the most challenging part as it requires to follow the market trend strongly. Since we know the forex market is uncertain, we should follow the market trend robustly. Moreover, you should follow an appropriate money management system that goes with your personality, and for each trade, it is wise to take less than 2% risk.

Categories
Forex Price-Action Strategies

Do not Forget to Check the Daily Chart

In today’s lesson, we demonstrate an example of an H4 chart and try to evaluate its price movement after breakouts. The chart shows that the price makes three breakouts altogether. The first two breakouts do not create that much momentum towards the breakout, but the last one does. We try to find out the reason behind it.

This is an H4 chart. The chart shows that the price makes a bullish move and consolidates. It seems that the price has found its support since it has already produced a bullish engulfing candle. The buyers may go long in the pair above consolidation resistance.

The chart shows that consolidation resistance is a strong level of resistance where the price gets rejection several times. Since it is an H4 chart, three times rejections, on the same level, means that it is a daily level of resistance. Thus, an H4 breakout may not create that much momentum all the time.

The chart shows that the price after making a breakout consolidates for a long time again. It is because of the daily resistance factor. The daily candle confirms the breakout. Thus, the price in the H4 chart consolidates. Look at the last candle. This comes out as a bullish candle breaching consolidation resistance. Let us find out what happens next.

The last H4 bearish inside bar is the last candle of the day. It means the daily candle comes out as a bullish candle after the daily breakout, breakout confirmation, and daily reversal candle.

The price consolidates with one more candle to start the next trading day. A bullish reversal candle may push the price towards the North with good bullish momentum. Since the chart now belongs to the H4 traders as well.

Here it is. The chart produces a bullish engulfing candle closing well above consolidation resistance. The length of consolidation is shallow. However, the bullish reversal candle looks to be a perfect signal candle.

There she goes. The price heads towards the North with extreme bullish momentum. The last candle suggests that the price may continue its bullish journey. Let’s look at the last move. The price does not consolidate with enough depth, but it makes a strong bullish move. On the other hand, on the first two occasions, it consolidates well, but its breakout does not create good momentum. It is because, on the first two occasions, there is a daily resistance factor. The level of daily resistance makes the H4 traders wait for more. Once the price makes a breakout on the daily chart, it heads towards the breakout direction with good momentum. The H4 traders are to check the daily chart before taking entry. This is one more reason to check that one thoroughly.

Categories
Forex Course

104. Understanding the Essence of the Momentum (Using MACD Indicator)

Introduction

Momentum indicators are those indicators that determine the rate of price changes in the market. These indicators are helpful in determining the change in the market trend. In this lesson, we shall be talking about the MACD indicator, which is one of the most extensively used momentum indicators.

Moving Average Convergence Divergence – MACD

Moving Average Convergence Divergence – MACD is a momentum indicator that primarily works on the relationship between two moving averages of an instrument’s price. Precisely, it takes Exponential Moving Average into consideration for its calculation.

A misconception in the industry is that MACD is a lagging indicator. There are a set of people considering it as a leading indicator, while some see it as a lagging indicator and use it as a confirmatory tool. Note that MACD is both leading as well as lagging indicators.

MACD is said to be a leading indicator when it is used to identify oversold and overbought conditions. It indicates the possibility of a reversal when the market is actually moving in the other direction. However, this form is not widely used. On the other hand, it is said to be a lagging indicator if it is used for crossovers. One will be aware of the market trend when there is a crossover on the indictor. But when this happens, the market would have already made its move.

Also, that’s not it. The real element of momentum is added by the histogram. This true aspect of MACD reveals the difference between the MACD line and the EMA. When the histogram is positive, i.e., above the zero-midpoint line but is declining towards the midline, then it indicates a weakening uptrend. On the contrary, if the histogram is below the zero-midpoint line, but is climbing towards it, then it signifies a slowing downtrend.

Apart from this, it is also used for identifying divergence in the market. That is, indicates when there is abnormal motion in the market, hence, indicating a possible change in direction.

What is the MACD indicator composed of?

The MACD is made up of two moving averages. One of them is referred to as the MACD line, which is derived by finding the difference between the 26-day EMA and the 12-day EMA. The other is the signal line, which is typically a 9-day EMA. And there is a zero-midpoint line where the histogram is placed.

MACD as a Momentum Indicator

To understand how momentum works in MACD, consider the example given below.

Firstly, the market is in a downtrend where the purple line represents the Support & Resistance level. In other terms, this line indicates a potential sell area. Below the price chart, the MACD indicator has plotted as well. Observing closely at the histogram at the marked arrow, it is seen that the histogram was falling towards the zero-midpoint line indicating the weakness of the buyers. Also, this situation happened in the area where the sellers are willing to hit the sell. In hindsight, the MACD gave the right signal solely from the histogram.

This hence concludes the lesson on momentum indicators. We hope you found this lesson very informative. If you have questions, leave us a comment below.

[wp_quiz id=”71030″]
Categories
Forex Price-Action Strategies

Breakout With and Without Momentum

A Breakout without momentum often does not push the price towards the trend. The price seems to come back at the breakout level again. On the other hand, a breakout with momentum pushes the price towards the trend in most of the cases. In today’s lesson, we are going to demonstrate a chart, which has two types of breakouts. Let us get started.

The chart shows that it heads towards the North. Upon finding its resistance, it makes a bearish correction. It finds its support and produces a bullish engulfing candle. The price heads towards the North again. It makes a breakout with a candle having a long upper shadow. It is a breakout. However, the breakout takes place with two bullish candles. Let us proceed to the next chart to find out what the price does.

Despite making a breakout, the price does not head towards the North. It rather consolidates around the breakout level. The breakout level still holds the price. Nevertheless, it does not look that good for the buyers. The price may come back within those two levels and hit the lower support. Let us find out what happens next.

The price does not come back within the breakout level. It makes another breakout at consolidation resistance. It takes only one candle to make the breakout. Breakout traders want to get this kind of breakout to trigger a long entry. The buyers may trigger a long entry right after the last candle closes by setting stop loss below consolidation support and by setting take profit with 1R.

The price heads towards the North with good bullish momentum. The next candle comes out as a strong bullish candle. It suggests that the bull has taken control. It seems the price may hit 1R in a hurry as well. This is what the breakout traders want.

As anticipated, the chart produces another bullish candle and hits the target. It takes two candles to achieve 1R. It gives traders more confidence about the strategy and saves their time. They can concentrate on other charts to look for entries. It does not mean it goes like this every single time though.

The above charts show that a breakout by two candles does not generate the momentum towards the trend. However, when the breakout takes place with a single candle, the price heads towards the trend’s direction in no time. Thus, if we do not want to hang around with our entries and keep an amazing winning rate, we may take entries on a breakout that takes place with good momentum.

Categories
Forex Price-Action Strategies

Patience Required Even with H1 Breakout Trade Setup

In today’s lesson, we are going to demonstrate an example of an H1 breakout strategy. Usually, the price heads towards the trend’s direction with good momentum on the H1 breakout trade setup. In today’s example, the price does not behave as it usually does. Let us get started.

The price after being bullish, it has been on consolidation. Look at the last two candles. The price heads towards the consolidation resistance. The buyers eagerly wait for a bullish breakout at the level of resistance on such price action. Let us proceed to the next chart.

Here comes the breakout candle. The buyers love to get a breakout with such a candle. Now, they must wait for the next candle to close above the breakout candle. If that happens, traders may trigger a long entry.

The next candle comes out as a bullish candle closing well above the breakout candle. The buyers may trigger a long entry right after the last candle closes. The stop loss is to be set below the trend-initiating candle, and the take profit is to be placed with 1:1 risk-reward. Six out of ten times, the price goes towards the take-profit level with ease in a hurry. Let us proceed to the next chart and see how this one goes.

The price does not head towards the North with good bullish momentum. The way it has been going for the last five candles, it looks ominous. A question may be raised here, “shall we close the entry?” The price still has a lot of space to hit take profit level. The market is not about to close down for the weekend or holiday. Thus, we must be patient and hold the entry. In other words, we shall apply the rule “set and forget.” The set and forget rule is tailor-made for intraday trading, such as the H1 chart to the 5M chart. Let us wait and find out what happens.

After a long while, the price makes a move towards the North again. It seems the trade is going to get the buyers some green pips. They must wait and let the price to hit the target.

It loses its momentum again a bit, but it hits the target. We often head that patience is required more when traders trade on major charts such as the H4, the daily or the weekly. The reality is patience is required for traders of all kinds. Today’s example has proved this again.

Categories
Forex Price-Action Strategies

Edged Breakout Lessens Momentum and Chance of Winning

In today’s lesson, we are going to demonstrate an example of the daily-H4 combination trade, where the price produces a reversal candle, but it does not make an explicit breakout. The price heads towards the breakout direction after having more consolidation. It often happens. Thus, we need to get familiar with such price action. Let us get started.

Above, we can observe a daily chart. The last daily candle closes well below the last swing low. This is an explicit breakout. Let us now determine the level where the price may find its next support. The chart shows that the price closes within a swing low. However, the swing low one below may come as the next level of support. Have a look at the chart below.

The price may head towards the South and find its support at the red-marked level as far as the daily chart is concerned. The daily-H4 chart combination traders are to flip over to the H4 chart for the price consolidation and bearish breakout to go short on the pair.

The image above corresponds to the H4 chart. The chart produces a bullish corrective candle. If it produces a bearish candle closing below the last swing low, the sellers may trigger a short entry. Let us proceed to the next chart.

The chart produces a bearish engulfing candle. However, look at the breakout. It is not an explicit breakout. If the candle closed below the level of support with a 15%-25% extra red body, it would be an excellent entry. Nevertheless, it is a strong bearish reversal candle (bearish engulfing). A bearish engulfing candle in a bearish market makes a very strong statement that the sellers are in control on the minor charts. Let us find out what happens next.

The chart produces another bearish candle. Look at the last candle. It comes out as a bullish candle with a long upper shadow. The pair still looks bearish, but the bullish corrective candle goes too far up. It may be because of the bearish reversal candle that we have after the first consolidation. If it closed well below the level of support, it would have been bearish with more momentum. Often the price goes towards the opposite direction and hits the stop loss too in such breakout. Let us find out what happens here.

It goes according to the sellers’ expectations and hits the Take Profit. Here is a question. Would you take such entry next time? I would not blame if you say ‘yes.’ Because such trade may have a 55% chance of winning, however, to be very consistent and keep our confidence at the top level, it is better if we skip such entry.

Categories
Forex Basic Strategies Forex Trading Strategies

What Should Know About Trading Ranges Using Support & Resistance?

What is Range trading?

It is said that the market only trends for 30% of the time. So it becomes necessary to have a range trading strategy to take advantage of the other 70% of the time. Range trading is not difficult, but it requires discipline and determination to make most out of it. When a market is trending, it forms a pattern of higher highs and higher lows, in case of an uptrend. The move, in this case, is really strong and is known as an impulsive move. The other type of movement is known as the corrective move, which comes in the form of a pullback. Impulsive moves are stronger than corrective moves.

When the market is making any such moves, it finds itself stuck between a high or low and continues to oscillate between these two points. It means buyers and sellers are equally strong, and this creates a very choppy environment.

Traders now trade these extremes and continue to trade until price breaks out on either of the sides. These two points act as potential support and resistance points, used by traders to place their orders.

In the above chart, we have drawn a few lines from where the market bounced off. The price action in those areas creates many trading opportunities. The instrument in the chart first trends down and then puts up a low (marked by line 1). Initially, you might think it as a downtrend and expect the pattern of lower lows and lower highs to continue.

Then you see the market rally to line 2, from where the market falls back to line 3 but does not fall till line 1. This highlights the fact that the market is no more trending. The market instead could be stuck in a range between line 1 and line 2. These are not ‘defined’ prices. Always consider them as zones with a margin of error both outside and inside the range. A trader will look to position himself/herself at these zones of support and resistance that forms the range.

Why support and resistance?

The price that is stuck between these two extremes has a lot of significance. This is because, at this point, the price can either Stop, Reverse, or Breakout. When you have the right knowledge, it will stop you from simply pushing the buttons and will make you trade with a defined strategy.

Range = Consolidation

A range is nothing but a price consolidation of the overall trend move. It could either end the current trend or cause a reversal. The different price behavior pattern in the range creates many trading opportunities, which can be traded by all types of traders, depending on their risk appetite. Now let’s discuss some important trading strategies using support and resistance of ranges.

Strategy Using Technical Indicators

Using technical indicators to trade can aid your trading strategy. Especially while trading ranges, many indicators can be a part of your trading plan. Here, we have used the Stochastic Indicator as a tool to trade the ranges.

In the above image, the two lines represent the support and resistance of the range formed. When the price reaches the resistance at point 1, the Stochastic enters the overbought area, and the slowdown in momentum is the confirmation signal for a sell. The resistance pushes the price back to support (point 2), but this time the momentum is very strong, hence no entry. The stochastic also does not enter the oversold area clearly. Next time the price goes to resistance with greater momentum, and the Stochastic too does not give an entry signal as it is not in the overbought area. This means one shouldn’t be going short at this point.

Overall, there is only one risk-free trade available in the above chart, and that is at point 1 (short).

Strategy Recap

Firstly, we should be able to see the price at one of the extremes. When that happens, the indicator should show either be at overbought or oversold conditions. The momentum of the price should be an important factor that determines our entry. If we see reversal patterns, this could be the best entry with a good risk to reward ratio. Do not forget to place protective stops much below or above the support and resistance levels, respectively. This will always protect your trades from a false breakout.

When not to buy at support and sell at resistance in ranges

You must have probably heard traders saying that more time a level is tested, the stronger it becomes. This is not true in the case of our range break-out strategy. You need to start paying attention to the price patterns at these ends. If the price has made multiple touches, it could be getting ready for a breakout in the direction of the higher time frame.

The above chart is an example of such a scenario. It shows a range, and at point 1, you can see the strength in the candle as price pushes towards the resistance area. The next push makes the price to consolidate at the extreme. It appears to be a battle between the bulls and bears. It is also making higher lows as a part of the uptrend. Hence a breakout after this point is not surprising.

You don’t want to see the higher lows at the resistance extreme and lower highs at the support extreme.

The resistance could still work, and a reversal could happen, but this type of price action does not give much confidence for shorts. Only aggressive traders may find some entry in that consolidation, for a potential long. They can put a protective stop below the higher low that was formed before the accumulation.

We hope you find this strategy informative. Let us know if you have any questions in the comments below. Cheers!