
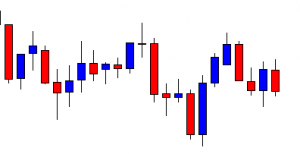
In today’s lesson, we demonstrate an example of an H4 chart and try to evaluate its price movement after breakouts. The chart shows that the price makes three breakouts altogether. The first two breakouts do not create that much momentum towards the breakout, but the last one does. We try to find out the reason behind it.

This is an H4 chart. The chart shows that the price makes a bullish move and consolidates. It seems that the price has found its support since it has already produced a bullish engulfing candle. The buyers may go long in the pair above consolidation resistance.
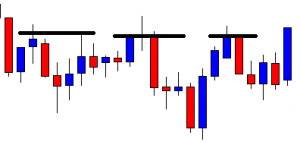
The chart shows that consolidation resistance is a strong level of resistance where the price gets rejection several times. Since it is an H4 chart, three times rejections, on the same level, means that it is a daily level of resistance. Thus, an H4 breakout may not create that much momentum all the time.
The chart shows that the price after making a breakout consolidates for a long time again. It is because of the daily resistance factor. The daily candle confirms the breakout. Thus, the price in the H4 chart consolidates. Look at the last candle. This comes out as a bullish candle breaching consolidation resistance. Let us find out what happens next.
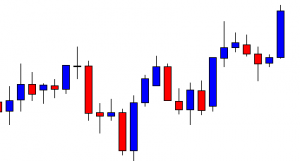
The last H4 bearish inside bar is the last candle of the day. It means the daily candle comes out as a bullish candle after the daily breakout, breakout confirmation, and daily reversal candle.
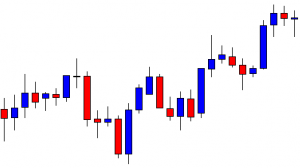
The price consolidates with one more candle to start the next trading day. A bullish reversal candle may push the price towards the North with good bullish momentum. Since the chart now belongs to the H4 traders as well.
Here it is. The chart produces a bullish engulfing candle closing well above consolidation resistance. The length of consolidation is shallow. However, the bullish reversal candle looks to be a perfect signal candle.

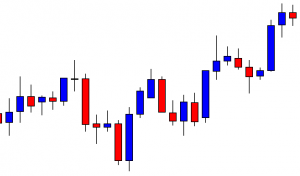
There she goes. The price heads towards the North with extreme bullish momentum. The last candle suggests that the price may continue its bullish journey. Let’s look at the last move. The price does not consolidate with enough depth, but it makes a strong bullish move. On the other hand, on the first two occasions, it consolidates well, but its breakout does not create good momentum. It is because, on the first two occasions, there is a daily resistance factor. The level of daily resistance makes the H4 traders wait for more. Once the price makes a breakout on the daily chart, it heads towards the breakout direction with good momentum. The H4 traders are to check the daily chart before taking entry. This is one more reason to check that one thoroughly.