Categories
Forex Education Forex Indicators

Differences Between Price Action and Forex Indicators

If a survey were conducted among Forex and Futures retailers and one of the questions was: “What method or system did they first use to negotiate?” Without any doubt, the vast majority of traders would say that they started with indicators such as moving averages, stochastic, MACD, Bollinger Bands, and the list would follow.

I’m very lucky to be able to talk and help traders with their trading objectives every day, and the list of methods and systems with indicators that I find are endless. You just have to look at any Forex forum to see how many of the new traders are scouring all the “Forex Systems” threads for the latest indicators, because people use new indicator systems whenever they can (not necessarily the most profitable).

The reason the indicators are so popular is that they feed into the new trader’s belief that the indicator can help predict where the price will go. In order to understand the indicators in the right way traders need to understand how the indicators are constructed and project their information. 98% of all indicators are built using old price information to make a late indicator. For example, a moving average is created using the old price to make a mobile line that traders can use in various ways.

The main problem with indicators is that they are always created after the event and traders are using previous information to guide them. In other words, they are using late information to make live trading calls.

A Dangerous Trading Mindset

The other major concern with indicators is that traders rarely stop at an indicator and that’s often where things begin to adjust to the trader mentality. A novice trader will normally have some winners with their first indicator. It doesn’t matter how many losses the trader has suffered or even if they terminate their account. What the trader tends to remember is that the first indicator helped him to make a winning transaction and above all the trader will remember that this first indicator helped to predict correctly the direction of the price. All the losses and bad thoughts have been completely relegated to one side because the trader has already moved on to what comes next and has already solved EXACTLY how it will do everything again and much more.

The trader often thinks: “If an indicator helped me to perform a winning transaction, then two indicators will surely help me to predict even better the direction of the price” and then when two do not help, three have to be even better, etc., but the problem is that, Like so many things in negotiation, this just doesn’t work out this way. Human beings in everyday life are programmed to think that anything worthwhile can’t be simple and new traders often spend a lot of time trying to make trading complicated by adding fantasy indicators for their trading thinking that the more indicators they use, the better they can predict the direction of the price, but this is the exact opposite of what traders have to do.

This mindset is a trap in which it is very easy to fall because the trader may find himself in the usual situation of adding more and more indicators like him begins to have more and more losses, with the erroneous mentality that indicators will help you predict the direction of the price. What ends up happening is that the trader, from the beginning of his trading trip, uses so many indicators in his charts that he ends up in a tremendous mess and in a state of paralysis of analysis. The trader finally ends up with many indicators in his charts, and they all tend to contradict each other and the trader can no longer operate, as he is very confused about what to do. So what does the trader have to do?

Forex Indicators

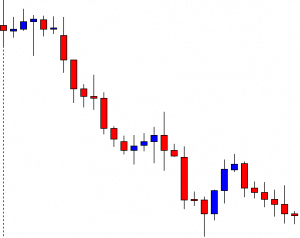
The simplest and least complicated method of negotiation in the world is the action of price. All that is needed to negotiate according to the share price is a chart of the stock of the blank price and its method of negotiation. The main difference between the indicators and the price share is that with the indicators you are using old and late price share information to try to predict the future, but with the stock price continually reading the live price as it is being printed on the chart.

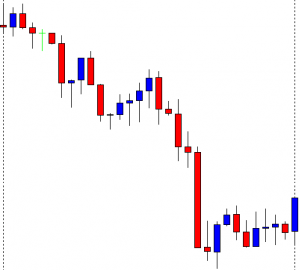
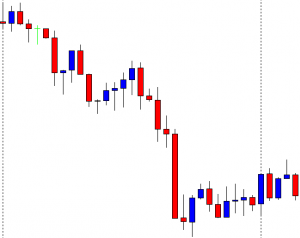
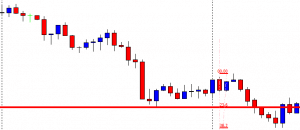
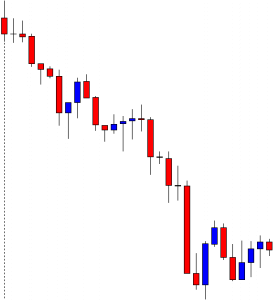
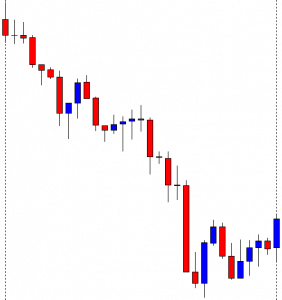
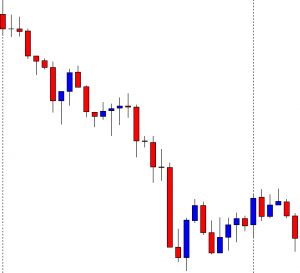
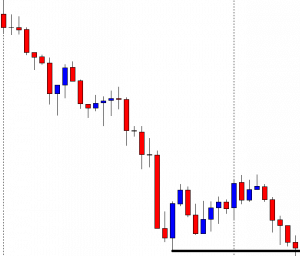
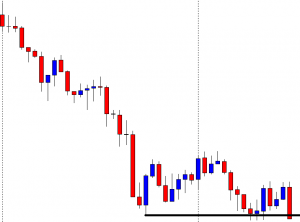
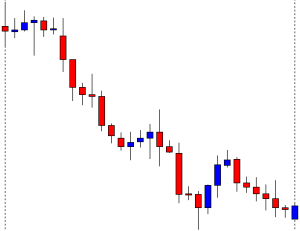
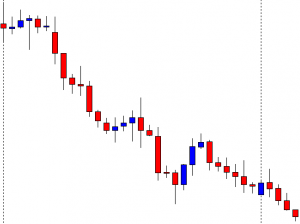
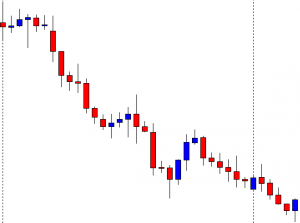
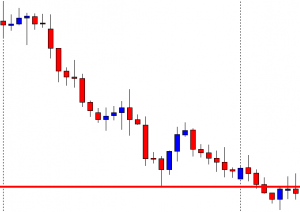
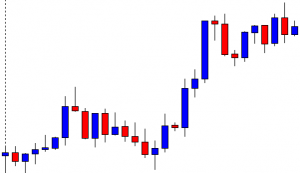
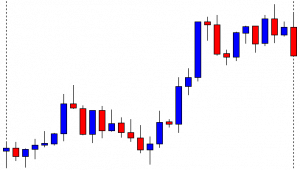
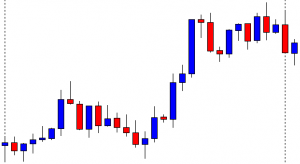
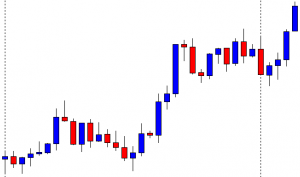
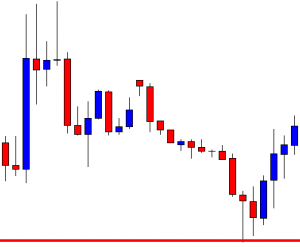
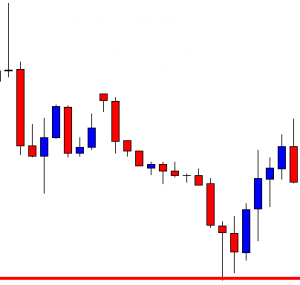
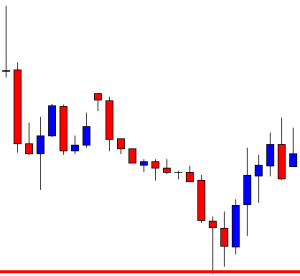
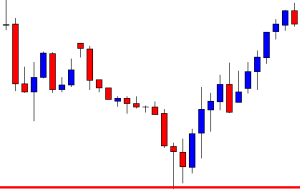
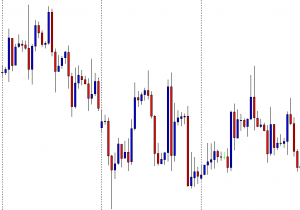
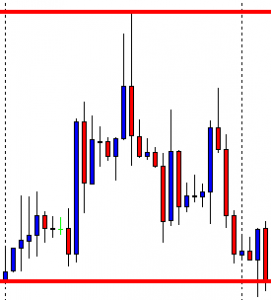
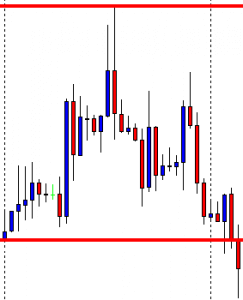
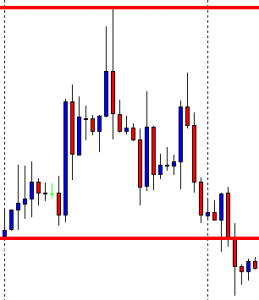
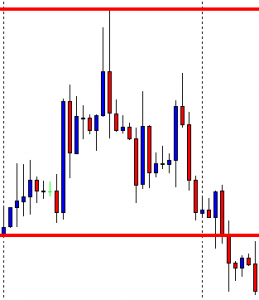
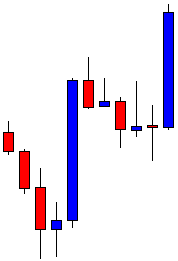
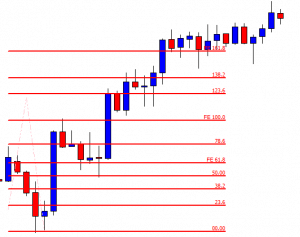
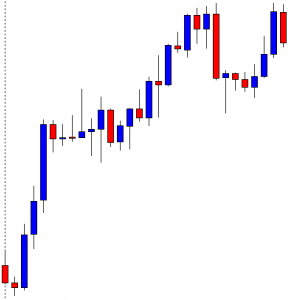
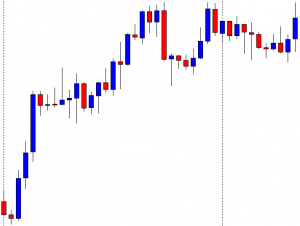
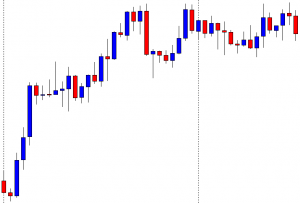
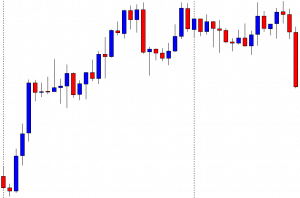
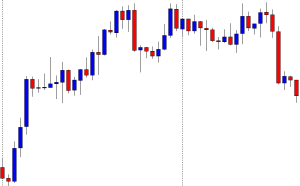
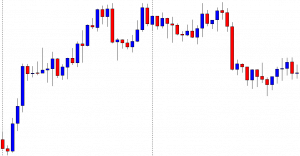
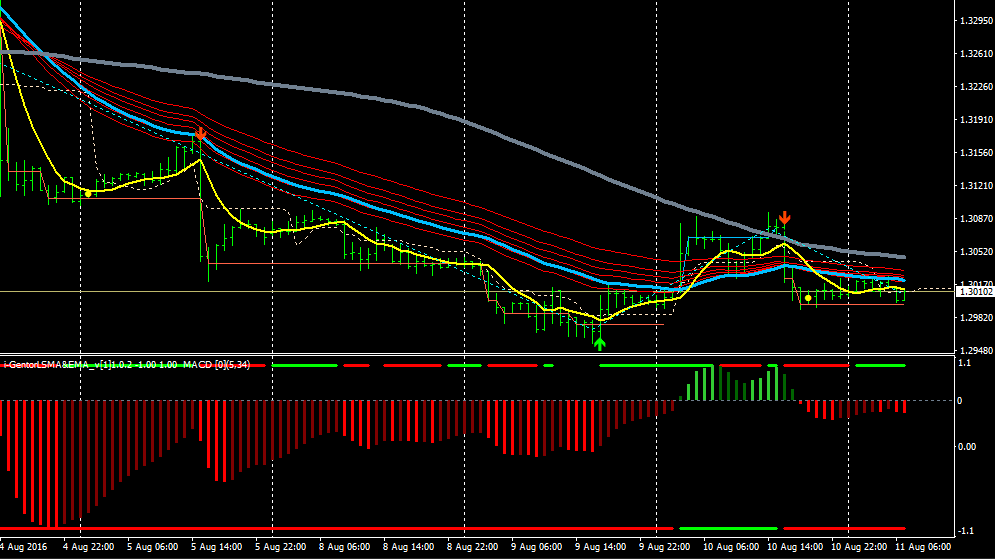
There are no indicators or external influences at all that are used to trade according to the price share. Basically trading according to the share price is the ability to read the price and make trades on any chart, on any market, in any time frame, and without the use of any indicator at all. Below are two charts, face-to-face, with the price share chart on the left side with just the raw price share and the graph full of indicators on the right.

Training and commitment are required to succeed by operating on the basis of price action as with any other method of trading or worthwhile systems, but the reason why trading with the share price is so successful, and why many professional traders use it, is because it simplifies the negotiation process and the mentality required to be profitable.

Categories
Forex Elliott Wave Forex Market Analysis

USDCHF: Examine These Three Charts Before Taking any Trade


Last week, the USDCHF pair developed a sideways movement pattern that looks like an inverted head and shoulder pattern. However, the primary mid-term trend remains dominated by bearish sentiment. Examine with us these three charts to help you foresee the pair’s potential movements in the coming sessions.

Inverted Head and Shoulder Pattern?

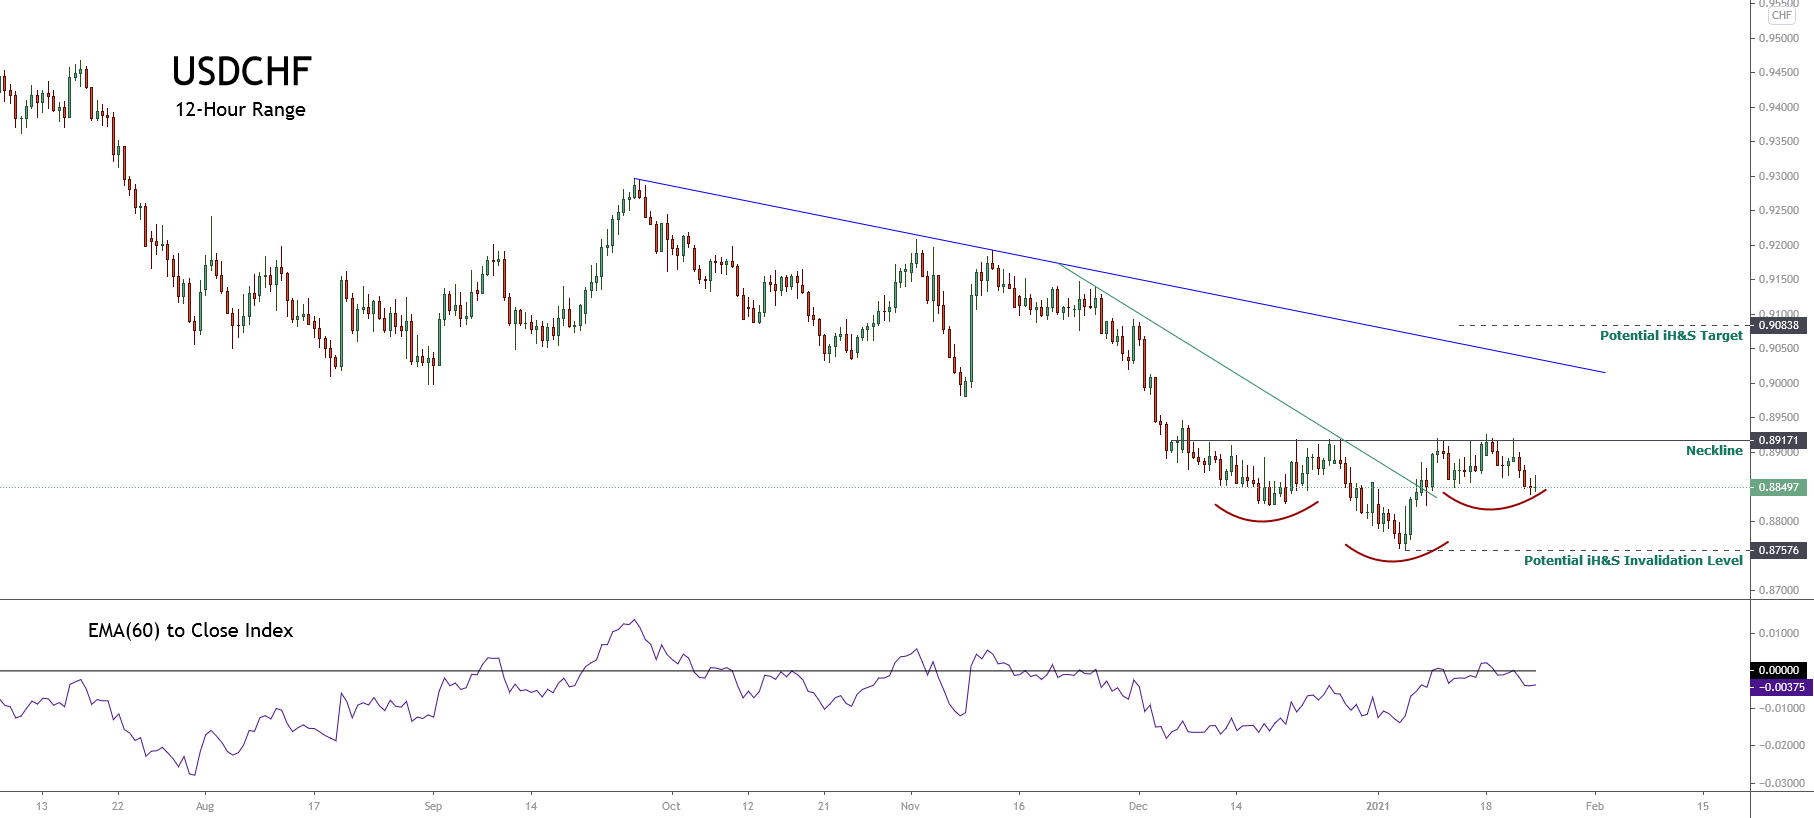
The USDCHF pair illustrated in the following 12-hour chart seems to develop a sideways formation after the accelerated decline observed during the second half of November 2020. After easing from the psychological support of 0.89, the price began to consolidate in a range between 0.8917 and 0.8757.

In the previous chart, the USDCHF seems to be forming an inverse head and shoulder (iH&S) pattern, suggesting a likely bullish reversal movement. According to chartist analysis, the iH&S formation will be confirmed if the price breaks and closes above the neckline located at 0.89171. 

For this reversal scenario, the invalidation level is located below the head, which holds its lowest level at 0.87576, corresponding to the low touched last January 06th.

Elliott Wave View Suggests Exhaustion

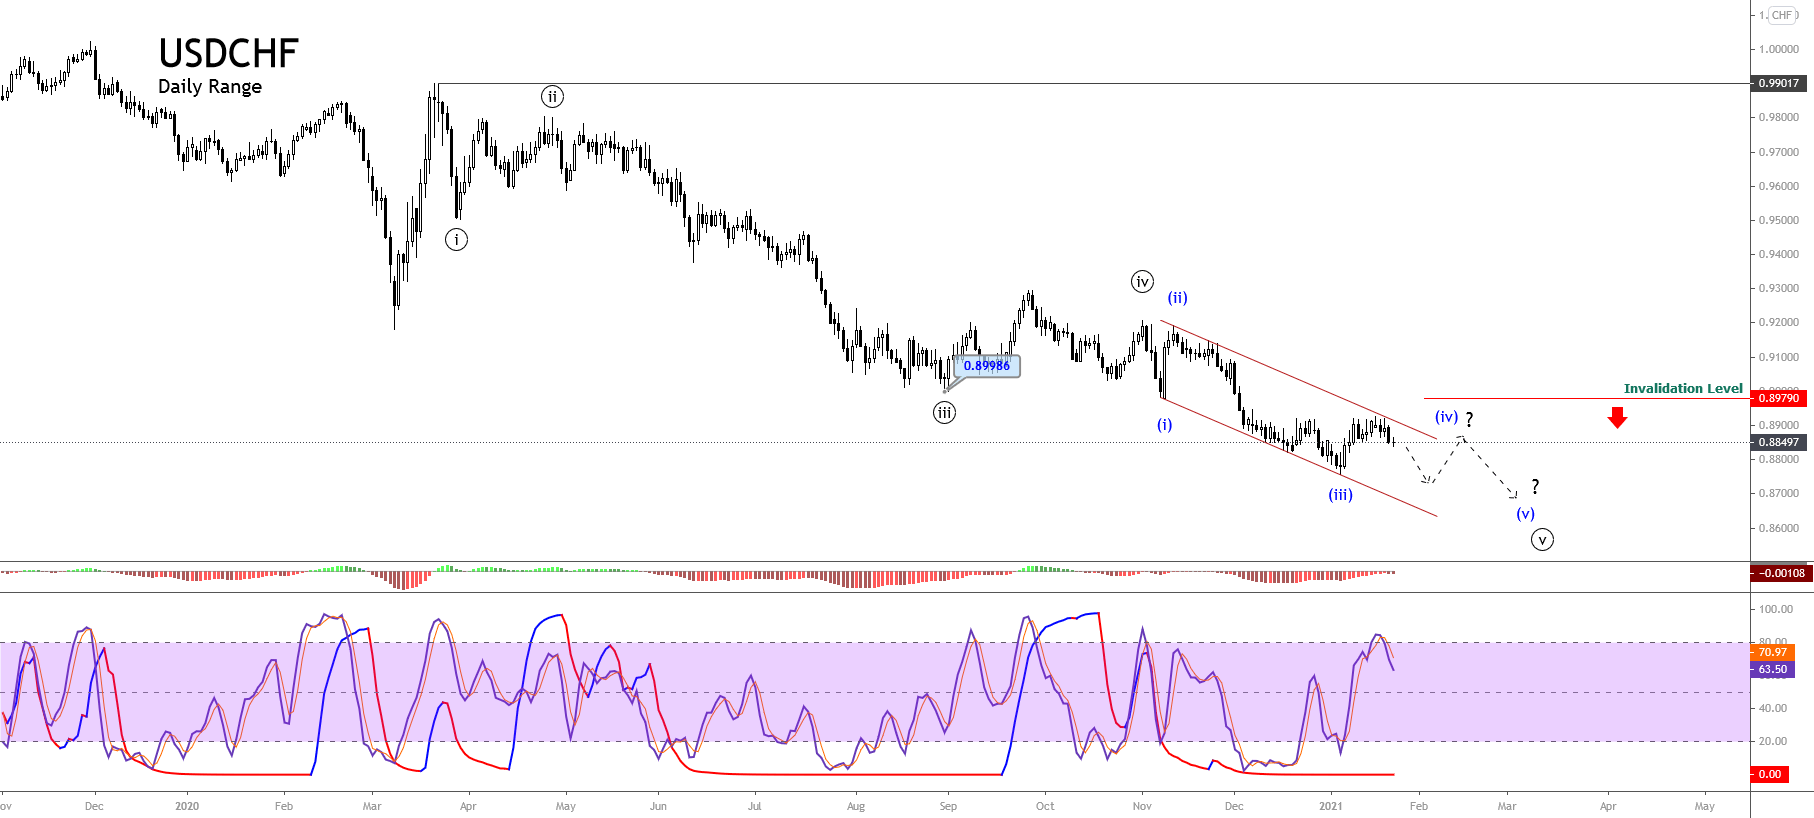
The big picture of the USDCHF pair exposed in its daily chart reveals the incomplete bearish impulsive sequence of Minute degree labeled in black, suggesting a limited decline.

As illustrated in the last chart, the USDCHF began a downward impulsive sequence of Minute degree on March 23rd when the price found fresh sellers at 0.99017. The price action reveals the completion of its third extended wave bearish move, which found support at 0.89986 in late August 2020, starting to advance mostly sideways in its wave ((iv)) in black. 

Once the sideways corrective formation corresponding to the fourth wave in black finished, the pair began to continue its declines in the wave ((v)) of Minute degree, which currently seems developing its wave (iv) of Minuette degree identified in blue. 

On the other hand, the timing and momentum oscillator reveals that the bearish pressure still controls the price action. In this context, the price would see a further decline, confirming Elliott Wave’s outlook of a pending fifth wave of Minuette degree.

This bearish continuation scenario’s invalidation level stays at 0.8979, which corresponds to the end of wave (i).

Price Action Reveals Indecision

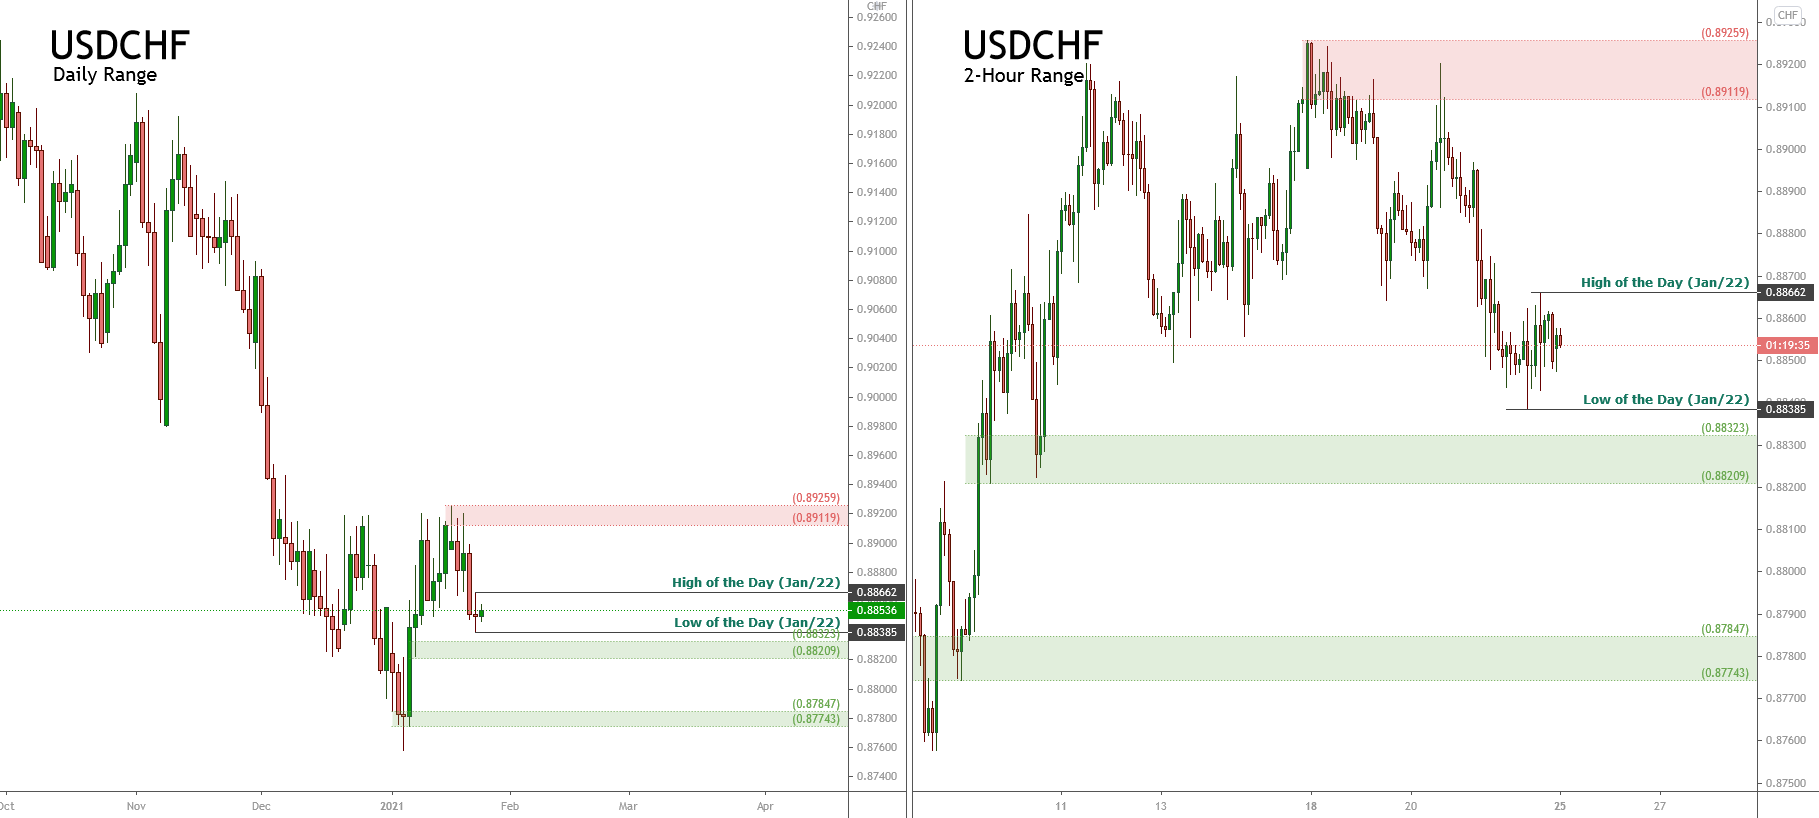
The USDCHF pair in its daily chart unfolded in the bellow chart shows an indecision candle corresponding to the last Friday’s session, leaving a narrow body and long-tailed candlestick pattern. This market context carries us to expect a pause in the downward movement developed in previous trading sessions.

The confirmation of the bearish scenario will occur if the price closes below the LOD at 0.88385. Conversely, a reversal signal could be established by a Monday 25th session’s close if it exceeds Friday’s high of 0.88662.

In summary, the USDCHF pair develops a sideways formation that looks like an incomplete inverse head and shoulders pattern suggesting the potential bullish reversal sequence if the price soars above the neckline located at 0.89171. However, the Elliott wave outlook suggests further declines, corresponding to a possible wave (v) of Minuette degree labeled in blue. In this context, the price action reveals the indecision of the next direction. If the price decides to continue its decline, the USDCHF could re-test January’s 06 low zone.

Categories
Forex Elliott Wave Forex Market Analysis

EURAUD Under Bearish Pressure, What’s ahead?

The EURAUD cross is advancing in its incomplete third wave from a mid-term downward sequence that remains in play. Follow with us on what the Elliott wave theory tells about its next movement.

Technical Overview 

The big picture of the EURAUD cross unveiled in the following 12-hour chart exposes the price action moving in the extreme bearish sentiment zone during the second week of the year. However, both the acceleration and oversold could suggest the exhaustion of the bear market.

The following 12-hour chart exposes the market participants’ sentiment, unfolded by the 90-day high and low range. The figure reveals the institutional activity pushing the cross in the extreme bearish zone and consolidating under the yearly opening price at 1.58763.

On the other hand, the EMA(60) to Close Index recently pierced the -0.0300 level. This reading suggests both the oversold and the exhaustion of its accelerated downtrend identified with the black trend-line.

In this context, the accelerated downward trend-line breakout and the close above yearly opening price should warn about potential recoveries in the EURAUD cross.

Technical Outlook

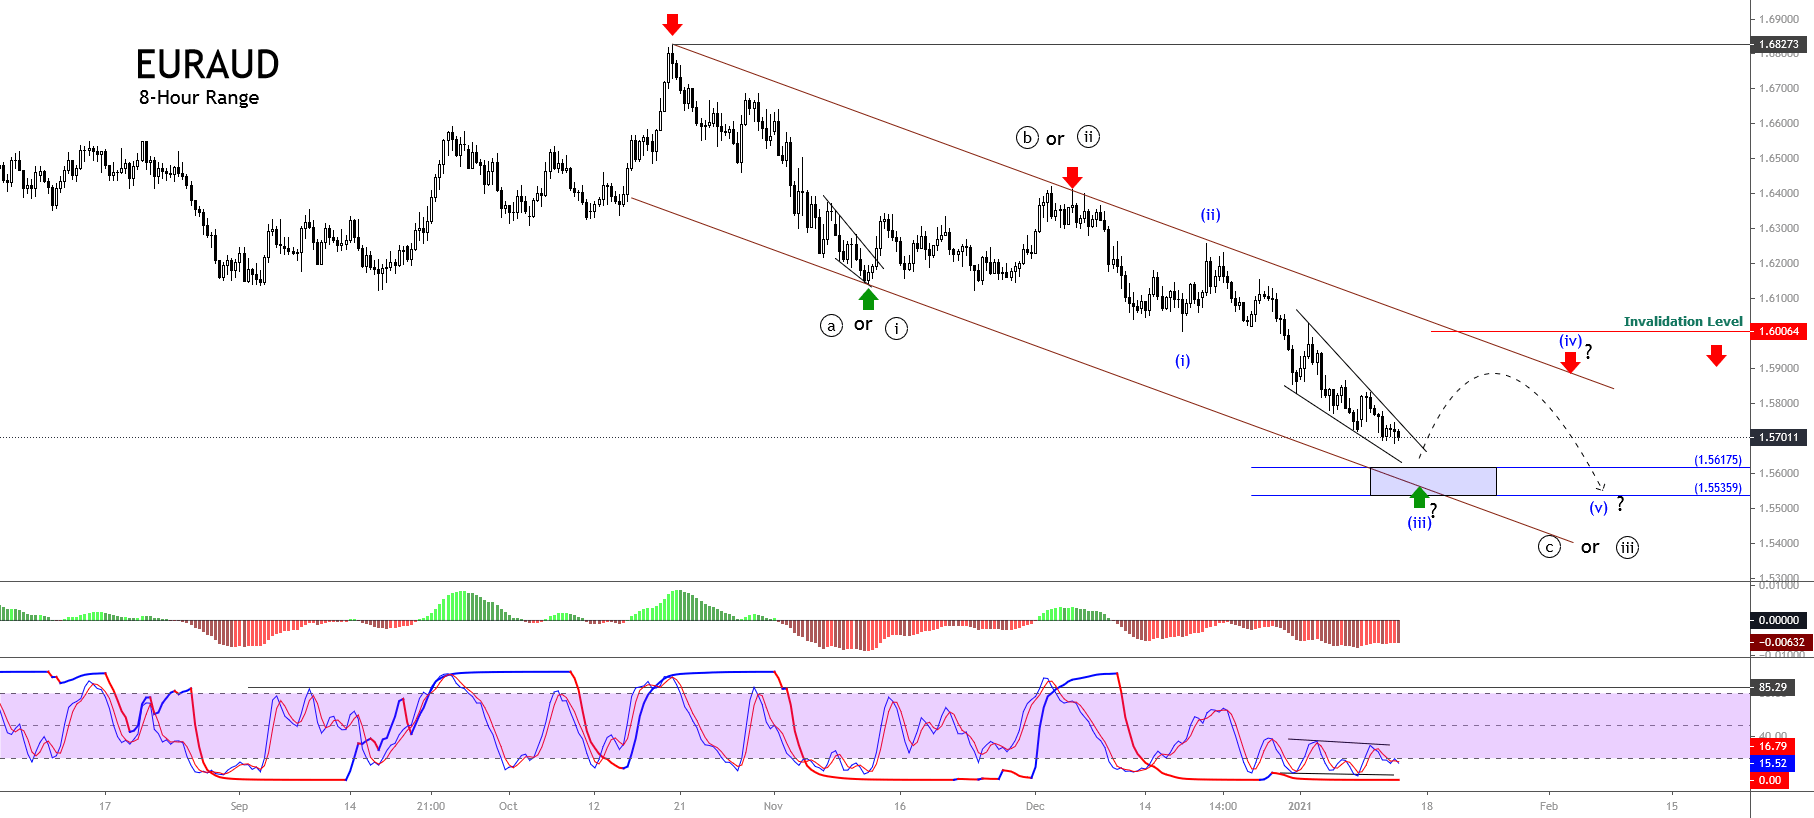
The short-term Elliott wave outlook for the EURAUD cross unfolded in the 8-hour chart reveals the progress of an incomplete bearish impulsive wave of Minuette degree labeled in blue, suggesting further drops.

The previous chart illustrates the downward sequence that began on October 20th when the cross found fresh sellers at 1.68273 and started a bearish structural series of Minute degree labeled in black, which currently could be in its wave ((c)) or ((iii)). The internal structure seems developing its wave (iii) of Minuette degree identified in blue. 

The wave (iii) potential bearish target can be found between 1.56175 and 1.55359, which coincides with the descending channel’s base-line. Once the price tests the possible target area, the market participants could carry up the EURAUD cross toward the short-term descending channel’s upper line.

Regarding the wave (iv) in blue, considering the alternation principle, as wave (ii) is a simple corrective formation in price and time, wave (iv) should be complex and should last longer than wave (ii).

On the other hand, both the trend indicator and the timing plus momentum oscillator remain, supporting the bearish bias. Each rally could represent an opportunity to add positions to the bearish side.

In summary, the EURAUD cross continues in the extreme bearish sentiment zone advancing in an incomplete downward sequence, which could find support in the potential target zone between 1.56175 and 1.55539. Once the price finds support, the cross could start to bounce toward the upper line of its short-term descending channel. Finally, the bearish scenario analyzed will be invalid if the price soars above 1.60416, corresponding to the end of wave (i) in blue.

Categories
Forex Elliott Wave Forex Market Analysis

Is US Dollar Index Ready for a Rally?

The US Dollar Index reveals exhaustion signals of its bearish trend. A trend that remains in progress since the currency basket topped at 102.992 pm mid-March 2020. Follow with us what signs show the Greenback to expect a rally during the first quarter of the year.

Technical Overview

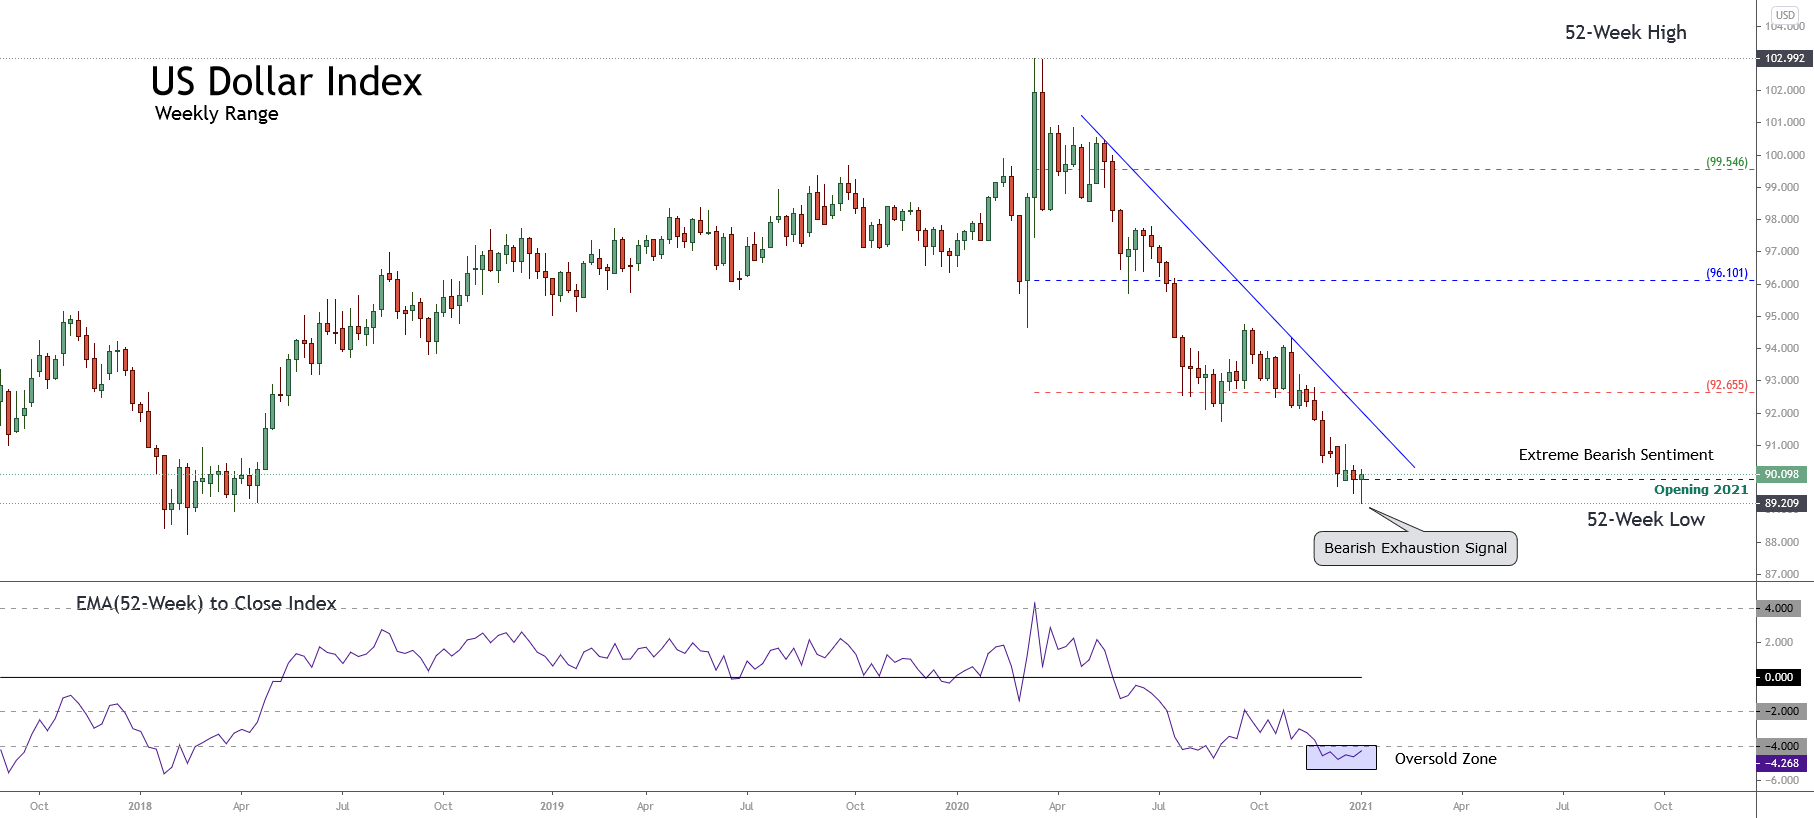
The big picture of the US Dollar Index (DXY) illustrated in the next weekly chart reveals the downtrend that remains active since the price found fresh sellers at 102.992 in mid-March 2020. The following figure also exposes the market participants’ sentiment represented by the 52-week high and low range.

The previous figure shows the extreme bearish sentiment dominating the big participants’ bias since mid-March 2020. Nevertheless, the long-tailed candlestick corresponding to the last trading week that was closed above the yearly opening, suggests the bearish trend’s exhaustion in progress.

On the other hand, the reading -4.26 observed in the EMA(52) to Close Index suggests the currency basket is oversold; thus, a potential corrective rally could occur in the coming weeks.

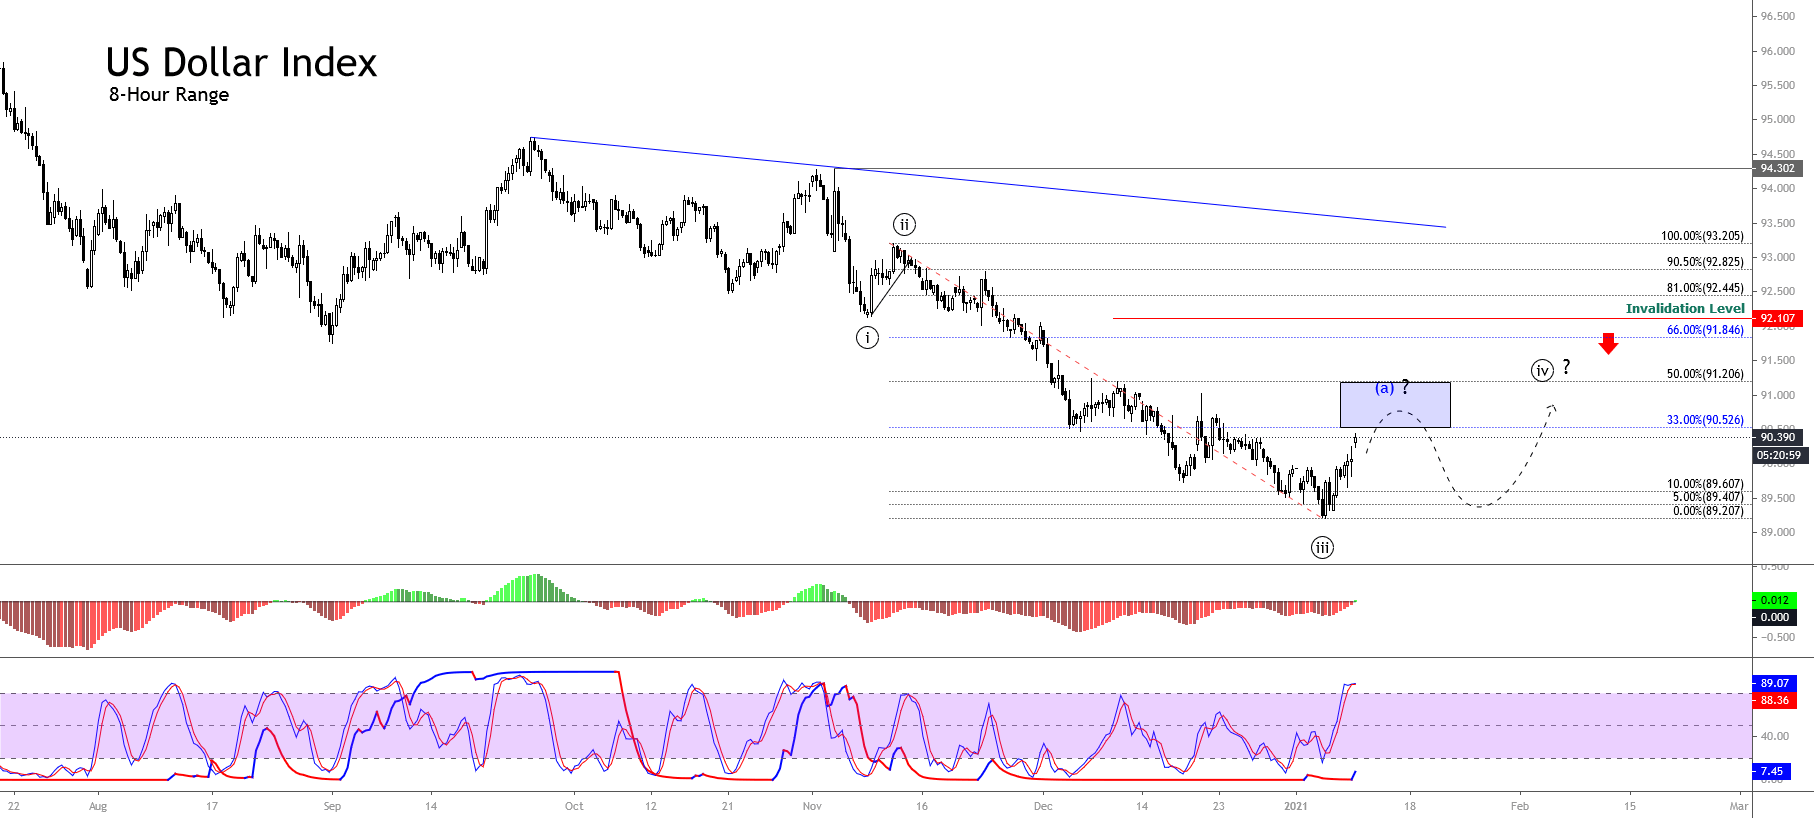
The mid-term Elliott wave view of the US Dollar Index exposed in the next 8-hour chart suggests completing an extended third wave of Minute degree labeled in black, when the price found support at 89.209 on January 06th.

Once the price found support, the price started to bounce, developing an incomplete wave (a) of Minuette degree identified in blue, which belongs to wave ((iv)) in black. Finally, the momentum and timing oscillator suggests that the bearish pressure persists, and the current upward movement could correspond to a corrective rally.

Technical Outlook

The mid-term outlook for the US Dollar Index unfolded in the next 8-hour chart shows the incomplete wave ((iv)) in black, which advances in wave (a) identified in blue. In this context, the current climb experienced by the Greenback could be a corrective rally.

According to Elliott Wave theory, the fourth wave in progress could retrace to 50% of wave ((iii)),  and reach 91.205. Likewise, considering that the second wave was a simple correction in terms of price and time, the current fourth wave should be complex in terms of price, time, or both. 

On the other hand, if the price extends beyond 50%, this could indicate weakness in the bearish pressure. If the price action advances above 92.107, the bearish scenario will be invalidated leading us to expect more upward movement.

In summary

The US Dollar Index completed a bearish third wave of Minute degree at 89.209 on January 06th, when it began to bounce, starting an upward corrective rally that remains in progress. The current intraday movement could reach 91.206 where the price could complete its wave (a) of Minuette degree labeled in blue. On the other hand, considering the alternation principle, the current corrective formation, the structure should be complex in terms of price, time, or both. Finally, the bearish scenario’s invalidation level locates at 92.107, corresponding to the end of wave ((i)) in black.

Categories
Forex Market Analysis

is EUR-USD Losing its Bullish Momentum?

EURUSD’s big picture reveals an acceleration in its uptrend, which is progressing since the second half of March when the price reached and confirmed its bottom of 1.06359. In this context, since the price saw its yearly low, the common currency is up over 15.2% to date.

Technical Overview

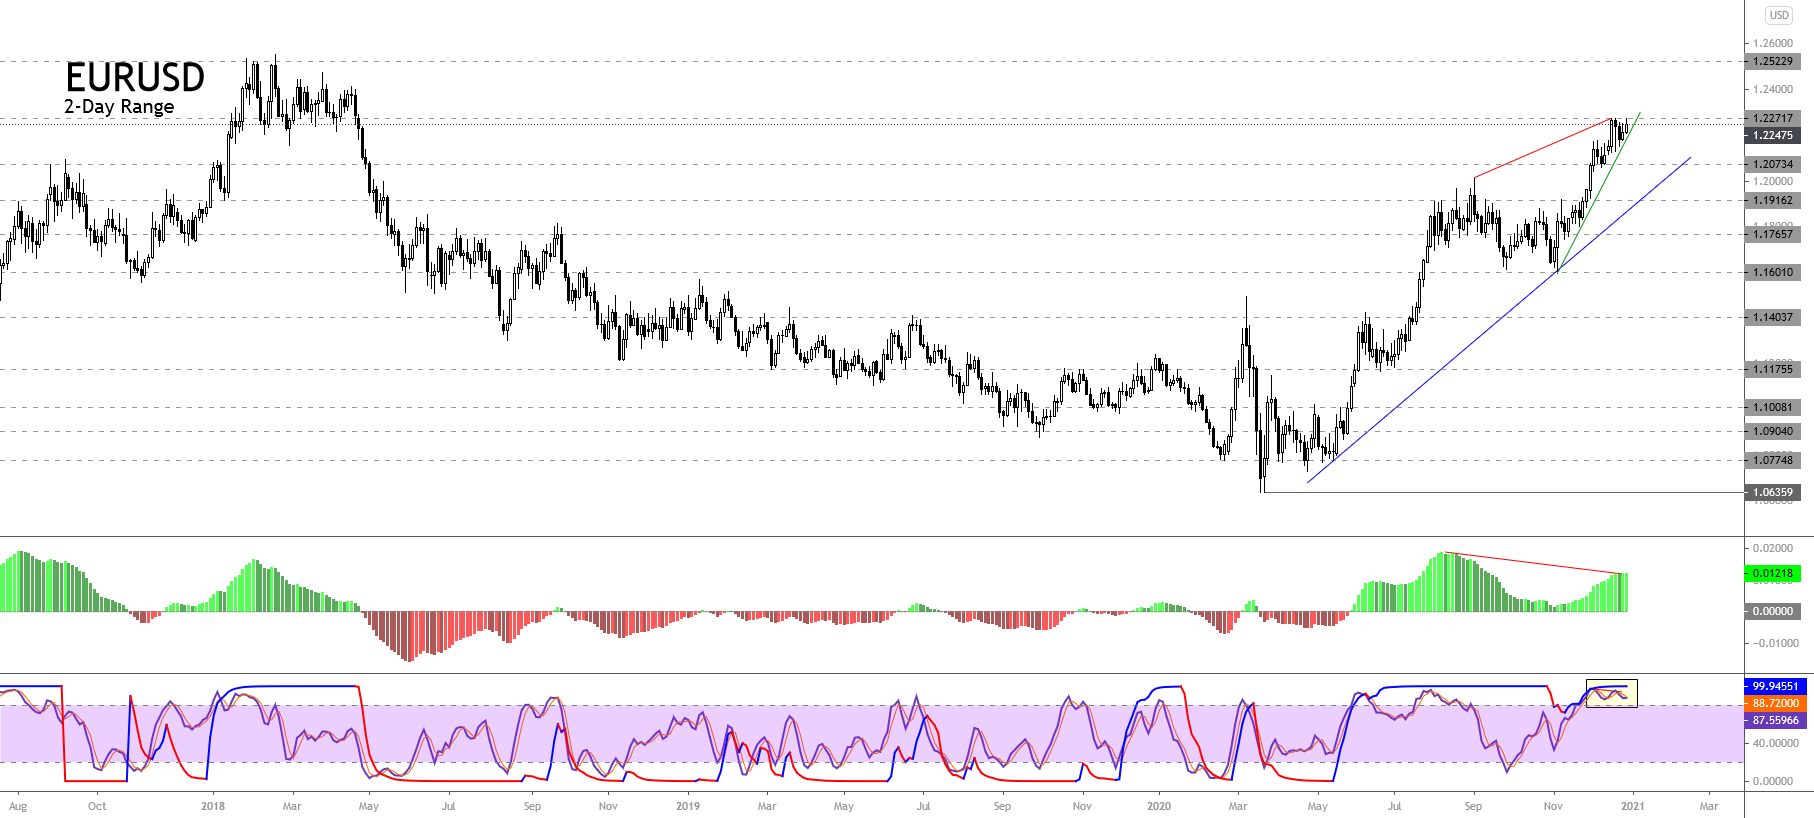
The following 2-day chart illustrates the EURUSD pair shows the primary trendline plotted in blue. We see the trend continuing its progression on the bullish side. The secondary trend identified with the green trendline reveals an acceleration of price action since early November when the common currency found support at 1.16025.

On the chart, we see that once the pair found support in early November, it began to rally, finding resistance at 1.22728 in mid-December, where the price started to consolidate until date.

On the other hand, the MACD oscillator shows a bearish divergence, which leads us to suspect the bullish trend’s exhaustion. However, the exhaustion signal doesn’t mean that the EURUSD will reverse the uptrend in progress. Moreover, the momentum and timing oscillators confirm the bullish pressure; however, the reading over level 80 (yellow box) on both indicators suggest the short-term overbought of the common currency. In this regard, the price could experience a short retracement in the following trading sessions before continuing its rally.

Technical Outlook

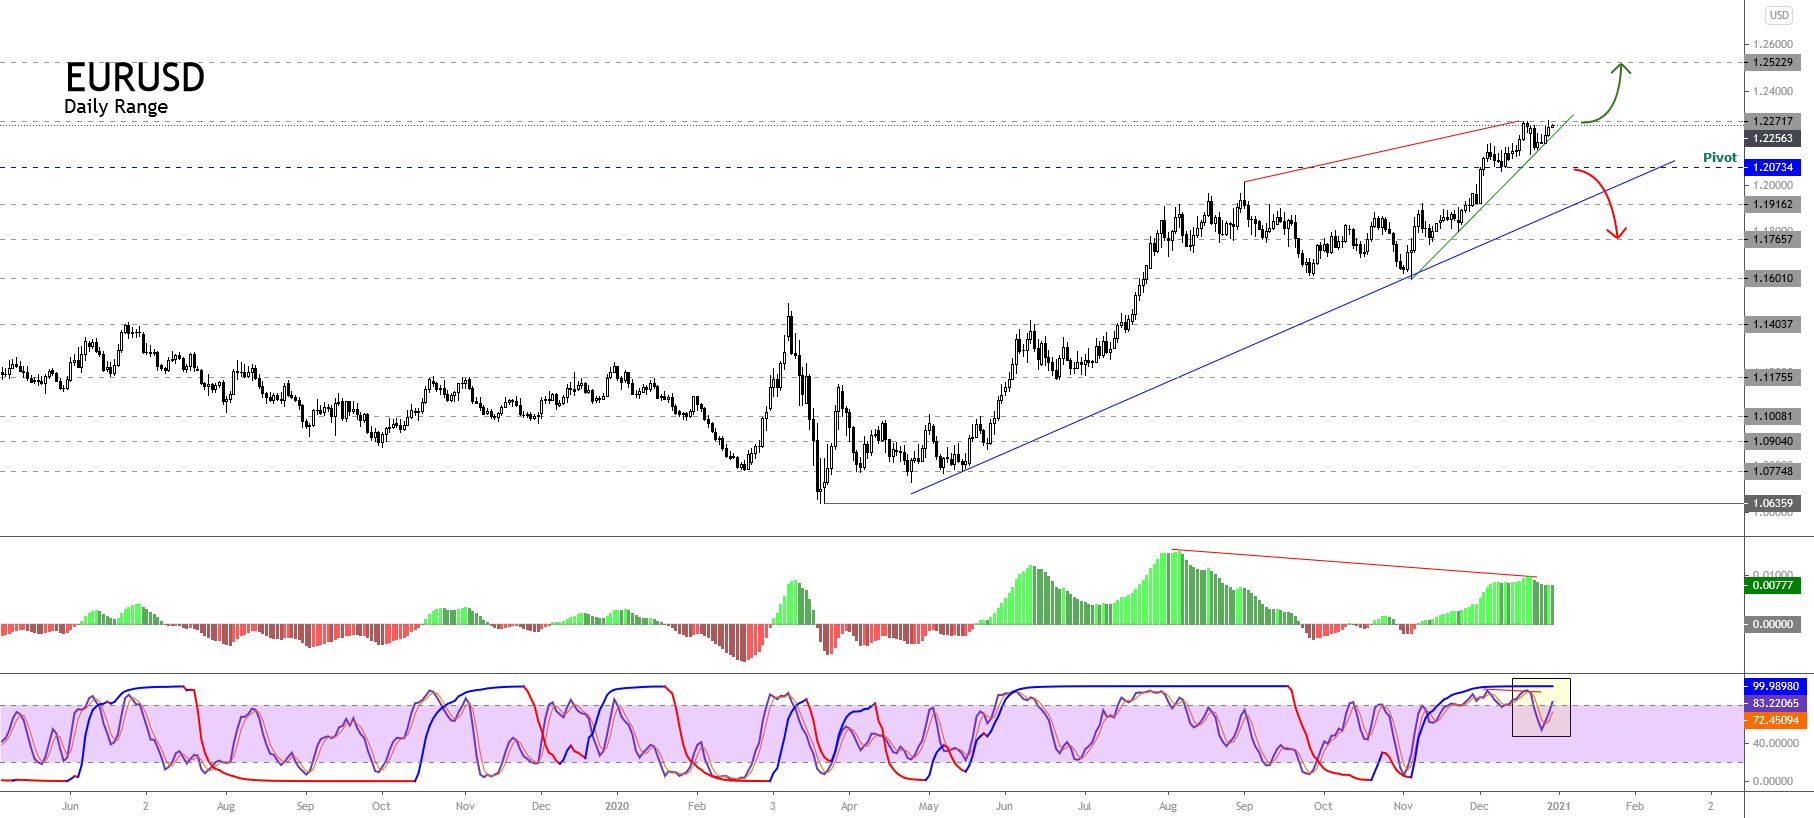
The EURUSD outlook for the coming weeks illustrated in the following daily chart shows the possibility of a limited correction, which could retrace until the next support located at about 1.20734, where the price could find fresh buyers with a potential target located in the long-term resistance of 1.25229, corresponding to the highs made in February 2018.

The bullish scenario’s confirmation will happen if the price closes above the resistance corresponding to the yearly high of 1.22717. On the other hand, if the common currency closes below 1.20734, the price could decline to the primary trend-line as dynamic support, it even could extend its decline until 1.17657.

Summarizing, the EURUSD pair continues developing a bullish trend, which currently looks consolidating the last rally that began on early November low at 1.16025. The MACD oscillator suggests exhaustion of the current bullish trend. Likewise, the momentum and timing oscillators reveal the common currency’s overbought condition, suggesting a short-term correction.

In this regard, considering that the bullish pressure persists, the price could retrace until 1.20734, where the EURUSD could find fresh buyers. However, the close above 1.22717 would confirm the upward continuation till the next long-term resistance of 1.25229. On the contrary, if the price closes below 1.20734, the common currency could extend its drops to 1.17657.

Categories
Forex Elliott Wave Forex Market Analysis

NZDUSD Could Reach a New Yearly High

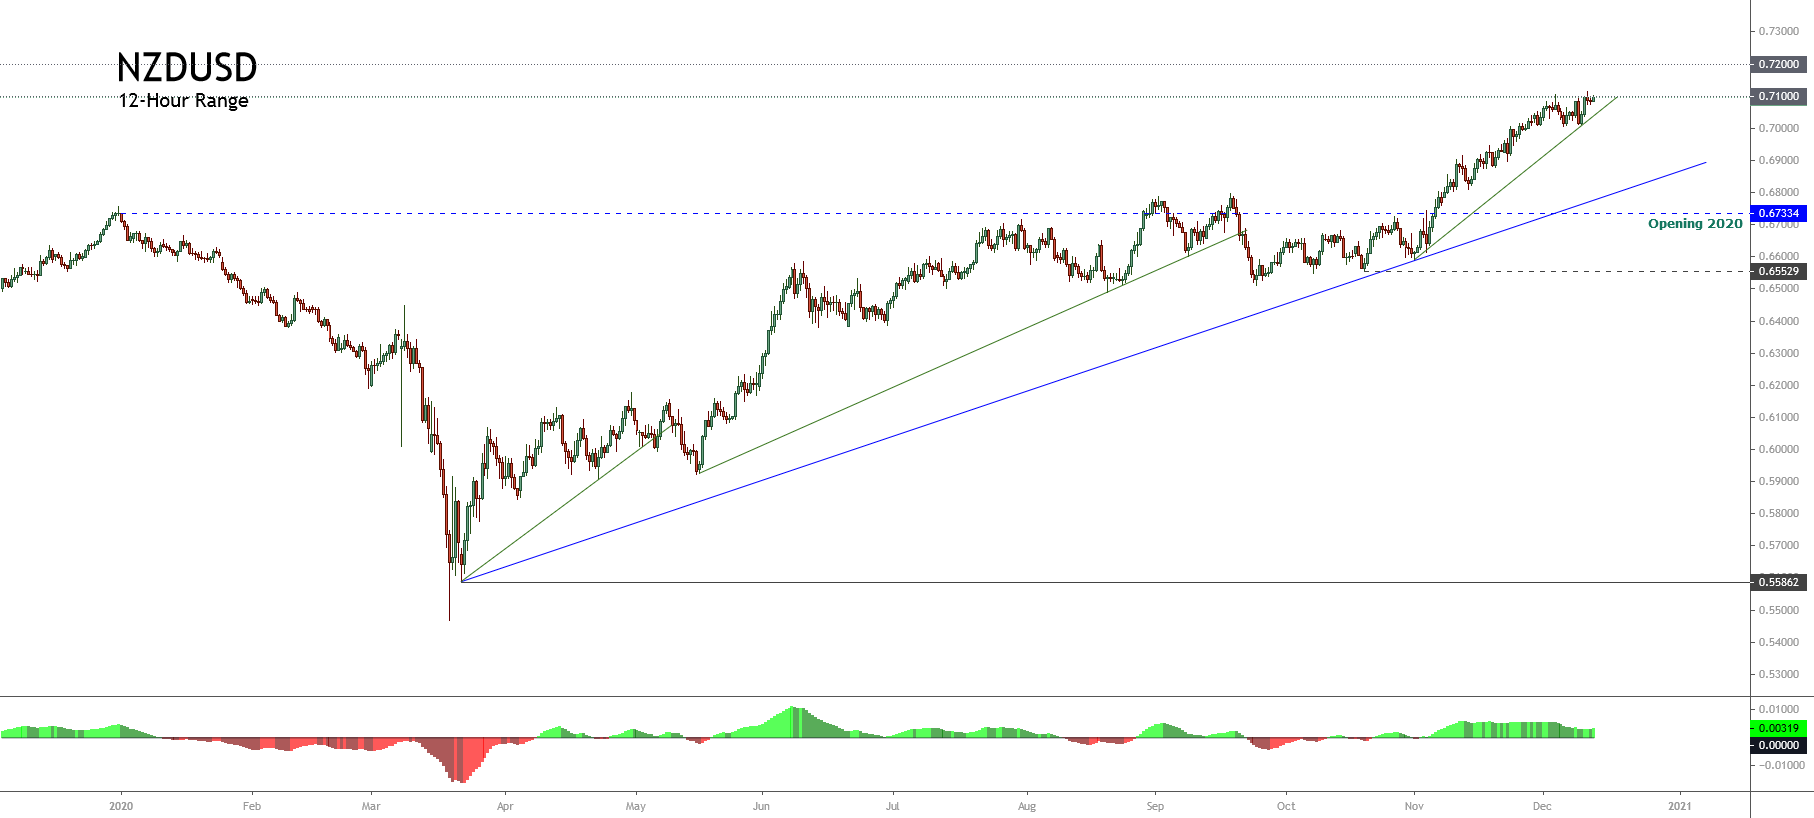
The NZDUSD pair continues extending its gains, testing the psychological barrier of 0.71, helped by the US Dollar weakness. The Oceanic currency outperforms over 5.4% during the current year. Also, the pair advances over 27% since it confirmed its bottom on March 22nd at 0.55862.

Technical Overview

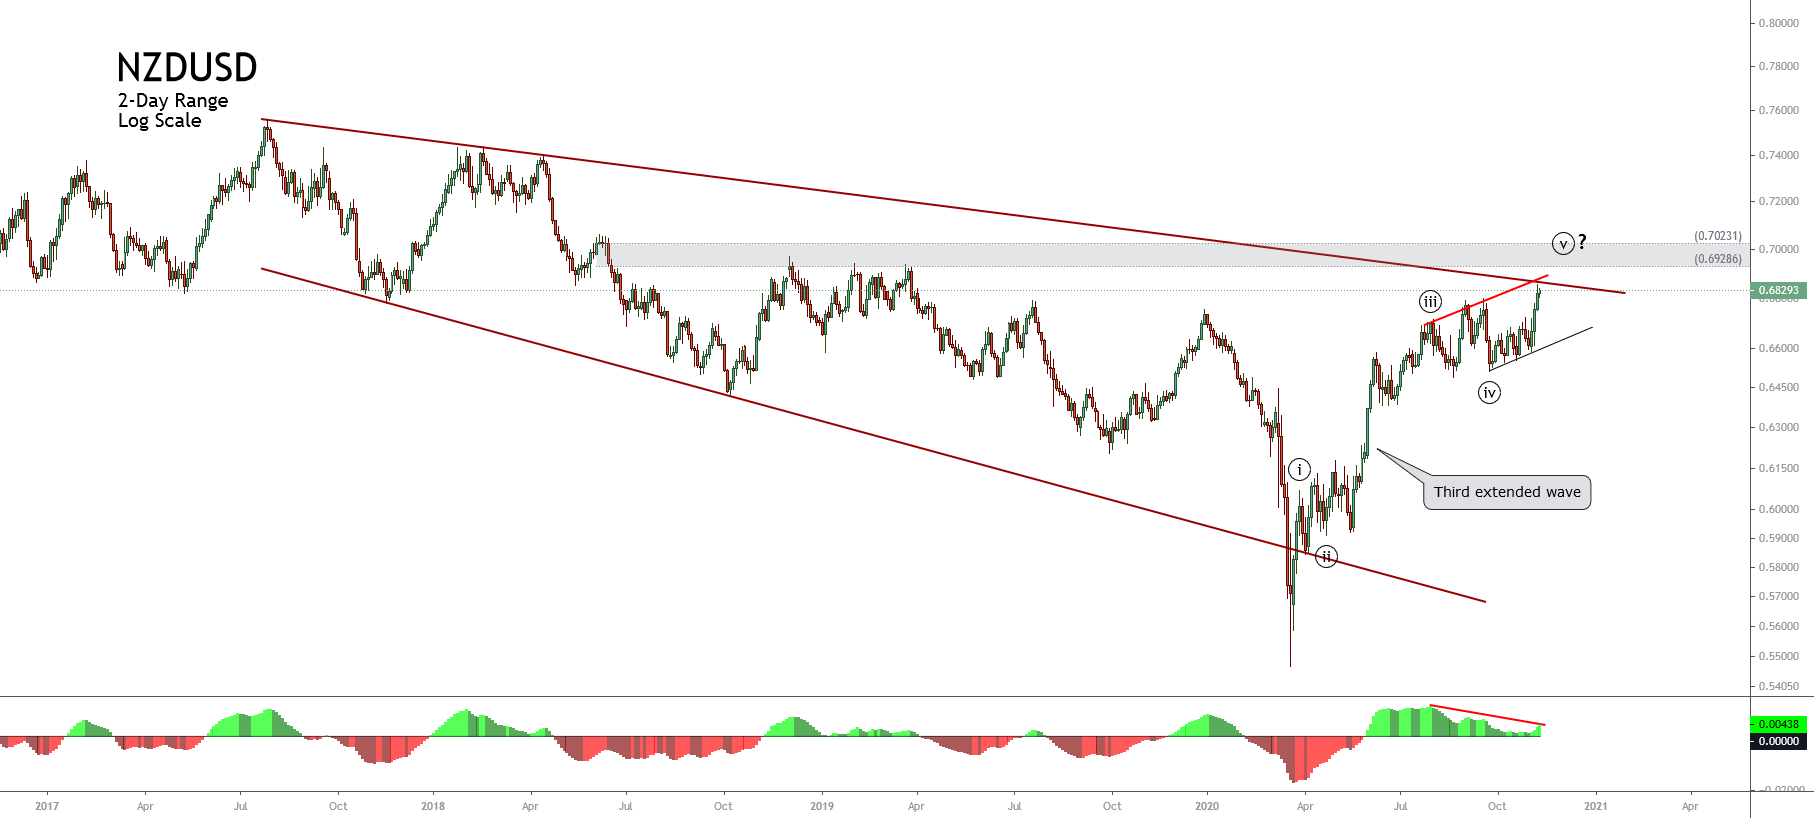
The big picture of the NZDUSD illustrated in the following 12-hour chart shows the primary upward trend, its trendline plotted in blue, intact since March 22nd when the price confirmed its bottom at 0.55862 and began the rally that remains in progress to date. Likewise, the secondary trend and its green trendline reveal the acceleration of the price testing by the third time the psychological barrier of 0.71.

Considering that the NZDUSD pair currently re-tests the 0.71 level, the price could extend its gains, reaching a new yearly high, to find resistance in the next psychological resistance of 0.72.

Short-term Technical Outlook

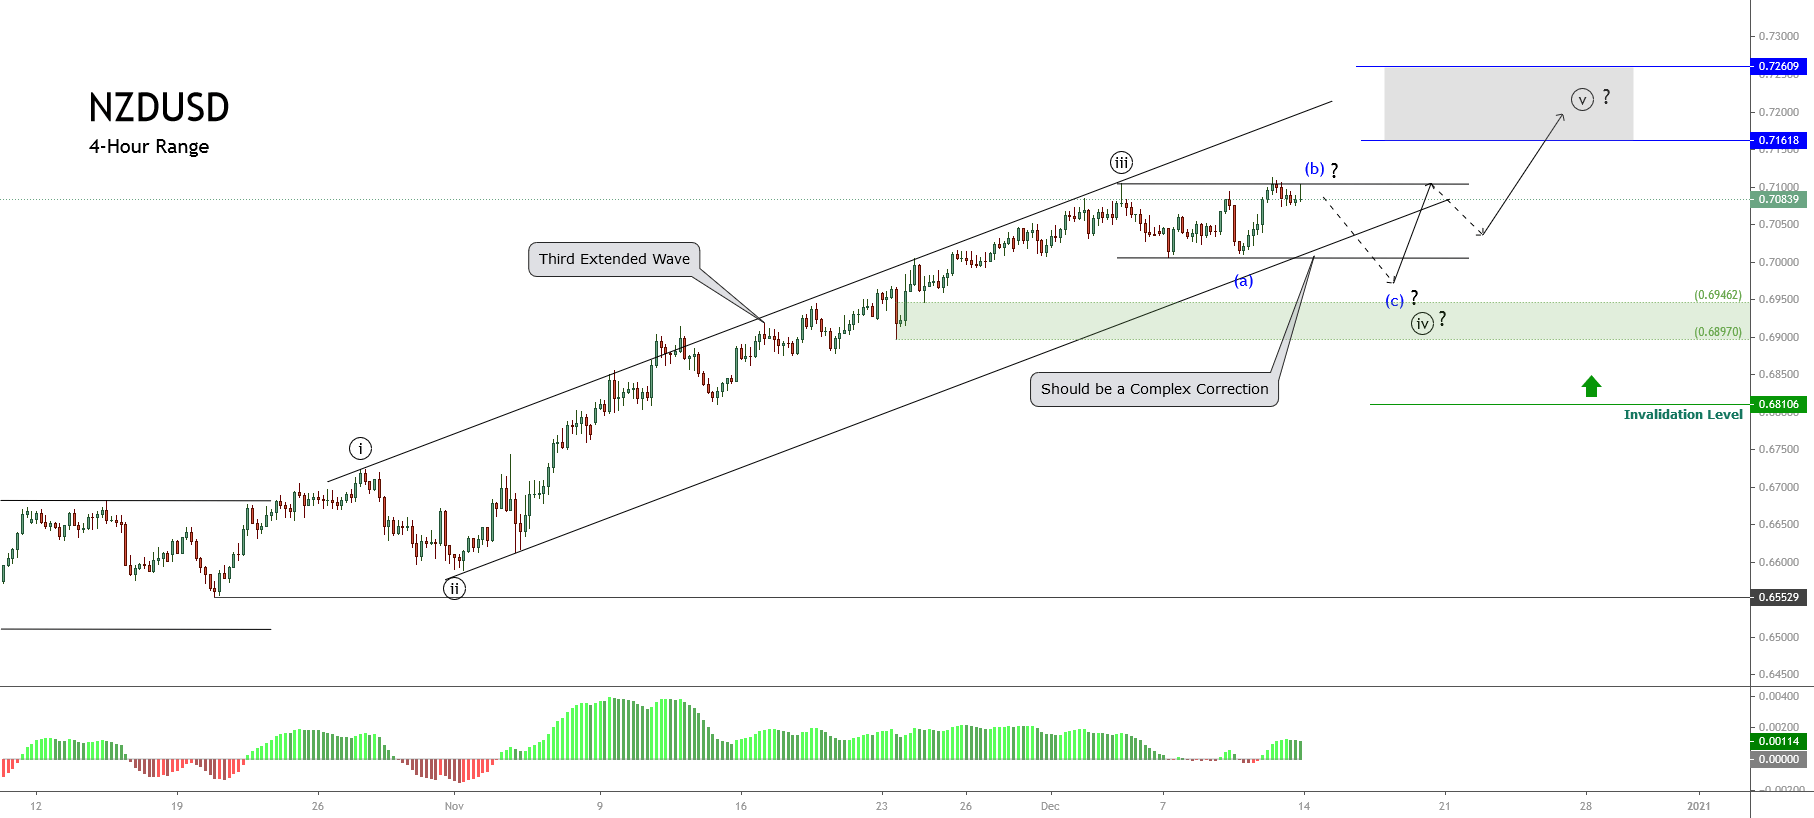
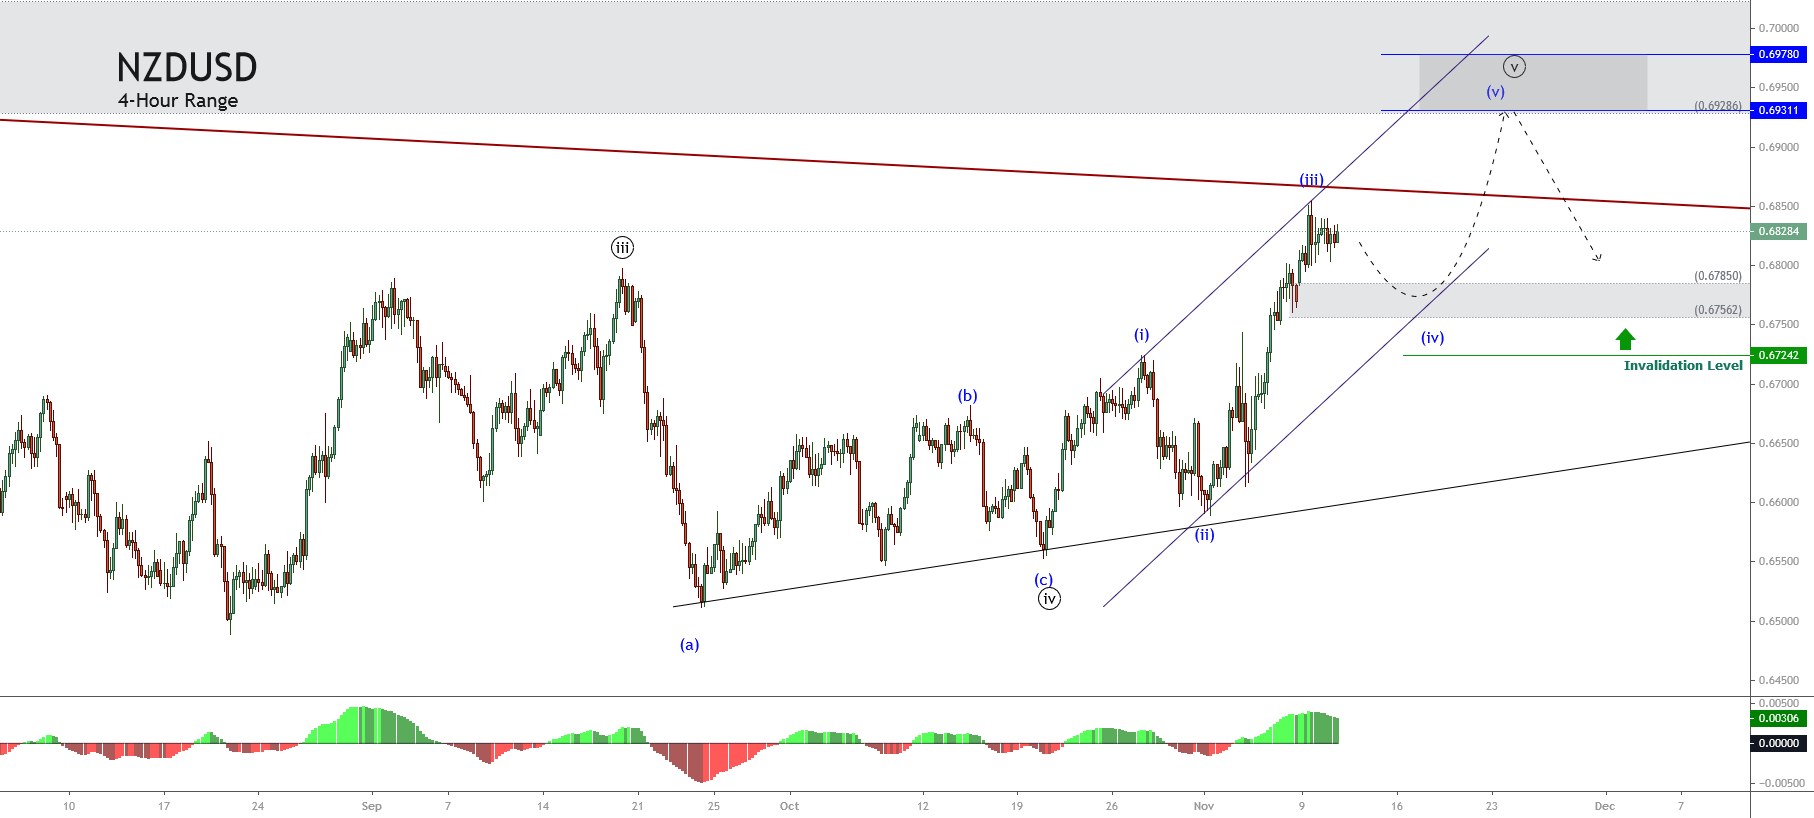
The short-term Elliott wave view for the NZDUSD pair unfolded by its 4-hour chart led us to observe an incomplete impulsive sequence of Minute degree labeled in black, which began on October 22nd price found fresh buyers at 0.65529.

The previous chart illustrates the impulsive structure that continues progressing and looks to develop its fourth wave of Minute degree labeled in black. Moreover, in the chart, we should remark that the third wave, which looks like the extended wave of the incomplete impulsive sequence identified in black, has found resistance at 0.71043 on December 03rd. 

Once the price topped the yearly high at 0.71043, the pair began to develop a sideways corrective formation, still progressing. In this regard, considering both the alternation principle stated by the Elliott Wave Theory and that wave ((ii)) in black looks like a simple corrective pattern, the current wave ((iv)) of the same degree should be complex in terms of price, time, or both.

In this scenario, the price action might retrace until the demand zone bounded between 0.69462 and 0.68970, where the Kiwi could find fresh buyers expecting to boost the pair toward a new yearly high. This high could strike the potential target zone between 0.71618 and 0.7260.

In summary, the short-term Elliott wave perspective for the NZDUSD pair reveals the advance in a bullish trend that currently moves mostly sideways in an incomplete corrective formation. The fourth wave in progress could find support in the demand zone bounded between 0.69462 and 0.68970. Likewise, fresh buyers could boost the price toward 0.71618 and extend its gains until 0.7260. Finally, the invalidation level of the current bullish scenario is located at 0.68106.

Categories
Forex Elliott Wave Forex Technical Analysis

EURGBP Soars!, More Gains Ahead?

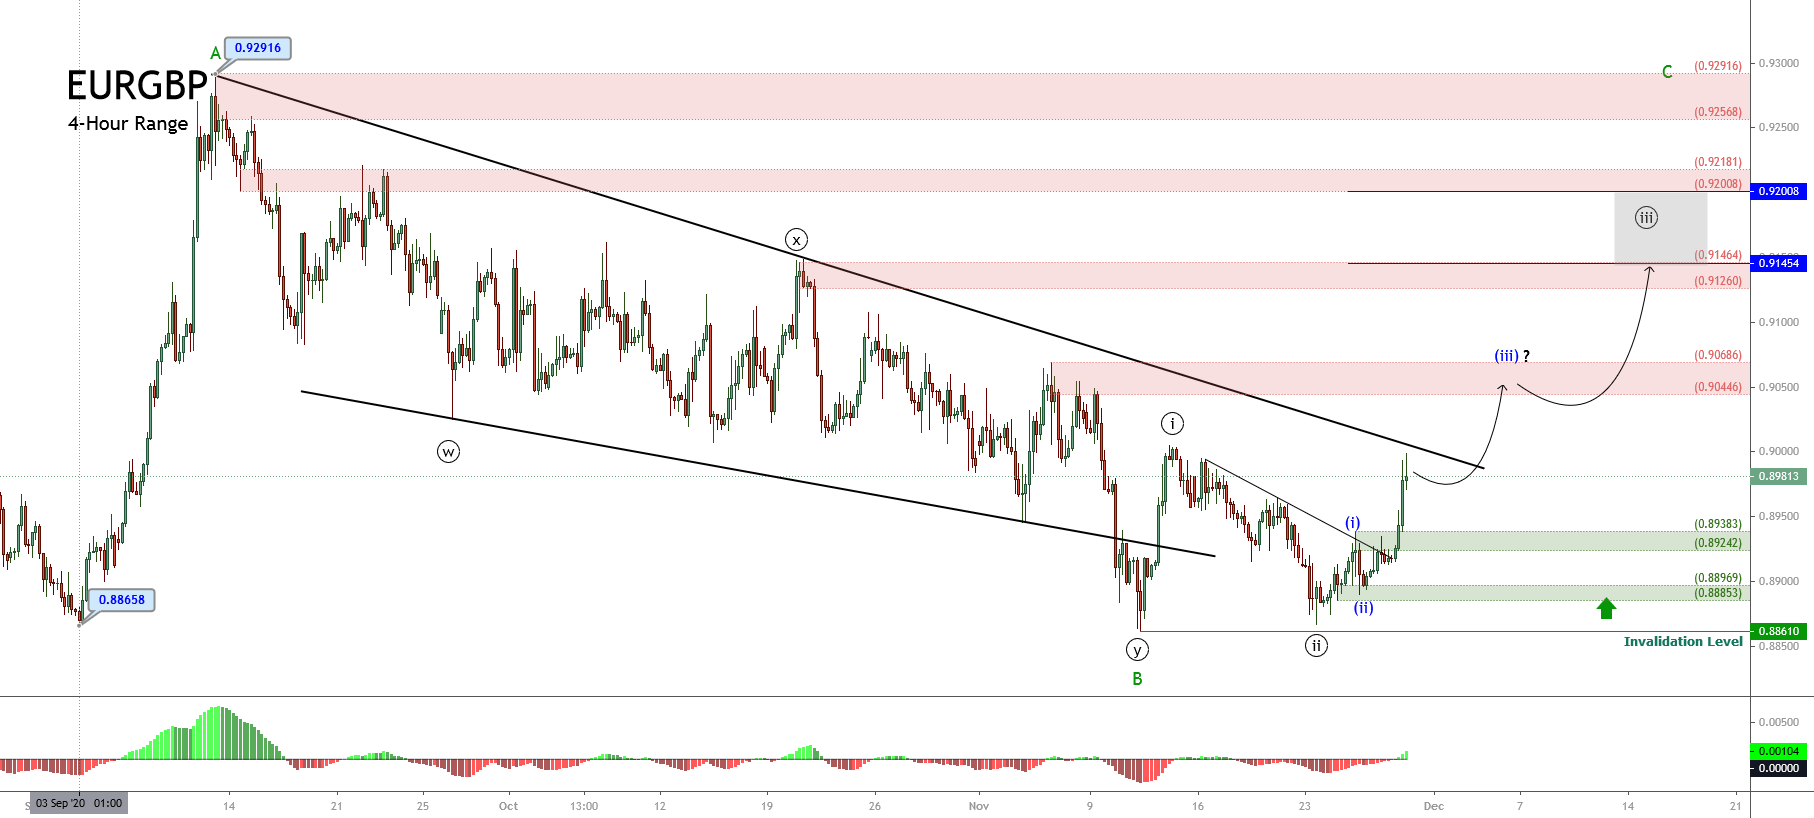
The EURGBP cross soared on Friday session, surpassing the psychological 0.92 barrier, advancing until the target area forecasted in our previous short-term analysis (here.)

Technical Overview

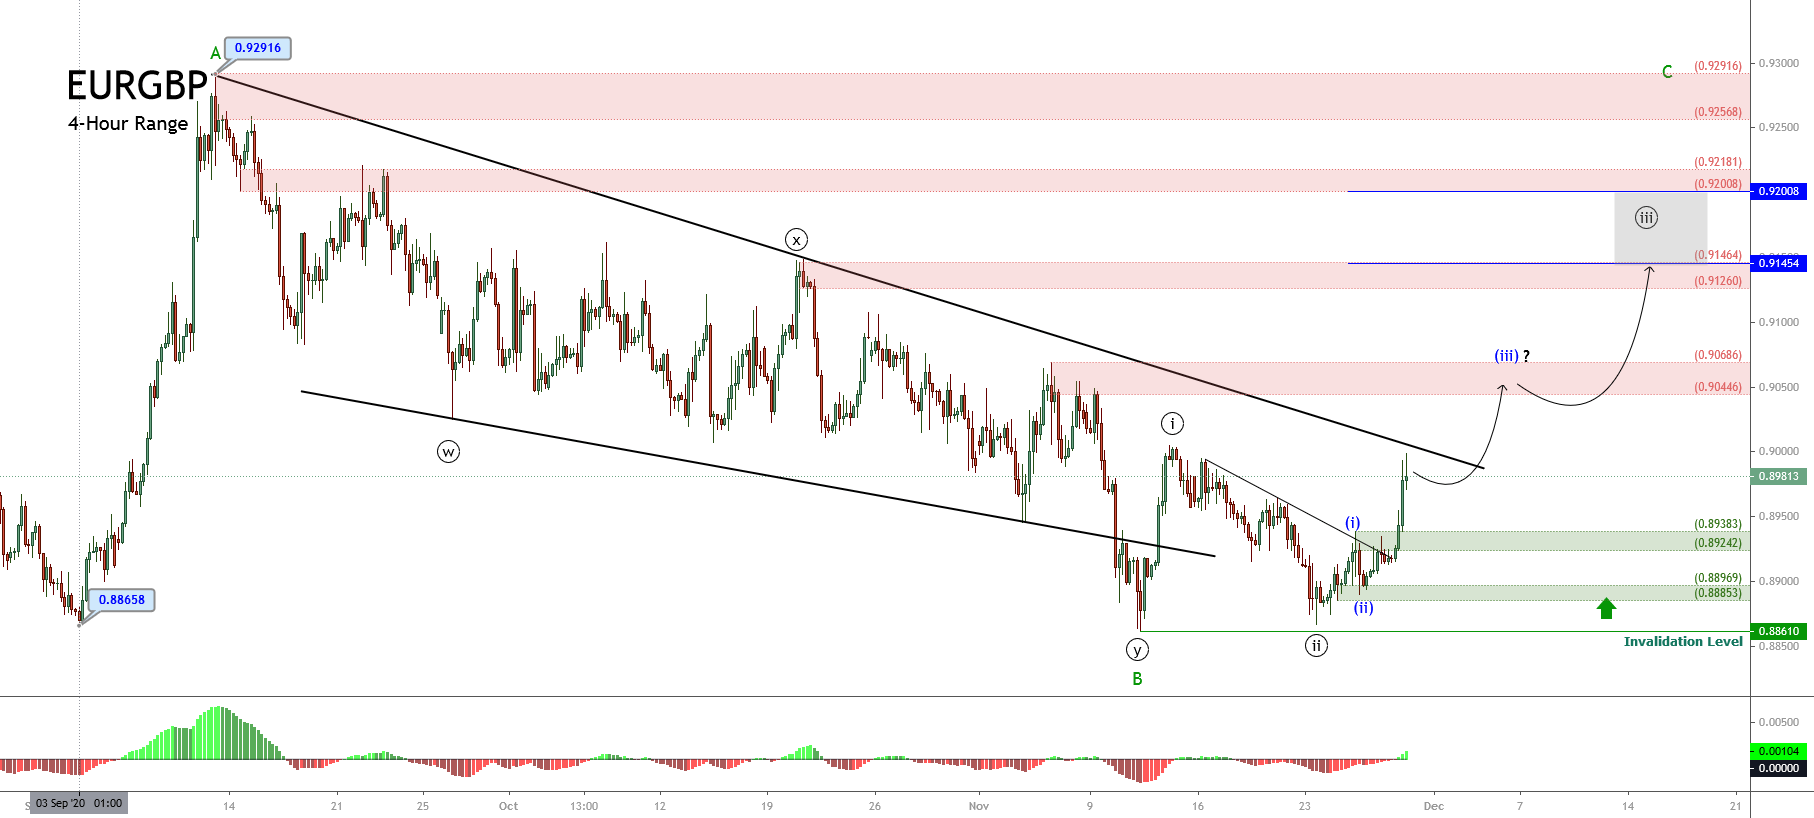
Our previous analysis discussed the completion of the complex corrective formation identified as a double-three pattern of Minute degree labeled in black, which began on last September 11th at 0.92916 and finished on November 11th at 0.88610. Likewise, after the double-three completion, the cross completed the wave B of Minor degree identified in green.

Once the EURGBP found the bottom at 0.88610, the cross began a rally corresponding to wave C. We have seen in our previous analysis the price completed wave ((ii)) at 0.88667 on November 23rd. After this completion, both the breakout of the descending trendline of the second wave in black and the strong bullish long-body candlestick formation developed in the November 27th session confirmed the start of the third wave in black.

Technical Outlook

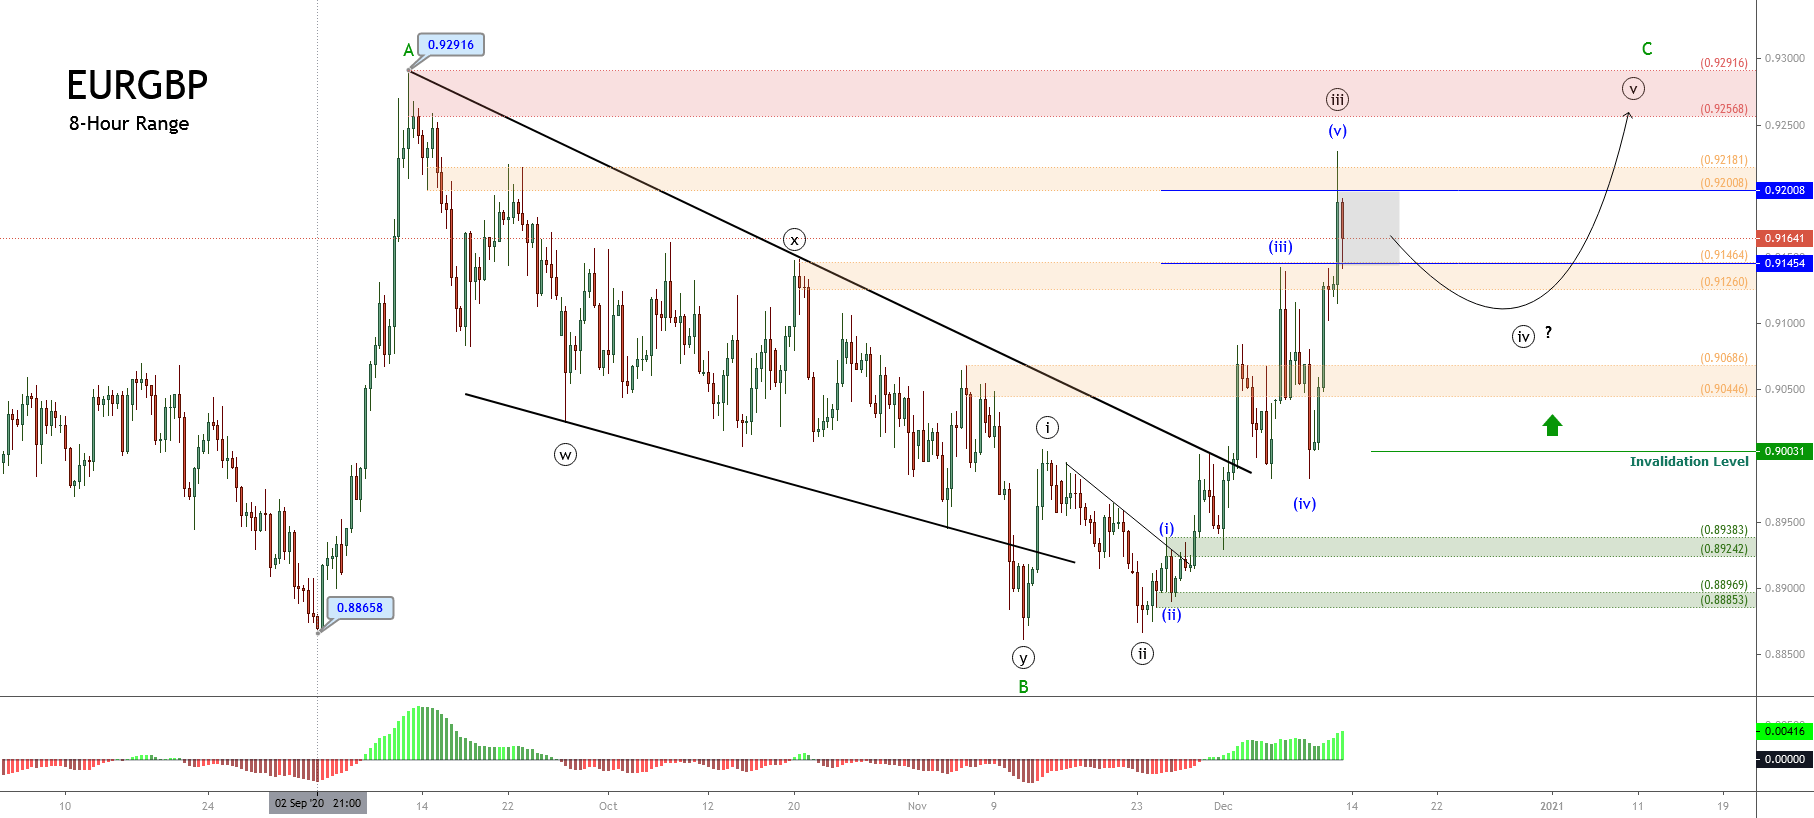
During the last trading session of the week, the short-term Elliott wave view for the EURGBP cross exposed in the following 8-hour chart reveals the acceleration in its advance, which surpassed the supply zone between 0.92008 and 0.92181, finding resistance at 0.92298.

The impulsive upward movement observed during Friday’s session allows us to distinguish the completion of the wave ((iii)) at 0.92298 and the beginning of the fourth wave of the same degree.

In this context, the current corrective formation identified as wave ((iv)) in black could decline until the previous supply zone between 0.90686 and 0.90446, where the cross could find fresh buyers. Once the fourth wave completes, the cross should advance in a new rally corresponding to wave ((v)), which would be subdivided into a five-wave sequence. The potential target for the end of wave C is within the next supply zone between 0.92568 and 0.92916.

In summary, the EURGBP cross appears moving in an incomplete wave C of Minor degree, which, in its lesser degree count, shows the beginning of the fourth wave in black. This corrective formation could decline until the previous supply zone is located between 0.90446 and 0.90686. The cross, then, could find fresh buyers expecting the continuation of the trend that would push up the price toward the supply zone between 0.92568 and 0.92916.

Lastly, the invalidation level for this bullish scenario can be found at 0.90031.

Categories
Forex Elliott Wave Forex Market Analysis

EURNZD Consolidates after Bouncing from its Recent Lows

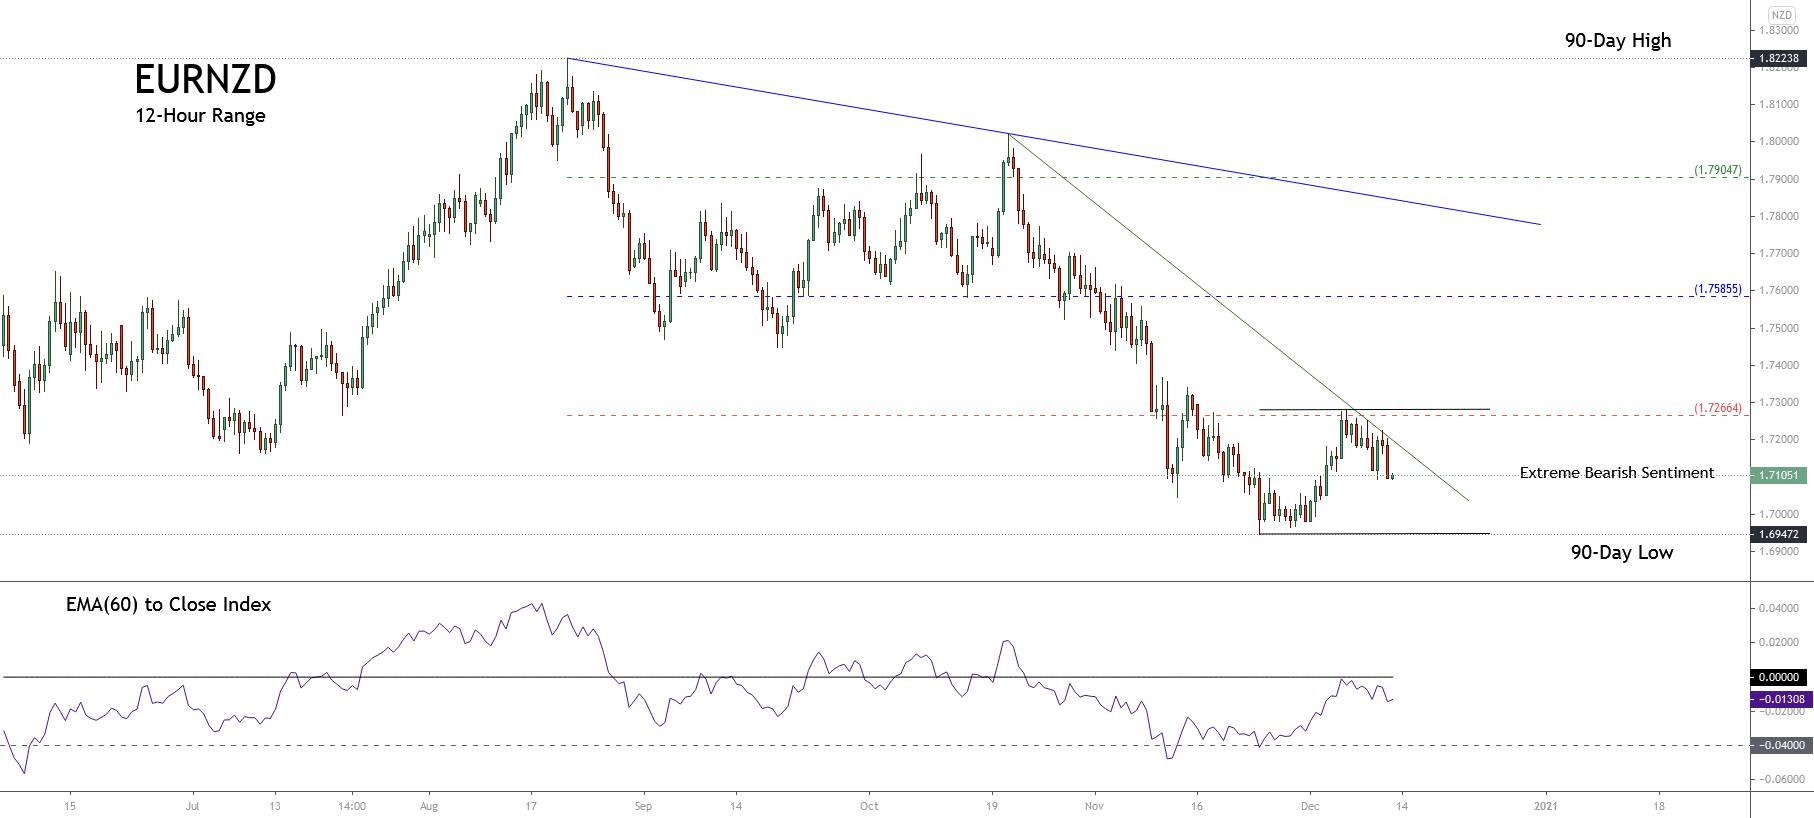
The EURNZD cross is seen consolidating near the extreme bearish sentiment zone backed by the strength of the New Zealand dollar. This consolidation suggests a pause of the downward sequence that began on August 20th and ended heavily oversold after its latest decline that drove it to 1.69472.

Technical Overview

The following 12-hour chart illustrates the short-term markets participants’ sentiment bounded by the 90 high and low range, which shows the price consolidating in the extreme bearish sentiment zone after the cross found support on 1.69472 on November 24th.

Furthermore, the previous chart shows the primary trend outlined a blue trend-line that tells the bias remains mostly bearish. Likewise, the secondary trend represented with the green trend-line exposes the downward acceleration, and, shows also its consolidation range between the levels of 1.69472 and 1.72664.

Finally, as long as the EURNZD cross keeps moving below level 1.72664, the bias will remain bearish, so we could expect further drops, likely below 1.69472. Whereas, the breakout of the extreme bearish zone of 1.72664 to the upside could indicate the start of a recovery.

Short-term Technical Outlook

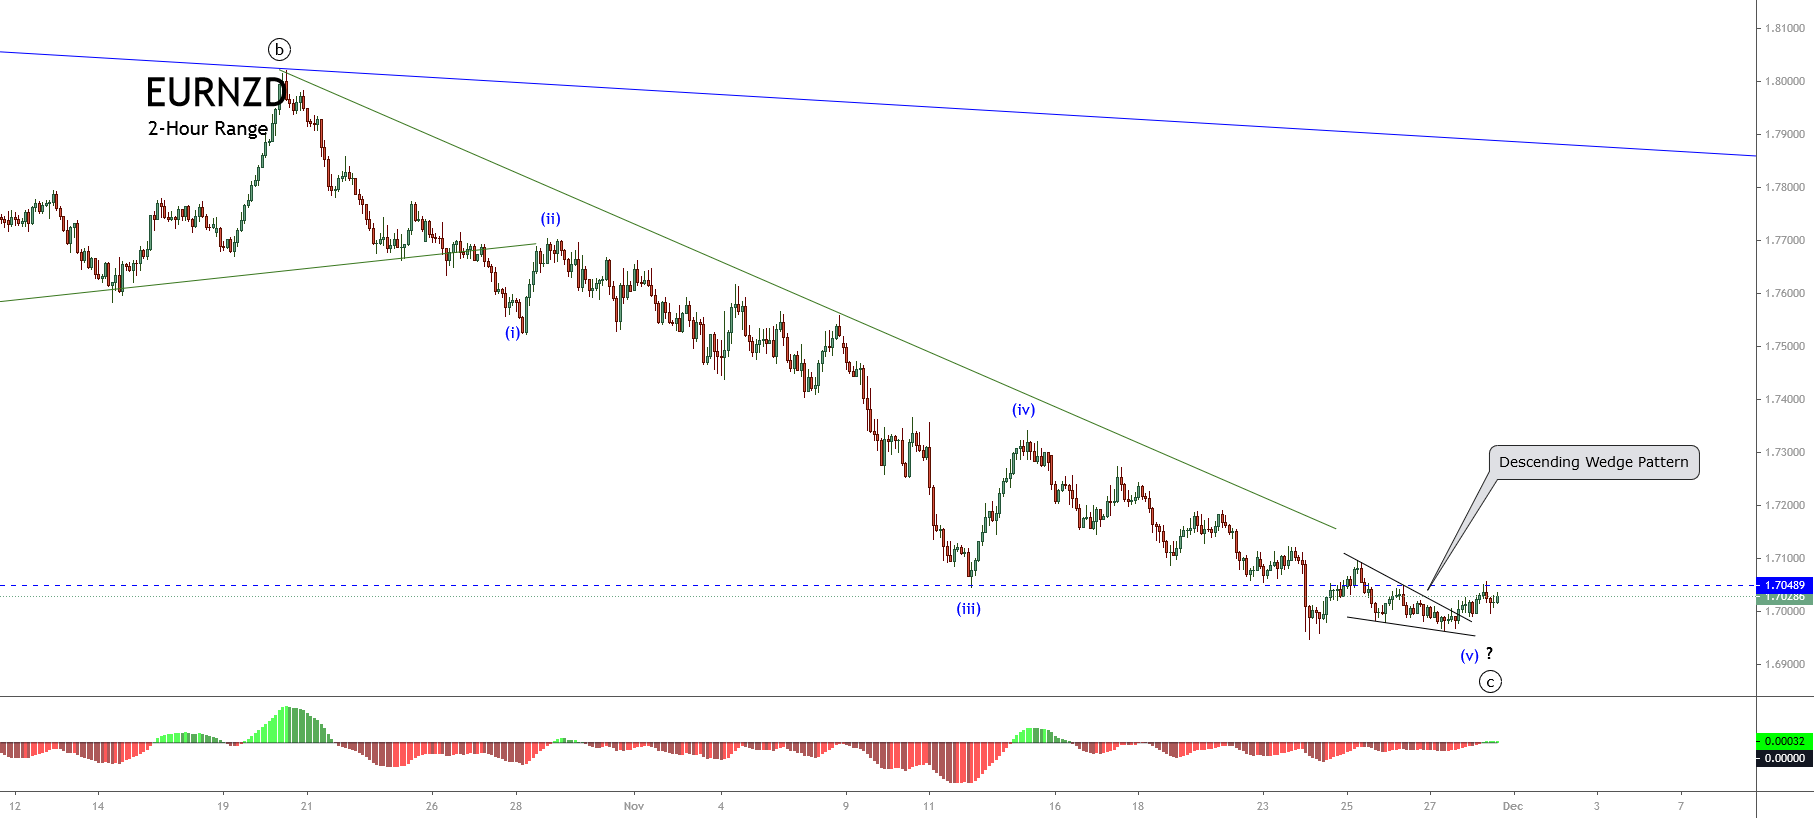
The short-term outlook for the EURNZD cross under the Elliott Wave perspective is shown in the next 2-hour chart and seen moving in an incomplete downward sequence. The current leg in which is moving corresponds to the wave ((c)) of Minute degree labeled in black.  Within that wave ((c)), the price is advancing in its fourth wave of Minuette degree identified in blue.


We see all that the wave ((c)) of Minute degree labeled in black came after the completion of the wave ((b)), which ends on 1.80212 where the cross found fresh sellers dragging it in an accelerated bearish movement. In this context, the current wave ((c)) should develop an internal structure of five waves.

Right now, the chart shows the action is happening in its fourth wave, in blue, which could be advancing in its internal wave b of Subminuette degree identified in green. This leg could possibly test November’s lows. Likewise, considering that the third wave, in blue, looks like an extended wave, the fourth wave should be complex in price, time, or both. Therefore, the current corrective wave could continue evlving likely until early 2021.

Concerning the fifth wave, in blue, and considering that the third one of the same degree was the extended movement, there are two potential scenarios for the cross:

  • First scenario: the cross fails in its downward sequence finding fresh buyers above the end of the third wave, in blue, at 1.69472.
  • Second scenario: the cross penetrates below 1.69472, creating a new lower low. In this case, this new leg down could continue until the psychological barrier of 1.68.

In summary, the EURNZD cross currently moves in a corrective formation in the extreme bearish sentiment zone. In this context, our principal bias remains neutral until the completion of the fourth wave in blue. Once the cross ends the current consolidation, we could seek short positions following the direction of the fifth wave. Finally, the invalidation level of the bearish scenario locates at 1.73606.

Categories
Forex Elliott Wave Forex Technical Analysis

EURJPY Consolidates Expecting the ECB Decision Ahead

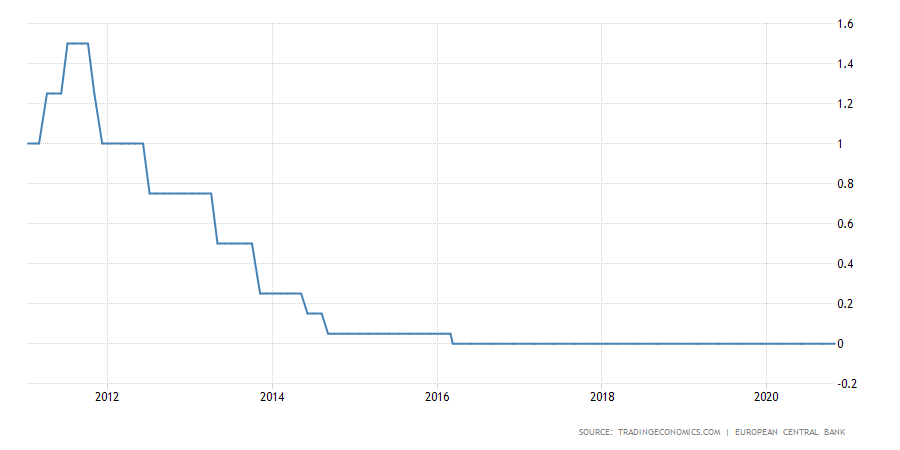
The EURJPY cross consolidates in the overnight trading session expecting the ECB interest rate decision statement that will take place before the U.S. opening bell. The analysts’ consensus doesn’t expect changes both in the interest rate that remains at 0.0% and in the deposit facility rate that keeps at -0.50%.

Source: TradingEconomics.com

Technical Overview

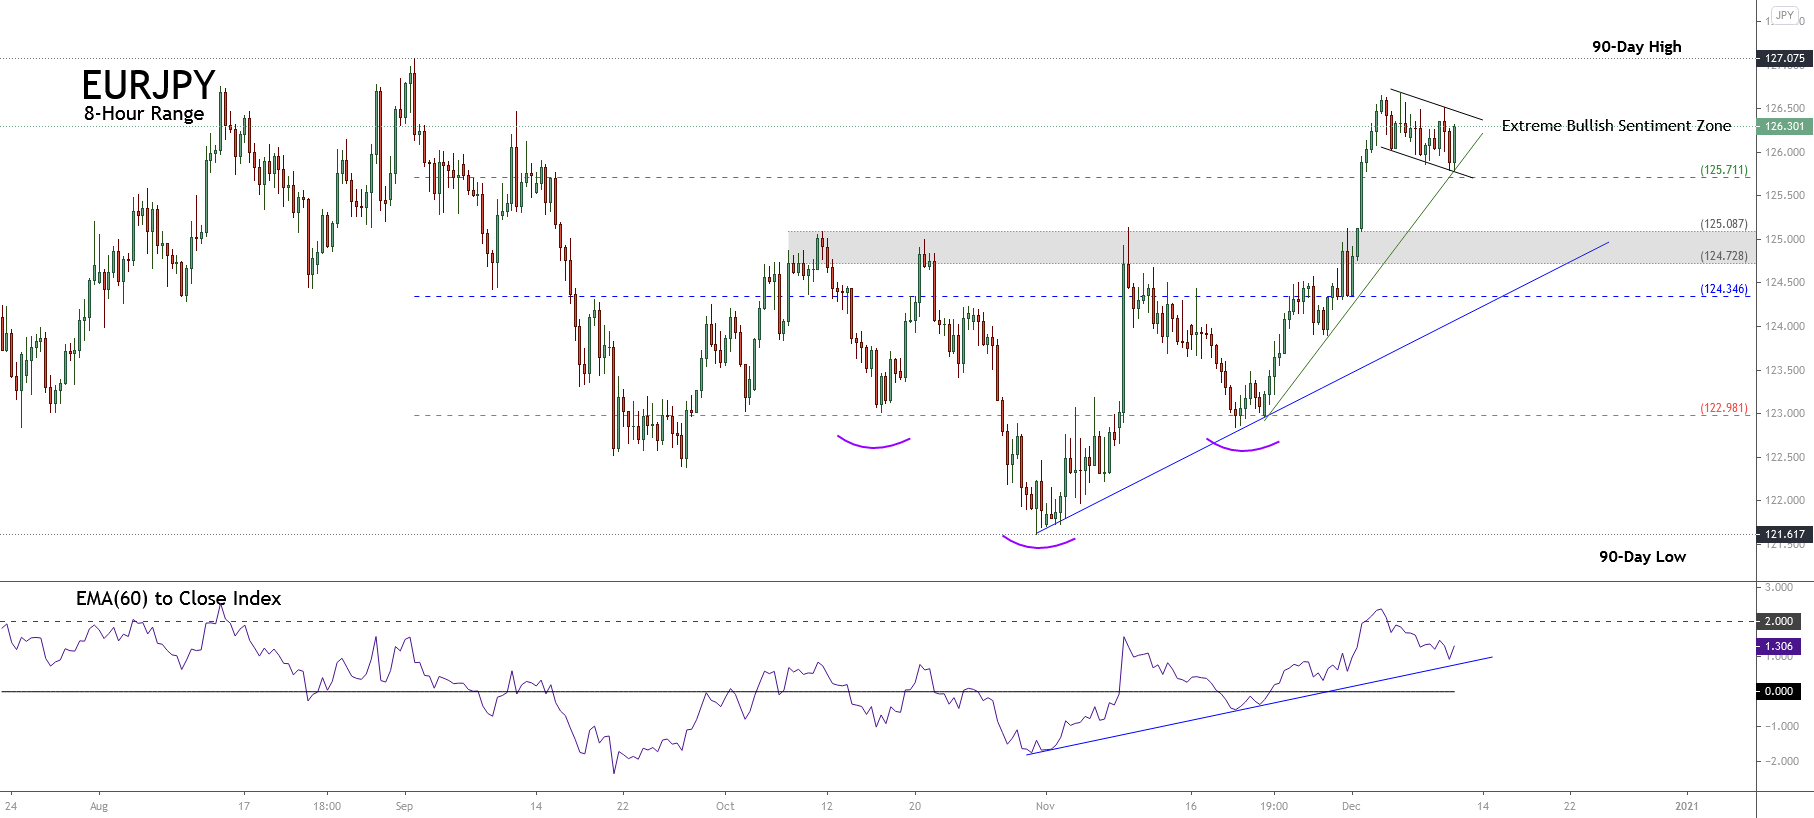
The following 8-hour chart shows the EURJPY market participants’ sentiment, where the cross looks consolidating in the extreme bullish zone, developing a flag pattern. This chartist pattern suggests the continuation of the previous movement. In this case, the technical formation could be indicative of further upsides for the following trading sessions.

Moreover, the primary trend identified with the upward trend-line in blue remains on the bullish side. Also, the secondary trendline plotted in green reveals the bullish acceleration of the price action. This market context is confirmed by the EMA(60) to Close Index, with a reading above the level 2.000 that suggests the overbought levels and the potential correction or consolidation of the previous rally.

Short-term Technical Outlook

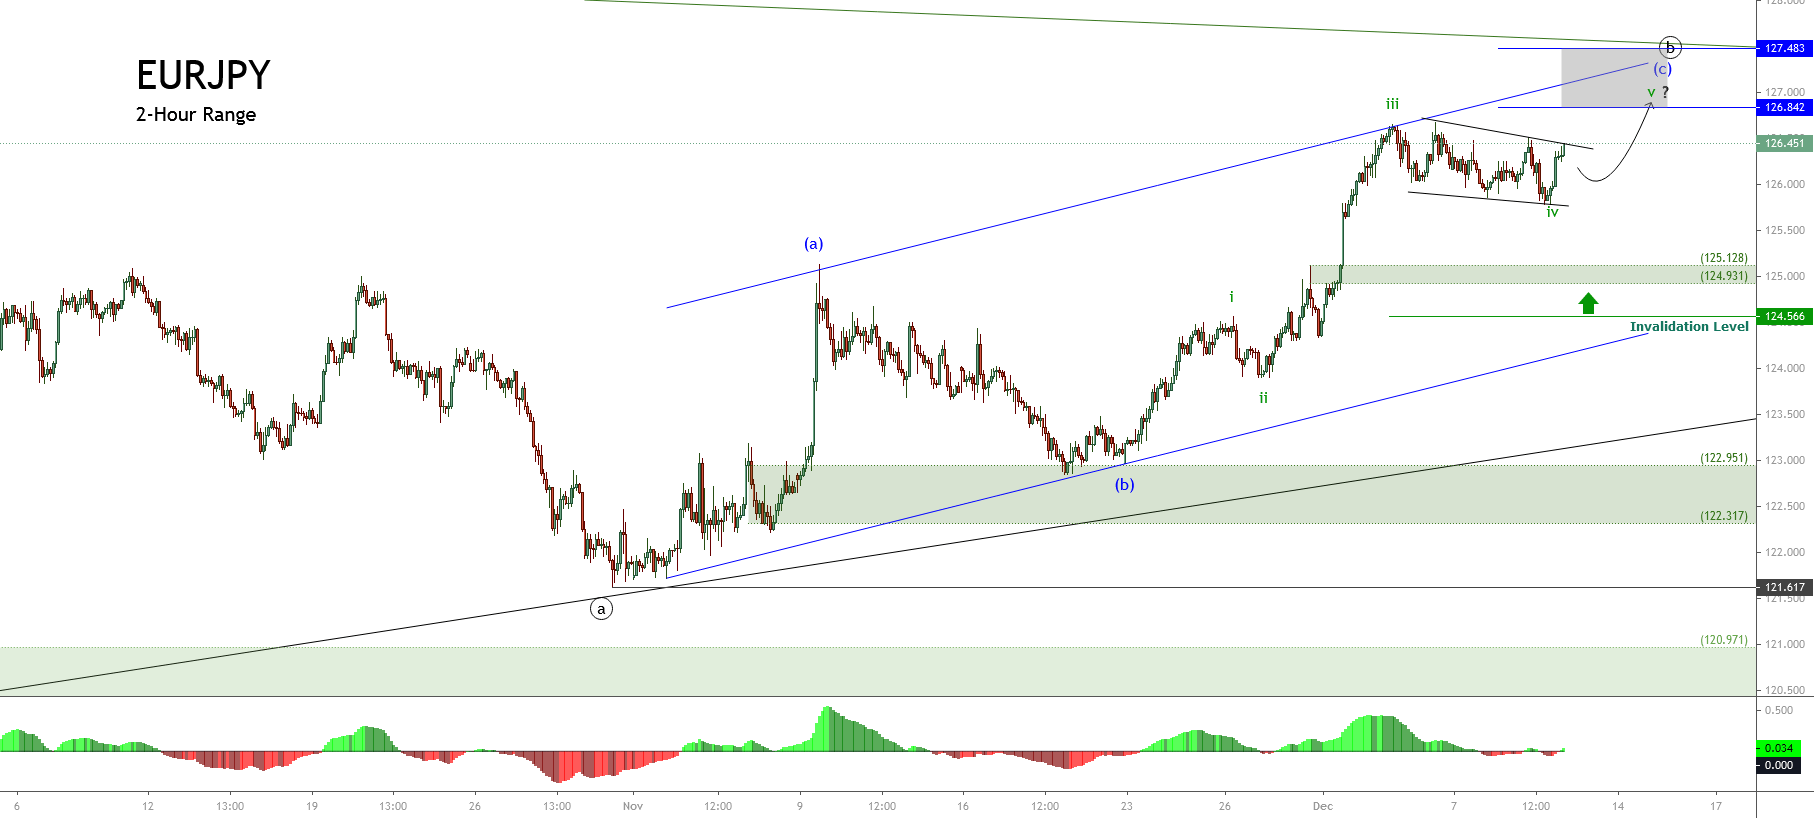
The EURJPY under the intraday Elliott wave perspective unfolded in its 2-hour chart illustrates the advance in an incomplete corrective rally corresponding to wave ((b)) of Minute degree labeled in black. The internal structure shows the cross advancing in its incomplete wave (c) of Minuette degree marked in blue, suggesting a further upside in the following trading sessions.

At the same time, the previous chart reveals the internal five-wave sequence of wave (c) in blue, which exposes the sideways progress of its fourth wave of Subminuette degree identified in green, which belongs to the wave (c) of Minuette degree. 

In this context, considering that the price action could develop a new upward movement, the cross could advance in its fifth wave in green to the potential target zone between 126.84 and 127.48, where the EURJPY cross could complete the wave (c) in blue, and the wave ((b)) in black. Likewise, once this corrective rally completes, the price could start to develop a downward movement identified as wave ((c)) in black.

In this regard, according to the Elliott Wave theory and considering that the mid-term structure corresponds to an incomplete corrective formation constituted by a three-wave sequence, after the completion of the wave ((b)) in black, the price should start to decline in its wave ((c)) with an internal structure subdivided into a five-wave sequence.

Summarizing, the EURJPY cross currently develops a consolidation pattern, which leads to expect a new upward movement with a potential target between 126.84 and 127.48. Once the price completed its target, the cross may start to decline in a five-wave sequence corresponding to wave ((c)) of Minute degree.

Finally, the invalidation level of the current bullish scenario can be found at 124.566.

Categories
Forex Elliott Wave Forex Market Analysis

GBPUSD Ending Diagonal Completion a Warning Sign for a Trend Reversal?

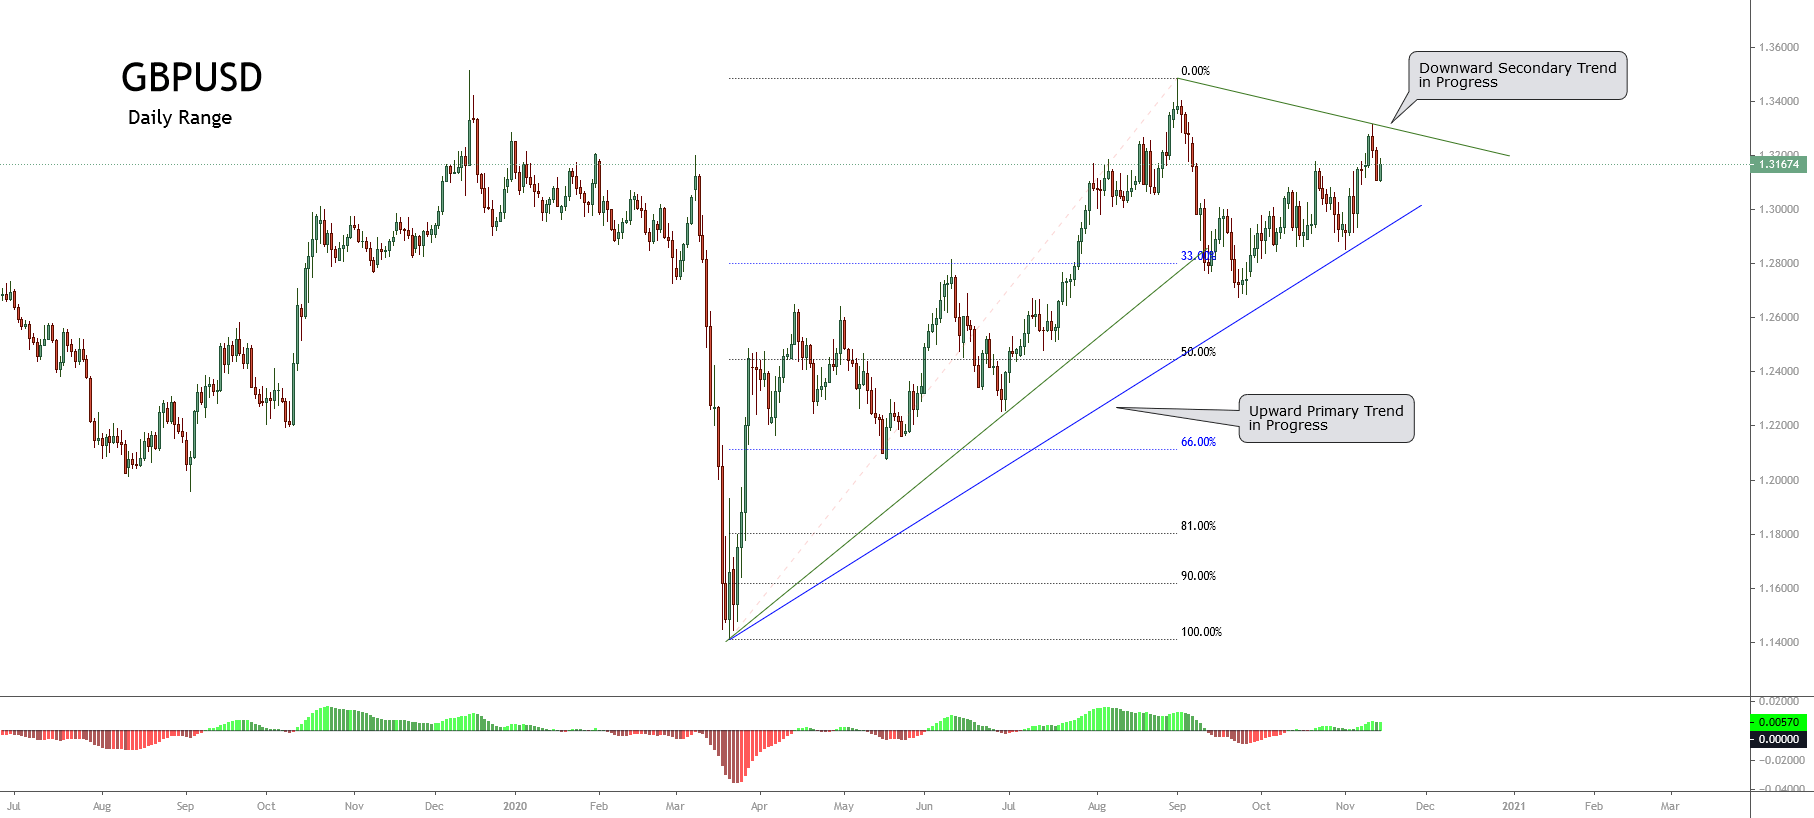
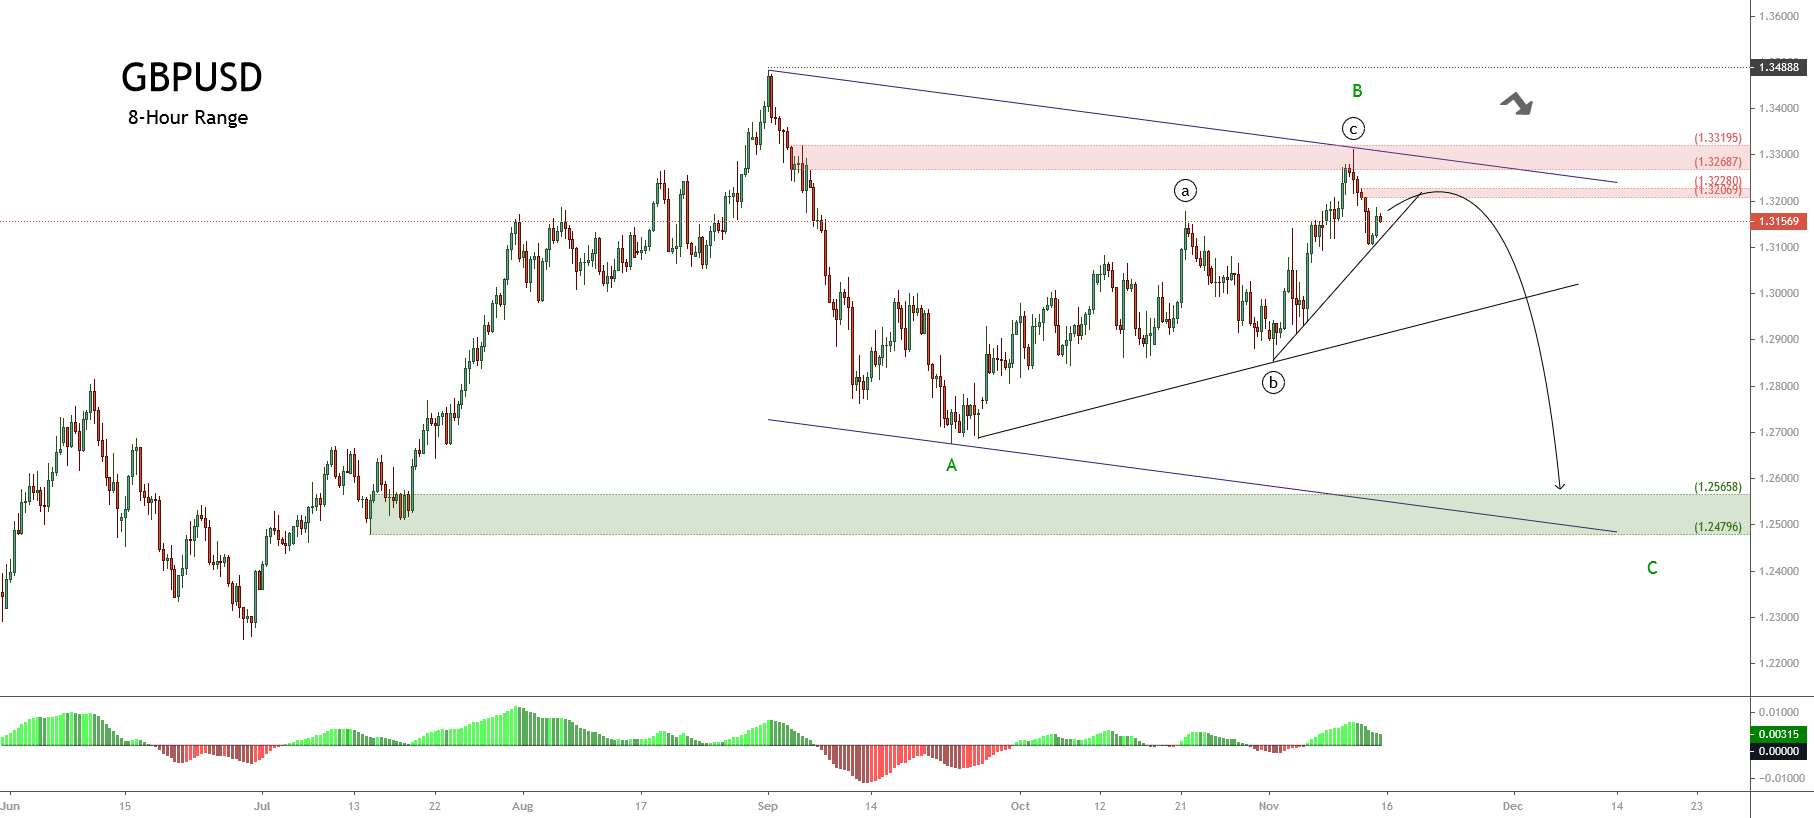
In our last GBPUSD analysis, we discussed its upward advance in an incomplete ending diagonal pattern. We said that the terminal Elliott wave formation progressed in its fifth wave of Minuette degree identified in blue that belongs to a wave ((c)) of Minute degree labeled in black. Likewise, the wave ((c)) corresponds to the third internal segment of the wave B of Minor degree identified in green. 

Technical Overview

The big picture unveiled the sideways movement in an incomplete corrective formation, which could correspond to an expanding flat pattern. In this regard, after the completion of wave B, the Sterling should start developing wave C, which should lead to a decline of this major pair in a five-wave internal sequence.

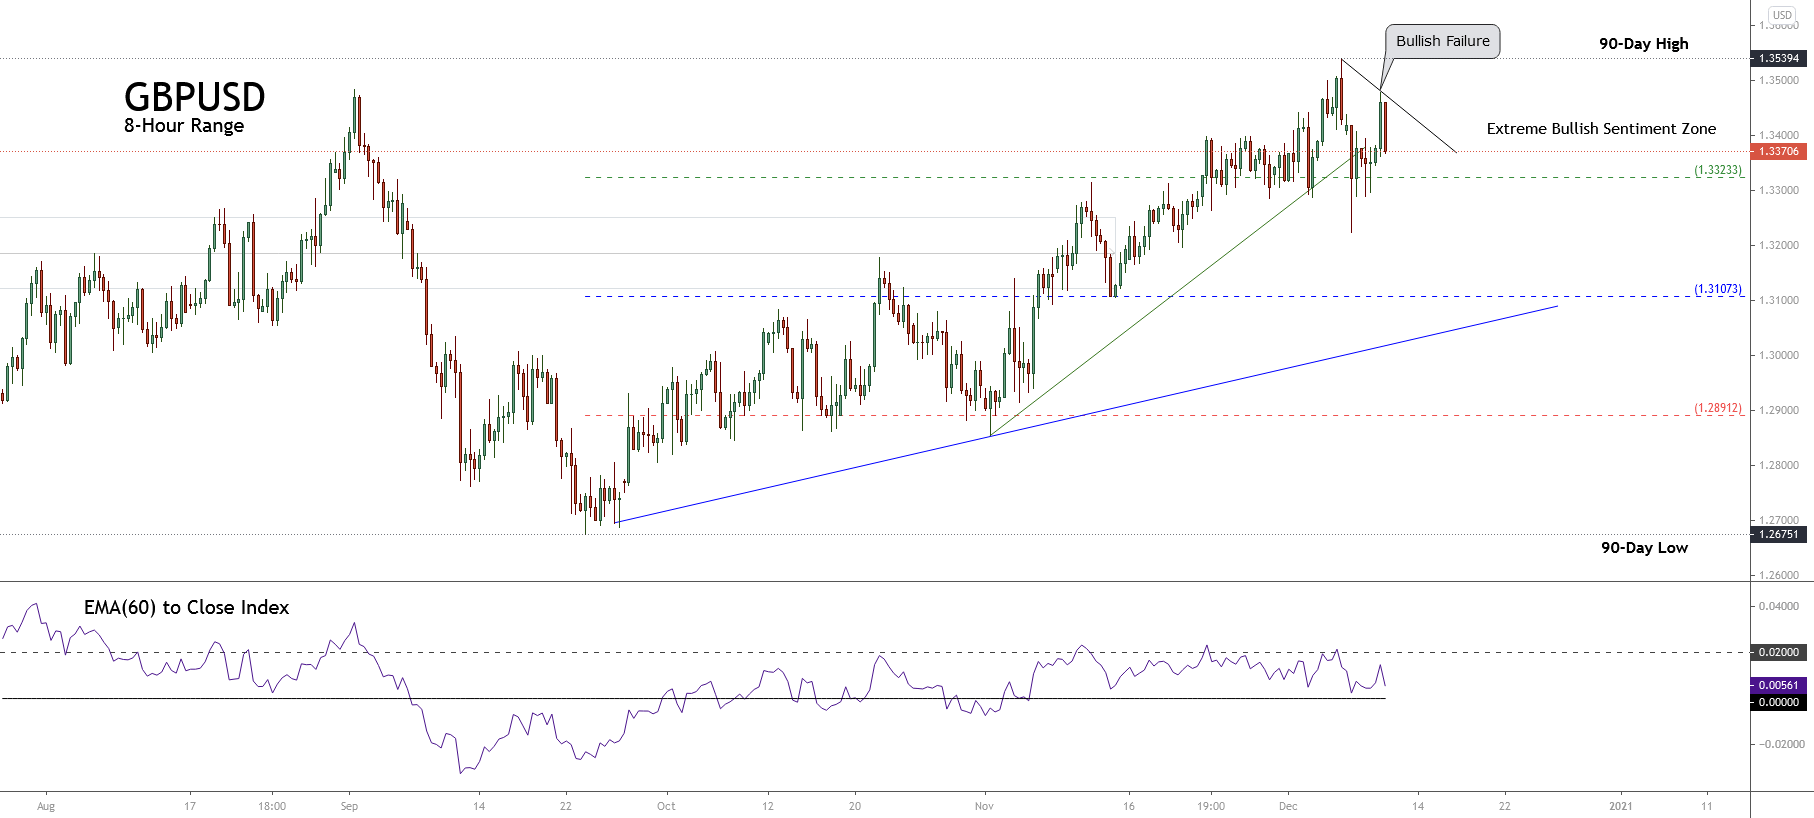
On the other hand, the following 8-hour chart reveals the market participants’ sentiment unfolded by the 90-day high and low range, which looks advancing in the extreme bullish sentiment zone. 

The previous chart illustrates the bullish failure in the Wednesday trading session, which couldn’t strike the last high of 1.35394. This failure added to the breakdown of the previous upward trendline plotted in green leads us to expect further declines in the coming trading sessions, likely to the ascending primary trend-line identified in blue.

Short-term Technical Outlook

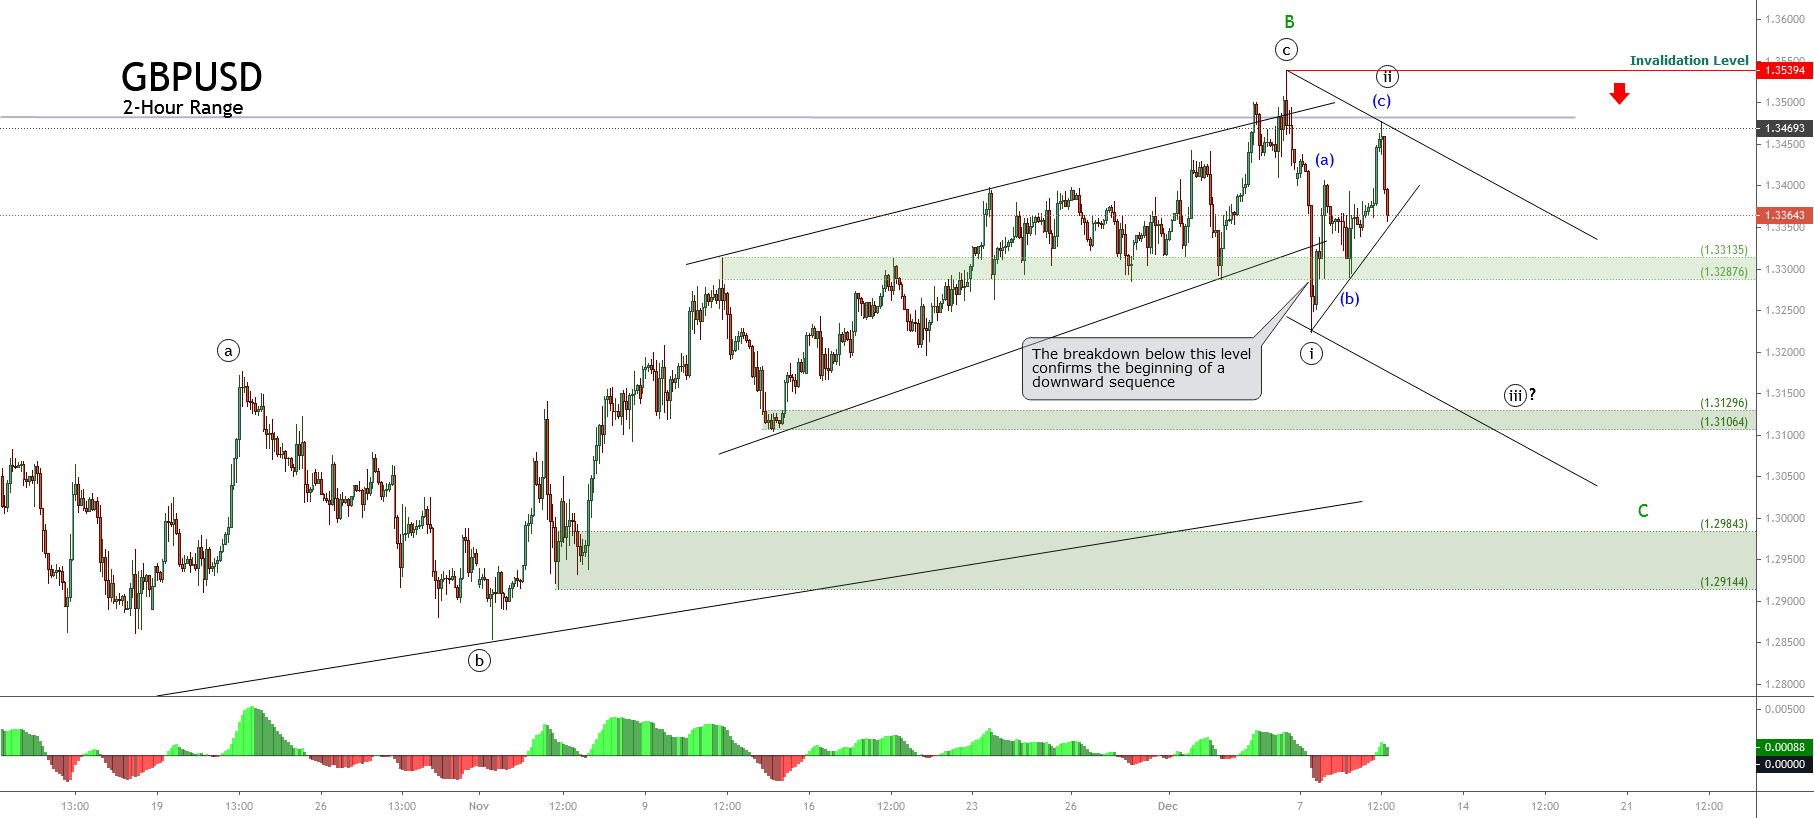
The intraday Elliott wave view for the GBPUSD pair displayed by the following 2-hour chart exposes the breakdown of the ending diagonal pattern formed on December 07th, confirming the completion of the terminal formation unveiled in the wave ((c)) identified in black. 

Once the Pound found the intraday support at 1.32238, the price action began to bounce in an internal corrective rally subdivided in a three-wave sequence corresponding to wave ((ii)) in black, founding resistance at 1.34779 on the Wednesday trading session.

In this regard, the breakdown of the intraday trend-line that connects the waves ((i)) and (b) should confirm the downward progress of its wave ((iii)) in black, which according to the Elliott wave theory, should be the largest wave of the downward sequence.

The third wave in black could find support in the demand zone between 1.31296 and 1.31064. If the price action continues deteriorating, the Cable could drop toward the next demand zone between 1.29843 and 1.29144.

Summarizing

After the GBPUSD pair made a breakdown of its ending diagonal pattern, is currently moving in a corrective rally corresponding to wave ((ii)), which should give way to a new decline corresponding to the third wave of Minute degree. According to the textbook, this movement should be the largest decline of the current downward sequence and could find support in the demand zone between 1.31296 and 1.31064. Finally, the invalidation level of the current bearish scenario can be found at 1.35394.

Categories
Forex Elliott Wave Forex Market Analysis

EURUSD: is 1.22 at Hand?

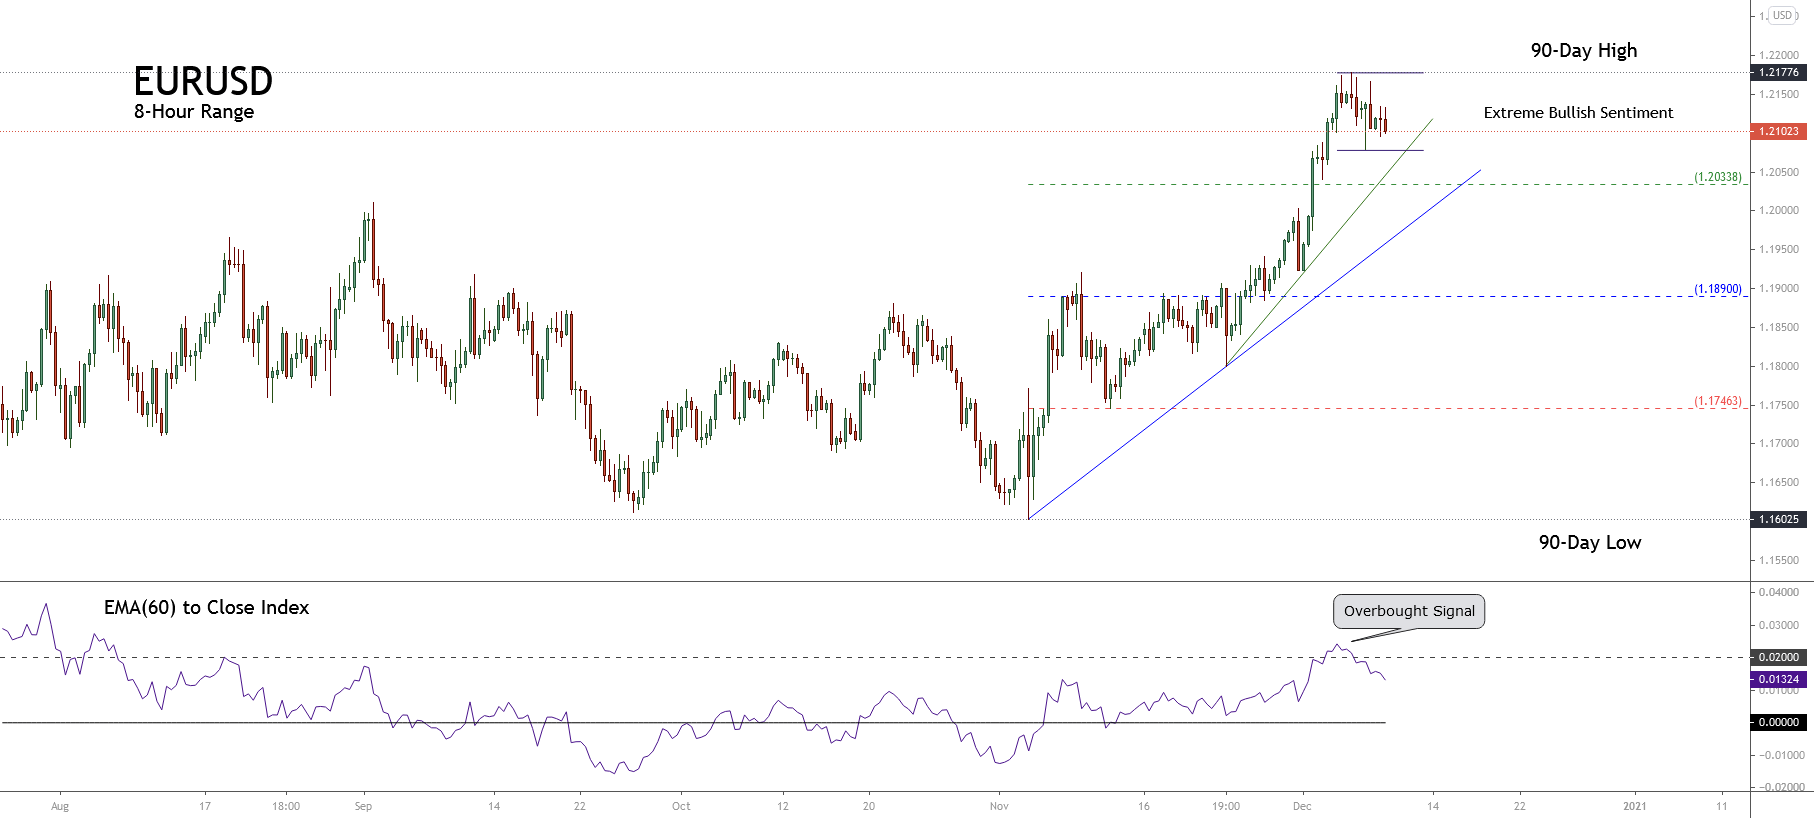
The EURUSD pair advances in the extreme bullish sentiment range, consolidating the short-term rally that started on November 04th when the price found fresh buyers at 1.15615.

Technical Overview

The following 8-hour chart shows the short-term participants’ sentiment keeps pushing higher the price action. In this view, the common currency looks to consolidate the pair’s impulsive movement that began in early November.

In this chart, we can see that the current primary trend is clearly bullish. Simultaneously, the accelerated trendline identified with the green line shows the short-term bull market remains intact.

On the other hand, both the intraday sideways channel and the retracement observed in the EMA(60) to Close Index lead to a consolidation of the rally experienced by the common currency during the previous trading sessions.

Therefore, if the price action penetrates below 1.20338, the likelihood of a reversal movement in the EURUSD increases.

Short-term Technical Outlook

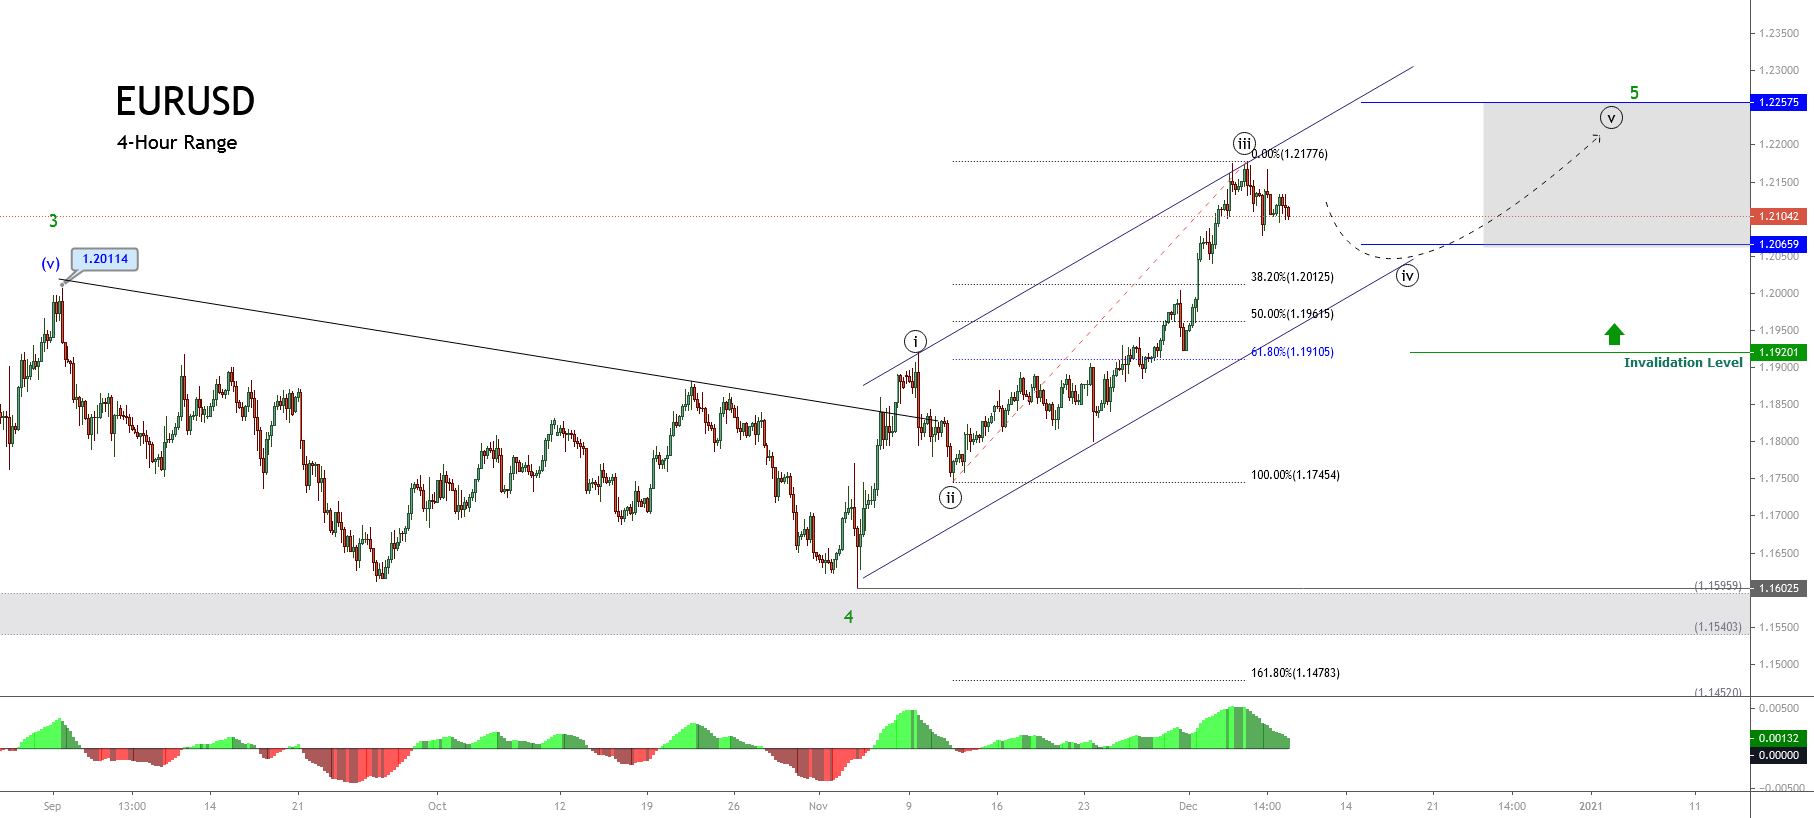
The short-term Elliott Wave view for the EURUSD pair unfolded in the next 4-hour chart reveals the advance in an incomplete bullish impulsive wave of Minor degree identified in green.

The EURUSD 4-hour chart illustrates the impulsive rally that began on November 04th when the price found fresh buyers at 1.16025. The price action currently looks to have completed its third wave of Minute degree labeled in black, confirmed by the broadest distance shown on the MACD oscillator

On the other hand, the consolidation structure in progress reveals the potential sideways advance of its fourth wave. Considering the Elliott Wave Principle, the fourth wave shouldn’t penetrate below the invalidation level located at 1.19201, which corresponds to the end of wave ((i)) in black.

Also, considering both the second wave, which looks like a simple corrective pattern, and the alternation principle on corrective waves, the fourth wave should be a complex correction. In this context, the fourth wave could be a triangle or a combination of simple waves grouped in a double-three or a triple-three formation.

Finally, the extension in terms of time should indicate the exhaustion of the bullish pressure; thus, the common currency could soon end its bullish cycle.

Categories
Forex Elliott Wave Forex Market Analysis

GBPAUD Consolidates in an Incomplete Correction

The GBPAUD cross continues consolidating in what is a corrective formation that continues in development since October 22nd when the price found fresh sellers on 1.85272. In this context, the current consolidation pattern suggests a coming rally in the following trading weeks.

Technical Overview

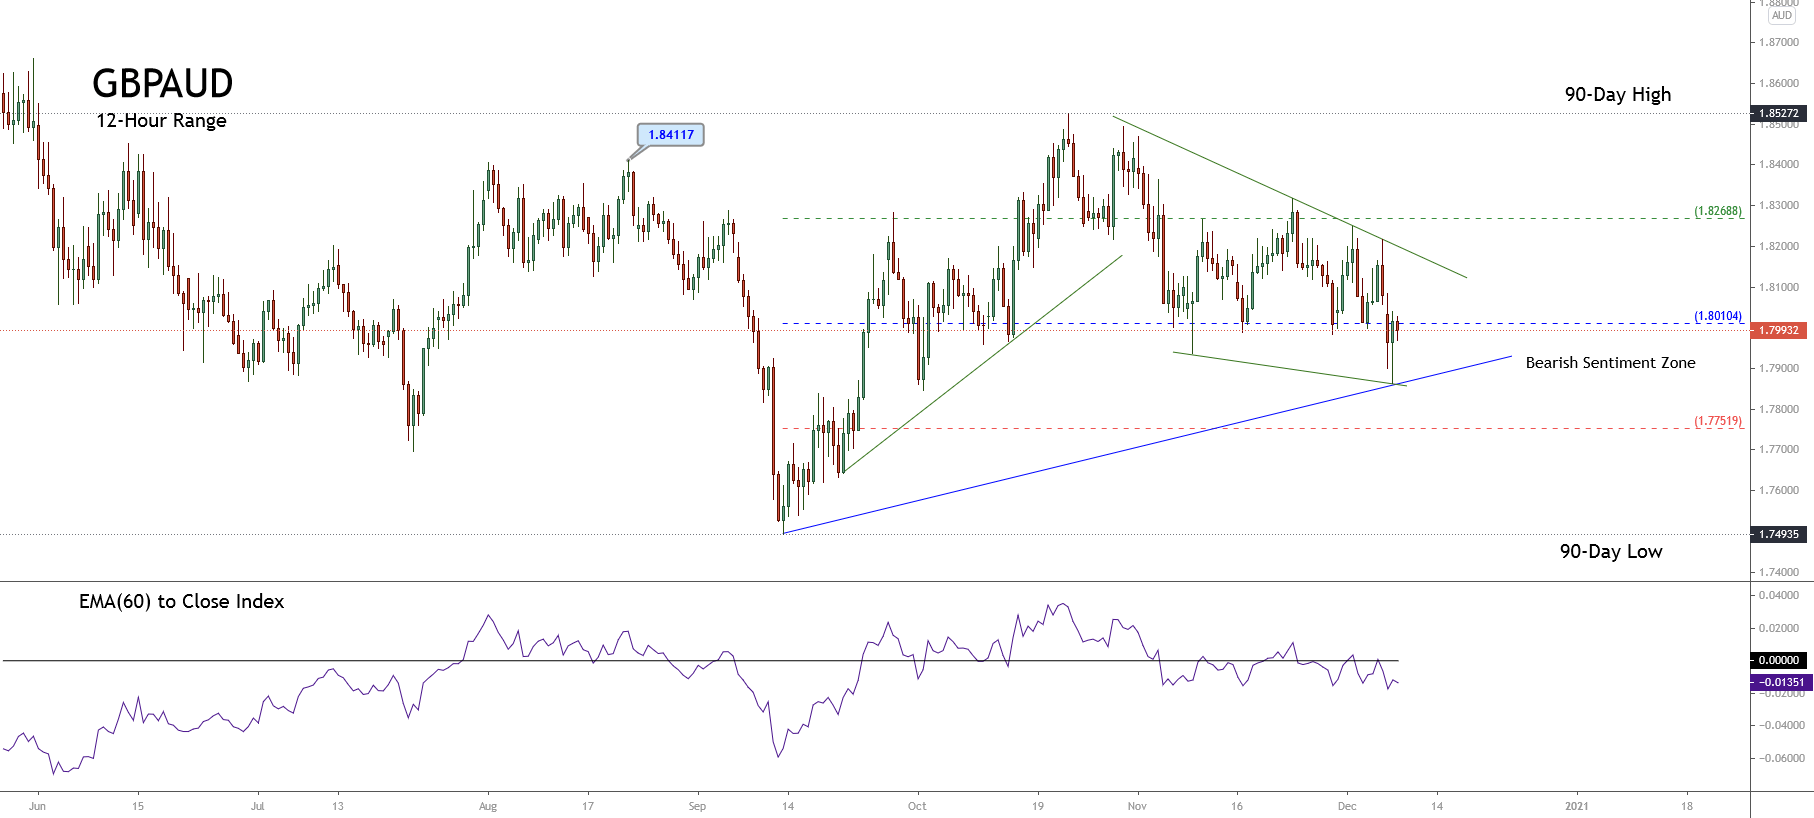
The next 12-hour chart illustrates the short-term market participants’ sentiment displaying the 90-day high and low range, which bounced in the bearish sentiment zone finding resistance in the neutral level of 1.80104, where the cross is still moving in the current trading session. However, as long as the GBPAUD cross doesn’t surpass and closes above the level of 1.80104, the bias will stay mostly bearish.

The primary trend identified in blue shows that the current uptrend remains in its formation process. In this context, the corrective movement in progress represents a secondary trend from the last upward move that carried the cross from 1.74935 to 1.85272.

Short-term Technical Outlook

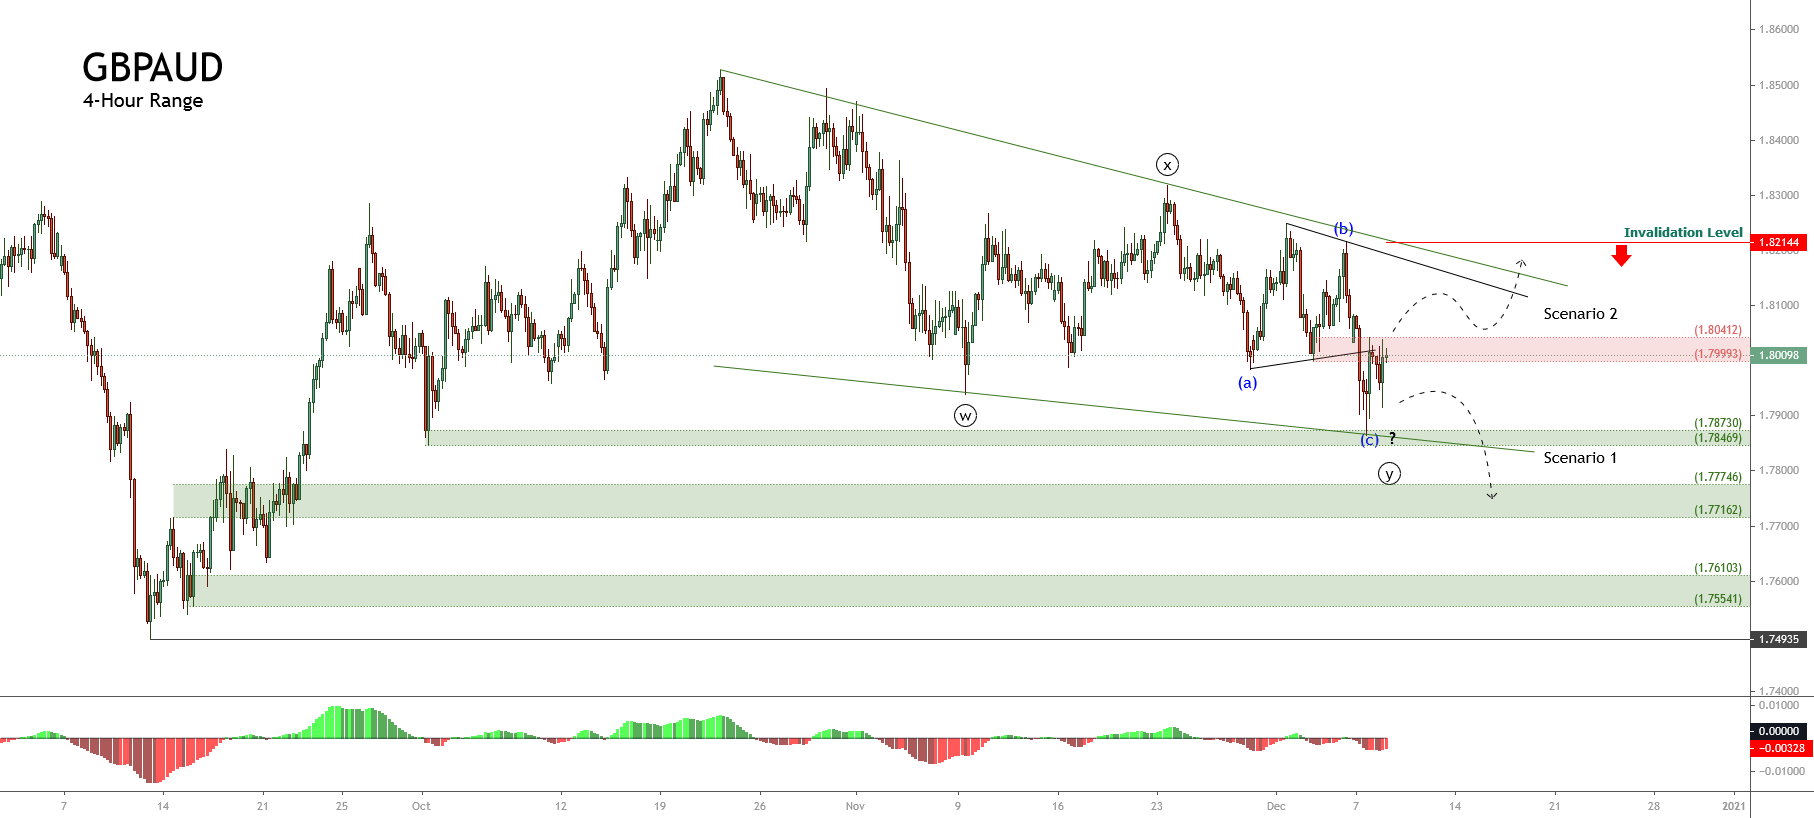
The short-term Elliott wave view for the GBPAUD cross shown in the following 4-hour chart reveals the downward advance in an incomplete double-three pattern of Minute degree labeled in black, which suggests further declines for the following trading sessions.

The previous chart shows the GBPAUD developing a double three pattern. According to the textbook, this complex corrective formation follows an internal sequence subdivided into 3-3-3, where each three corresponds to a basic corrective structure.

Currently, the cross looks advancing in its wave (c) of Minuette degree labeled in blue, which belongs to the wave ((y)) of Minute degree identified in black. The movement developed until now fits two potential scenarios:

  • The first scenario considers the pause in the wave (c), which could see further declines to the demand zone between 1.7774 and 1.7716. The cross could even extend its drops until 1.7610 and 1.7554, where the price could find fresh buyers expecting a boost in its price to new highs.
  • The second occurs if the price ends its wave (c) in blue and rally toward fresh highs. In this context, the cross should confirm the breakout of the supply zone resistance at 1.8041. Also, the cross must break up the ((x))-(b) trend-line.

Finally, the invalidation level for this bearish sequence in progress can be found at the end of wave (b) in blue at 1.82144.

Categories
Forex Market Analysis

NZDCAD Heavy Drops driven by a Sharp Shift in Market Sentiment

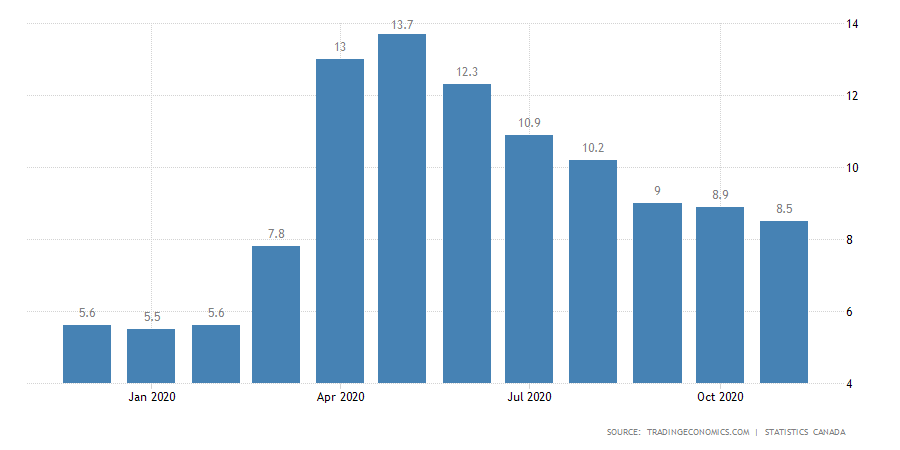
In the last trading week, the NZDCAD cross  90-Day market sentiment declined from the extreme bullish to the bullish sentiment zone. The move was helped by the Canadian unemployment rate figures, which declined to 8.5% in November, beating the analysts’ expectations of 8.9%. 

Source: TradingEconomics.com

The last unemployment rate reading represents an improvement in the Canadian labor market, which showed a slight decline to 8.9% in October. On the other hand, during the current year, the data gathered from Statistics Canada stated that the record unemployment high was Mays figure of 13.7%, its highest level in more than four decades.

Technical Overview

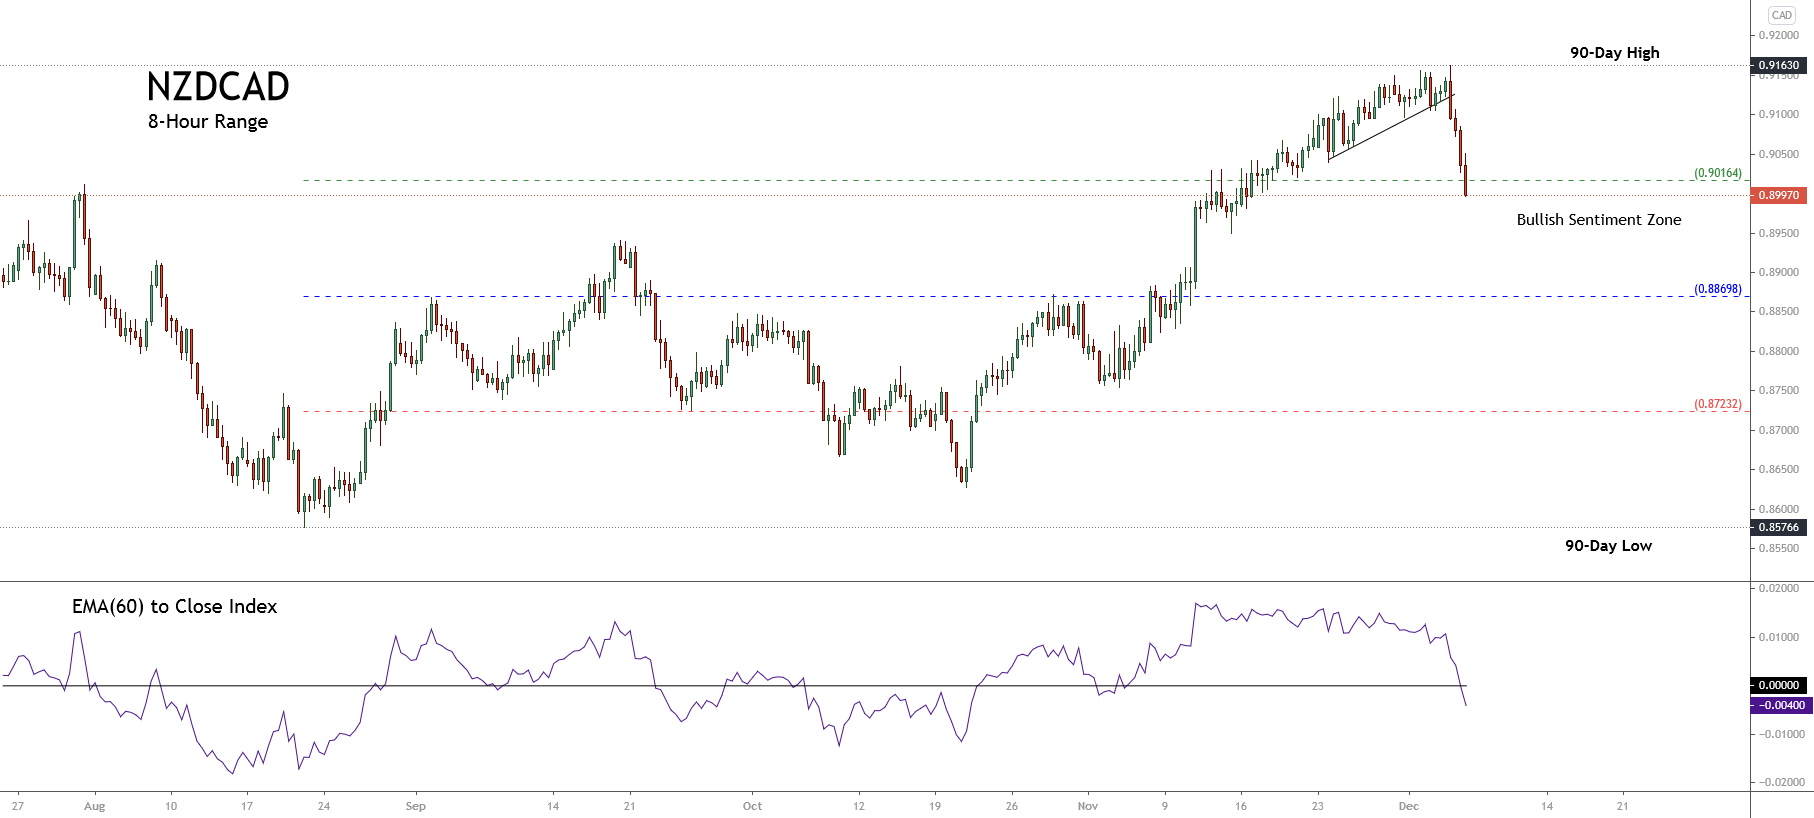
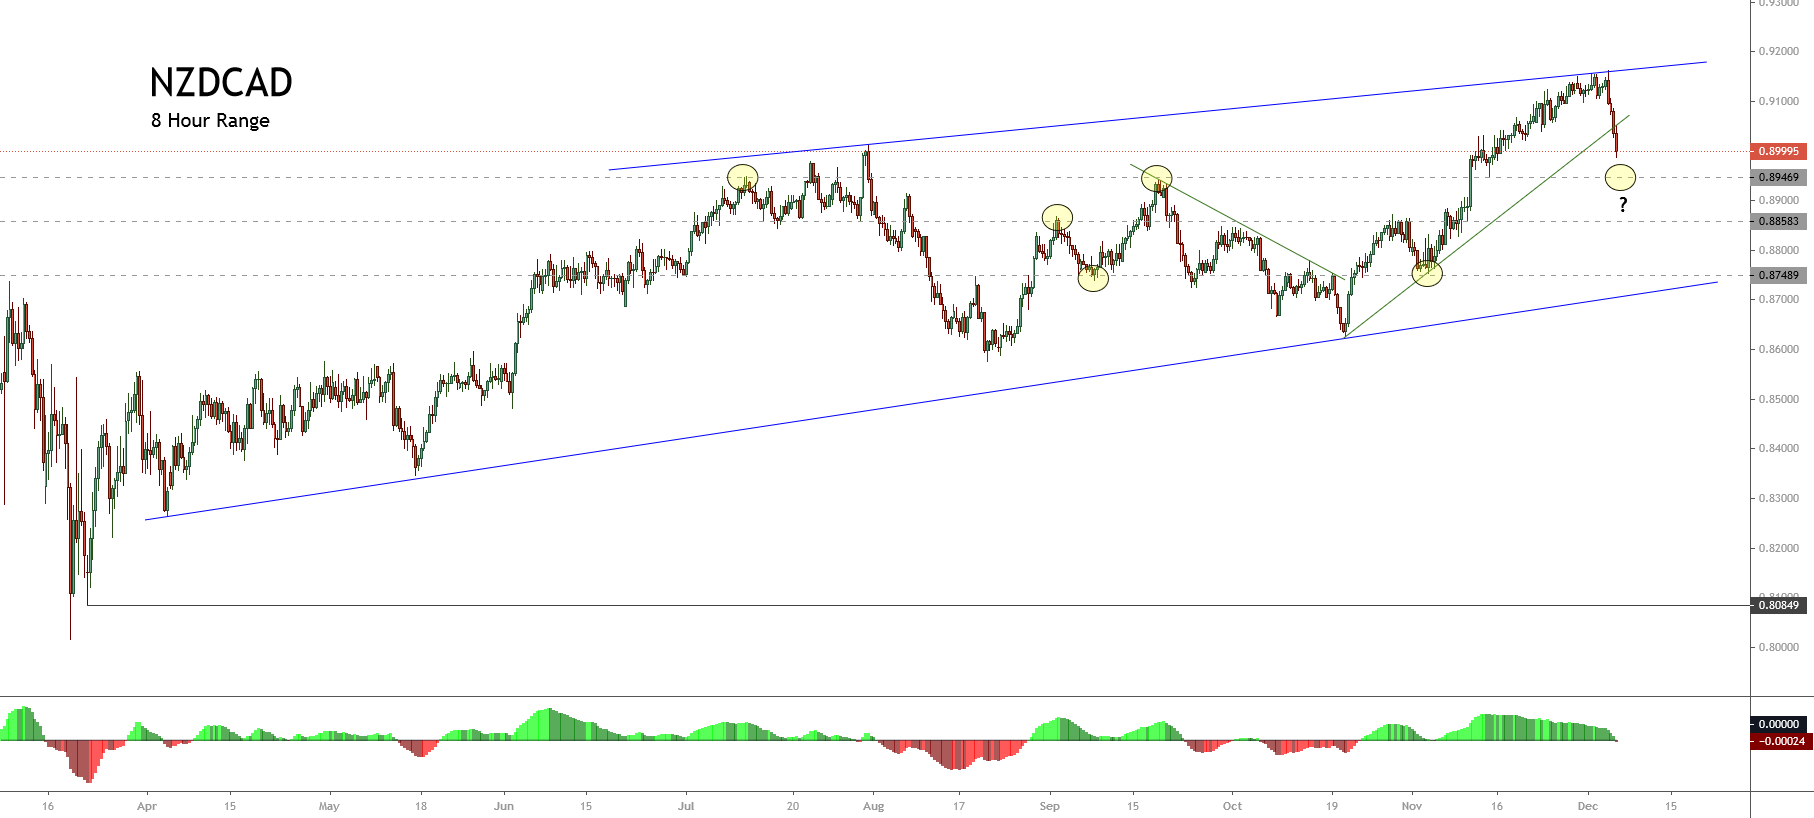
The following 8-hour chart illustrates the market participants’ sentiment unfolded in the 90-day high and low range, revealing an aggressive decline in the Friday 04th trading session where the cross dropped over 1.7%. 

In this context, the downgrade on the market sentiment leads us to expect a corrective movement. This potential drop could find support in the neutral zone of 0.88698. Likewise, the descending of the NZDCAD EMA(60) to Close index below the zero-line drives us to anticipate a consolidation during the coming trading sessions before continuing a further decline.

Technical Outlook

The NZDCAD cross in its 8-hourly chart illustrates the mid-term uptrend that began on March 18th once the price confirmed its bottom of 0.80849. The primary trend plotted in blue reveals that the bull market remains intact.

Likewise, the breakdown observed in the last ascending secondary trend identified in green reveals a short-term correction with three potential key support levels: 0.89469, 0.88583, and 0.87489. Each of these levels shows a zone where the price action developed a polarization movement.

The following 2-hour chart shows an impulsive movement, which began on October 20th when the price found support at 0.86270. After completing its third wave of Minuette degree, in blue, the NZDCAD cross found resistance on December 03rd at 0.91630, where it started a decline in an incomplete corrective sequence that could correspond to wave (iv), in blue.

In this context, the cross could develop two potential scenarios:

  • The first scenario occurs if the price completes the third wave on 0.91630. In this case, the cross could advance mostly sideways in its wave (iv), in blue. In this scenario, the cross could find support in the demand zone between 0.89723 and 0.89490, where the price could begin to advance in its wave (v) of Minuette degree at least to the 0.9163 level.
  • The second scenario: considers an alternative count and occurs if the NZDCAD cross completes a wave (v), in blue, on 0.91630. If that is the case, it implies the price is currently advancing in a corrective formation of Minuette degree. Thus, the price could create a decline in a three-wave sequence toward the next demand zone between 0.88437 until 0.88234. 

In both scenarios, the invalidation level is found below the origin of wave (i) at 0.86270.

Categories
Forex Market Analysis

Daily F.X. Analysis, December 04 – Top Trade Setups In Forex – NFP in Highlights! 

The eyes will remain on the U.S. NFP data on the news side, which is expected to report a slight drop from 638K to 500K during the previous month. Besides, the U.S. Average Hourly Earnings m/m and Unemployment Rate will also remain the main highlight of the day, and these may determine the USD trend for today and next week. Let’s wait for the news.

Economic Events to Watch Today  


EUR/USD – Daily Analysis

The EUR/USD pair was closed at 1.21474 after placing a high of 1.21744 and a low of 1.21008. EUR/USD pair extended its gains for the 3rd consecutive day on Thursday due to the U.S. dollar’s weakness amid the rising hopes for the next round of U.S. stimulus package from Congress.

The Top Democrats, Joe Biden, and Nancy Pelosi backed the bipartisan $908 billion stimulus plan on the previous day. They urged the Senate Majority Leader Mitch McConnell to drop his plan to bring a more modest package. All top Democrats, including the President-elect Joe Biden, Nancy Pelosi, and the Senate Minority Leader Chuck Schumer, said that the bill would be acceptable as a starting point. 

The need for more stimulus relief packages to support the economy was increasingly evident, with both the ADP Non-Farm Payrolls and the ISM manufacturing survey below the expectations. Meanwhile, Car and Truck sales in November also fell from October level. On the coronavirus front, the U.S. had its deadliest day since the start of the pandemic on Thursday, with over 2700 recorded deaths due to coronavirus. Over the past 2-days alone, the death toll has reached 5000. The number of hospitalized people also reached for the first time, an alarming level of 100,000. All these developments weighed heavily on the U.S. dollar on Thursday and added strength to the EUR/USD pair.

The Spanish Services PMI for November raised to 39.5 against the expected 36.5 and supported Euro and added further gains in EUR/USD pair. At 13:45 GMT, the Italian Services PMI declined to 39.4 against the forecasted 40.9 and weighed on Euro. At 13:50 GMT, the French Final Services PMI fell to 38.8 against the anticipated 49.1 and weighed on Euro. AT 13:55 GMT, the German Final Services PMI came in line with the expectations of 46.2. At 14:00 GMT, the Final Services PMI from Eurozone raised to 41.7 against the expected 41.3 and supported Euro and the EUR/USD pair raised further. At 15:00 GMT, the Retail Sales for October also surged to 1.5% against the anticipated 0.7% and supported Euro and helped the EUR/USD pair to continue its bullish momentum.

From the U.S. side, at 17:30 GMT, the Challenger Job Cuts for the year in November came in as 45.4%against the previous 60.4%. At 18:30 GMT, the Unemployment Claims from last week fell to 712K against the anticipated 775K and supported the U.S. dollar. At 19:45 GMT, the Final Services PMI for November surged to 58.4 against the anticipated 57.5 and supported the U.S. dollar. At 20:00 GMT, the ISM Services PMI stayed as anticipated 55.9.

Daily Technical Levels

Support   Resistance

1.1971       1.2122

1.1873       1.2175

1.1819       1.2273

Pivot point: 1.2024

EUR/USD– Trading Tip

On Friday, the EUR/USD pair continues to trade sideways ahead of the NFP figures, which may drive sharp movements during the U.S. session.

On the higher side, the EUR/USD may find an immediate resistance at 1.2160 and 1.2196 level. Simultaneously, the closing of candles below the 1.2103 level can send the EUR/USD pair further lower until 1.2080. Trend depends upon the NFP data.


GBP/USD – Daily Analysis

The GBP/USD closed at 1.34525 after placing a high of 1.34998 and a low of 1.33288. The GBP/USD pair rose and reached above one year’s highest level over the bullish Brexit bets and the U.S. dollar’s weakness. On Thursday, the latest news raised the British Pound over the board that suggested that the Brexit trade deal could be reached by the weekend after the two sides showed hints of compromise over fish quotas. The positive news made the British Pound the best performer on the day in the G10 currencies. 

In an attempt to break the deadlock, Mr. Barnier and Boris Johnson lowered their demands by asking to get back only 60% of the fish that E.U. boats currently catch in British waters, down from 80%. Under the reported proposal, the U.K. would hold onto increased stocks of fish that are sold in the U.K. while the E.U. will keep the similar quotas of stock that are popular in the E.U. but not in the U.K.

The compromise was reported less than a week after E.U. Brexit negotiator Michel Barnier proposed to return about 15-18% of the fish caught by European fleets in British waters to the U.K. under a free trade agreement; however, at that time, the U.K. rejected this proposal.

The progress on fisheries is progress after a months-long stalemate; however, other key sticking points, including the level-playing field and governance, need to be solved to reach a deal. The time for the end of the Brexit transition period is near, and both sides have shown hints that a deal might reach by this weekend.

All these optimistic Brexit progress reports gave the local currency British Pound strength and supported the GBP/USD pair’s upward momentum that led the pair to its one-year highest level near 1.35000 on Thursday.

On the data front, at 14:30 GMT, the Final Services PMI from Britain raised to 47.6 against the expected 45.8 and supported British Pound and added further gains in GBP/USD pair.

From the U.S. front, at 17:30 GMT, the Challenger Job Cuts for the year in November came in as 45.4%against the previous 60.4%. At 18:30 GMT, the Unemployment Claims from last week declined to 712K against the projected 775K and supported the U.S. dollar. At 19:45 GMT, the Final Services PMI for November rose to 58.4 against the projected 57.5 and supported the U.S. dollar. At 20:00 GMT, the ISM Services PMI stayed as projected 55.9.

Furthermore, the gains in GBP/USD pair on Thursday were also because of the U.S. dollar’s weakness due to the progress in talks to reach a consensus between Republicans & Democrats over the second round of stimulus talks. Joe Biden, Nancy Pelosi, and Chuck Schumer have shown their consent for the bipartisan bill of $908 billion. This progress raised the hopes for a stimulus bill and weighed on the U.S. dollar that added strength to the GBP/USD pair.

Daily Technical Levels

Support   Resistance

1.3286       1.3441

1.3209       1.3519

1.3131       1.3596

Pivot Point: 1.3364

GBP/USD– Trading Tip

The GBP/USD is trading sideways in between a fresh trading range of 1.3305 – 1.3445. Breakout of this range can lead the Cable price towards the 1.3517 level. The volatility seems low ahead of the Christmas holidays. However, the European session can trigger a buying trend until the 1.3515 level, while support continues to stay at the 1.3305 level. A bearish breakout of the 1.3305 level can trigger selling until the 1.3212 level. The MACD and RSI are suggesting a bullish bias in the market. Let’s consider taking buying trades over 1.3305 and 1.3447 level today.


USD/JPY – Daily Analysis

The USD/JPY pair was closed at 103.841 after placing a high of 104.534 and a low of 103.669. The USD /JPY pair dropped to its lowest since November 18 on Thursday due to broad-based U.S. dollar weakness.

The U.S. Dollar Index extended its losses for 3rd consecutive day on Thursday and fell to a 31-month lowest level below 91.10 after the hopes for the next round of stimulus raised in the market. The top three Democratic Leaders, President-elect Joe Biden, House Speaker Nancy Pelosi, and Senate Minority Leader Chuck Schumer, backed the bipartisan proposal for a coronavirus relief package worth $908 billion. They all urged the Senate Majority Leader Mitch McConnell to drop his plans of bringing a more modest package back to the floor of the upper chamber.

Both parties agree that more relief aid should be delivered to Americans to curb the coronavirus pandemic’s effects but have differences over the size, method, and healthcare system. The renewed efforts to strike a deal followed a months-long deadlock over the second stimulus relief package and weighed heavily on the greenback that added losses in the USD/JPY pair.

On the data front at 17:30 GMT, the Challenger Job Cuts for the year in November came in as 45.4%against the previous 60.4%. At 18:30 GMT, the Unemployment Claims from last week dropped to 712K against the estimated 775K and supported the U.S. dollar, and capped further losses in the USD/JPY pair. At 19:45 GMT, the Final Services PMI for November rose to 58.4 against the estimated 57.5 and supported the U.S. dollar. At 20:00 GMT, the ISM Services PMI stayed as estimated at 55.9.

Furthermore, the U.S. dollar was also weak because of the rising cases of coronavirus in the U.S. The U.S. saw its deadliest day since the start of the pandemic on Thursday after 2,700 deaths were reported in a single day. Over the past two days only, the death toll has reached 5,000 in the U.S. from the coronavirus, and the hospitalization rate has also increased, with more than 100,000 cases reported to be hospitalized in a single day.

These raised concerns for the U.S. economy as many states were still under strict restrictive measures, and the economic activities there were still affected. The rising number of deaths might weigh more on the local currency. The U.S. dollar came under pressure and dragged the USD/JPY pair further on the downside.

Daily Technical Levels

Support   Resistance

104.13       104.54

103.95       104.77

103.72       104.95

Pivot point: 104.36

USD/JPY – Trading Tips

The USD/JPY has violated the sideways trading range of 104.600 – 104.200, and now it’s trading at 103.876 level. On the lower side, the pair has formed a triple bottom level, supporting the pair around 103.700 level. Investors seem to wait for the U.S. NFP and unemployment rate figures to determine further U.S. dollar trends. On the lower side, the USD/JPY may head towards the 103.200 level upon a bearish breakout of the 103.750 support level. While resistance stays at 104.350 today. Good luck

Categories
Forex Elliott Wave Forex Market Analysis

Is GBPUSD Preparing a Reversal Move?

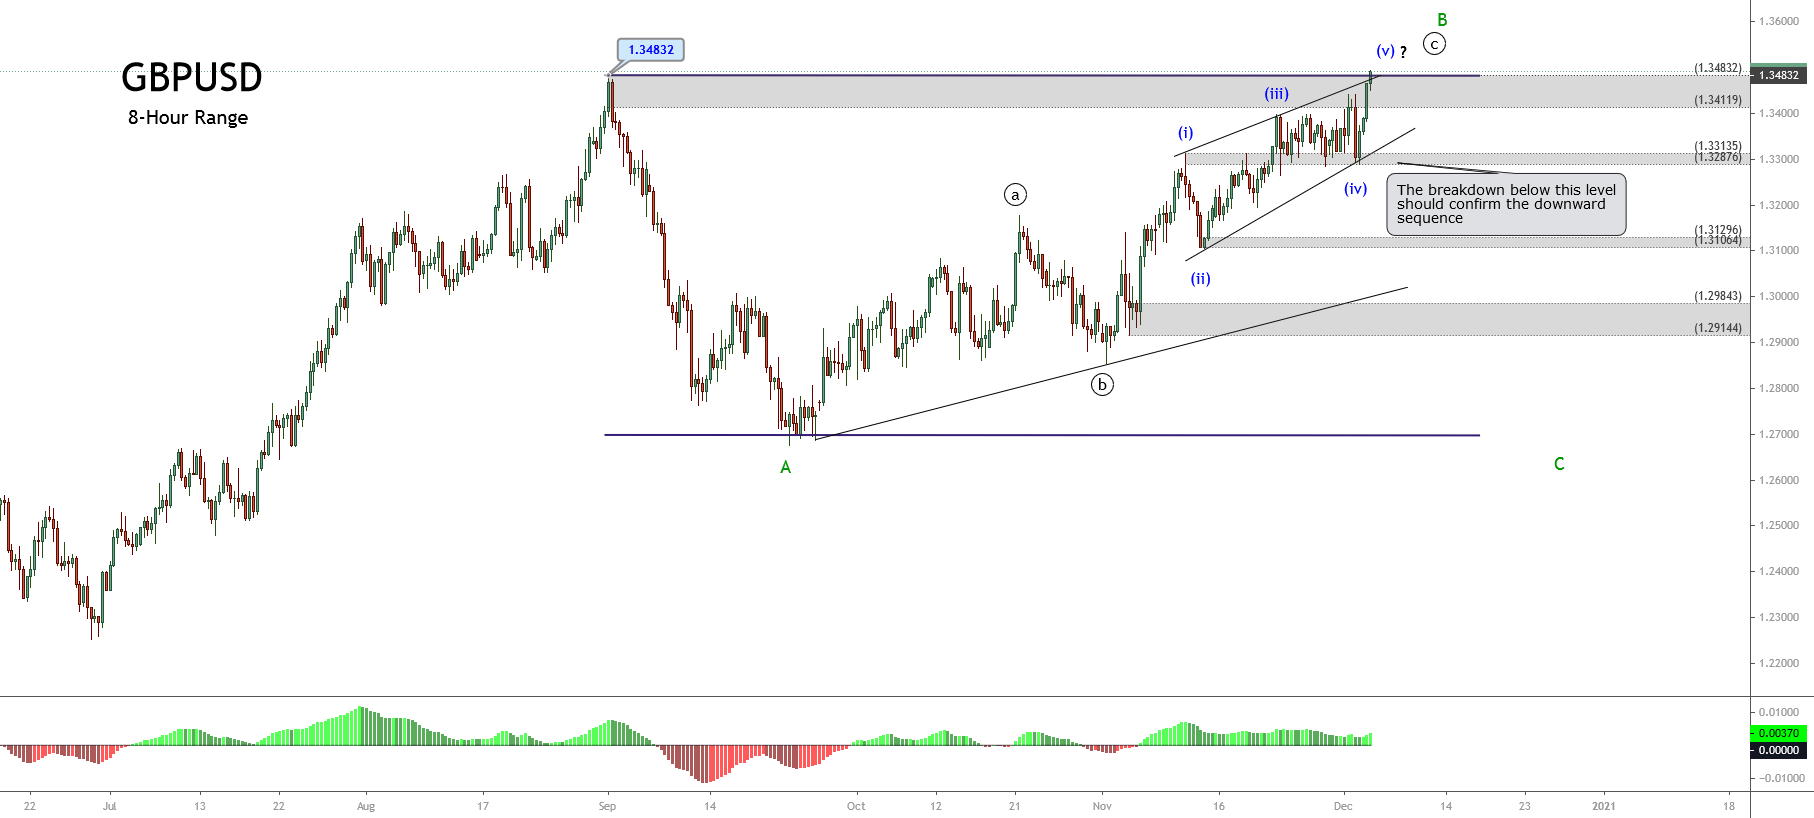
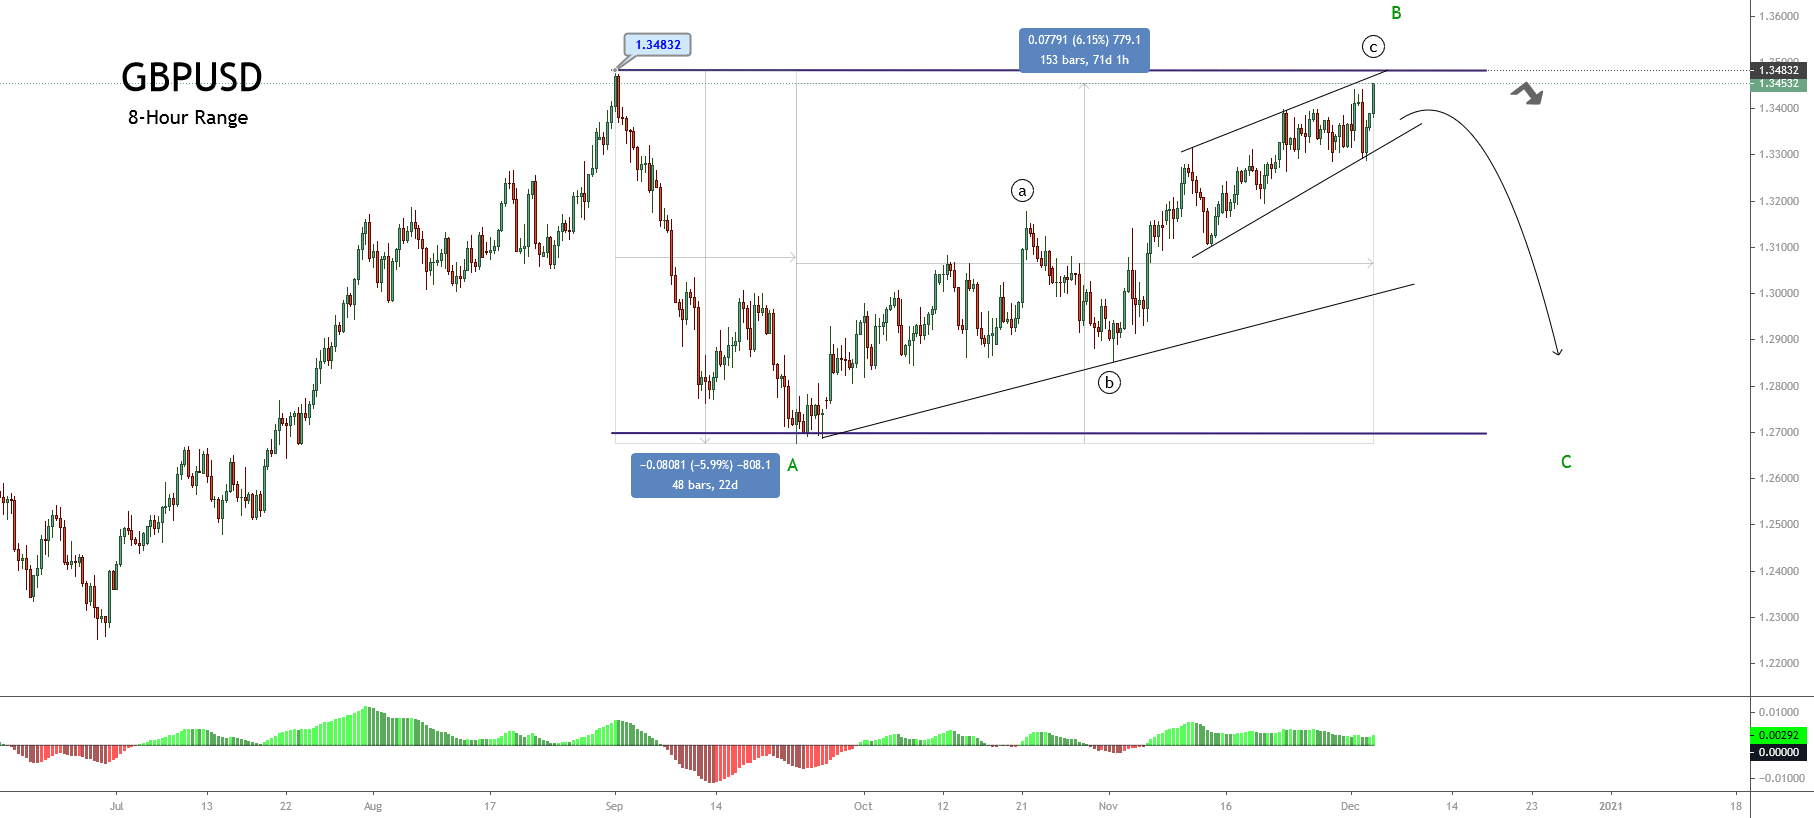
The GBPUSD pair is seen advancing in an ending diagonal pattern inside an incomplete flat pattern of Minor degree, identified in green, which is in progress since September 01st when the Sterling found resistance 1.34832. 


Technical Overview

The previous 8-hour chart exposes the advance in a potential flat pattern (3-3-5), which currently develops its wave B of Minor degree identified in green. In this context, once the current corrective rally ends, the next potential move, according to the Elliott Wave theory, could correspond the wave C. This movement should follow an internal structure subdivided into five wave segments.

Analyzing wave B’s internal structure, currently, we see the price advancing in its wave ((c)) of Minute degree labeled in black. In this context, according to the textbook, the pattern identified in the current wave ((c)) has the shape of an incomplete ending diagonal pattern.

On the other hand, looking at the price and time relationship presented in the first chart, it is interesting to compare the elapsed time of the current wave B with wave A. This comparison suggests that the current wave B can be thought of as a corrective rally; thus, the next move could become an aggressive decline. 

Nevertheless, considering that the current wave B remains in progress, the short-term bias is still on the bullish side.

Technical Outlook

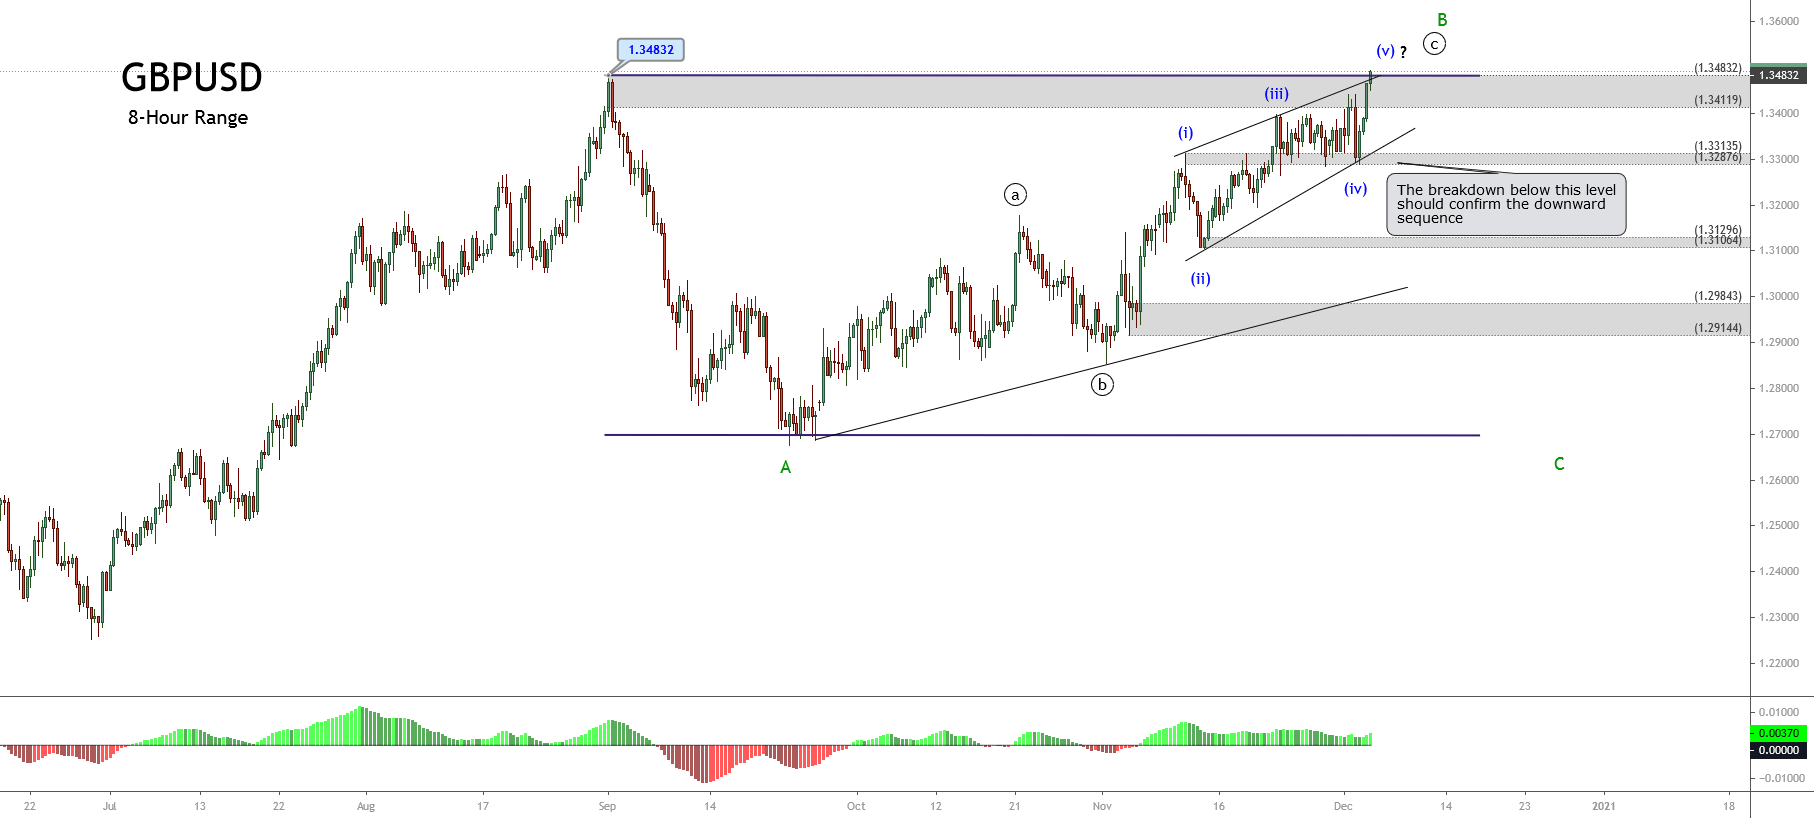
The next 8-hour chart shows the GBPUSD advance in its fifth wave of Minuette degree, labeled in blue, which belongs to the wave ((c)), in black, suggesting a terminal movement.

In this context, the price’s test of the upper sideways channel trendline suggests that the Pound Sterling could develop an expanded flat pattern. This Elliott Wave pattern’s implication makes us consider a strike over the origin of wave A located at 1.34832, where the pair should start to decline, developing its wave C in green.

Finally, both the ending diagonal pattern and the expanded flat pattern requires the pair to confirm the breakdown below the demand zone between 1.33135 and 1.32876. If the pair’s price action confirms this breakdown, it could move down up to the level of 1.29144.

Categories
Forex Market Analysis Forex Technical Analysis

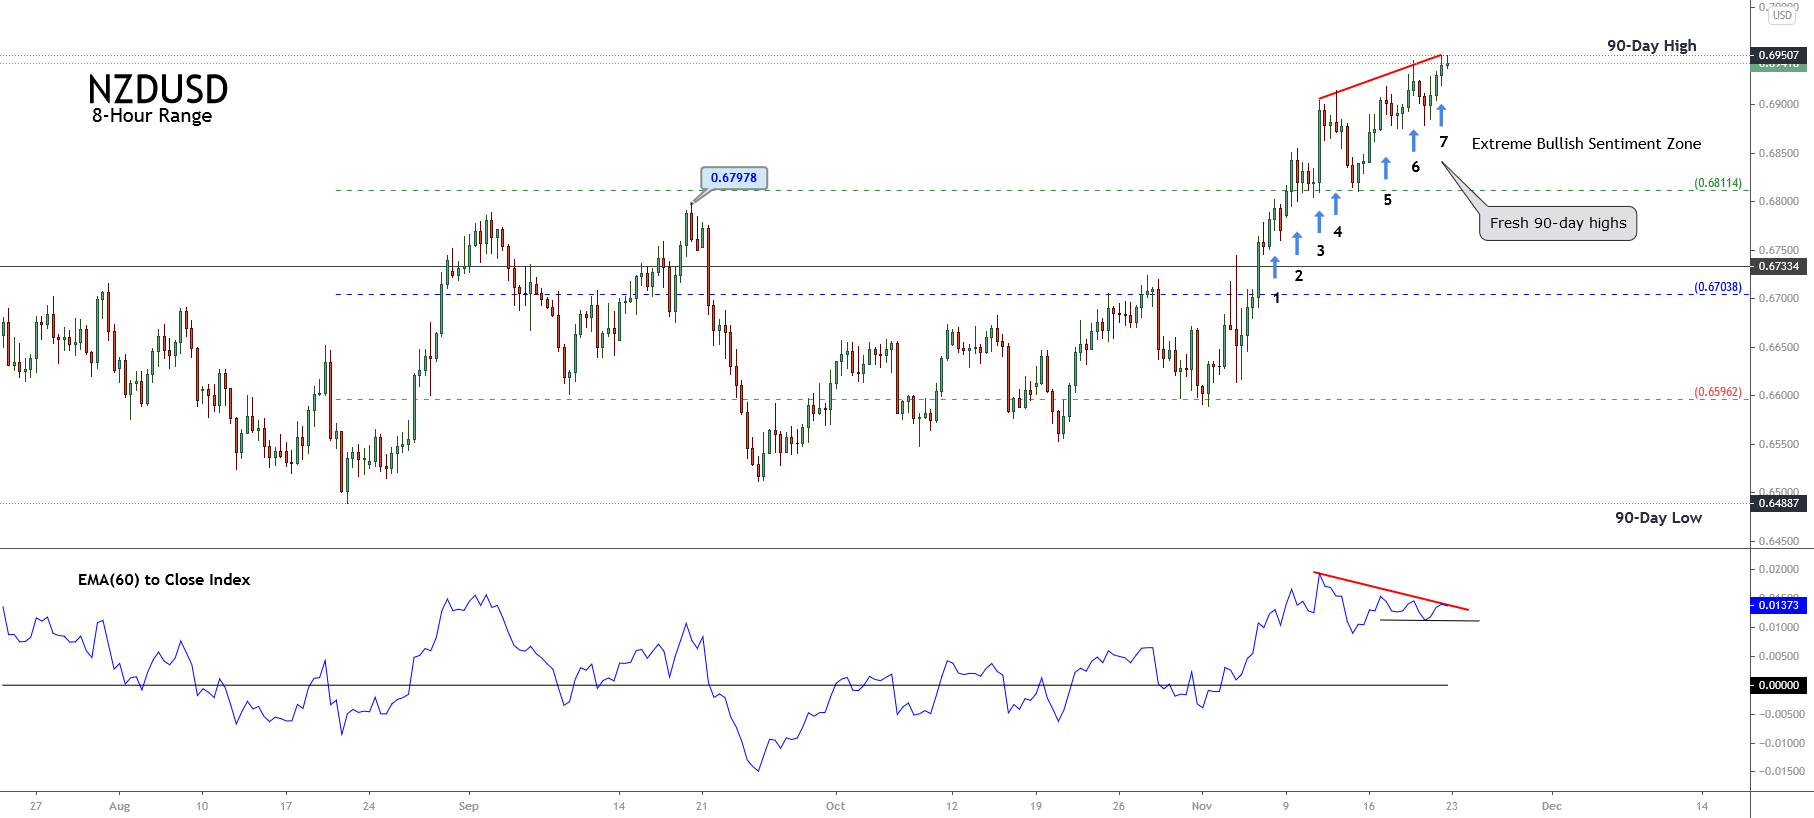
NZDJPY Fills the Gap Unfilled Since May 2019

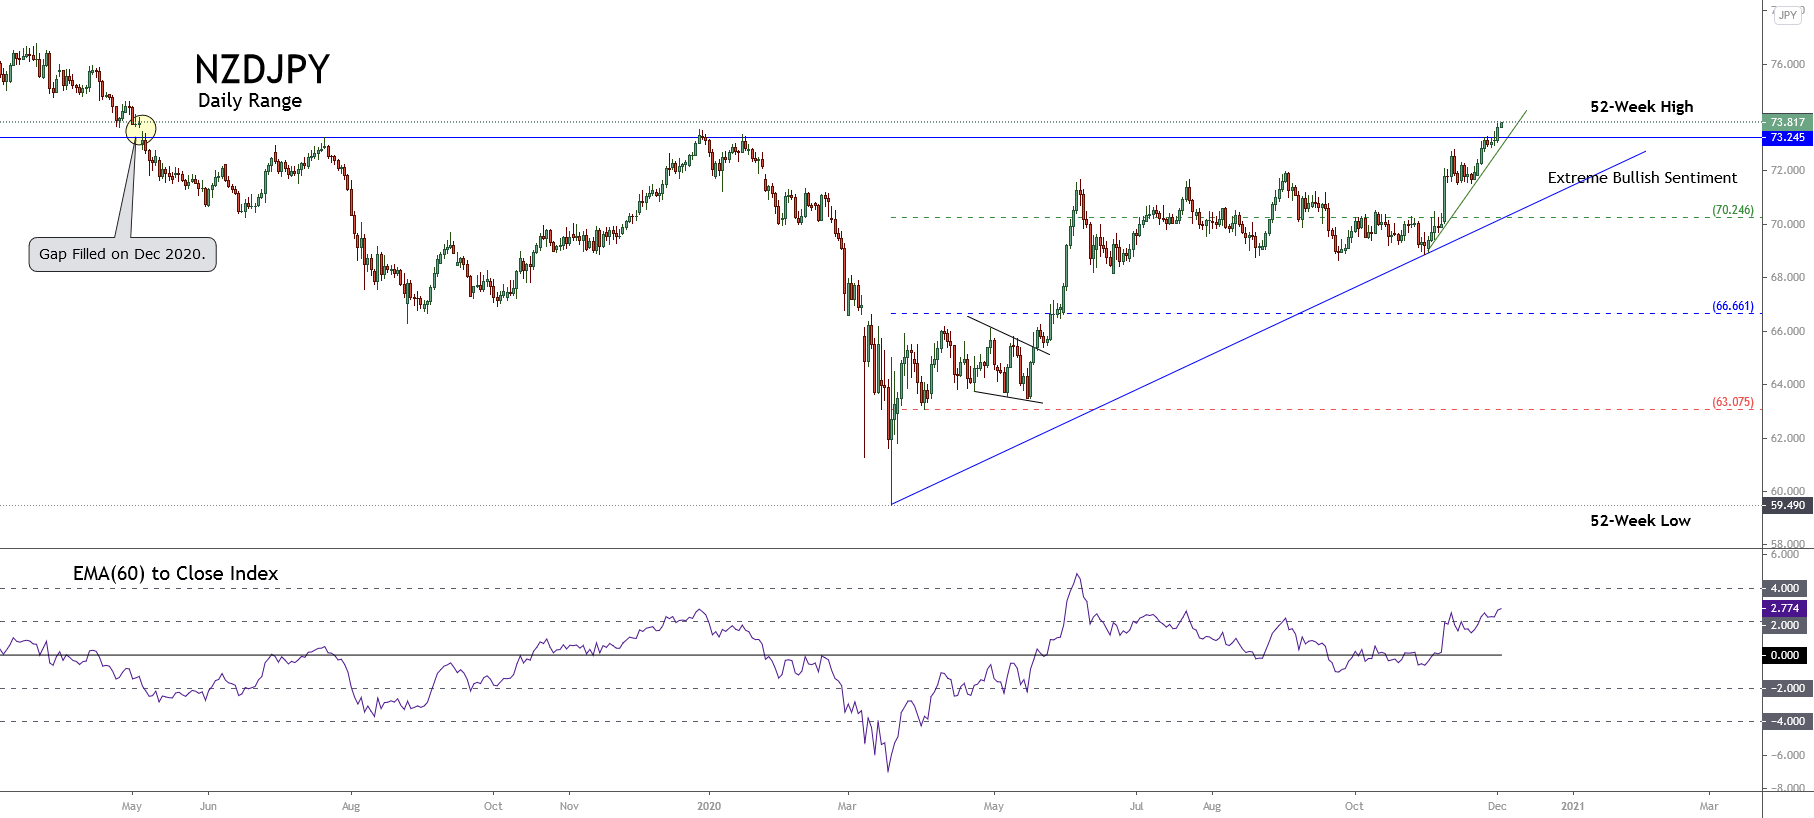
The NZDJPY advanced 5.70% in November, consolidating the price in the extreme bullish sentiment zone. Likewise, as illustrated in the following daily chart, during December’s kickoff trading, the cross reached the yearly high of 73.831, filling the gap that opened on May 06th, 2019.

Technical Overview

The previous chart also exposes the cross advancing in a mid-term uptrend drawn in blue, which remains active since last March 18th, when the price found support at 59.490. Likewise, we distinguish an accelerated short-term bullish trend plotted in green, which began in early November. 

The 2.774 reading observed in the EMA(60) to Close Index leads us to suspect that the impulsive bull market developed in the NZDJPY cross seems to be in an exhaustion stage. Therefore, the cross is likely to develop a reversal movement in the following trading sessions.  

Nevertheless, before taking a position on the bearish side, the price action must confirm the reversal movement. 

Technical Outlook

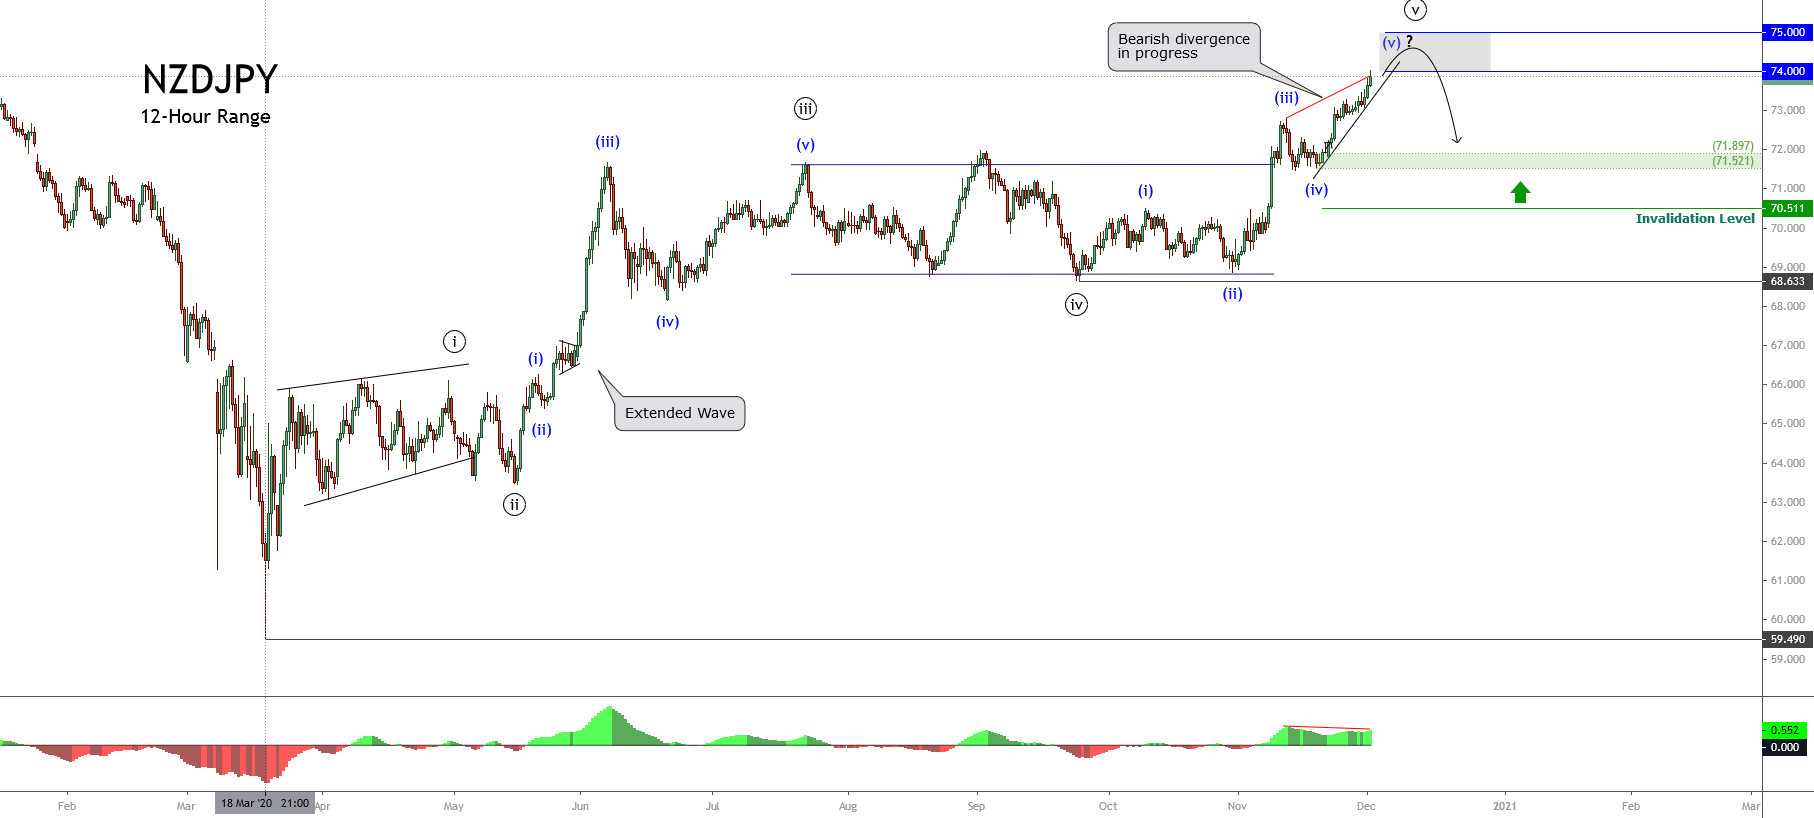
The following 12-hour chart presents the mid-term Elliott Wave view or the NZDJPY cross. The drawings reveal the cross advancing in an incomplete fifth wave of Minuette degree, labeled in blue that belongs to the fifth wave of Minute degree, in black.

NZDJPY’s price movements reveal an impulsive five-wave sequence of Minute degree identified in black, which began last March 18th, when the cross found fresh sellers after the massive sell-off developed in the global stock market. 
Likewise, once the extended third wave (in black) ended, the cross developed a sideways movement as a flat pattern, which found fresh buyers at 68.633. In this context, considering the Elliott Wave theory and that wave ((iii)) was the extended wave, the next impulsive wave ((v)) (in black) can’t be extended and should look similar to wave ((i)), also in black. 
On the other hand, watching the fifth wave’s internal structure (in black), the wave (ii) (in blue) looks like a complex correction, and the third wave is the extended movement. In this context, the current wave (v) (in blue), which is still in development, shouldn’t be an extended rally.

Consequently, the cross could complete its fifth wave of Minute degree in the area defined by the psychological levels between 74.00 and 75.00. Finally, until the cross shows evidence of a reversal, such as a bearish engulfing candle, we should consider the cross’ trend as bullish.

Categories
Forex Elliott Wave Forex Market Analysis

EURJPY Advances Toward Key Supply Zone

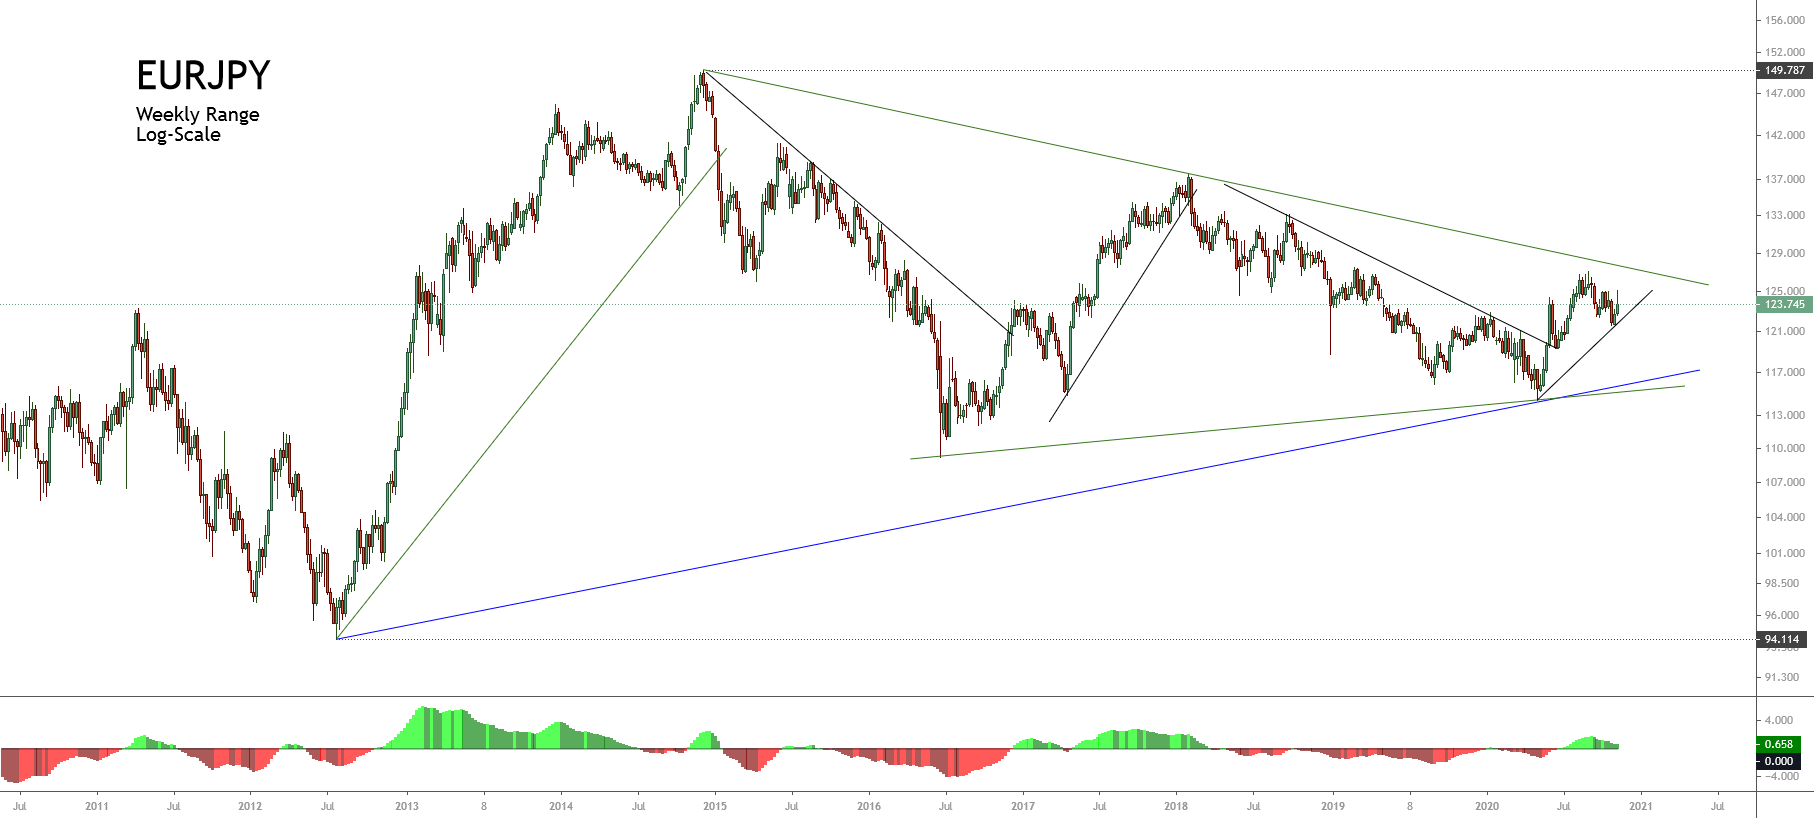
In our latest EURJPY analysis, we commented on its advance in an incomplete corrective structure identified as a triangle pattern, which remains in development since mid-2014.

Technical Overview

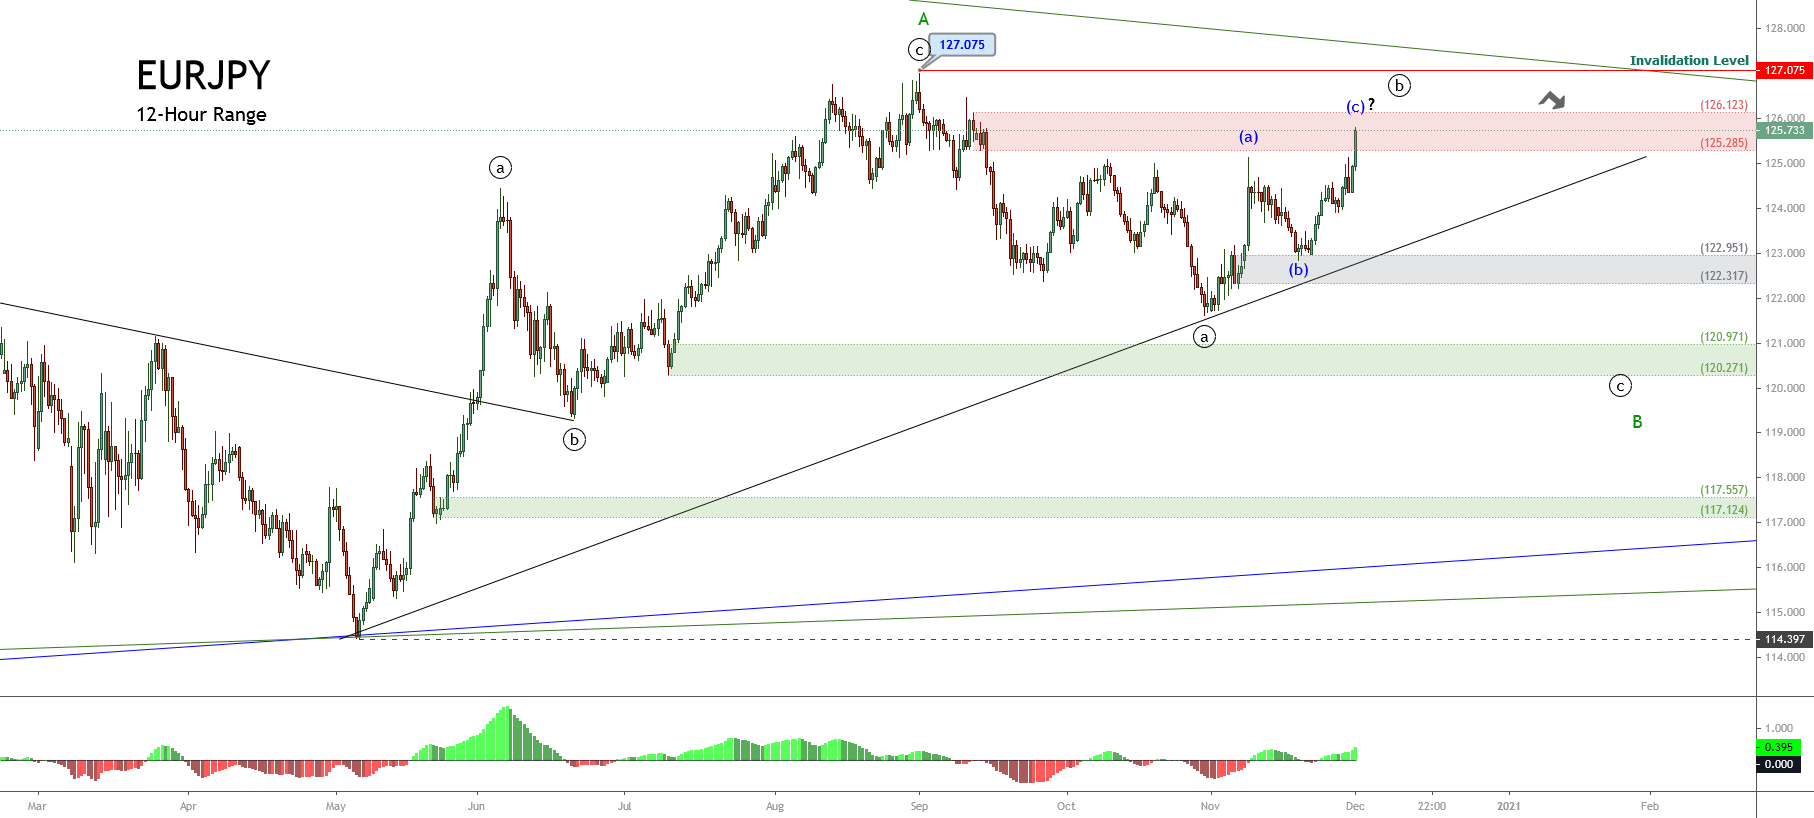
Also, we saw that the mid-term trend looks like an incomplete corrective structure, which seems to advance in a wave B of Minor degree, labeled in green. Moreover, the structure observed previously unveiled the progress in an incomplete wave ((b)), identified in black, which should develop a bounce toward the supply zone between 125.285 and 126.123.

The price action is currently seen advancing in its wave (c) of Minuette degree, labeled in blue, which has now reached the supply zone between 125.285 and 126.123 forecasted in our previous analysis.

On the other hand, the current wave (c), in blue, that remains in development could extend its gains toward the psychological barrier of 126, where the cross could start to decline to the wave ((c)), in black. This bearish sequence, possibly developed with five internal segments, should complete the wave B of Minor degree, in green.

Short- term Technical Outlook

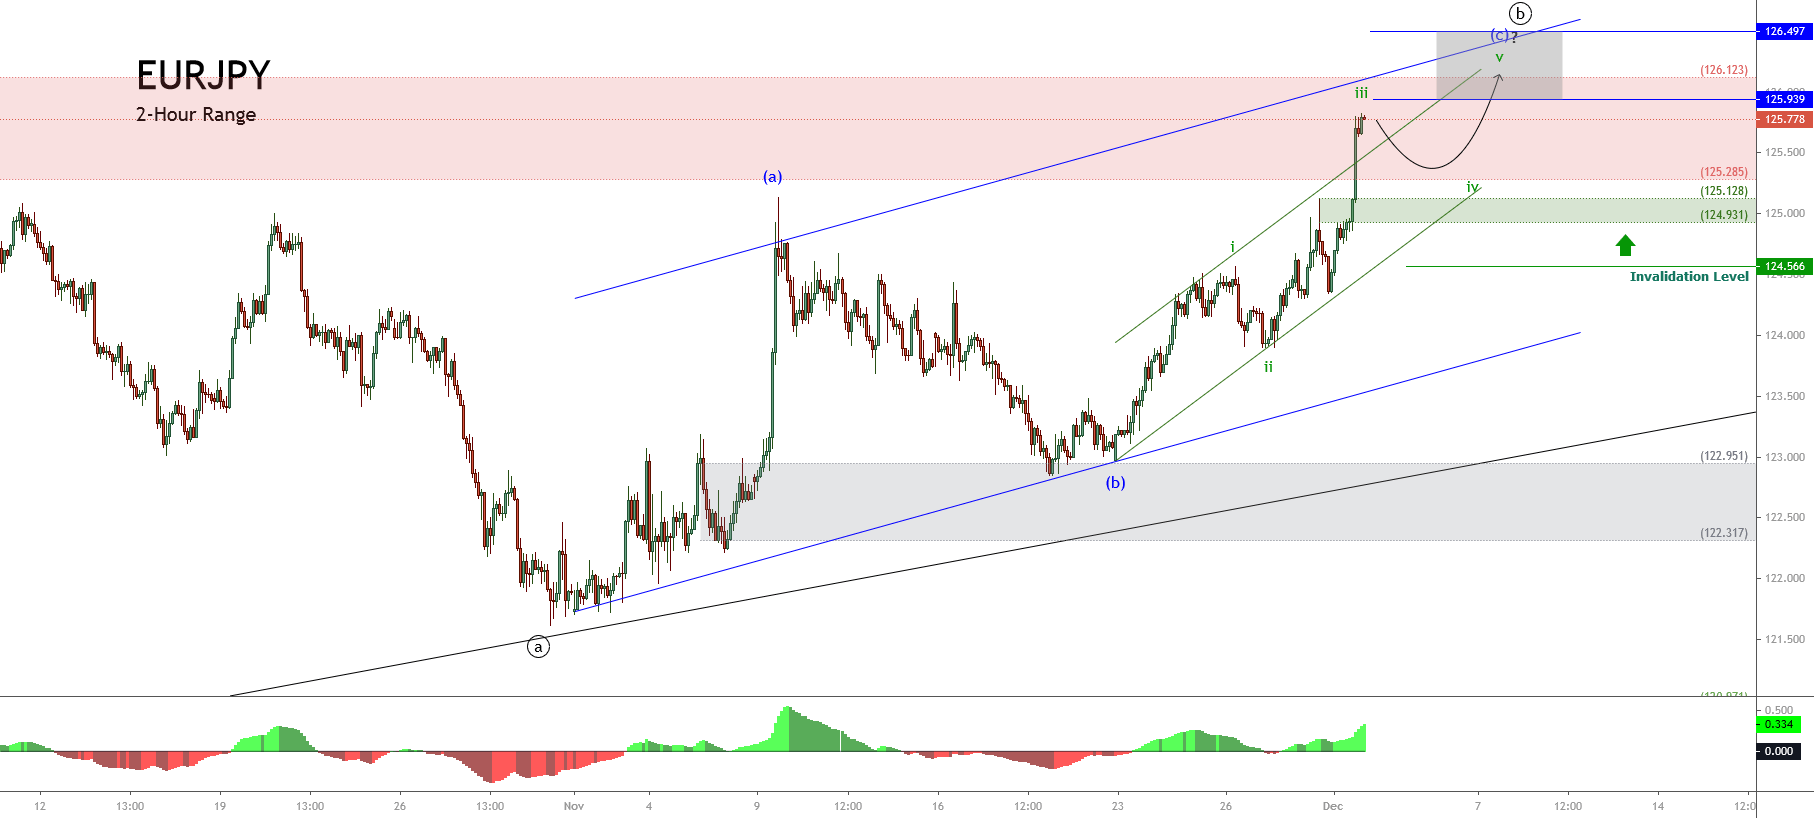
The EURJPY in its 2-hour chart reveals the internal structure created by the wave (c), in blue, which shows the intraday ascending channel plotted in green. The price action that has surpassed the ascending channel’s upper line suggests the rise of the third wave of Subminuette degree labeled in green that is in progress.

In this context, according to the Elliott Wave theory, once the EURJPY completes the advance of the third wave, in green, the cross should experience a limited decline corresponding to the fourth wave in green. This drop could reach the demand zone between 124.931 and 125.128, where the price could find fresh buyers expecting the price to head toward new highs.

The fifth wave’s potential target zone, in green, is located between 125.939 and 126.497. In this area, the cross could complete the wave ((b)) of Minute degree in black. 

Finally, the invalidation level of this intraday bullish scenario is found at 124.566, which corresponds to the top of the first wave of Minute degree.

Categories
Forex Elliott Wave Forex Market Analysis

Is AUDUSD Turning Bearish?

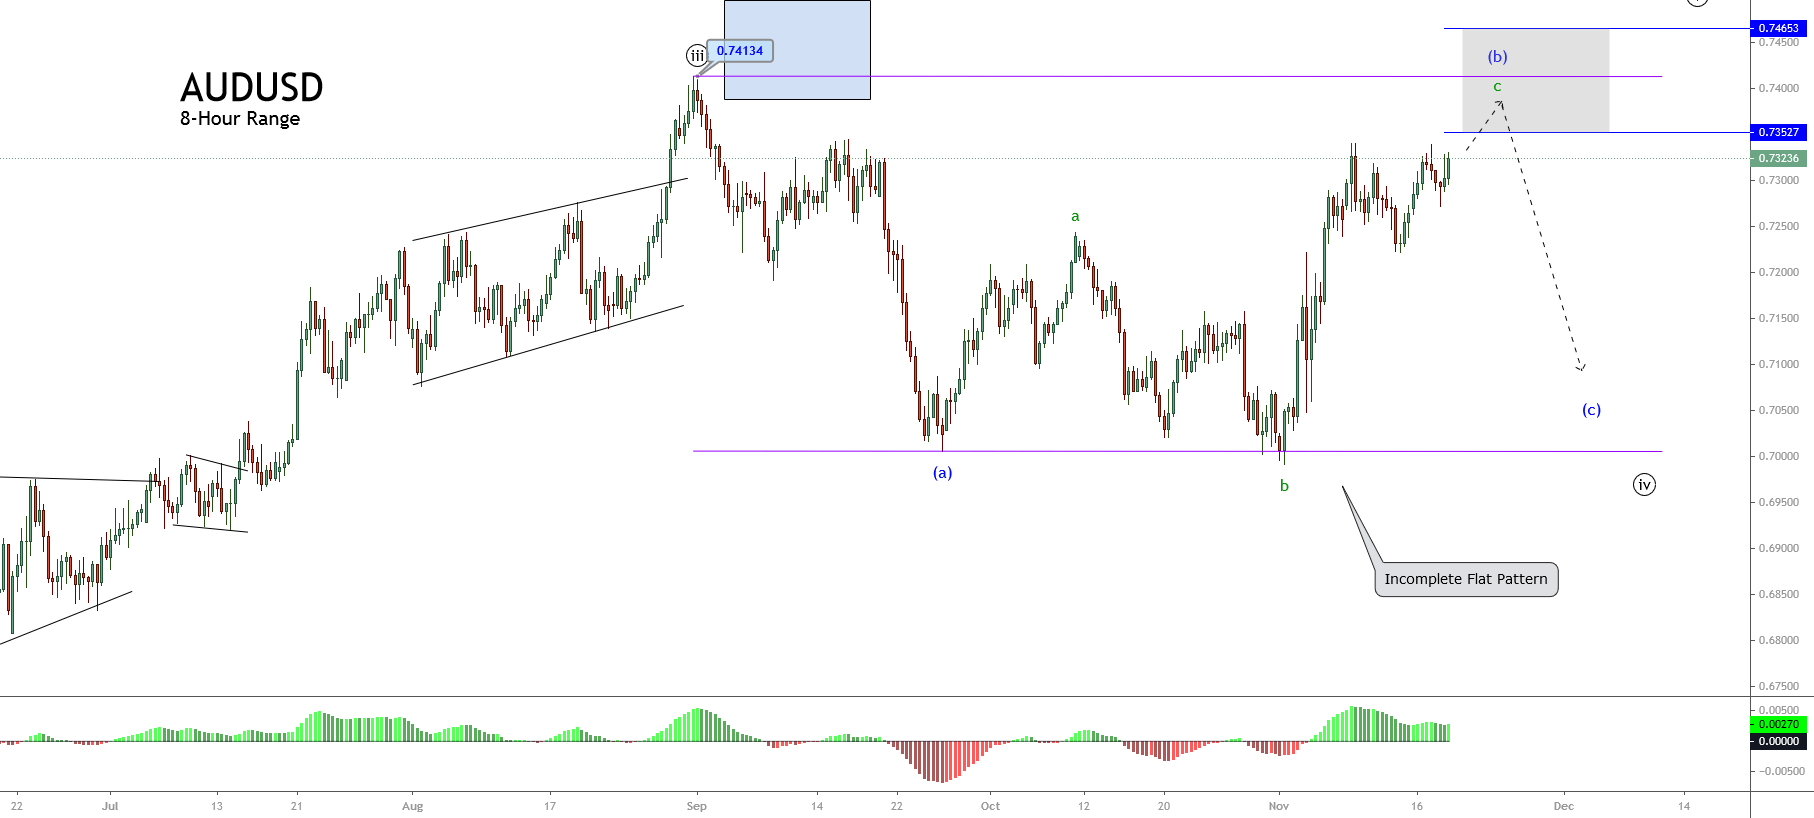
In our previous technical analysis of the AUDUSD pair, we mentioned the potential corrective formation that was developing. In particular, we warned about the progress of an incomplete fourth wave of Minute degree identified in black, in which the pair was advancing on the wave (b) of Minutette degree in blue.

Technical Overview

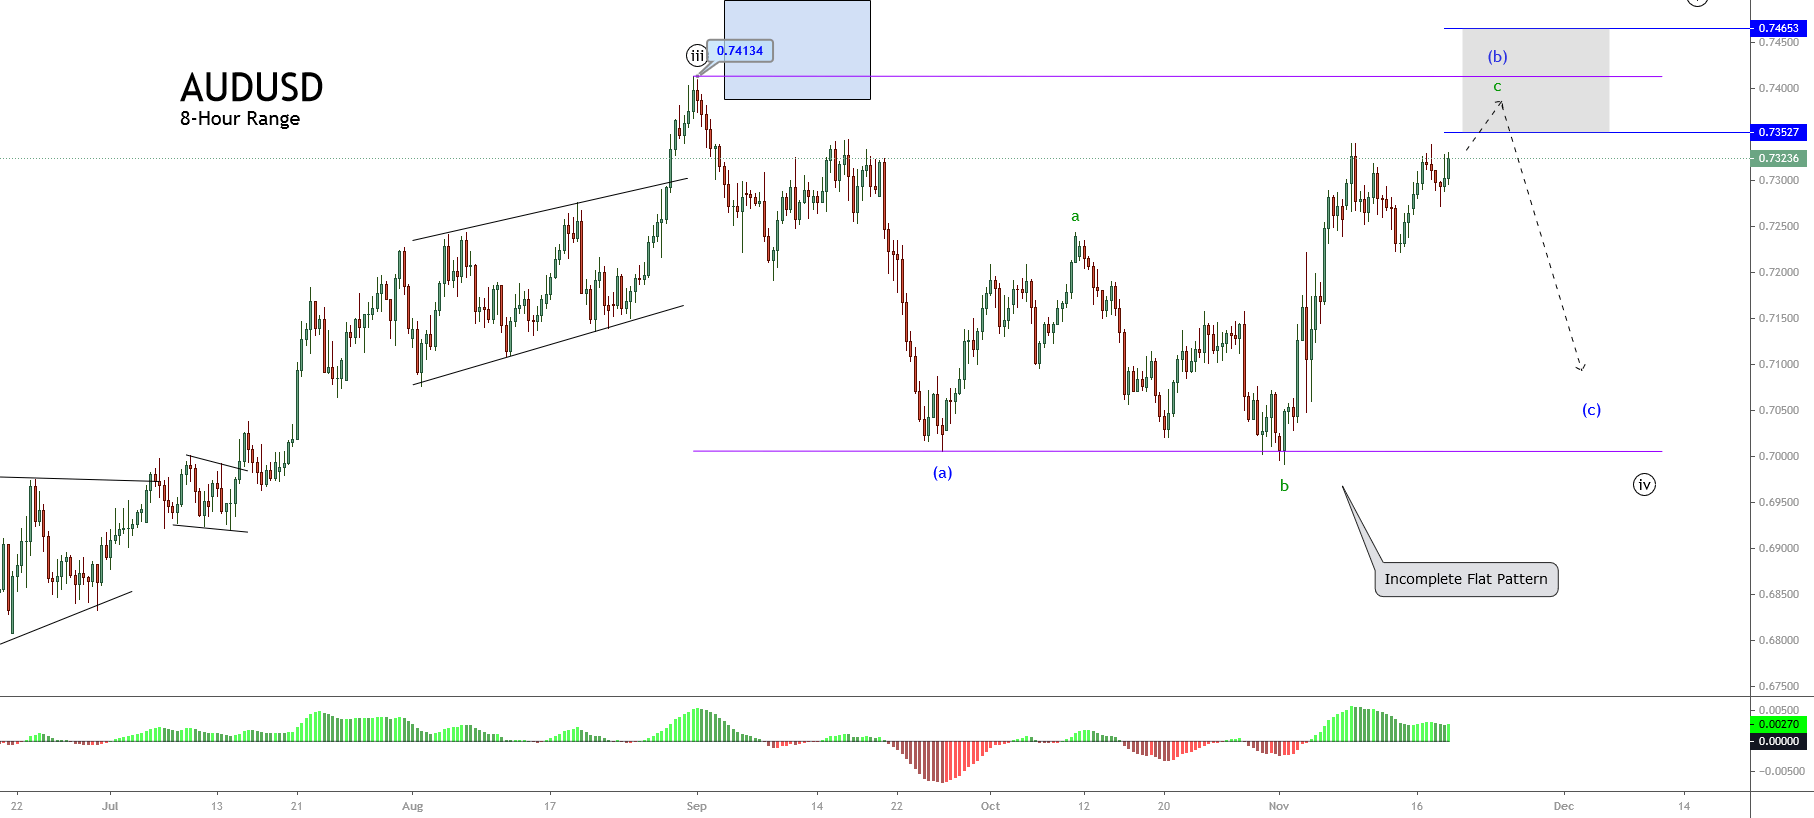
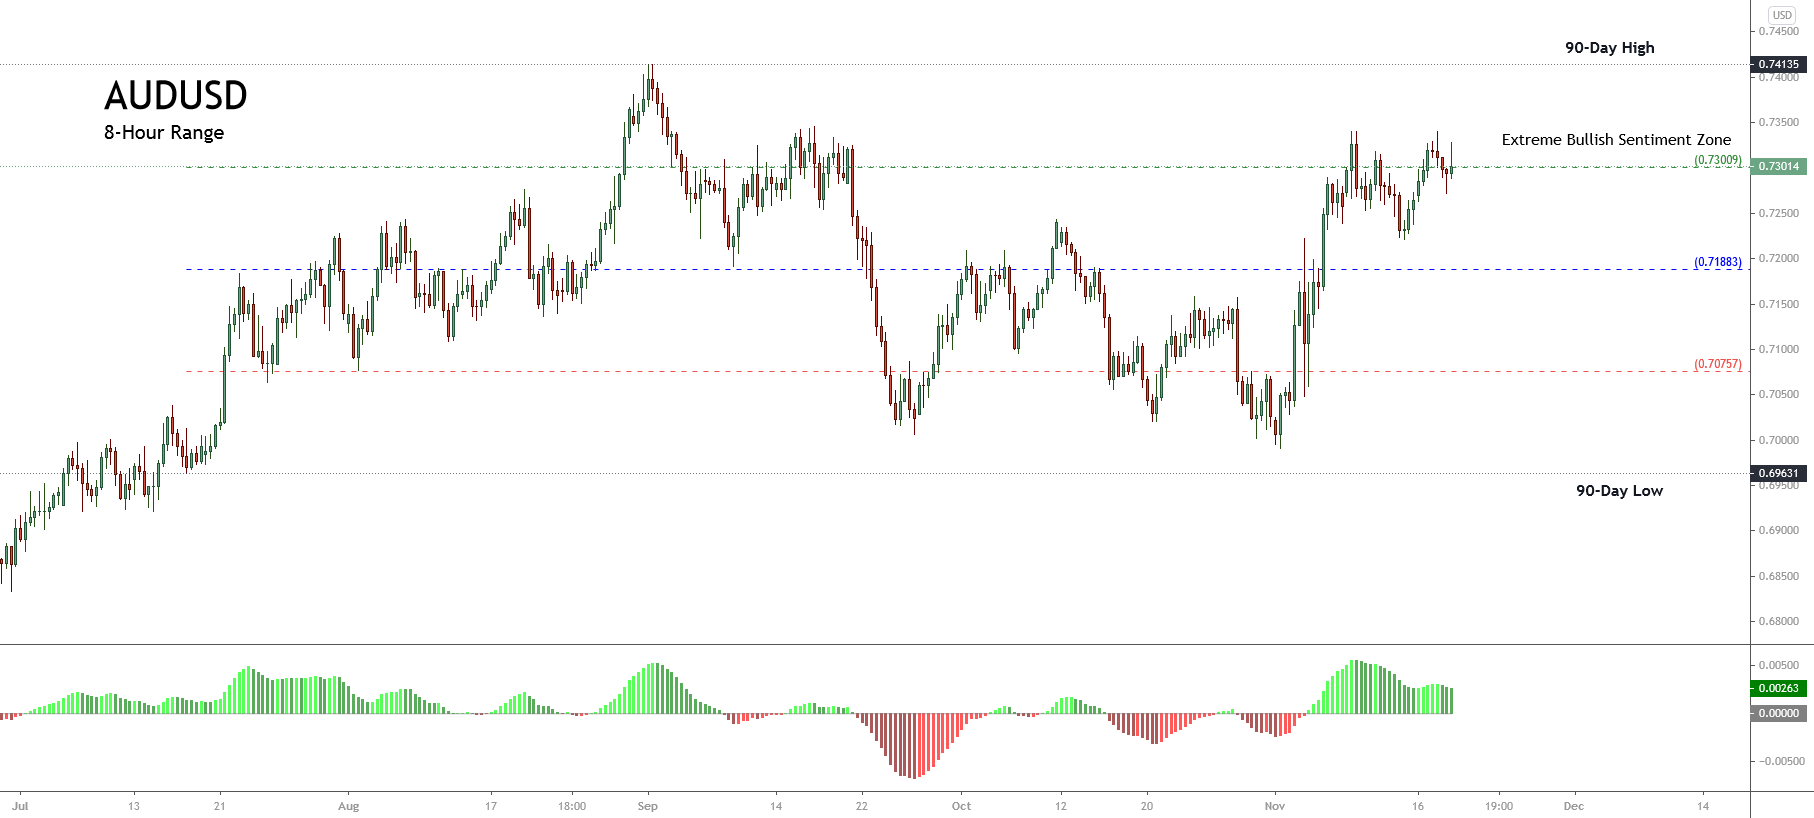
As the previous chart shows, the price action seems moving in a mid-term sideways channel. This formation has been evolving since early September, when the price topped at 0.74134. In terms of the Elliott Wave theory, the figure shows the progression of a likely incomplete flat pattern (3-3-5).

In this context, the bearish rejection below September’s high of 0.74134 should confirm the end of wave (b), in blue, and the beginning of wave (c). Also, according to Elliott’s textbook, the coming wave (c) should follow an internal sequence subdivided into five waves.

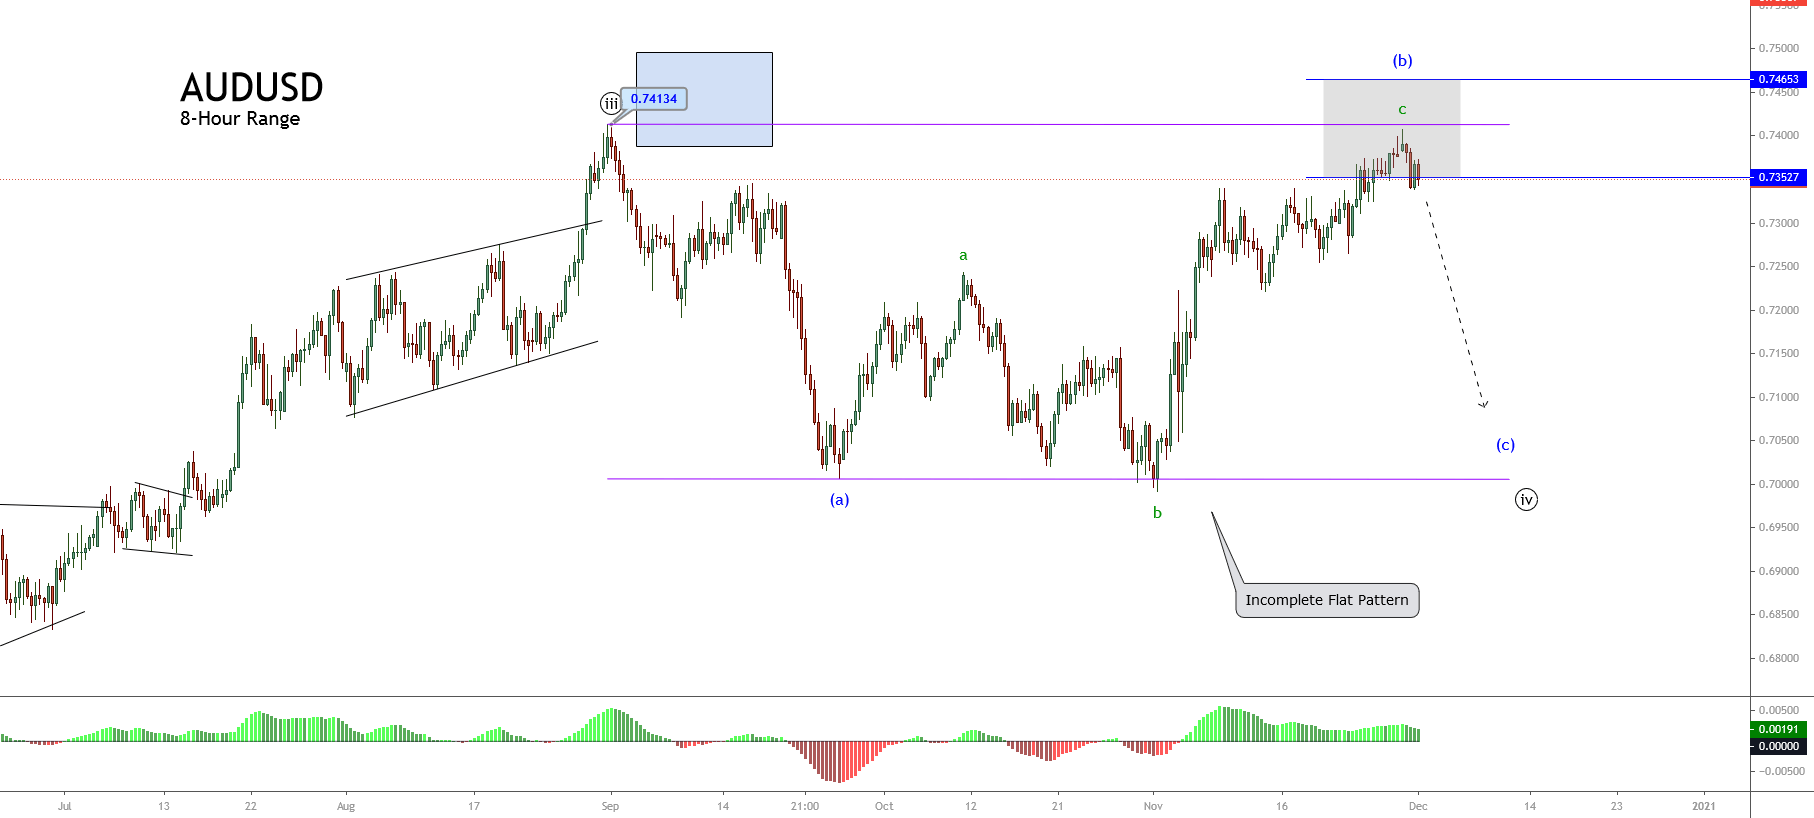
The big picture of the AUDUSD pair currently reveals the gray box’s rejection suggested in our previous analysis. From here, the Aussie could start to decline in a five-wave sequence corresponding to the already mentioned wave (c) of Minuette degree, labeled in blue. 

Moreover, after wave (c) completes, the Australian currency should also end its wave ((iv)) of Minute degree in black and giving way to a new impulsive wave corresponding to the fifth wave of the same degree.
Short-term Technical Outlook

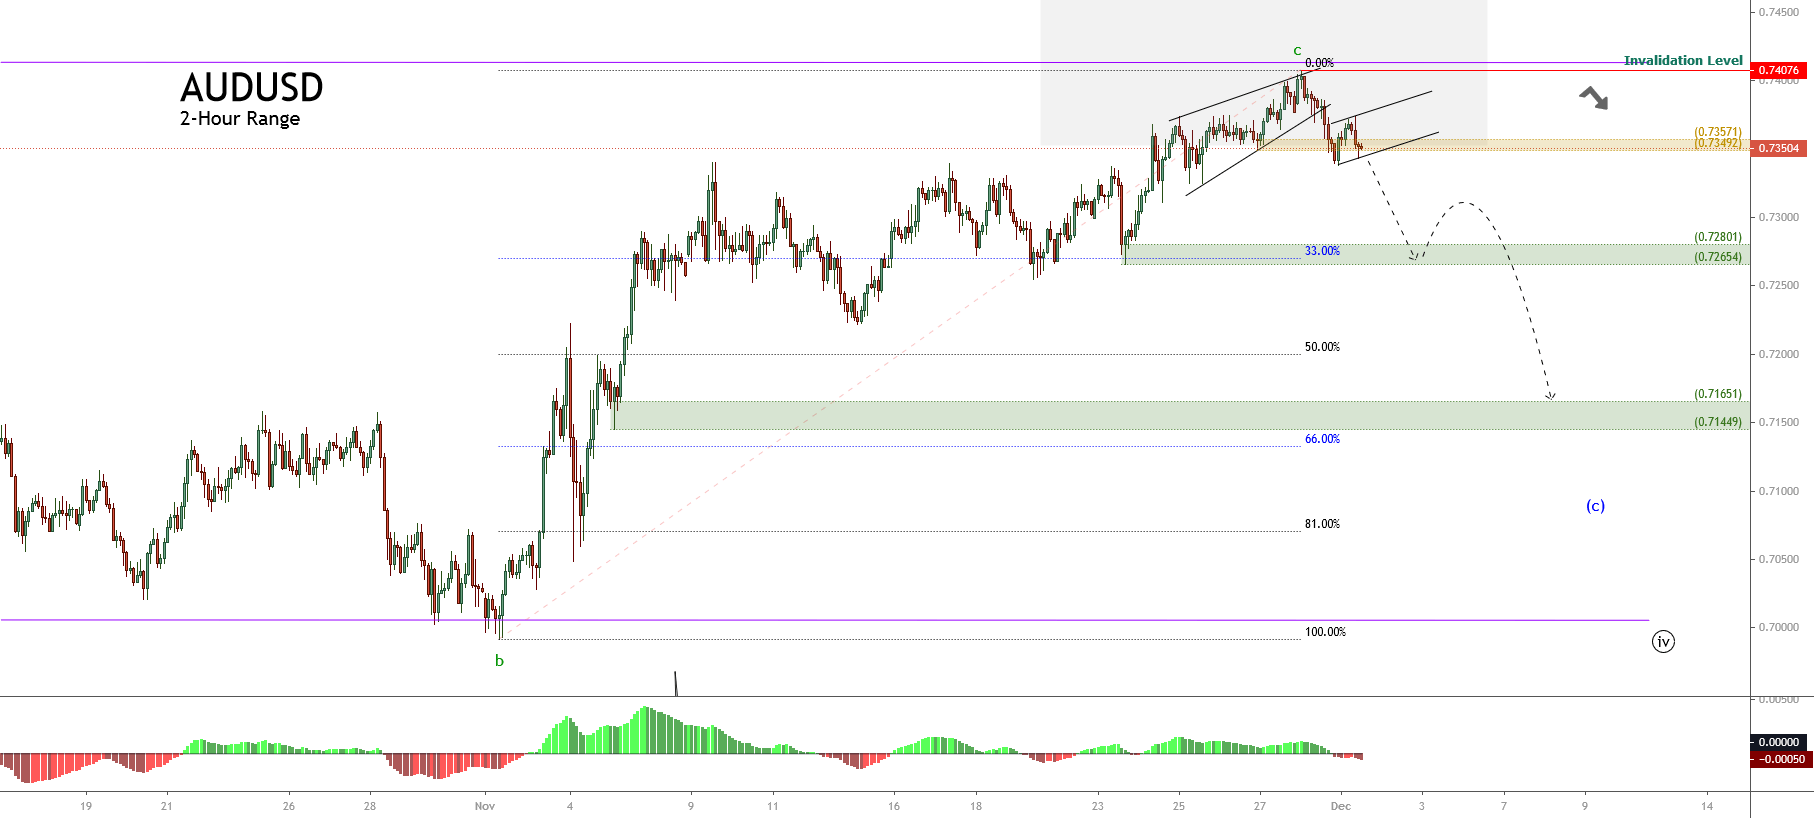
The AUDUSD price exposed in the next 2-hour chart reveals the completion of wave c of Subminuette degree identified in green, which topped at 0.74076 on November 30th, as the price action developed an ending diagonal pattern.

Once the price touched the psychological barrier of 0.74, the price began to decline, developing a breakdown below the baseline of the ending diagonal pattern, piercing the demand zone between 0.73492 and 1.73571, where the Aussie started a consolidation in the current trading session.

Considering that the pair started to consolidate, we expect an intraday sideways formation, likely a flag pattern. In this context, if the price breaks and closes below the baseline of this flag pattern, the AUDUSD could confirm the bearish continuation, which could make it drop to the next demand zone between 0.72654 and 0.72801.

Likewise, the price could extend its declines toward the next demand zone between 0.71449 and 0.71651. The movement, developed into a five-wave sequence, should complete the wave (c) of Minuette degree identified in blue, which, at the same time, could confirm the end of wave ((iv)) of Minute degree labeled in black, as we said earlier.

The invalidation level corresponding to this downward scenario is placed at the high of wave c, in green,  0.74076.

Categories
Forex Elliott Wave Forex Market Analysis Forex Signals

Is EURNZD Developing a Terminal Formation?

The EURNZD cross presents a downward sequence in its 12-hour chart that began on August 20th when the price found fresh sellers at 1.82238. This sequence formed three internal segments and, recently, is likely forming a reversal movement in the following trading sessions.

Technical Overview

The previous chart illustrates the bearish primary trend identified with the descending trendline, drawn in blue. Moreover, the secondary trend, plotted in green, reveals an aggressive decline that is happening since October 20th when the cross found resistance at 1.80212. But we see all that the EURNZD price seems to have found support on November 23rd on 1.69472. Currently, the price action appears consolidating in a narrow range between 1.69622 and 1.70645.

In Elliott Wave theory terms, the cross is advancing in an incomplete downward corrective sequence of Minute degree identified in black, which currently is drawing its wave ((c)). Likewise, its internal structure suggests the progress in the fifth wave of Minuette degree labeled in blue.

The following 2-hour chart reveals the EURNZD cross is moving mostly sideways following a descending wedge breakout, or in terms of the Elliott Wave theory, an ending diagonal breakout. 

Nevertheless, the bullish reversal is still unconfirmed as long as the cross keeps moving below the level of 1.70486.

Short-term Technical Outlook

The EURNZD cross shown in its 2-hour chart below presents a sideways movement below the pivot level of 1.70486, which could correspond to the fifth wave of Minuette degree, labeled in blue. 

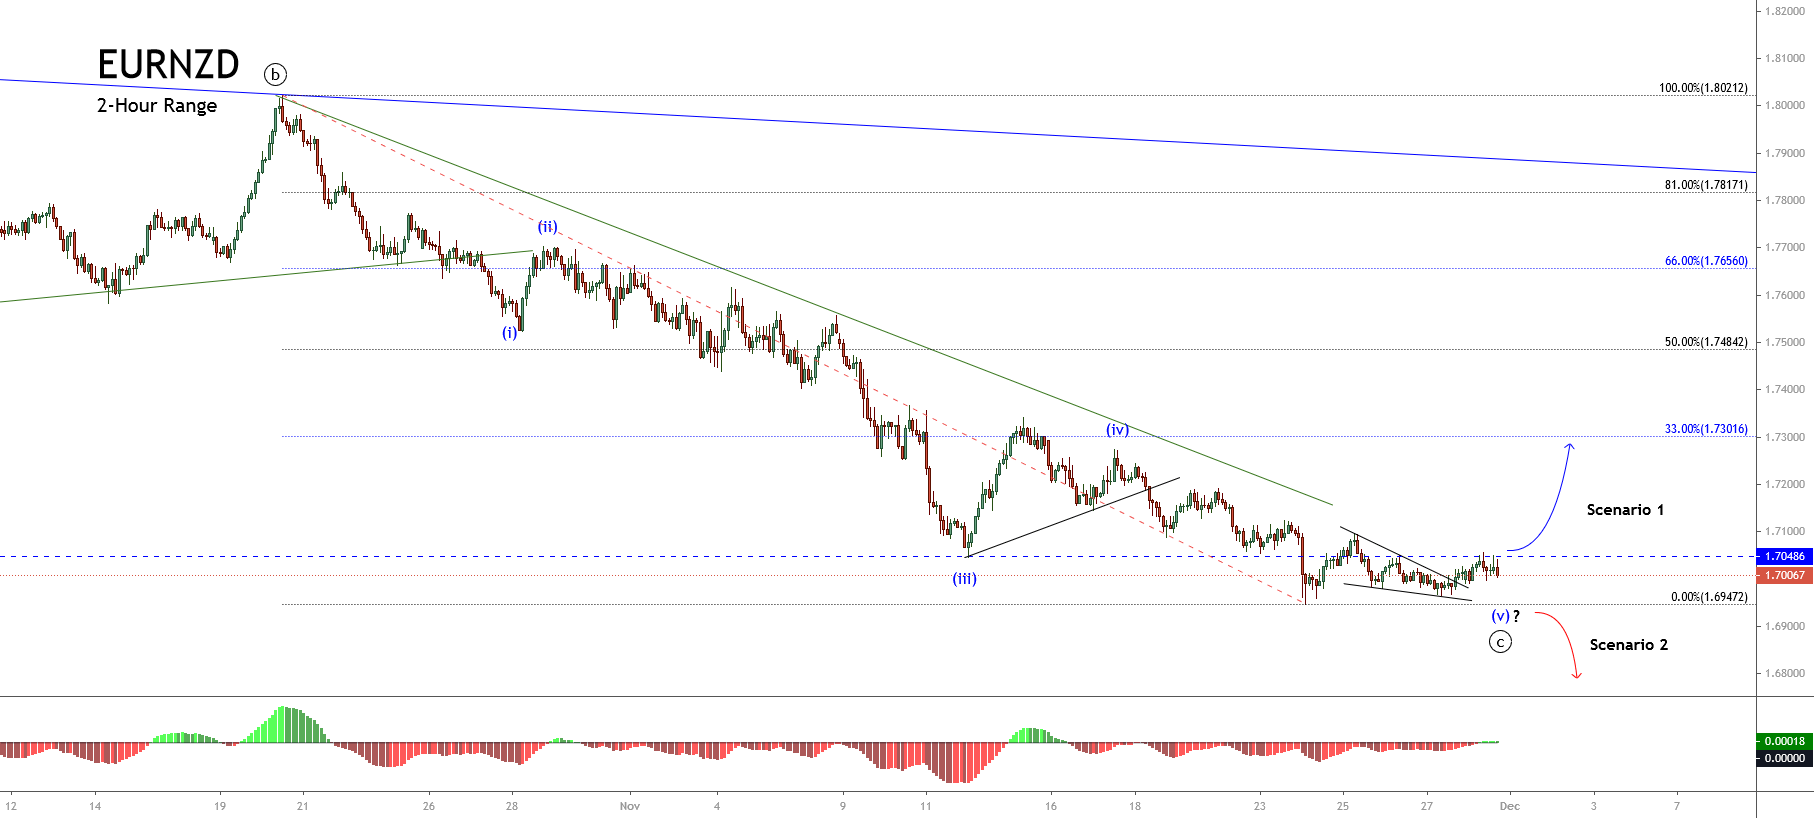
Considering that the cross remains in a consolidation structure, there are two potential scenarios:

  • The first scenario occurs if the price action breaks and closes above the 1.70486 pivot level. In this case, the EURNZD could develop an upward movement. According to the Dow Theory, the cross should make an upward motion to the area between 1.73016 and 1.76560. Likewise, the invalidation level for this reversal scenario is seen on 1.69472, which corresponds to the low made on November 24th.
  • The second scenario calls for the price to drop and close below the 1.69472 level. If that happens, the cross could continue its decline toward the lows zone made in January, near the 1.6650 level. The price could find support and complete the wave ((c)) of Minute degree labeled in black. In this scenario, the invalidation level would be located above the last relevant swing high of 1.70961.

However, let’s remember that as long as the price doesn’t confirm any breakout, bullish, or bearish, the bias should be kept neutral.

Categories
Forex Elliott Wave Forex Market Analysis Forex Price Action Forex Technical Analysis

Is EURGBP Ready for a Fresh Rally?

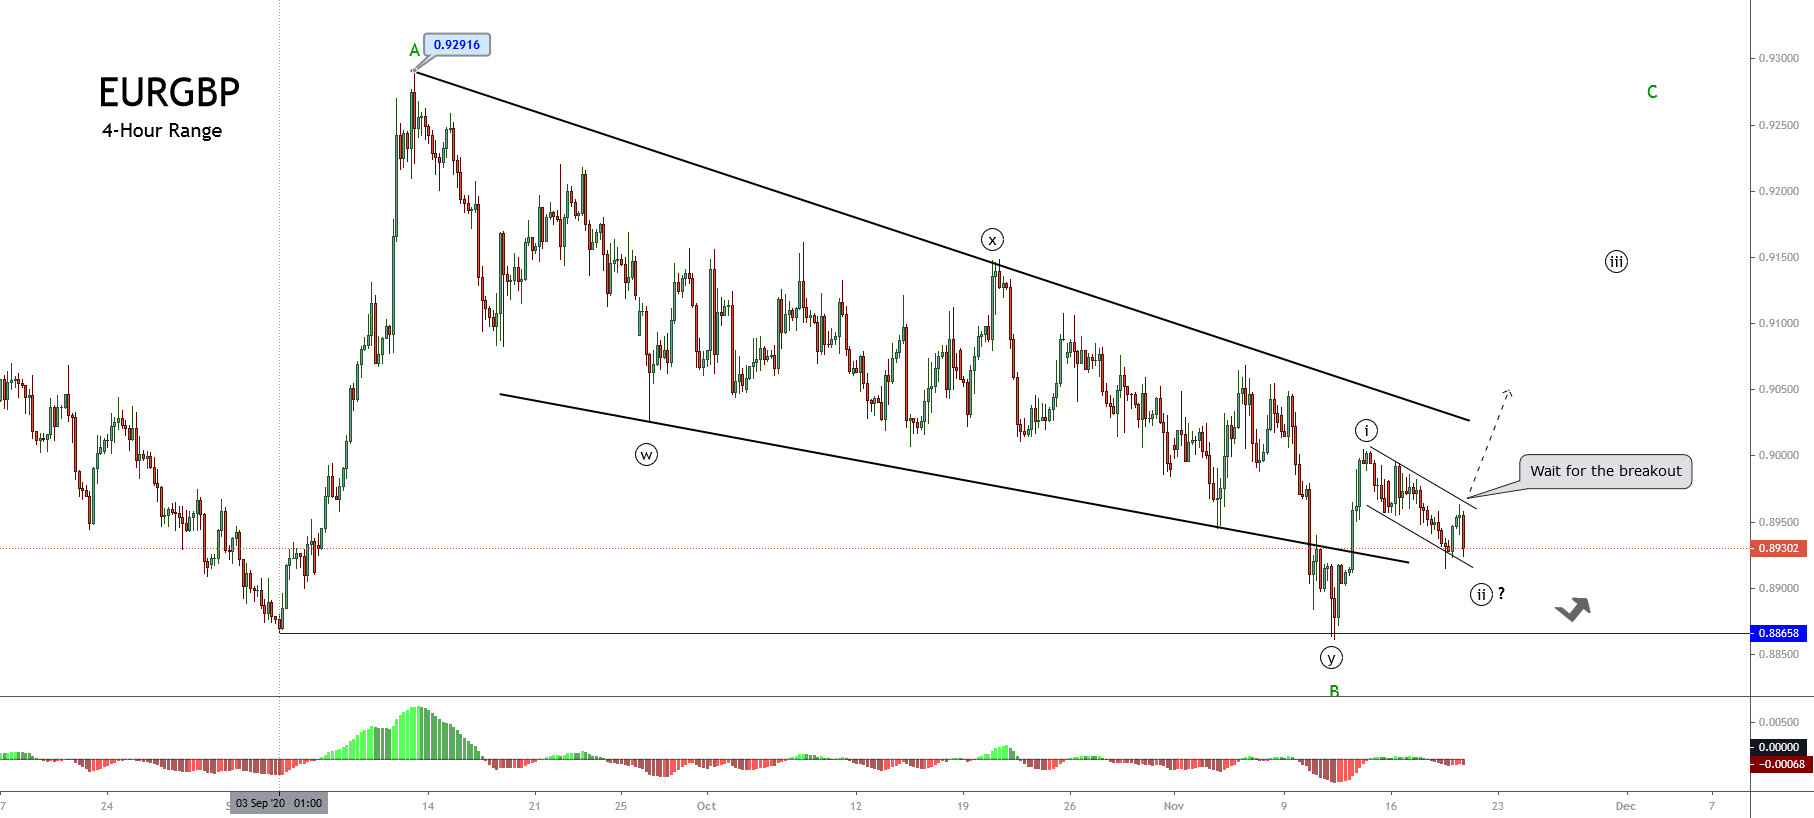
In our latest EURGBP technical analysis, we commented on the cross moving in an incomplete sideways corrective formation of Minor degree, identified in green. Its internal structure suggested the completion of a double-three pattern of Minute degree.

Also, we saw the pierce and bounce of the September 03rd low at 0.8658, when EURGBP dropped to 0.88610, found fresh buyers there, and created an intraday impulsive move identified as the first wave of Minute degree, labeled in black.

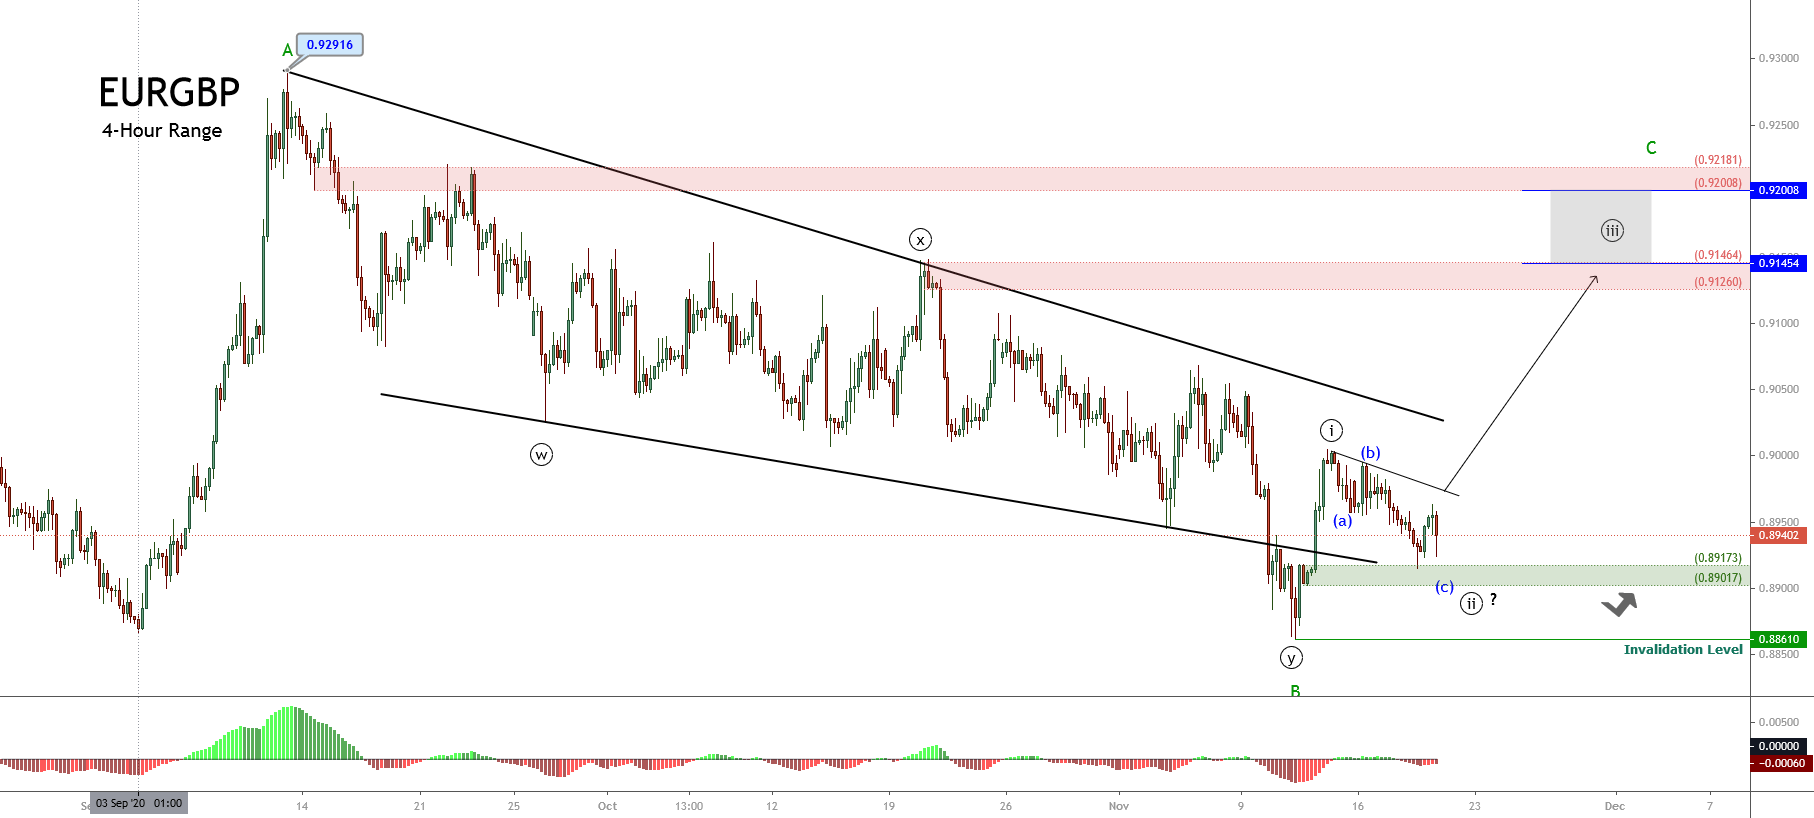
As the next 4-hour chart shows, once the EURGBP cross completed its first wave, in black that belongs to wave C, in green, it reacted mostly bearish, developing a correction, extending the move below our forecasted area, and testing the lows of the previous bullish impulsive move.

The breakout of the short-term descending trendline confirmed the end of wave ((ii)) of Minute degree and the beginning of the third wave of the same degree, which remains in progress.

Likewise, in the last chart, we distinguish the advance of the third wave of Minuette degree identified in blue in its internal structure.

Short-term Technical Outlook

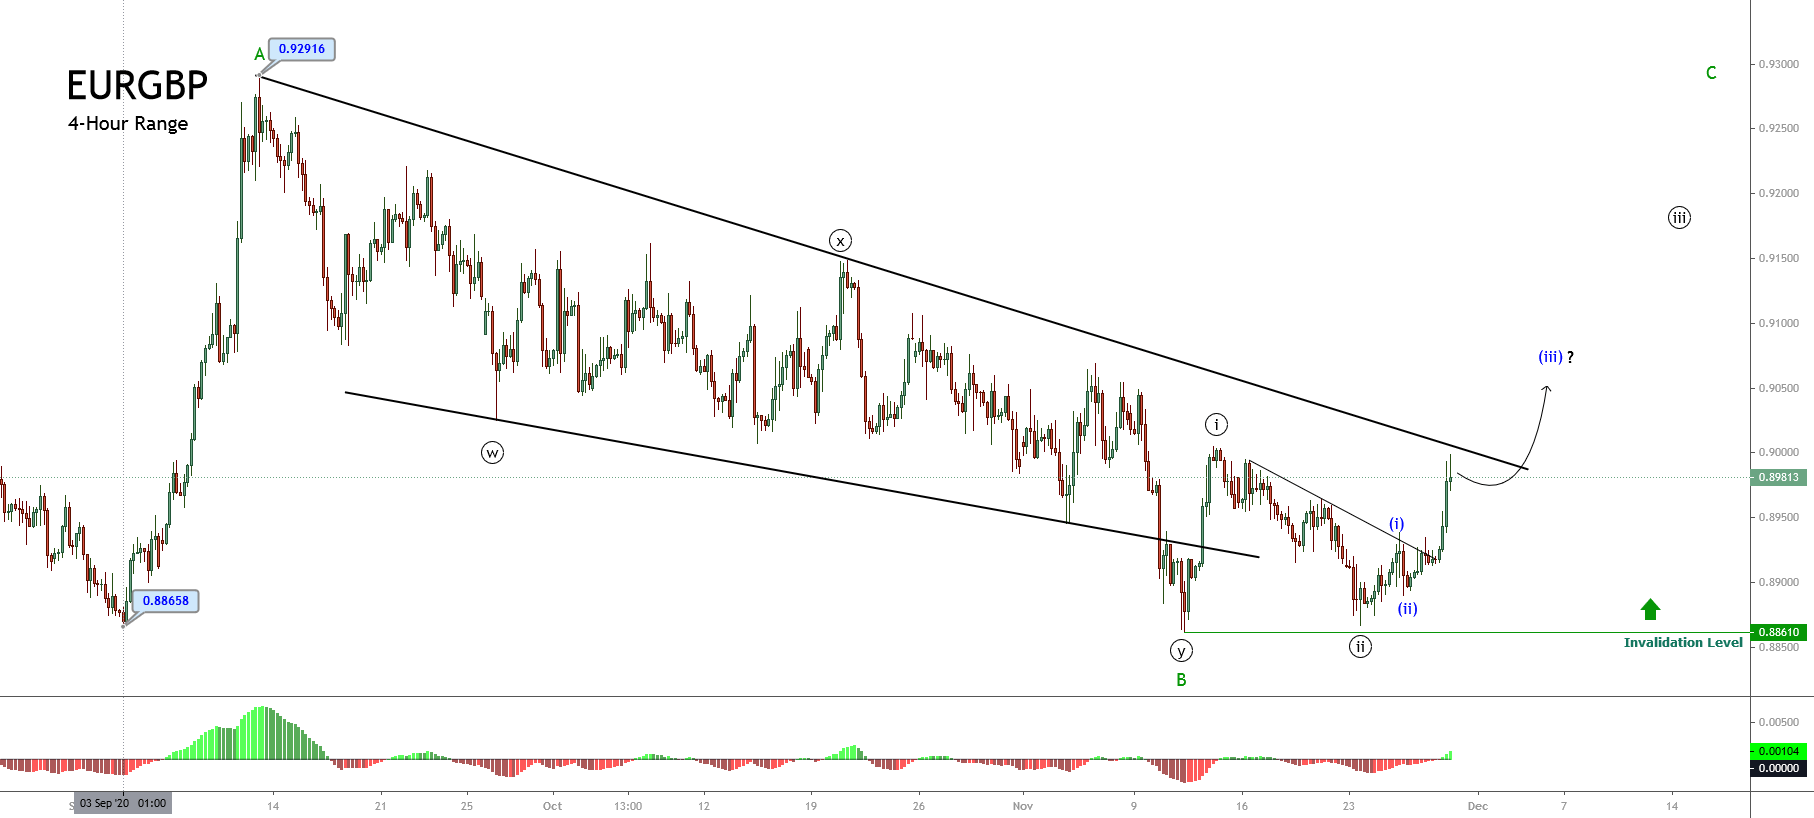
The short-term Elliott Wave view of the EURGBP cross, unveiled in the below 4-hour chart, reveals the breakout of the descending trendline that follows the wave ((ii)) identified in black, which suggests the beginning of a new rally.

Once the price found fresh buyers at 0.88998, the cross began to advance mostly bullish in an impulsive sequence of Minuette degree, identified in blue, that remains in progress. This upward move corresponds to the internal structural series of wave ((iii)) of Minute degree that belongs to wave C of Minor degree, in green.

Furthermore, considering the reduced period it took for the first stage of wave (iii) to complete, It is plausible that the third wave in progress will be the extended wave, as the Elliott Wave theory states that only one extended wave would occur in an impulsive structure. 

In this context, the current upward move could advance to the next supply zone between 0.90446 until 0.90686. But, if the cross maintains its bullish momentum, it could strike the next potential target zone between 0.91260 and 0.91464.

Finally, the current bullish scenario’s invalidation level is 0.88610, which corresponds to the origin of the wave C in green.


Categories
Forex Elliott Wave Forex Market Analysis

EURJPY Advances from Demand Zone Forecasted

In mid-November, we commented about the technical market context of the EURJPY cross, as its big picture displayed in its weekly chart revealed a technical formation identified as a triangle pattern, which continues progressing since mid-2014.

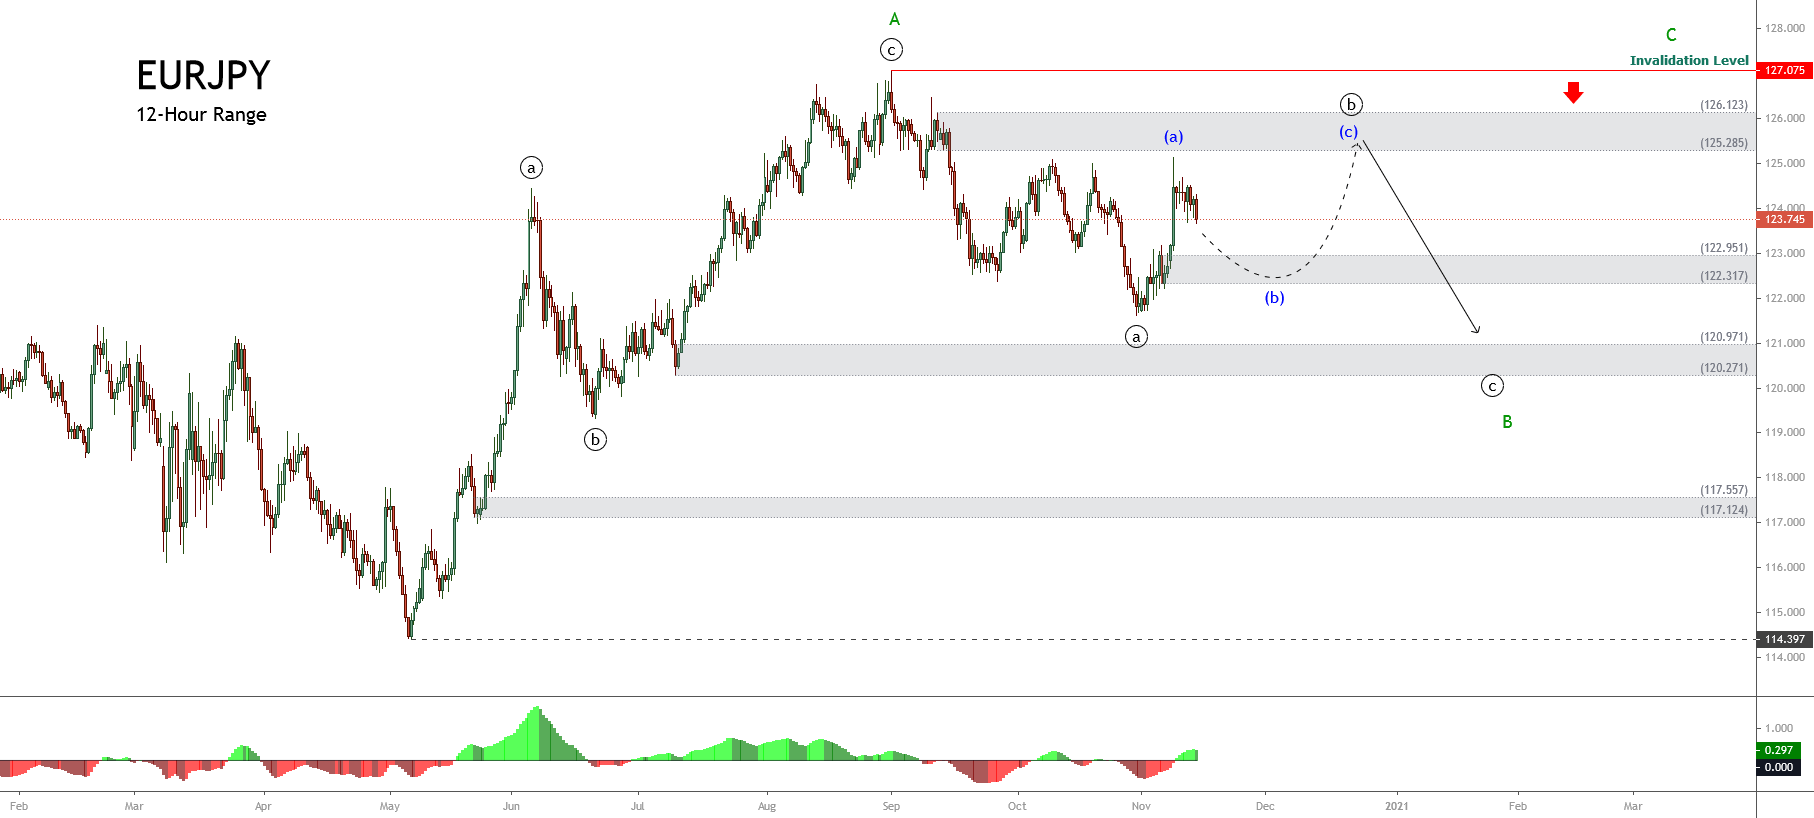
Moreover, our previous mid-term Elliott wave analysis in its 12-hour chart revealed the advance of an incomplete corrective structure of Minor degree, which currently advances in wave B in green.

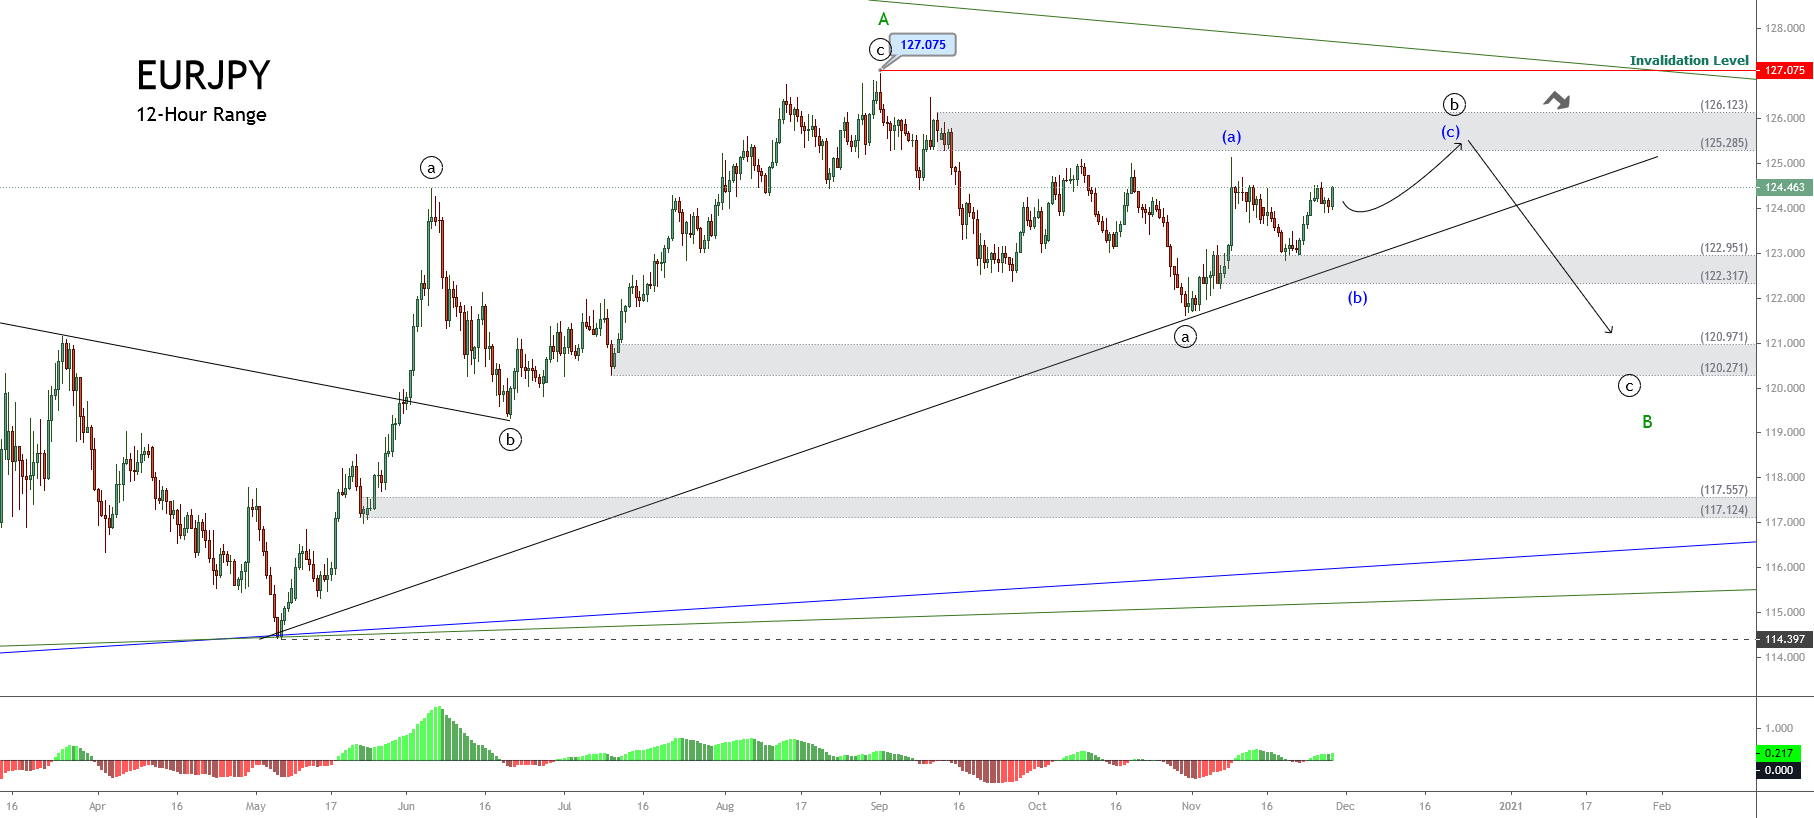
In this regard, our main outlook anticipated the progress in its wave ((b)) of Minute degree identified in black. The internal structure also suggested a limited decline toward the demand zone between 122.951 and 122.317. Once reached, the price could have completed the internal wave (b) of Minuette degree labeled in blue. 

Once the cross completed its wave (b), in blue, the cross should begin its wave (c), in blue, with a potential target in the supply zone between 125.285 and 126.123.

Technical Outlook

Currently, the EURJPY cross in its 12-hour chart reveals the bounce from the previous demand zone forecasted, where the price began to advance in its wave (c) in blue.

In the previous chart, we distinguish wave (c)‘s upward progress, which should evolve in a five-wave sequence according to the Elliott Wave theory. The figure also shows the potential target zone between 125.285 and the psychological barrier of 126.

This price landscape brings us three potential scenarios for the current upward movement:

  • First scenario: The EURJPY cross reaches the supply zone between 125.285 and 126.123, completing its wave ((b)) in black, and the price starts to decline in an internal five-wave sequence corresponding to wave ((c)).
  • Second scenario: The cross’ short-term rally fails to surpass the end of wave (a), in blue, and begins to decline. This scenario should be indicative of strong bearish pressure.
  • Third scenario: EURJY price action surpasses the invalidation level located on 127.075. In this case, the cross could be creating a bullish breakout of the long-term triangle, suggesting the continuation of the long-term bullish trend.

Nevertheless, before placing any position on the bearish side or continue on the bullish side, the price action must confirm the end of wave ((b)) in black.

Categories
Forex Elliott Wave Forex Market Analysis Forex Technical Analysis

AUDNZD: Potential Bounce among Overall Weakness

This analysis discusses AUDUSD’s overall Elliott Structure, the likelihood of a short bounce in the AUDUSD, and its potential continuation.

Technical Overview

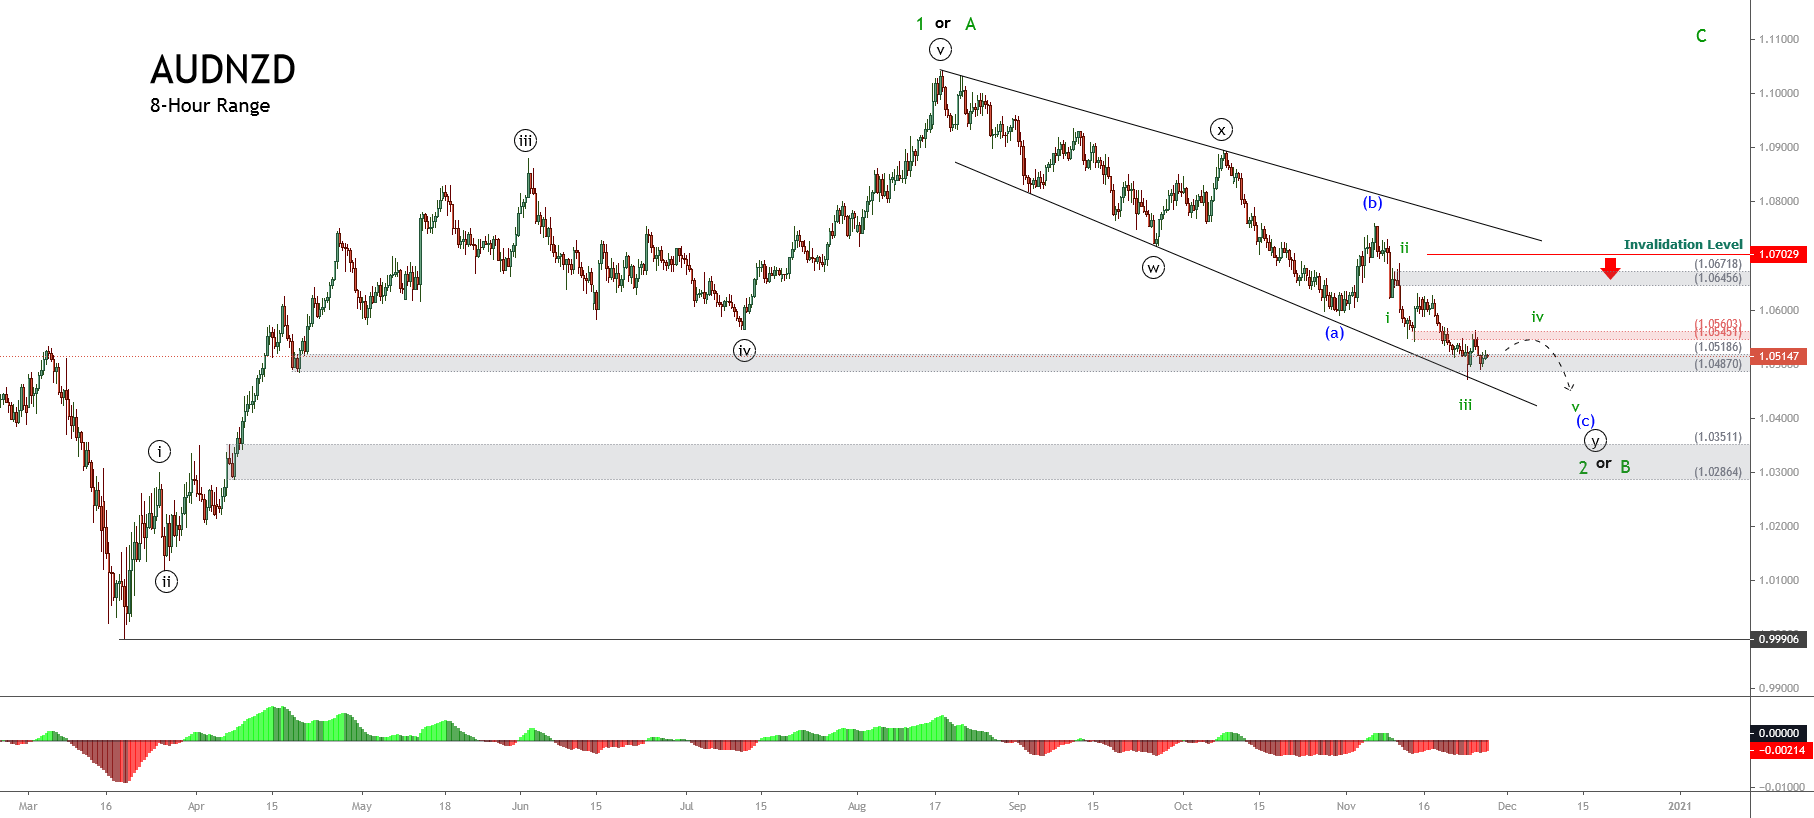
In our last AUDNZD technical analysis, the Oceanic cross was moving in an incomplete complex corrective sequence corresponding to wave (c) of Minuette degree labeled in blue, which belongs to wave ((y)) of Minute degree identified in black. 

As illustrated in the following 8-hour chart corresponding to our previous mid-November analysis, we commented on the broadening corrective formation the cross develops, which implies an acceleration of the downward sequence. Also, the move that pierced below the wave (a) in blue suggested further declines in the following trading sessions.

Likewise, we observed the potential bearish reaction areas for the decline until two potential demand zones. The first one located between 1.05186 and 1.04870, and the second one bounded between 1.03511 and 1.02864.

On the other hand, according to the Elliott wave theory, a complex corrective formation as a double-three pattern follows an internal sequence subdivided into 3-3-3, where each “three” corresponds to a single complete corrective wave.

Once completed, the current corrective structural series of wave 2 or B of Minor degree, the AUDNZD cross should give way to the start wave 3 or C, in green.

Technical Outlook

The AUDNZD cross in the next 8-hour chart exposes the price action advancing in its wave iii of Subminuette degree labeled in green, which belongs to the incomplete wave (c) of Minuette degree identified in blue. 

Considering the acceleration present in wave (c), the cross could develop an internal upward corrective movement corresponding to wave iv, in green. This move could find resistance in the adjacent supply zone between 1.0457 and 1.05603, where the cross could resume its downward movement, leading it to complete the wave ((y)) of Minute degree and, in consequence, wave 2 or B, in green. 

Once the current downward sequence finishes, the Oceanic cross will be ready for a new long-term rally corresponding to wave 3 or C, in green, which according to the Elliott wave theory, should be the largest wave of the impulsive sequence.

Finally, the invalidation level for the short-term bearish scenario is found at 1.07029, above the end of wave ii in green.


Categories
Forex Market Analysis

EURCAD Looks Bouncing from Demand Zone

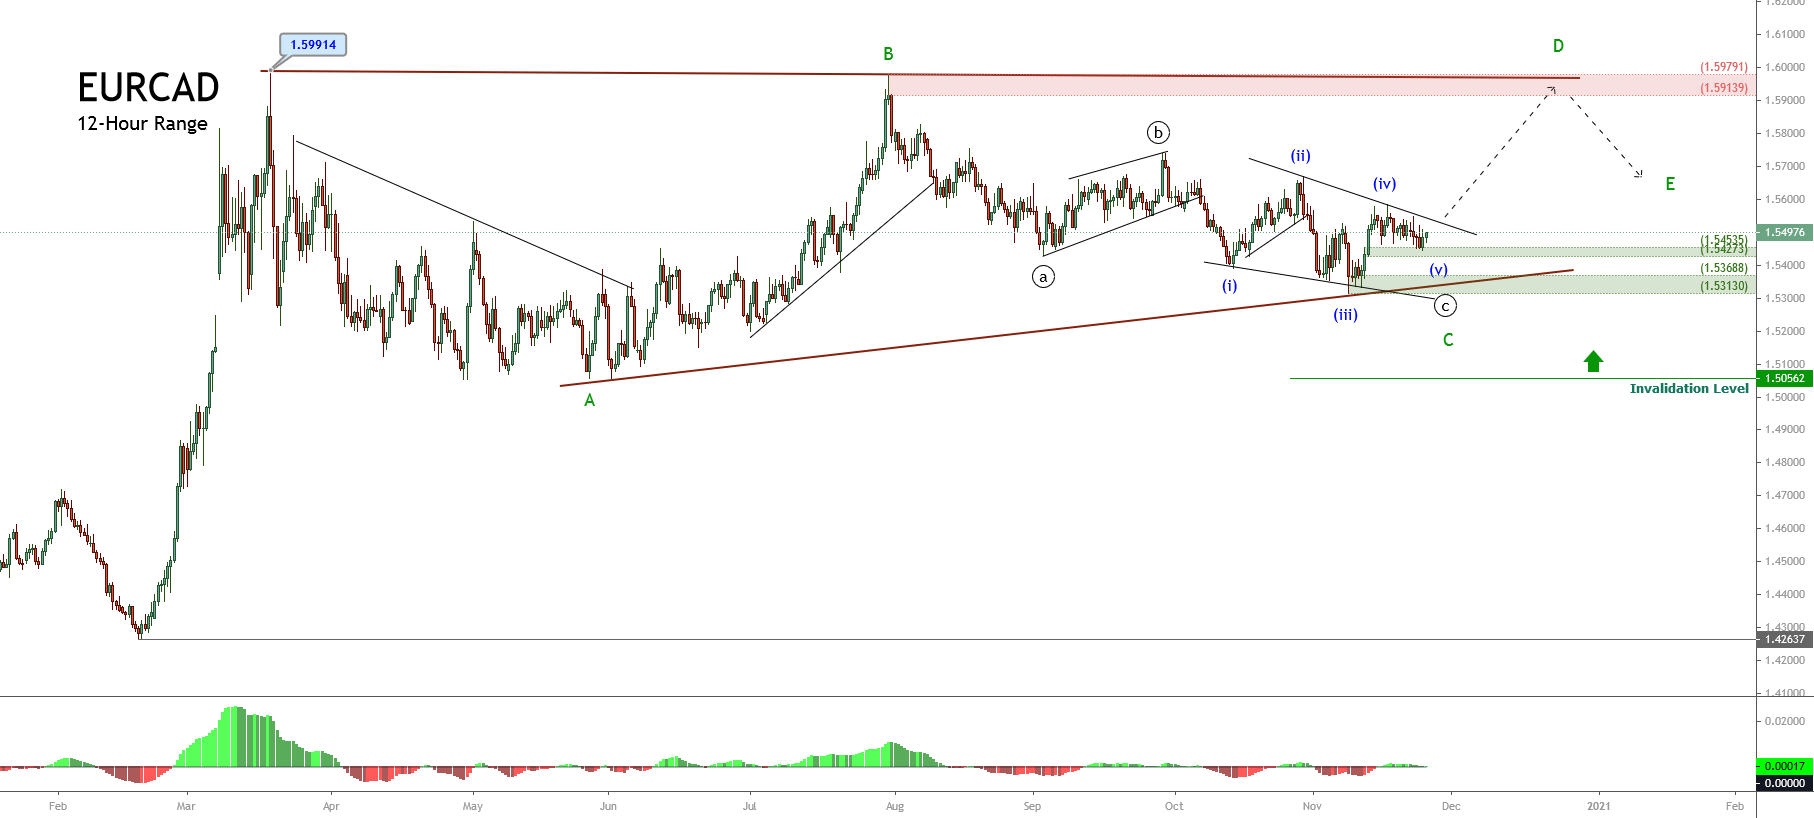
The EURCAD cross is still moving in a likely incomplete triangle pattern, developing since mid-March when the price found resistance on 1.59914. As pictured by the following 12-hour chart, the mid-term Elliott Wave structure shows the incomplete progress of a contracting triangle of Minor degree labeled in green.

Technical Overview

According to the Elliott wave theory, the triangle pattern follows an internal structure subdivided into 3-3-3-3-3 waves. In this context, the EURCAD triangle appears to be completing its third internal segment and start developing a new rally corresponding to wave D of Minor degree, identified in green.

On the other hand, considering the Alternation Principle, and in view that the movement developed by the wave C, in green seems like a complex corrective sequence, which took an extended time span, the following move -corresponding to wave D, could develop in a shorter time range. In this regard, it is possible that the cross would create an aggressive rally.

Short-term Technical Outlook

The short-term view displayed in its 12-hour chart (shown above) shows that the EURCAD reacted mostly upward in the demand zone identified in green between 1.54535 and 1.54273. This situation leads to expect that market participants could continue pushing it higher.

An alternative scenario considers the possibility of a new limited decline toward the next demand zone between 1.53688 and 1.53130. In this zone, the cross could find fresh buyers and complete its wave C of Minor degree, identified in green.

On the other hand, before taking any position on the bullish side, it is convenient to wait for the descending upper-line breakout that connects the waves (ii) and (iv). This would confirm the cross’s bullish bias. As for the targets, the suggested following movement, corresponding to wave D, in green, could rise till the next supply zone, located between 1.59139 and 1.59791.

Finally, the bullish scenario has its invalidation level at the end of wave A in green, located at 1.50562

Categories
Forex Elliott Wave Forex Market Analysis Forex Technical Analysis

Would you Trade this CADJPY Pattern?

The CADJPY cross moved up in the Tuesday trading session, boosted by the stock market’s risk-on sentiment. Although the cross advances 2.25% during the current month, the price is under -4% (YTD).

Technical Overview

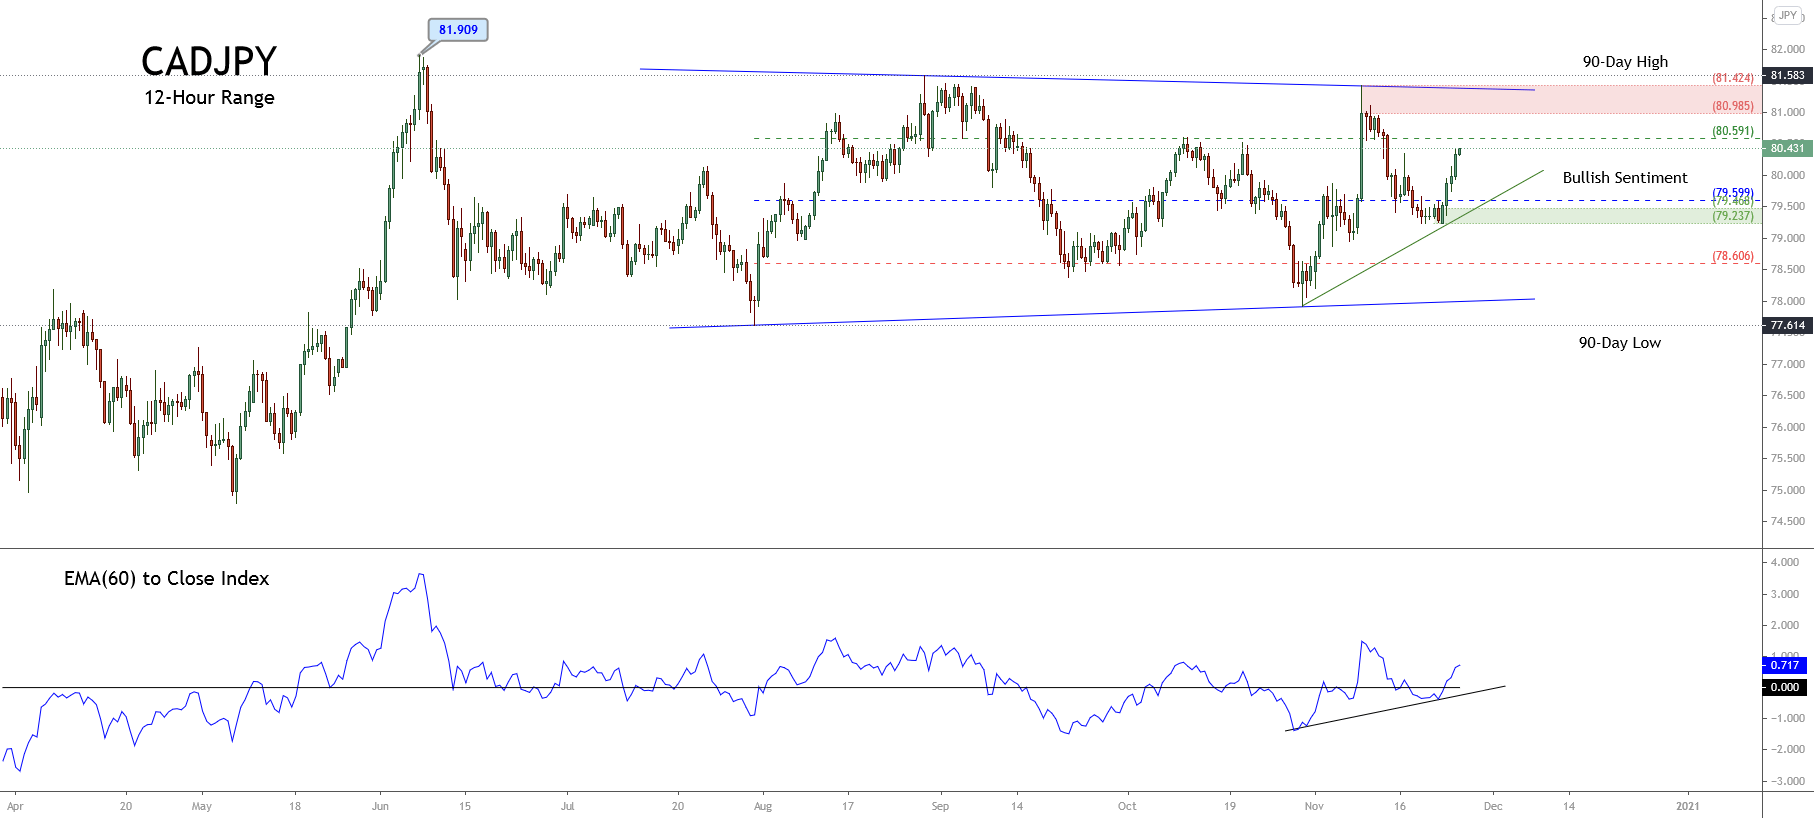
The CADJPY prices represented in the next 12-hour chart reveal the short-term market participants’ sentiment moving in the 90-day high and low range. The figure illustrates the cross advancing mostly upward in the bullish sentiment zone.

On the other hand, the previous chart presents a contracting triangle, which began in early June when CADJPY found fresh sellers on 81.909, followed by a first support level at 77.614. According to the classic chartist theory, the triangle pattern distinguishes itself as a continuation formation. In this case, this contracting triangle suggests further upsides.

In this regard, the likely next move could lead to a test of its intraday resistance of 80.591: this level corresponds to the bullish sentiment zone’s resistance, as well. If the price overcomes it and extends its upward advance, the cross could reach its supply zone between 80.985 and 81.424, a level that matches the triangle pattern’s upper trendline.

Conversely, a downward correction could drop it to its demand zone between 79.468 and 79.237.

Short-term Technical Outlook

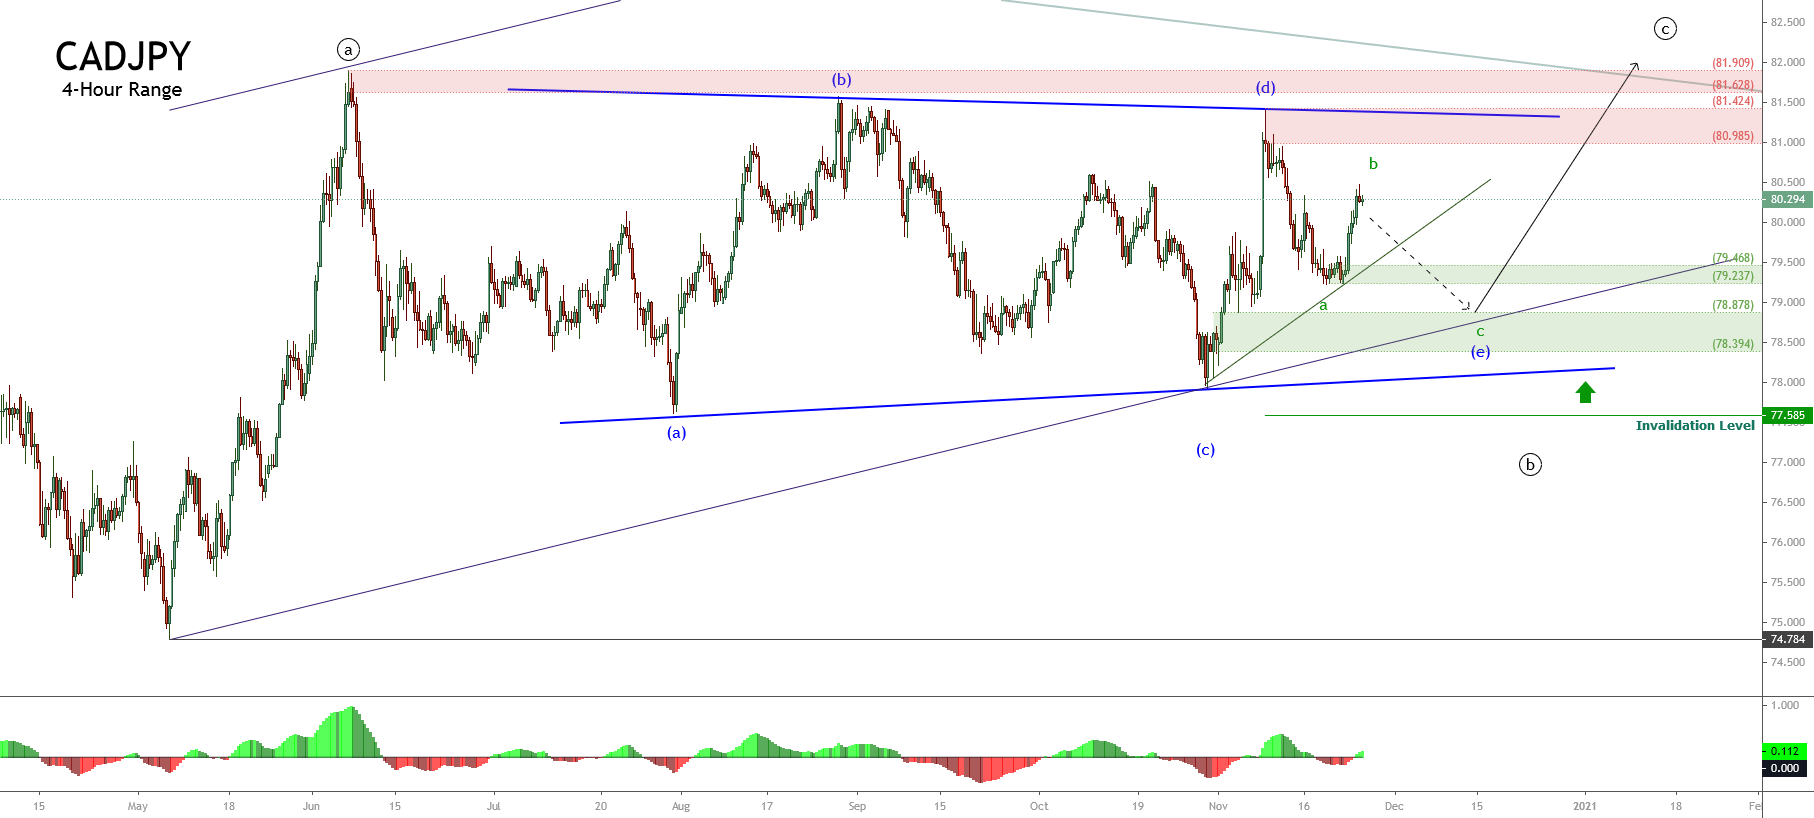
The short-term Elliott Wave view for the CADJPY cross displayed in the next 4-hour chart reveals the advance in an incomplete internal structural series of a contracting triangle pattern, which currently advances developing its wave (e) of Minuette degree, labeled in blue.

The previous chart presents the price advancing in the wave b of Subminuette degree, identified in blue, which belongs to wave (e), also in blue. According to the Elliott Wave theory, the triangle pattern follows an internal sequence subdivided into 3-3-3-3-3 waves. In this context, and observing its advance in the triangle formation, the cross could develop its latest decline before starting a rally that corresponds to wave ((c)) of Minute degree, labeled in black.

The current downward move, corresponding to wave c, in green, could reach two potential demand zones. The first one is located between 79.468 and 79.237, whereas the second one is seen from 78.878 to 78.394.

Once CADJPY starts to get fresh buyers, the cross could experience a strong rally and test June’s high zone of 81.909.

Finally, the bullish scenario has its invalidation level below the wave (a) of Minuette degree in blue located at 77.585, under the contracting triangle pattern limits.

Categories
Forex Course

179. Using the COT Report for Trading & Analysis

Introduction

Our previous lessons have covered where you can access the Commitment of Traders Report and the components contained within the report. In this lesson, we discuss how you can use the Commitment of Traders Report in forex trading.

Since the COT report gives the market sentiment in forex, this report’s publication should affect the price action in forex. Most forex traders pay attention to the non-commercial traders’ category of the COT report. The interest with the non-commercial traders is because these traders are considered speculative participants.

The nonreportable positions held by small-scale retail traders are not significant enough to move the markets. Similarly, since commercial traders are not considered speculative traders, the impact of their positions on price action tends to be subdued.

How the COT Report Affects Price Action?

When the non-commercial traders are accumulating their positions, it affirms a particular trend. Let’s take the AUD/USD, for example. When non-commercial traders, over time, are accumulating futures short position on the AUD as the AUD/USD pair falls, is a confirmation that this downtrend will persist. Conversely, when the non-commercial traders are accumulating future long positions of the AUD as the AUD/USD keeps rising, it is a confirmation that the uptrend will continue. This way, you can use the COT report as a trend confirmation indicator.

The COT report can also be used to indicate the overbought and oversold regions. The non-commercial traders, i.e., speculators, have a limit on how much they can buy or sell. These traders will reach a point where they would want to close their positions and take profits. Furthermore, when in a persistent uptrend, speculators might feel it’s no longer profitable to keep buying futures contracts at higher prices. Similarly, in a downtrend, these traders might not consider it profitable to keep selling at lower prices.

When the speculators have reached their critical limits in the forex futures, they begin reversing their trends. For day traders, the impact of the COT is diminished since its effects are long-term.

How the COT Report Publication Affects Forex Charts?

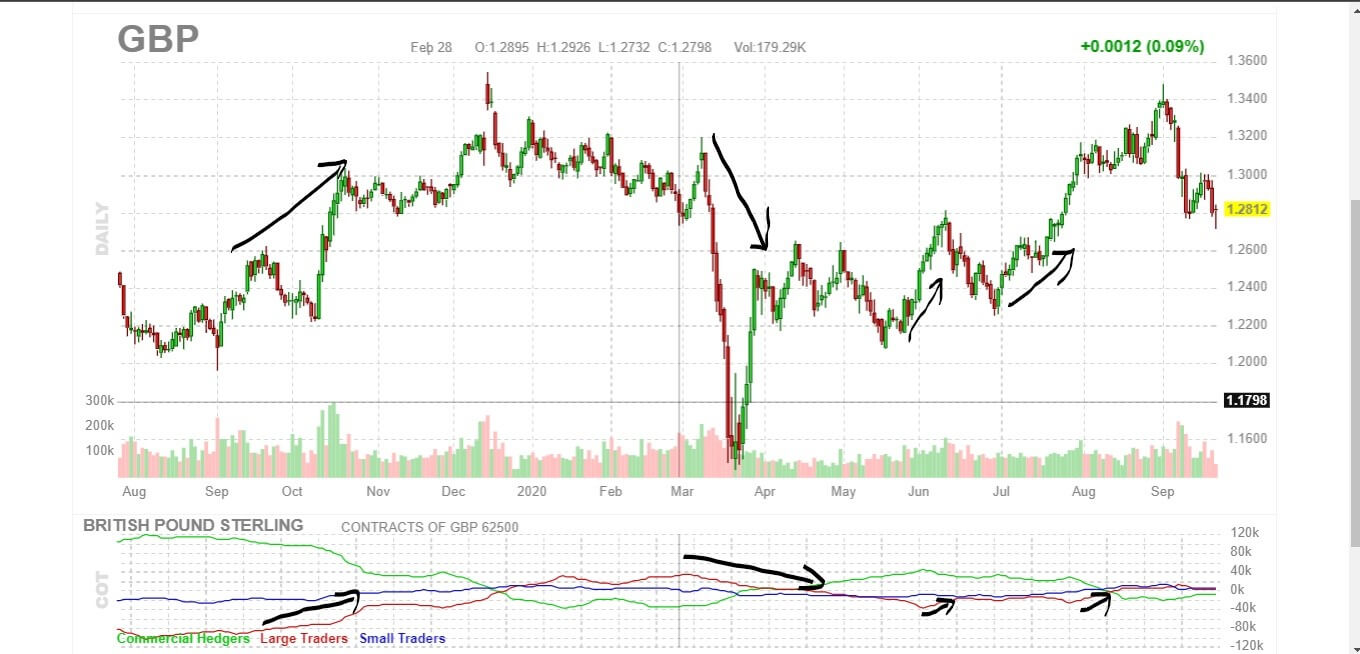
The screengrab below is GBP futures. At the bottom, if the COT indicator is showing the trend of commercial traders, non-commercial traders, and retail traders. In this case, we are interested in the non-commercial traders (i.e., large traders) since their positions influence the trend.

As you can see, the market moves at pace with the changes in the positioning of the large traders.

[wp_quiz id=”89690″]
Categories
Forex Elliott Wave Forex Market Analysis

Is the US Dollar Index Ready for a Bounce?

The US Dollar Index (DXY) advances in the extreme bearish sentiment zone finding an intraday support on Monday’s trading session at 92.016. During this intraday bounce, the price jumped to the extreme bearish zone’s resistance, where the price action started to consolidate. Even considering this intraday recovery, the Greenback accumulates losses of nearly 4.40% (YTD).

Technical Overview

The US Dollar Index, represented in its 8-hour chart, shows the market sentiment’s participants moving within its 90-high and low range, and it reveals the bearish pressure on the Greenback. In this regard, as long as the price keeps moving below 92.663, the short-term trend should stay mostly bearish.

On the other hand, the big picture under the Elliott Wave perspective illustrated in its 8-hour chart reveals the progress in an incomplete corrective formation, which could correspond to a flat pattern.

According to the wave theory, the flat pattern follows an internal sequence subdivided into 3-3-5. In this case, the Greenback should advance in a rally in a wave ((c)) of Minute degree identified in black subdivided into five segments.

An alternative scenario considers the possibility of a triangle pattern (3-3-3-3-3) or a double-three (3-3-3) in progress. However, the structure observed until this point doesn’t allow us to confirm or discard any of these potential Elliott wave formations.

Short-term Technical Outlook

The Greenback in its 4-hour range unveils the completion of the wave ((b)) of Minute degree labeled in black in the demand zone between 92.019 and 91.750, where the price bounced from on Monday’s trading session until 92.800.


Once the price reacted mostly upward, the US Dollar Index began to decline in a wave ii or B of Subminuette degree identified in green. In this regard, a bullish confirmation should lead us to expect further upward movements that could boost the price toward the next supply zone between 93.343 and 93.545.

If the Elliott wave formation corresponds to a Flat pattern, the price could surpass the supply zone level of 94.303 and seek to test the end of wave ((a)) located on 94.742.

On the other hand, we should be aware that a rally in the US Dollar Index implies a potential drop in the pairs against the US Dollar, for example, EURUSD or GBPUSD.

Finally, the return to a  bullish scenario holds its invalidation level at 92.016, which corresponds to the bottom of the first upwards move identified in green.

Categories
Forex Market Analysis

Watchout the Potential Next Rally of GBPAUD

GBPAUD advances on Monday’s trading session in the bullish sentiment zone, testing the resistance level at 1.82688, which corresponds to the extreme bullish zone’s resistance.

Technical Overview

The following 12-hour chart illustrates the price that reached a new peak in the 90-day range at 1.85272. The cross began to retrace towards the neutral zone at level 1.80104, where the price found support and began to move mainly sideways on the bullish sentiment zone, finding resistance at level 1.82688.

Likewise, it highlights the support’s confirmation in the neutral level of the 90-day range, which leads to the observation of the upward pressure it shows the cross short term. In this context, the GBPAUD cross could experience a new rally that could lead to a test of the psychological resistance level located on 1.8500.

Short-term Technical Outlook

The short-term Elliott Wave graph of the GBPAUD cross unfolded in the following 12-hour chart shows the price action moving in an incomplete wave ((c)) of Minute degree labeled in black, which belong to the fourth wave of Minor degree identified in green.

The big picture reveals the cross is moving in an impulsive descending structure of Minor degree, in green, progressing in its fourth wave. This corrective structural series began last September 11th when the GBPAUD found fresh buyers at 1.74935.

The completion of the internal wave ((a)) at 1.85272 on October 21st and wave ((b)) at 1.79378 on November 09th leads to the anticipation of further upward movements in a five-wave internal sequence corresponding to wave ((c)) identified in black. In this regard, the previous chart shows the price starting to develop its third wave (iii) of Minuette degree, labeled in blue.

In this context, the current upward sequence in development has two potential targets as follows.

  • The first potential target is found in the supply zone between 1.84295 and 1.85272. If the price starts to decline from this zone, this could indicate a dominant bearish pressure that could drag the price toward the last September’s lows zone on 1.7500.
  • The second potential target zone is between 1.87353 and 1.89667, which corresponds with the ascending channel’s upper line. If the GBPAUD cross reaches this zone, this could indicate a dominant bullish pressure, and a correction could likely drive the price to the end of wave ((b)) on 1.7937, where the cross could find fresh buyers.

For the active intraday bullish scenario, the short-term invalidation level is located at 1.79378, which corresponds to the origin of wave ((c)).

Categories
Forex Elliott Wave Forex Market Analysis

NZDUSD Reaches a Fresh 90-Day High

The NZDUSD pair ends the last trading week reaching its seventh fresh 90-day range high soaring to 0.69507. This advance brought the Oceanic currency to a close in the extreme bullish sentiment zone. 

Technical Overview

The next chart unveils the NZDUSD pair in its 8-hour timeframe, which shows the market participants’ sentiment in the 90-day high and low range. The figure illustrates the previous 90-day high and low range located at 0.67978 from September 18th. In this regard, the latest rally started on November 02nd created seven fresh 90-day highs.

On the other hand, the EMA(60)-to-Close index shows a bearish divergence that suggests both the bullish trend’s exhaustion and the price’s potential reversion to the moving average. However, a price breakdown and close below the recent lows is needed to confirm the current bullish trend’s correction.

Short-term Technical Outlook

The short-term view of the NZDUSD cross displayed under the Elliott Wave perspective reveals the intraday upward movement advancing in an incomplete Ending diagonal pattern of Minuette degree labeled in blue. Likewise, the advance of the fifth wave in blue should correspond to the ending of the fifth wave of Minute degree identified in black. Nevertheless, the Elliott Wave formation still doesn’t confirm it.

The next4-hour chart reveals the bullish sequence developed by the NZDUSD pair since October 20th when the kiwi found fresh buyers at 0.65555. Until now, the price action advanced in an incomplete upward five-wave sequence, which reached the potential target zone forecasted in a previous analysis.

According to Elliott wave theory, the Ending Diagonal pattern follows an internal sequence subdivided into 3-3-3-3-3 waves. In this context, the previous chart exposes the terminal formation of the bullish impulsive structure advancing in its fifth wave of Subminuette degree labeled in green, which provides two potential scenarios.

  • First Scenario: The price breaks below the base-line that connects the waves ii and iv, confirming the end of the Ending Diagonal pattern and starting a corrective upper degree structure.
  • Second Scenario: The price advances slightly over last Friday’s high and starts to decline below the base-line between waves ii-iv, from where the NZDUSD should begin to develop a correction of upper degree.

In both scenarios, the confirmation of the ending diagonal completion comes from the breakdown and closing below the base-line that connects the end of waves ii and iv.

Finally, the downward scenario will have its invalidation level once the ending diagonal pattern confirms its completion.

Categories
Forex Elliott Wave Forex Market Analysis

GBPJPY Consolidates in the Bearish Sentiment Zone

The GBPJPY cross continues moving by its seventh session in a row in a sideways channel turning in the neutral zone. However, since the last Thursday trading session, the price is consolidating in the bearish sentiment zone.

Technical Overview


The following 8-hour chart illustrates the 90-day high and low range, which exposes the market participants’ sentiment. The figure shows the price action moving around the pivot level at 137.877. Nevertheless, the close below the pivot level pulled the price toward the bearish sentiment zone.

Additionally, the strong bearish rejection in the price action decreasing from the extreme bullish sentiment zone of 140.296 toward the pivot level leads to suspect that the intraday upward movement developed on November 09th couldn’t be as strong as it seemed.

On the other hand, both the positive EMA(60) to Price Index and the 200-period moving average moving below the price, leads to the conclusion that the mid-term sentiment remains on the bullish side. In this regard, the short-term sideways channel’s breakdown could confirm the turning bias from bullish to bearish.

Short-term Technical Outlook

The GBPJPY cross short-term view and under the Elliott Wave perspective reveals the sideways progress in an incomplete corrective sequence that corresponds to wave B of Minor degree labeled in green.

The next 4-hour chart illustrates the advance in a broadening structural series that could correspond to a possible double-three pattern that ended once the price topped at 140.315 on November 11th.

If this scenario is correct, then the pair’s action should be advancing in wave C of Minor degree labeled in green. In this context, the GBPJPY cross should confirm the end of its internal corrective wave corresponding to wave (ii) of Minuette degree identified in blue. In this scenario, the bearish pressure could drag the price toward the end of wave A zone located between levels 133.70 and 133.

The alternative count considers the possibility that wave B of Minor degree remains incomplete and the internal structural series corresponds to a triple-three pattern. In consequence, the current downward move would correspond to the second wave ((x)) of Minute degree. If this scenario is valid, the wave (c) of Minuette degree in blue should have a limited decline, likely until the previous lows located between 135 and 134.

Finally, the invalidation level for both short-term scenarios locates at 140.315, which corresponds to the end of wave ((y)) in black.

Categories
Forex Elliott Wave Forex Market Analysis

Is EURGBP Ready for an Elliott Wave Rally?

Technical Overview

The EURGBP cross develops an incomplete Elliott wave correction of Minor degree labeled in green, which began on September 03rd when the price found fresh buyers at 0.88658 and rallied until 0.92916, in where the cross completed its wave A in green. 

The following 4-hour chart illustrates wave B completion.  We see that its internal structure looks like a double-three pattern. This second leg started on 0.92916 on September 11th and ended on November 11th when the price found fresh buyers that boosted the cross in a move that looks like an impulsive intraday rally.

According to the Elliott Wave theory, the double-three pattern is a complex correction that follows an internal structure subdivided into 3-3-3. Likewise, in a corrective formation subdivided into three-wave movements, the segment corresponding to wave C should hold five segments inside it.

On the other hand, considering the Elliott wave theory’s alternation principle, the price likely could advance in an aggressive rally after an extended complex movement.

The cross is advancing in its wave ((ii)) of Minute degree labeled in black that belongs to wave C of Minor degree. In this context, the descending channel’s upper line’s breakout would confirm the potential bullish continuation of wave (iii).

Short-term Technical Outlook

The next 4-hour chart shows the second wave of Minute degree’s internal corrective structure, which could be advancing in its wave (c) of Minuette degree labeled in blue. 

From the previous chart, if the cross finds support in the demand zone located between 0.8917 and 0.8901, opens the likelihood of a new rally corresponding to wave ((iii)), which could advance toward the first supply zone between 0.9126 and 0.91464. The next potential target zone resides between 0.9200 and 0.9218.

On the other hand, both the breakout of the intraday descending trendline that connects the end of waves ((i)) in black and (b) in blue and the surpassing of the end of wave ((i)) will confirm the advance in wave ((iii)) of Minute degree.

Finally, the bullish turning scenario’s invalidation level locates at 0.88610, which corresponds to the origin of wave ((i)).

Categories
Forex Market Analysis

AUDUSD Prepares for Employment Data Ahead

Market Overview

The AUDUSD pair during the overnight trading session will be driven by October’s employment data, to be released by the Australian Bureau of Statistics in a few hours. The analysts’ consensus expects an increase of 7.1% in the unemployment rate (YoY), representing a deterioration in the labor market conditions and a rise over the 6.9% reported in September.

The unemployment rate jumped from 5.1% in January to 7.5% in August during the current year. In this context, the Governor of the Reserve Bank of Australia (RBA), Philip Lowe, confirmed the change in the focus from inflation rate to labor market conditions, which according to Governor Lowe, would face “an extended period of higher unemployment than we have become used to.”

On the other hand, the next 8-hour chart illustrates the market participants’ sentiment unveiled by the 90-day high and low range, where the price action looks testing the extreme bullish sentiment zone support located at 0.73009.

Likewise, the Aussie advances in a sideways movement. We can see that, after reaching its yearly high at 0.74135, the Aussie was dragged toward the extreme bearish sentiment zone, where the Australian currency bounced back to the extreme bullish sentiment.

Currently, the re-test of the recent intraday high at 0.7335 leads us to expect further upsides in the following sessions, likely to head to its early September highs at 0.7400.

Short-term Technical Outlook

The short-term Elliott Wave view exposed in the next 8-hour chart reveals the sideways advance in an incomplete flat pattern of Minuette degree identified in blue, which, according to the Elliott Wave theory, follows an internal sequence subdivided into 3-3-5. This corrective pattern in progress belongs to the fourth wave of Minute degree labeled in black.

The previous figure shows the current wave (b) in blue, which began on September 25th on 0.70059. The end of wave b of Subminuette degree identified in green pierced the origin of wave a. That leads us to consider the possibility that the current corrective formation could correspond to an expanded flat pattern

Finally, the current incomplete movement corresponding to wave c in green could advance to the potential target area between 0.7352 and 0.7465. If the price action doesn’t surpass the level 0.7352, then the price could test the sideways channel’s previous lows. 

The alternative scenario is if the price breaks above the 0.74134 level, climbing until 0.7465. Thar means the bullish pressure is strong. In that case, the next decline corresponding to wave c in blue will likely be weaker, ending in a region under 0.71, but no further than 0.70.

Categories
Forex Elliott Wave Forex Market Analysis

Is GBPUSD Ready for a New Decline?

Overview

The GBPUSD pair advances in an incomplete bearish corrective formation that corresponds to a wave B of Minor degree. In this context, the completion of wave B could lead to a new decline, which could drag the price below Septembers’ low.

Market Sentiment

The GBPUSD pair suffered another drop for the second day in a row, falling from the extreme bullish to a bullish sentiment zone, where it found support in the psychological barrier of level 1.31.

The following daily chart illustrates the 90-day high and low range, revealing the mid-term market participant’s sentiment. The figure shows the price action moving mostly sideways in a range that oscillates between the bearish and bullish sentiment zones; that is, between 1.27204 and 1.32289.

Furthermore, the 60-day weighted moving average is seen moving below the Pound’s price, which confirms the short-term bullish bias that carries the price.

Considering the indecision, the cable is exhibiting since last August. The intraday bias will stay neutral until the GBPUSD pair confirms its next movement, for example, through a breakout.

Technical Overview

The GBPUSD price reveals a yearly long-tailed candlestick that suggests the price will continue being dominated by the upward bias. As exposed in the following 2-day chart, the Pound erased the first 2020 quarter losses that reached up to 13.89%. The cable currently eases 0.67%(YTD).

The big picture of GBPUSD and under the Dow Theory unfolded in the next daily chart illustrates the cable developing a primary upward trend in progress, which currently could be forming a corrective secondary trend.

In this context, according to Dow Theory, the price retraced below 33% of the first upward movement, which accomplishes with the minimum requirement for a correction of the previous move of a similar level.

Nevertheless, considering that the price remains in a short-term downward trend, the price could continue developing a new bearish sequence.

Short-term Technical Outlook

The short-term Elliott wave outlook for GBPUSD unfolded in its 8-hour chart reveals the corrective rally that corresponds to an incomplete wave B of Minor degree identified in green, which leads us to expect a decline in a five-wave sequence for the following trading sessions.


The previous chart exposes a corrective structural series that began on September 01st when the price found fresh sellers at 1.34832 and dragged the cable until 1.26751 on September 23rd, where the pound started to advance in its wave B that remains in progress. 

In this regard, the current upward movement could find resistance in the first supply zone between 1.32069 and 1.32280. If the price extends its previous progression, creating a bull trap, it could climb until 1.33195. There, the price could start to decline in a five-wave sequence corresponding to wave C identified in green.

The potential next wave C could extend until the demand zone between 1.25658 and 1.24796, which corresponds with the mid-term descending channel’s base.

Finally, the bearish scenario’s invalidation level locates at 1.34832, which agrees with the origin of wave A in green. Nevertheless, before positioning on the downward side, the GBPUSD pair should confirm (or discard) the bearish entry. 


Categories
Forex Market Analysis

NZDUSD Bullish ahead of the RBNZ Meeting

Overview

The NZDUSD cross advances in the extreme bullish sentiment zone before the RBNZ monetary policy decision, to be held during the overnight trading session. The intraday Elliott Wave view reveals its progress in an incomplete five-wave sequence, which could boost the price toward a new high.

Market Sentiment

The NZDUSD cross waits for the Reserve Bank of New Zealand (RBNZ) interest rate decision, as it moves on the extreme bullish sentiment zone. Although the kiwi’s high volatility during this year made it drop over 18.7% in the first quarter of the year, the NZDUSD is still up by 1.44% (YTD).

The next chart illustrates the NZDUSD in its 8-hour timeframe. The figure unveils the price action developing a short-term rally that pushed it from the extreme bearish till the extreme bullish sentiment zone.

Moreover, the consecutive intraday higher high could make the market participants expect further upsides during the interest rate decision, which will take place in the overnight trading session.

In this context, the analysts’ consensus foresees that the RBNZ official cash rate (OCR) will remain unchanged at 0.25%. However, considering that during the latest Reserve Bank of Australia (RBA) broad meeting, the policymakers decided to cut the interest rate to 0.10%, it is possible that the RBNZ would follow the same direction.

In consequence, although the NZDUSD moves in the extreme bullish zone, a drop below 0.67635 could be a signal the pair might start developing a downward corrective movement during the following trading sessions.

Technical Overview

The big picture of the NZDUSD cross exposed in the 2-day log-scale chart reveals its advancement in an incomplete impulsive sequence, which looks moving on its fifth wave of Minute degree labeled in black. 

According to the Elliott Wave theory, considering that the price action developed a third extended wave, the fifth wave should have a limited upside. Thus, the extension of the current upward movement could end soon.

On the other hand, the bearish divergence observed in the MACD oscillator confirms that the cross’s current 5th-wave upward sequence is in an exhaustion stage. 

Likewise, the long-term descending trendline suggests that the price action currently tests a dynamic resistance, which could be surpassed backed by increasing volatility. Nevertheless, this potential breakout could end being a fake-out

Short-term technical Outlook

The intraday outlook for NZDUSD under the Elliott wave view and illustrated in its 4-hour chart exposes its progress in the third wave of Minuette degree labeled in blue, which could retrace to the area between 0.6785 and 0.67562.

If the price confirms the bounce from the demand zone between 0.67562 and 0.67850, the kiwi could advance toward the long-term supply zone, which corresponds to a potential target area between 0.69311 and 0.69780.

Once the fifth wave of Minuette degree, which belongs to the fifth wave of Minute degree, completes, the cross could start developing a corrective sequence with length and time proportional to the structural series of Minute degree.

Lastly, the invalidation of this intraday upward scenario is a drop below 0.67242.

Categories
Forex Elliott Wave Forex Market Analysis

Euphoric Market’s Sentiment Pushes GBPCHF Up

Overview

The GBPCHF cross began the current trading week, advancing over 1.30%, boosted by the U.S. post-election rally and Pfizer’s Covid vaccine upbeat results. However, the Elliott Wave view anticipates that the euphoric rally could soon end, and the cross could reverse its course toward new lows.

Market Sentiment

The week started with a risk-on U.S. Presidential post-election stock market rally, driving the risk-off currencies to drop. In this context, the GBPCHF cross advances over 1.30% to its highest level since late September.

The following 8-hour chart displays the intraday market sentiment. Although the sideways movement predominates since late September, the strong bullish move developed in the Monday trading session takes the GBPCHF cross to the extreme bullish sentiment zone.

Likewise, we can see the price action developing above the 60-period weighted moving average, which confirms the intraday upward bias that could hold during the following trading sessions.

On the other hand, the euphoric sentiment bolstered by news media’s coverage of the U.S. elections and the continuation of the stock market rally added to the news of the promising vaccine results developed by Pfizer and BioNTech leads us to expect a limited upside in the risk-on currencies.

Technical Overview

The big picture of the GBPCHF under the Elliott wave perspective reveals its progress in a descending broadening formation. Its latest downward sequence began on December 13th, 2019, when the price found fresh sellers at 1.33113. We can see, as well, that this leg still remains in progress.

The following daily chart unveils the advance in the fifth wave of Minute degree labeled in black, which started on 1.22224, where the price action declined in a bearish impulsive movement reaching a new lower low. This decline that ended on 1.15989 completed the first wave of Minuette degree labeled in blue.

Currently, the GBPCHF cross moves in its second wave (in blue). Nevertheless, the psychological barrier of 1.20 could represent a significative intraday resistance.

Technical Outlook

The intraday outlook of the GBPCHF cross reveals the bullish continuation of the current upward momentum. The next 2-hour chart exposes the supply and demand zones according to the potential next move that the cross could develop in the coming trading sessions.

On the one hand, the price advances in its wave c of Subminuette degree identified in green, developing the third internal wave. Likewise, the retracement that should correspond to its fourth internal wave could retrace to the area between 1.19292 and 1.19694. This zone could back the possibility of a new rally that would boost the price toward 1.21012 and 1.21306. 

On the other hand, our first scenario considers the bearish continuation. In this case, if the price action penetrates and closes below 1.1803, the cross could see further declines toward the zone of 1.1650.

Finally, our second scenario considers that if the GBPCHF cross continues its advance beyond 1.22224, the cross could extend its gains toward the descending upper- trendline shown in the daily chart.

Categories
Forex Elliott Wave Forex Market Analysis

GBPCAD Advances in a Double-Three Pattern

Overview

The GBPCAD cross advances in a sideways sequence corresponding to an incomplete double-three pattern. The mid-term Elliott Wave view foresees a potential rally that could boost the cross toward last March’s highs.

Market Sentiment

The mid-term market sentiment overview of the GBPCAD cross unfolded by the 90-day high and low range and illustrated in its daily chart, reveals the price action moving in the bearish sentiment zone (SZ).

The previous chart reveals the sideways movement bounded between the extreme bullish SZ located at 1.76759 and the extreme bearish SZ at 1.69214. Likewise, the 60-Day moving average looks flat, suggesting the balance between supply and demand, or bull and bear traders, which in turn, is indicative of sideways action.

On the other hand, considering the year’s opening price at 1.71923, we distinguish that the yearly candlestick pattern corresponds to a narrow body candle identified as a doji, revealing the next direction’s market participants’ indecision that the price will take.

In consequence, while the GBPCAD cross remains moving mostly sideways, the primary bias will continue neutral.

Elliott Wave Overview

The long-term Elliott Wave landscape of the GBPCAD cross reveals the price action is developing an incomplete three-wave sequence of Intermediate degree labeled in blue, which currently advances its wave (B). The internal structure unfolds in a double-three pattern as it exposes the next weekly chart on a log scale.

The previous chart reveals that the double-three pattern in progress looks incomplete. According to the Elliott wave theory, this complex formation follows an internal structural series subdivided as 3-3-3. In this context, the GBPCAD cross advances in its last “three” or the third component of the double-three pattern identified as wave Y of Minor degree labeled in green.

The internal structure of wave Y subdivided into another “three” sequence, which advances in its wave ((b)) of Minute degree labeled in black. Likewise, the wave ((b)) follows the arrangement of a triangle pattern. Thus, the GBPCAD cross should develop an upward movement subdivided into five-waves, corresponding to its wave ((c)) of Minute degree identified in black.

Elliott Wave Outlook

Considering the progress of the GBPCAD cross into a triangle pattern, the following 12-hour chart unveils that the price completed its wave ((b)) with the failure of reaching a new lower low at 1.69014, where the cross began to advance in an upward sequence that corresponds to its wave ((c)) of Minute degree identified in black.

The previous chart illustrates the end of the wave (e) of Minuette degree identified in blue and the upward sequence of a potential leading diagonal pattern, which could follow a 5-3-3-3-3 internal sequence. Simultaneously, the price seems to be advancing in its fifth wave of Subminuette degree labeled in blue, which belongs to the first wave of Minuette degree in blue. 

The first impulsive wave of Minuette degree could find resistance in the supply zone between 1.73665 and 1.74341, from where the cross could start to retrace until the demand zone is located between 1.71151 and 1.70262. Once GBPCAD completes its second wave, the third wave could become the upward cycle’s extended wave. This upward movement could drive the pair toward 1.77356 and continue until 1.79911.

The bullish scenario’s invalidation level locates at 1.69014, which coincides with the wave’s origin ((c)) that remains in progress.

Categories
Forex Elliott Wave Forex Market Analysis

Can EURUSD Re-Test the Level 1.20?

The EURUSD pair advances in an unfinished impulsive formation that raised the common currency from 1.06359 till 1.20114. The price action started to develop a corrective sequence, still progressing, corresponding to its fourth wave of Minor degree. Explore with us what should be the target of the fifth impulsive wave.

Market Sentiment

The long-term market sentiment of the EURUSD pair based on the 52-week high and low range unveils the price moving in the extreme bullish zone. 

The following daily chart illustrates the common currency moving above the 60-day linear weighted moving average, confirming the extreme short-term upward bias prevalent in the current price action.

Likewise, the consolidation formation bounded between 1.16121 and 1.18566, appearing after the rally from mid-May to early September, leads us to anticipate the take-profit activity of big market participants. In other words, the price could begin a new movement toward the 52-week high zone, creating a euphoric sentiment for the euro before developing a corrective move.

Elliott Wave Overview

 EURUSD pair’s long-term outlook under the Elliott Wave perspective reveals the upward advancement of the common currency in an unfinished impulsive wave, which currently progresses in its fourth wave of Minor degree, suggesting further highs.

The following daily chart exposes de uptrend developed by the EURUSD since the March 23rd low located at 1.06359, where the price found fresh buyers, who remain in control of the long-term uptrend.

The Elliott Wave point of view illustrates the EURUSD pair developed and completed a third extended wave of Minor degree labeled in green when the price reached 1.20114 on past September 01st. Once the common currency found resistance at 1.20114, the EURUSD started to develop its fourth wave of Minor degree identified in green.

Considering that the second corrective wave was simple in terms of price and time, by the alternation principle of the Elliott Wave theory, the fourth wave should be a complex correction. In this regard, the complexity could be in terms of price, time, or both.

If the correction were complex in price, the formation could be a flat pattern like an irregular flat. If the complexity were in terms of time, the corrective pattern could be a triangle formation. Finally, if the correction develops a combination of price and time complexity, the structural series could be a double three or a triple three pattern.

Short-term Elliott Wave Outlook

Once the fourth wave ends, the common currency should advance in its fifth wave, shown in green in the following chart. Considering that the third wave is the extended wave, two potential scenarios exist for the fifth wave target.

The first scenario considers the advance slightly higher than the top of the third wave, which could reach the area between 1.2065 and 1.2257.

The second scenario may arise if the fifth wave’s bullish pressure fails and finds resistance in the supply zone, which is located between 1.19361 and 1.20114.

To conclude, the invalidation level corresponding to this bullish scenario is a close below 1.11639.

Categories
Forex Forex Market Analysis

EURAUD: Can we Profit from the Bear Side?

Overview

The EURAUD cross moves mostly bearish in a downward sequence that began in early October. The price action suggests that the cross could develop a new low before complete the bearish sequence still in progress.

Technical Big Picture

The EURAUD cross penetrated the sideways trading zone developing the second bearish leg of its three-wave movement that looks incomplete. Likewise, once the current bearish wave ended, the cross could start a new rally subdivided into a five-wave sequence.

The following chart represents the EURAUD cross in its 12-hour range, in which the sideways trading range goes between 1.60332 and 1.65744. This consolidation formation found its bottom on June 02nd, and its top corresponds to a pivot level that turned into a long-term key level.

Consequently, as long as the price keeps moving below this level, the short-term bias will continue being bearish. However, the May 29th breakout of the 1.67728 level, when the cross rallied topped at 1.68273, suggests the possibility of a new upward sequence.

Concerning its Elliott wave analysis, the current bearish sequence corresponds to an incomplete wave ((b)) of Minute degree labeled in black, which began when the price found fresh sellers at 1.68273.

Currently, the EURAUD cross advances in its internal wave (c) of Minuette degree identified in blue. Its completion could suggest a new rally that could drive the price toward the October high zone.

The short-term key supports and resistance levels are as follows:
• Resistance 1: 1.66856
• Resistance 2: 1.67824
• Resistance 3: 1.68724
Pivot Level: 1.65744
• Support 1: 1.64608
• Support 2: 1.63565
• Support 3: 1.62565

Technical Analysis Outlook

The short-term outlook for the EURAUD cross and under the Elliott Wave perspective exposes the bearish advance in the third wave of Subminuette degree identified in green, which belongs to the wave (c) of Minuette degree labeled in blue.

The following 3-hour chart shows the intraday consolidation activity that suggests the equilibrium between bull and bear traders. In terms of the wave theory, the consolidation structure should correspond to wave iv of Subminuette degree.

The Elliott wave structure suggests the possibility of a limited upside until 1.6460 and 1.6494, where the price could find fresh sellers expecting to join their limited positions with a potential target in the area between 1.63198 and 1.62201. This decline should complete the fifth wave that belongs to wave (c) identified in blue.

Finally, the invalidation level of the bearish scenario locates at 1.6573.

Categories
Forex Elliott Wave Forex Market Analysis

EURJPY: Can we Profit Short-Term?

Overview

The EURJPY cross advances in a corrective sequence that began on September 01st; this corrective movement looks incomplete. The short-term Elliott wave outlook foresees a limited recovery prior to its a coming decline corresponding to its fifth wave.

Technical Big Picture

The EURJPY cross, in its 12-hour chart, illustrates an incomplete downward sequence that began on September 01st when the price found fresh sellers at level 127.075. 

The previous figure exposes an upwards structural series subdivided into three-wave identified in Minute degree and labeled in black, which began on the May 06th low located at 114.397 and ended on the September 01st high when the price topped 127.075. 

Once the price found fresh sellers at 127.075, the cross started to retrace, developing a three-wave sequence identified in the Minuette degree labeled in blue. Until now, wave (c) doesn’t show bullish reversal signals, which lead us to expect further declines.

The short-term key supports and resistance levels are as follows:

  • Resistance 1: 123.160
  • Resistance 2: 124.233
  • Resistance 3: 124.999
  • Pivot Level: 122.377
  • Support 1: 121.144
  • Support 2: 120.271
  • Support 3: 119.311

Technical Outlook

The short-term outlook for EURJPY illustrated in its 3-hour chart reveals the intraday consolidation, which coincides with the progress of its fourth wave of Subminuette degree labeled in green.

In this regard, the market participants could mostly drive the price toward the supply zone between 122.550 and 122.890, from where the EURJPY cross could start developing the next decline corresponding to its fifth wave identified in green.

The potential target zone of the next decline locates between 121.038 and 120.051, which coincides with the base-line of the descending channel that extends from the September 01st high to date. 

Finally, the invalidation level of the downward scenario locates at 123.402.

Categories
Forex Daily Topic Forex Price Action

How to Professionally Deal with Fake Breakouts!

In today’s lesson, we are going to demonstrate an example of an H4 breakout at the weekly low. The price consolidates after the breakout and produces a bearish reversal candle right at the breakout level. It is a matter of time for the sellers to go short and drives the price towards the South. Let us find out what actually happens.

The chart shows that the price makes a good bearish move. It finds its support where the pair is traded for a while. The pair closes its week by producing a bearish candle. By looking at the chart, it looks that the sellers are going to keep their eyes on the chart next week.

The pair produces a bullish engulfing candle to start its trading week. The buyers on the minor charts may push the price towards the North. However, the H4 chart is still bearish biased.

The chart shows that the price may have found its resistance. The price has been in consolidation for a while. The last candle comes out as a bearish engulfing candle. The price may make its move towards the South now.

The chart produces consecutive bearish candles and makes a breakout at the last week’s low. The pair is traded below the breakout level for two more candles as well. The sellers are to wait for the price to consolidate and produce a bearish reversal candle followed by a breakout at the consolidation support to go short in the pair.

The chart produces a bullish engulfing candle closing within the breakout level. The next candle comes out as a bearish inside bar. The sellers would love to get a bearish engulfing candle closing below the bullish candle’s low. However, a breakout at the consolidation support would signal the sellers to go short in the pair. By drawing Fibonacci levels on the chart with Fibonacci extension, we see that the price finds its support at the level of 38.2% and finds its resistance at the level of 23.6%. In a word, the stage is getting ready for the Bear to make a move.

The chart produces a bullish candle. It is not a good sign, but the sellers still have hope. If the chart produces a bearish reversal candle again followed by a breakout at the level of 38.2%, the game is on for the sellers.

Now, the chart produces another bullish candle and heads towards the North. The sellers must be very disappointed since it seemed such a nice trade setup for them. The reality is it often happens to all traders. No point in being disappointed, but it must be dealt with professionalism.

Categories
Forex Price Action

Weekly High/Low Breakout Trading: Importance of Candles’ Body before Making a Breakout

In today’s lesson, we are going to demonstrate an example of an H4 chart that seems promising to make a breakout at the last week’s low. It produces a strong bearish candle as well at last, but the price does not head towards the South. We try to find out the possible reason behind that.

It is an H4 chart. The chart shows that the price heads towards the South with good bearish momentum. The price bounces twice at a level of support. The pair closes its trading week by producing a bearish candle.

The pair starts its next week by producing a bullish engulfing candle. It means the breakout length gets bigger, which attracts the sellers more. The sellers are to wait for the price to make a bearish reversal candle followed by a breakout at the weekly low.

The price finds its resistance and produces two consecutive bearish candles. The sellers are to keep their eyes on the chart closely. It seems that the Bear is going to make a breakout soon. Let us proceed to the next chart to see what happens next.

The chart continues to produce bearish candles. However, it has not made a breakout at the weekly low yet. The last candle comes out as a spinning top closing within the weekly low.

The chart produces a spinning top followed by a bullish engulfing candle. The price then consolidates within the last week’s low and a new resistance. The last candle comes out as a bearish engulfing candle closing just below the weekly low. The question is whether it should be considered as a breakout. It is a breakout, but the H4 traders should skip taking entry on this chart based on a weekly high/low breakout. The reason behind that is the chart takes too long to make the breakout. Once the price starts trending, it must make a breakout without producing any reversal candle. It means if the chart produced the last candle right after the first spinning top; it would be a hunting ground for the sellers. Since it produces four bullish reversal candles before making the breakout, the chart does not belong to the H4 traders based on the weekly low anymore. We must not forget that it must consolidate after a breakout, though. It means it must produce bullish reversal candle/candles in case of a bearish breakout, but it must make a breakout only by producing bearish candles and vice versa.

Categories
Forex Elliott Wave Forex Market Analysis

Hang Seng Moves in an Incomplete Flat Pattern

Overview

The Hang Seng Index continues advancing mostly sideways in an incomplete bearish sequence, corresponding to a flat pattern sequence, still in progress. Once the current corrective formation ends, the Chinese benchmark will likely start developing a new long-term bullish cycle.

Market Sentiment Overview

The Chinese benchmark Hang Seng Index (HSI) shows a drop of over 12% (YTD). However, even when it has recovered 16 percent from the lows reached after the massive sell-off occurred during the first quarter of the year, the market sentiment of the Chinese benchmark index continues dominated by the bearish side. 

In the following Hang Seng’s daily chart, we can spot its 90-day high-low range. The figure exposes the index developing in a sideways movement happening since the second quarter of the year. On the other hand, the rejection of the 24,953.4 points suggests that the mid-term market sentiment is slightly bearish. 

Besides, considering that the Hang Seng Index moves on the 60-day weighted moving average, a short-term upward pressure is observed.

In conclusion, the Chinese benchmark’s market sentiment seems neutral, waiting for the price action to unveil the next trend’s direction.

Elliott Wave Outlook

Under an Elliott Wave perspective, Hang Seng’s big picture reveals the incomplete corrective movement from the end of a bullish cycle the Hang Seng Index initiated in mid-February 2016 from 18,278.8 pts. This bullish sequence ended its five-wave structural series when the Chinese benchmark reached its all-time high of 33,484.1 pts in late January 2018.

The next figure illustrates the HSI log chart on a 2-day timeframe. The price pattern reveals the Chinese benchmark moving mostly bearish on its wave (C) of intermediate degree labeled in blue, which seems incomplete. In this context, although HSI reached the minimum requirement for this movement: 100% of equal waves between waves A and C, the internal structure of its C wave is unfinished.

The following 4-hour chart exposes the internal structure of wave 4. We distinguish that the corrective structure has created two Minute degree segments, labeled in black on the figure. Considering that each leg follows an internal sequence subdivided into three waves, the Elliott Wave Theory leads us to expect its progression on a regular flat pattern.

On the other hand, short-term, the Hang Seng Index could develop a new upward movement subdivided into a five-wave sequence, which should complete the ((c)) wave of Minute degree labeled in black. Once this move ends, the Chinese benchmark could develop a new decline corresponding to a wave 5 of Minor degree, which should complete the (C) wave of Intermediate degree.

Finally, considering that the third wave of Minor degree labeled in green was the extended move, and considering the amplitude of wave 4, the fifth wave of Minor degree should not penetrate below the low of wave 3 located at 21,139.3 pts. In other words, the wave (C) of Intermediate degree identified in blue is likely not to end below 21,139.3 pts.

Categories
Forex Price Action

Disobeying the Breakout

In today’s lesson, we will demonstrate an example of a chart that makes a breakout, consolidates, and produces a reversal candle. However, it does not make a breakout at consolidation support. Thus, it does not offer an entry. Nevertheless, it makes a move towards the breakout direction later. We try to find out whether breakout traders find an entry from that move or not.

The chart shows that the price makes a long bearish move. It finds its support where it bounces twice. The chart ends its trading week by producing a Doji candle. The next week should be interesting.

The chart produces a bullish engulfing candle. The buyers may wait for the price to make a breakout at the last swing high. On the other hand, the sellers are to wait for the price to make a breakout at the last week’s low.

The chart produces a spinning top, and the price heads towards the South. It makes a breakout at the last week’s low. Thus, the sellers may keep an eye on this chart for the price to consolidate and produces a bearish reversal candle to offer them a short entry.

It produces a bullish engulfing candle. It is a strong bullish candle. However, the breakout level is still intact. If the level produces a bearish reversal candle followed by a breakout at consolidation support, the Bear may keep dominating in the pair.

The chart produces a Doji candle followed by a spinning top right at the breakout level. The sellers may go short below consolidation support. It looks it is a matter of time for the Bear to make a long move towards the South.

The chart produces a bullish candle breaching the breakout level. It spoils the sellers’ party. The weekly low is disobeyed by the H4 chart. Thus, the H4 sellers may skip taking entry on this chart. The chart becomes no hunting zone for both the buyers and the sellers as far as the H4 chart is concerned. Let us proceed and find out what happens next.

The price makes a bearish move. The pair is trading below the last week’s low. Look at the momentum. The price has been rather sluggish to head towards the South. It is because the pair is traded on other minor charts. As mentioned, if the price disobeys breakout on a chart, it is better not to trade based on that chart. The price may go either way, which makes things difficult for the traders to trade.

Categories
Forex Daily Topic Forex Price Action

Fibonacci Extension: How It Helps Traders

In today’s lesson, we will demonstrate an example of an H4 chart that makes a breakout heading towards the North. However, the chart does not offer entry. We try to find out the reason behind it.

It is an H4 chart. The chart shows that the price makes a good bullish move. Thus, the weekly candle ends up being a bullish candle. Let us proceed to the next chart to see how the price starts next week.

The first candle comes out as a bearish engulfing candle. However, the support level where the price had a bounce and headed towards the North is intact. The buyers may eye on the chart for the price to have a bounce and make a bullish breakout at the weekly high.

The chart produces a bullish inside bar. The candle is produced right at the level of support. It is not a strong bullish reversal candle, but things look good for the buyers.

The chart produces three more bullish candles breaching the level of resistance. The buyers are to wait for the price to consolidate and produce a bullish reversal candle to offer them a long entry.

The price keeps heading towards the North without having consolidation. In naked eyes, it seems that the price has traveled a long way. If it consolidates now, should the buyers go long?

The chart produces a bearish candle. It means the price may consolidate now. The breakout level is far away. If the price makes a bearish correction up to the breakout level, it will come out as a long bearish wave. This often changes the trend or makes the price get choppy, at least. Let us draw a Fibonacci Extension and explain it with the Fibonacci levels.

We know when the price makes a breakout; Fibonacci Extension can be used to determine the wave’s length. The breakout length is measured at 23.6%. The best level for the price to consolidate within 23.6% to 38.2% or 38.2% to 50.0%. Over here, the price consolidates within 61.8% to 78.6%. It means the price does not have much space to travel. Thus, the buyers may skip taking entry on this chart as far as the risk-reward ratio is concerned. The price may go up to the level of 100.0%, but it often ends up being choppy or makes a reversal in such cases. This is when Fibonacci Extension comes out as a handy tool with what traders can determine the trend’s potential length and calculate whether they should take an entry or not.

Categories
Forex Market Analysis

Daily F.X. Analysis, October 26 – Top Trade Setups In Forex – New Home Sales in Play! 

On Monday, the market is likely to exhibit thin trading volume and volatility in the wake of the Labor day holiday in New Zealand, while the other economies are expecting to release low impact events that may keep the market unchanged. Most of the focus will stay on the U.S. New Home Sales data that may help drive some market volatility today. 

Economic Events to Watch Today  


EUR/USD – Daily Analysis

The EUR/USD pair was closed at 1.18562 after placing a high of 1.18646 and a low of 1.17865. The movement of the EUR/USD pair was bullish on Friday. Things in European nations were getting out of control and led the governments to impose further restrictions to curb coronavirus’s effect on the economy. France, Italy, and Spain reported a record rise in the daily infection cases that urged their governments to impose curfews and lockdowns.

However, the single currency managed to remain bullish on Friday despite the rising number of coronavirus cases in Europe as the focus of traders shifted more towards the U.S. dollar. The coronavirus condition in the U.S. was also not better as the country reported a record-high number of 82,668 cases in a single day and weighed on the U.S. dollar that ultimately supported the bullish trend of the EUR/USD pair on Friday.

On the data front, at 12:15 GMT, the French Flash Services PMI for October dropped to 46.5 against the forecasted 47.0 and the previous 47.5 and weighed on Euro. The French Flash Manufacturing PMI came in as 51.0 against the expected 51.3 and previous 51.2. AT 12:30 GMT, the German Flash Manufacturing PMI raised to 58.0 against the expected 55.0 and previous 56.4 and supported the single currency. Simultaneously, the German Flash Services PMI raised to 48.9 against the expected 49.6 and previous 50.6 and weighed on the single currency Euro.

At 13:00 GMT, the Flash Manufacturing PMI from Eurozone for October raised to 54.4 against the projected 53.0 and previous 53.7 and supported the single currency Euro. Whereas the Flash Services PMI from the whole bloc dropped to 46.2 from the anticipated 47.1 and the previous 48.0, it also weighed on the single currency Euro. At 17:59 GMT, the Belgian NBB Business Climate from Europe came in as -8.5 against the forecasted -11.2 and supported the single currency. The Eurozone’s macroeconomic data was mixed and failed to provide any meaningful direction to the currency pair EUR/USD on Friday.

From the U.S. side, at 18:45 GMT, the Flash Manufacturing PMI came in line with the expectations of 53.5 for October. The Flash Services PMI from the U.S. for October advanced to 56.0 from the projected 54.7 and supported the U.S. dollar that ultimately capped further gains in EUR/USD pair.

Another factor that kept the additional gains in EUR/USD pair supported was the improved risk sentiment as President Donald Trump and Democratic Joe Biden took part in the final debate of the presidential election campaign in Nashville, Tennessee. The final debate was far more civilized than the previous one, and it potentially led to an additional tightening in the polls that raised the risk sentiment in the market and supported the EUR/USD pair.

Daily Technical Levels

Support Resistance

1.1796     1.1853

1.1776     1.1888

1.1740     1.1909

Pivot point: 1.1832

EUR/USD– Trading Tip

The EUR/USD is trading with a slightly bearish bias at the 1.1836 level, holding mostly below an immediate resistance level of 1.1865 area. Closing of candles below the 1.1866 level may drive selling bias until the 1.1811 level that marks 38.2% Fibonacci retracement level. Continuation of a selling bias may lead the EUR/USD pair further lower until 1.1770, the 50% Fibo level. Conversely, the bullish breakout of the 1.1866 area can open further room for buying until the 1.1910 level today. 


GBP/USD – Daily Analysis

The GBP/USD pair was closed at 1.30400 after placing a high of 1.31221 and a low of 1.30189. Overall the movement of the GBP/USD pair remained bearish throughout the day. The GBP/USD pair was down on Friday as the U.S. dollar gained traction on board and made GBP/USD pair weak. As well As, the retreat inequity and risk sentiment also hit the Pound that dropped to fresh lows.

Wall Street’s equity prices went lower on Friday and raised the greenback on board that ultimately dragged GBP/USD pair on the downside. The Dow Jones was down by 0.10%, and NASDAQ was down by 0.18%. The expectations for a new round of fiscal stimulus by the U.S. government before elections faded away and supported the U.S. dollar that ultimately weighed on GBP/USD pair.

Meanwhile, the Chief EU Brexit negotiator Michel Barnier will provide his weekly assessment of the talks and could point to a lack of meaningful progress despite intensifying talks. The British Brexit negotiator, David Frost, could also do that, and these concerns kept the British Pound under pressure at the ending day of the week.

However, the cautious optimism was prevailing in the market as the E.U. and U.K. had resumed talks related to the Brexit deal. The French President has said to the local fishing industry to brace for an impact that indicated a close deal. Whereas the investors were still cautious as talks could be bent on either side, British Pound remained under pressure ahead of the talks’ results. Moreover, the rising number of coronavirus cases in the United Kingdom pressured the authorities to impose a new full lockdown; however, some were refusing to do so as it had already cost the economy too much. These tensions in the local country also kept the British Pound under pressure.

On the data front, at 04:01 GMT, the GfK Consumer Confidence from Great Britain dropped to -31 against the expected -28and weighed on British Pound and added losses in GBP/USD pair. At 13:30 GMT, the Flash Manufacturing PMI for October remained flat with the anticipated 53.3, and the Flash Services PMI dropped to 52.3 against the projected 53.4 and weighed on British Pound and pulled the pair GBP/USD even lower.

From the U.S. side, at 18:45 GMT, the Flash Manufacturing PMI came in line with the anticipations of 53.5 for October. The Flash Services PMI from the U.S. for October raised to 56.0 from the expected 54.7 and supported the U.S. dollar that ultimately dragged the GBP/USD pair on the downside on Friday.

Daily Technical Levels

Support Resistance

1.3049     1.3129

1.3021     1.3179

1.2970     1.3208

Pivot point: 1.3100

GBP/USD– Trading Tip

The GBP/USD traded with a selling bias below an immediate resistance area of 1.3075. Below this, the cable has closed a bearish engulfing candle that may drive selling bias until 1.3013 level. Violation of 1.3013 level can open further room for selling until 1.2965 area, the level that’s extending support due to upward trendline on the 4-hour timeframe. The MACD and RSI are in support of selling bias today. Consider opening sell trades below the 1.3075 level today. 


USD/JPY – Daily Analysis

The USD/JPY pair was closed at 104.695 after placing a high of 104.934 and a low of 104.545. The USD/JPY pair moved in a bearish trend throughout Friday. The USD/JPY pair fell on Friday after the final presidential debate between U.S. President Donald Trump and Joe Biden before the November 3rd election.

The Final debate between two presidential candidates took place in Nashville, Tennessee. This final debate was more restrained than the first one. The center of the discussion was on policy rather than a personal attack.

It looked like investors were closing their long positions ahead of the elections and were hesitant to place any big position ahead of November 3 as polls before the final debate turned, so it became difficult to project the outcome of elections.

Investors were also keeping a close eye on the negotiations between House of Representative Speaker Nancy Pelosi and the U.S. Treasury Secretary Steven Mnuchin over the next round of U.S. stimulus package. Pelosi has expressed optimism that a consensus could be reached. In contrast, the expectations that a U.S. stimulus package could be delivered before elections faded away as the date of the election has come closer.

These hopes that a stimulus relief bill could not be delivered ahead of elections, whether both parties agreed on the package’s size as the election was only a week away, supported the U.S. dollar and capped further losses in the USD/JPY pair on Friday.

On the data front, at 04:30 GMT, the National Core CPI from Japan for the year came in as -0.3% against the forecasted -0.4% and supported the Japanese Yen that added in the USD/JPY’s losses. At 05:30 GMT, the Flash Manufacturing PMI dropped to 48.0 from the projected 48.4 and weighed on the Japanese Yen.

Daily Technical Levels

Support Resistance

104.18     105.35

103.68     106.00

103.02     106.51

Pivot point: 104.84

USD/JPY – Trading Tips

The oversold USD/JPY pair is taking a bullish turn now, perhaps to complete Fibonacci retracement at 104.900 level. This level is extended by a 38.2% Fibonacci retracement level, and it may extend resistance to the USD/JPY pair today. Continuation of a bullish bias over the 104.900 level can lead the USD/JPY pair further higher until the 105.225 level. The MACD and RSI are also supporting bullish bis in the USD/JPY pair today. However, the pair seems to have formed a bearish flag on the 4-hour timeframe that typically breakout on the lower side; if that happens, we may see USD/JPY price dropping until the 104.350 mark. Good luck! 

Categories
Forex Market Analysis

Daily F.X. Analysis, October 23 – Top Trade Setups In Forex – European PMI In Highlights! 

The economic calendar is filled with medium impact economic events such as Unemployment Claims, C.B. Leading Index m/m, and Existing Home Sales from the United States on the news front. Besides, the Consumer Confidence from the Eurozone will also remain in the highlights today. The market may show some price action during the U.S. session on the release of U.S. Jobless Claims. 

Economic Events to Watch Today  


EUR/USD – Daily Analysis

The EUR/USD closed at 1.18184 after placing a high of 1.18666 and a low of 1.18111. The EUR/USD pair was down and remained bearish on that day. As the market sentiment deteriorated and the U.S. dollar moved stronger across the board, the EUR/USD pair dropped on a session by 0.3% and remained one of the worst G10 performers on Thursday.

The common currency put an end to a four-day rally on Thursday as the hopes of the next round of U.S. stimulus deal faded away. 

The U.S. President Donald Trump crushed the risk appetite on Thursday after blaming Democrats for not compromising an acceptable agreement. This raised the U.S. dollar on board from its seven-week lowest level. The hopes for the next round of U.S. stimulus package were faded after Trump blamed Democrats that they were unwilling to compromise on the relief aid bill’s size. However, the talks were continuing, and it is uncertain whether a stimulus package is delivered before the Presidential elections or not.

The faded hopes dampened the risk sentiment and added strength to the U.S. dollar that ultimately added weight on the EUR/USD pair on Thursday. Furthermore, the rising number of coronavirus cases in Europe also weighed on the EUR/USD pair. In Europe, the daily number of infections reached record levels, with Spain becoming the first western country to report one million cases. These rising numbers of coronavirus cases from Europe also undermined the Euro currency’s confidence, ultimately added to the losses of the  EUR/USD pair.

On the data front, at 11:00 GMT, the German GfK Consumer Climate came in as -3.1 against the forecasted -2.9 and weighed on Euro currency that added in the losses of EUR/USD pair. At 18:52 GMT, the Consumer Confidence from Europe was also declined to -16 from the projected -15 and weighed on the single currency and added in the losses of EUR/USD pair. From the U.S. side, the Unemployment Claims from last week were dropped to 787K against the projected 860K and supported the U.S. dollar. At 19:00 GMT, the Existing Home Sales also raised to 6.54M against the forecasted 6.20M and supported the U.S. dollar that ultimately weighed on EUR/USD pair.

Apart from macroeconomic data, the European Central bank has also hinted that the Eurozone’s economy was in for a bumpy road ahead. The President of ECB Christine Lagarde also warned about the effects of the second wave of coronavirus on the economy. So, the weak outlook of the Eurozone economy also weighed on EUR/USD pair.

Daily Technical Levels

Support    Resistance

1.1828     1.1889

1.1795     1.1915

1.1768     1.1949

Pivot Point: 1.1855

EUR/USD– Trading Tip

The bullish bias of the EUR/USD has weakened as the pair fell from the 1.1880 level to a 50% Fibonacci retracement level of 1.1805 level. This level’s violation may trigger further selling until the 1.1769 area that marks 61.8% Fibonacci retracement for the EUR/USD. The EUR/USD is likely to exhibit further selling bias today, especially after violating the 1.1770 level to 1.1740 level. The MACD and RSI are also supporting the bearish bias; therefore, bearish bias remains dominant today. The EUR/USD may face resistance around 1.1837 and 1.1880 level today.


GBP/USD – Daily Analysis

The GBP/USD closed at 1.30822 after placing a high of 1.31517 and a low of 1.30704. Overall the GBP/USD pair remained on the downside all through the day. The GBP/USD pair gave up some ground and remained bearish on Thursday amid the broad-based U.S. dollar come back. However, the GBP/USD pair managed to stay in the upper half of its weekly range.

The British Pound fell on Thursday, although the talks between the E.U. & U.K. resumed on the day. The reason could be attributed to the brinkmanship from Britain amid negotiations, risk an accidental no-deal Brexit. On Thursday, the top E.U. Brexit negotiator Michael Barnier arrived in London to intensify talks with his British counterpart David Frost to break the impasse and find a solution to key sticking points, fisheries, and state aid.

The fisheries have long been a debating point in the Brexit negotiations as the U.K. has been determined to control access to its waters after the transition period ends. U.K. has refused to stick with the E.U.’s common fisheries policy that set fishing quotas among the E.U. member states. The transition period has come near to end with just months to go, and the U.K. has refused to allow talks to run past the year-end deadline. According to a spokesman for UK PM Boris Johnson, the time has remained very short as the U.K. has been reportedly clear that any agreement should be placed before the end of the transition period.

The concerns have raised in the market that the U.K.’s strategy to be somewhat tough on talks and deadlines could risk an accidental no-deal Brexit as the end of the year is coming ahead. These concerns weighed on the Sterling and added the GBP/USD pair’s losses on Thursday.

On the data front, the CBI Industrial Order Expectations from the U.K. came in as -34 against the forecasted -50 and supported British Pound. 

However, from the U.S. side, the Unemployment Claims from the previous week declined to 787K against the forecasted 860K and supported the U.S. dollar. The Existing Home Sales also supported the U.S. dollar after rising to 6.54M from the anticipated 6.20M. The positive data from the U.S. exerted pressure on GBP/USD pair on Thursday. Meanwhile, the Bank of England Governor Andrew Bailey told of strong demand to invest in climate change technology. He also sketched a strong demand for green investment. Looking forward, market participants will await the release of PMI for services and manufacturing activities to find a fresh clue about GBP/USD pair.

Daily Technical Levels

Support    Resistance

1.3049     1.3129

1.3021     1.3179

1.2970     1.3208

Pivot point: 1.3100

GBP/USD– Trading Tip

The GBP/USD traded bearishly below the 1.3165 resistance area to trade at the 1.3070 level that marks the 38.2% Fibonacci retracement level for the Sterling. On the further downside, the GBP/USD pair may take another dip until the 61.8% Fibo level of 1.3018 as the MACD is still pointing towards the selling area. At the moment, Sterling’s immediate resistance holds at the 1.3070 mark; however, the closings below this level is supporting the selling bias. Consider opening sell trades below the 1.3100 level today. 


USD/JPY – Daily Analysis

The USD/JPY pair was closed at 104.884 after placing a high of 104.921 and a low of 104.474. The movement of the USD/JPY currency pair stayed bullish throughout the day. The USD/JPY pair traded with a positive note during the whole Thursday session after a goodish pickup in the U.S. dollar demand. The rebounded U.S. dollar helped currency pair USD/JPY to gain positive traction and move away from the six-week lowest level it touched on Wednesday.

The slow progress in the U.S. stimulus measure package attracted some buying in the greenback that dampened the hopes that financial aid will be delivered before elections. The statement by House of Representatives Speaker Nancy Pelosi that soon there will be pen to paper on the stimulus bill failed to impress investors, and the USD/JPY pair continued moving in the upward direction.

Pelosi even said that the stimulus package could be passed in the House before election day. Still, investors were somewhat unconvinced that the bill could pass through the Senate due to the strong opposition from Republicans over a bigger stimulus deal. This, in turn, weighed on risk sentiment and supported the Japanese Yen that ultimately capped further upside in the USD/JPY pair prices.

Apart from developments surrounding the U.S. fiscal stimulus, the USD bulls further took clues from the better than expected release of the U.S. initial jobless claims. The number of Americans filed for unemployment benefits declined to 787K during the previous week for the first time against the projected 860K and supported the U.S. dollar. The decline in unemployment claims means less need for a U.S. stimulus package and more strength for the U.S. dollar and USD/JPY pair.

On the data front, the C.B. Leading Index from the U.S. dropped to 0.7% against the expected 0.8% and weighed on the U.S. dollar. The Existing Home Sales advanced to 6.54M in comparison to projected 6.20M and supported the U.S. dollar. Another favorable economic data release gave strength to the U.S. dollar that pushed the USD/JPY pair even higher on grounds.

Meanwhile, the rising number of coronavirus cases across the globe and fears for economic recovery due to lockdowns imposed to curb the spread of the virus raised the safe-haven appeal, supported the Japanese Yen, and weighed on the USD/JPY pair to limit its bullish move on Thursday.

On Thursday, the U.S. Dollar Index measures the greenback against the six currencies’ basket surge by 0.4% to 92.97. The U.S. dollar index fell to its seven-week lowest level at 92.46 on Wednesday but recovered from there on the next day amid a strong U.S. dollar despite the talks for stimulus package continued. However, traders’ focus will now be shifted towards the final presidential debate between President US Donald Trump and his Democratic rival Joe Biden.

Daily Technical Levels

Support    Resistance

104.18     105.35

103.68     106.00

103.02     106.51

Pivot point: 104.84

USD/JPY – Trading Tips

The USD/JPY traded dramatically bearish to drop from 105.460 level to 104.349 level. Like other pairs, the USD/JPY has also entered the oversold zone, and now sellers seem to be exhausted. On the higher side, the USD/JPY pair has reversed some of the losses to trade at the 104.700 level. On the higher side, the pair may go after the 38.2% Fibonacci retracement level of 104.900 and 50% Fibo level of 105. Let’s consider taking a buying trade over 104.350 area today. Good luck! 

Categories
Forex Daily Topic Forex Price Action

Price Action Trading: Reasons to Skip Entries on Charts with Price Gap

Forex charts often have price gaps. It usually occurs in minor time frames. However, it sometimes occurs in time frames such as the H1, H4, daily chart as well. Since price movement is the key factor determining its next move for the price action traders, thus price gap creates confusion in price action trading. Thus, it is best to skip taking entries on charts with a price gap. Let us demonstrate an example and find out the reason behind it.

It is an H4 chart. The chart shows that the price produces a bullish engulfing candle right at a support level, where the price has several bounces. Thus, the H4-H1 combination traders may flip over to the H1 chart to go long in the pair.

The H1 chart shows that the price heads towards the North with good bullish momentum. The buyers are to wait for the price to consolidate and produce a bullish reversal candle to offer a long entry.

The chart produces a bearish engulfing candle. It is a strong bearish candle. However, the buyers may wait for the price to be held at a key level and produce a bullish reversal candle. Let us proceed to find out what happens next.

The chart produces a bullish reversal candle. It is an inverted hammer. Moreover, it is produced with a bullish price gap. Technically, the H4-H1 chart combination traders may trigger a long entry above the level of resistance. Here is an equation that must be considered if they are to determine risk-reward by using Fibonacci retracement. We find this out soon. Let us see how the price reacts now.

What a good bullish move it is! The price heads towards the North with very good momentum. The last candle comes out as a bearish candle. It suggests that the price may make a bearish correction. Let us now draw Fibonacci levels and explain the chart with some Fibonacci numbers.

Categories
Forex Daily Topic Forex Price Action

Importance of Choosing the Right Chart

In today’s lesson, we will demonstrate an example of a chart that makes a breakout at the weekly low, consolidates, and produces an excellent bearish engulfing candle. It looks like a good short entry for the sellers. However, things do not go as the sellers would love to see. We try to find out what may be the reason behind it.

It is the H4 chart. The chart shows that the price action has been choppy for the last three weeks. The price has been roaming around within two horizontal levels. Ideally, the price action traders would love to skip eying on such a chart to trade at. Let us proceed and see the H4 chart of the last week.

The chart shows that the price makes a bullish move to start its trading week. Then, it makes a bearish move and closes around the level where it started its week. It seems that the minor time frame sellers are driving the price down.

The chart produces a bullish engulfing candle right at the last week’s swing low. The minor time frame traders may push the price towards the North. The H4 sellers, on the other hand, may wait for the price to make a breakout at the swing low to go short on the chart. This is what the breakout traders usually do. However, the question is whether they should do it on this chart or not? We find it out in a minute.

It seems that the Bear is about to make a breakout at the last week’s low. The last candle comes out as a bearish engulfing candle closing right at the level of support.

The price makes a breakout at the weekly low. The last candle comes out as a bearish candle closing well below the level of support. The breakout traders are to wait for the price to consolidate.

The price consolidates. The last candle comes out as a bearish inside bar. If the price makes a breakout at the last swing low, the breakout traders usually trigger a short entry. Let us proceed and see what the price does.

The chart produces a bearish engulfing candle. It is an A+ signal candle as far as the breakout trading strategy is concerned. The sellers may want to trigger a short entry right after the last candle closes.

The chart produces a bullish engulfing candle and heads towards the North instead. The Forex market is unpredictable. The price could go either way anytime. However, it looks strange after the chart producing such a nice signal candle. There is nothing wrong with the entry apart from the fact that the chart has been choppy for the last three weeks. It means either the pair is waiting for a high impact news event to find its new direction or traded based on a bigger time frame. In a word, the price action traders may skip eying on such a chart to trade at. For them, choosing the right chart plays a vital role. Today’s example proves it again.

Categories
Forex Daily Topic Forex Price Action

Determinin Risk/Reward using Fibonacci Levels

In today’s lesson, we are going to demonstrate an example of a daily-H4 chart combination trading. We also find out how the price reacts to Fibonacci retracement levels and how Fibonacci levels may help us determine risk-reward. Let us start with the daily chart.

This is the daily chart. The chart shows that the price heads towards the North with good bearish momentum and crosses a long way. The last candle comes out as a spinning top with a bullish body. It is a bullish reversal candle, but not a strong one. Let us flip over to the H4 chart and see how it looks.

The chart shows that it produces a morning star. It is a strong bullish reversal pattern. The last candle comes out as a bullish inside bar. The buyers may wait for the price to find its support and produce a bullish reversal candle to go long on the chart.

The price heads towards the South to have a bearish correction. The last candle comes out as a Doji candle. It seems that the price may have found its support. It may not take long to produce a bullish reversal candle.

As expected, the chart produces a bullish engulfing candle closing well above the last swing low. Traders love to have a signal candle like this to trigger an entry. It usually attracts more traders to trade and brings more liquidity. However, here is an equation that we must remember. When the price makes a correction, it is good for the traders to have an engulfing candle as a signal candle closing within the last swing low. It offers the price to travel more space towards the trend. However, when the price consolidates, it must make a breakout at the last support/resistance, though. Let us find out how the price moves after that bullish engulfing candle.

The price heads towards the North with a sluggish pace. Moreover, the price gets caught within two horizontal levels for several candles. It seems that the price is struggling to go towards the North further. Let us draw Fibonacci levels and try to find out the reason behind it.

The chart produces the signal candle at the 61.8% level, which is fantastic. Usually, the price goes towards the level of 161.8% if it trends from the 61.8% level. Over here, the candle closes at 123.6% level, which means the price does not have enough space travel. This is why the price moves towards the North sluggishly. Fibonacci levels help us determine where to set stop loss and take profit. It also helps us determine the risk-reward, which we must not forget.

Categories
Forex Market Analysis

Russell 2000’s advance Boosted by Stimulus Talks

Overview

The Russell 2000 index, grouping the 2,000 U.S. small-cap companies, began this trading week, maintaining its previous week’s gains driven by the economic stimulus talks. The price action continues supporting fresh highs that could lead Russell 2000 to erase its yearly losses.

Market Sentiment Overview

The US benchmark that groups the 2000 small-cap companies continues its recovery, reaching new highs, soaring to 1,649.05 pts in the first trading session of the week. 

After President Trump’s return to the White House activities, the investor sentiment is driven by negotiations about a new economic stimulus. In this context, market participants seem to be buying the rumor of further stimulus for the economy before the presidential elections that will take place on November 03rd.

The chart below shows the 52-week high and low range of Russell 2000, in which the price action unveils the advance in the extreme bullish sentiment zone. In turn, Russell 2000 continues developing its action above the 60-day short-term moving average, following the direction and the dominant bullish sentiment in the American stock market. 

In the previous chart,  we observe that the bullish momentum maintained by Russell 2000 could exceed the annual opening value of 1,672.13 pts. In this process, the US small-cap index could erase all of the losses originated by the massive sell-off that happened in the second half of February.

On the other hand, the next figure corresponds to the Russell 2000 Volatility Index (RVX) in its daily timeframe, highlighting the bearish breakdown from the sideways range maintained since September 21st. This breakdown led the RVX to re-enter the extreme bearish zone, supporting the extreme bullish sentiment of Russell 2000.

Consequently, the market sentiment context for Russell 2000 continues to favor bullish movements that could go as far as the approval of the new economic stimulus or until the US presidential elections.

Technical Analysis Outlook

From a technical analysis perspective, The Russell 2000 in its 12-hour chart shows an upward movement that began on March 23rd when the price confirmed the floor of mass selling at 963.62 pts, which remains valid.

The previous chart unveils the mid-term bullish sequence, which started on June 14th at 1.316.42 pts. The upward movement developed by Russell 2000 is projecting an ascending channel in which the price is seen striking the channel’s upper line. This context points to a limited correction before continuing the short-term bullish trend.

On the other hand, the 94.62% level observed in the stochastic oscillator shows the Russel 2000 overbought; in turn, considering it as a timing indicator, it shows that it is not a suitable option for bullish entries under this circumstances.

The following 4-hour of the Russell 2000 shows the short-term trading zones at which bullish bias prevails. In this context, the bullish continuity, which would be confirmed after the break of the mid-term ascending channel’s upper line, has as key resistance levels 1,670.05 and 1,713.61 pts. A drop and close below the low of the week 1,633.94 pts could lead the price towards the following areas; 1,608.00 to 1,566.77 pts.

In conclusion, Russell 2000 holds its upward pressure; the market sentiment and price action continue to show further increases. Nevertheless, the extreme bullish sentiment backed by the news media created a market participants’ consensus, which assumes that the stock market will continue rallying with the economic stimulus approval. Thus, our bias remains on the neutral side.

Categories
Forex Price Action

Do Not Be Biased, Take Decisions According to the Chart

In today’s lesson, we are going to demonstrate an example of a chart that makes a good bullish move but ends up having a rejection at a double top resistance. The price then shows the potential to make a bullish breakout. However, it has another rejection around the last week’s high and makes a bearish breakout. It looks good for the sellers at the time. We find out what happens afterward.

This is the H4 chart. The price makes a long bullish move. It ranges for a while and then continues its bullish journey again. Look at the last candle on the chart. It comes out as a bearish inside bar. Do not miss the point that the candle is produced right at the resistance, where the price has had a rejection.

The chart produces a bullish candle to start the next week. It then ranges for a while and produces two bullish candles. It seems that the price may head towards the North and makes a bullish breakout at the last weekly high.

It does not. It rather finds its resistance around the same level. Moreover, it produces a bearish engulfing candle. To be more precise, the chart produces an evening star. It is a strong bearish reversal candle. Let us wait and see what the price does next.

The chart produces a long bearish candle breaching the last swing low. The breakout is significant since the price trends from the last weekly low. The sellers may keep their eyes in the pair to go short. Before going short on this chart, the sellers shall wait for the price to make a bullish retracement since the price is within the last weekly range. Keep that in mind that the price is to make a bullish correction to offer a short entry.

The price does not make a bullish correction. It rather consolidates and produces a bearish reversal candle. Since the price is within the last weekly range, so it is not a short signal.

Here it goes. The price gets choppy. This chart becomes a risky chart to trade. Thus, traders might as well skip eyeing on the chart to trade at. At first, it looks good for the buyers. Then, it shows potential for the Bear to dominate since the price has several rejections at the same level. However, it ends up being an extremely choppy chart.  Thus, do not be biased with your initial assumption. Wait for the breakout, confirmation, and then trade.