The wave analysis begins with a preliminary study of the basic patterns defined by the Elliott Wave Theory. In this educational article, we will view how to start to develop a wave analysis.

The Basic Concept
Glenn Neely, in his work “Mastering Elliott Wave,” introduces the concept “monowave” to describe a basic movement that develops the price within a price chart. However, by convenience, we will use the term “segment” hereafter to identify the basic move.
Waves Identification
The first step is the chart representation on the chart with which the entire wave study will be guided for it. The simplest way is to begin through a daily timeframe.
Concerning the type of chart, this could be a bar chart or a candlestick chart. This election does not be a limitation to advance in the wave analysis. In some cases, the use of a line chart could be useful in identifying structures.
Once chosen the asset to study, we will have to identify the lowest point, and the end of the first movement once identified these movements we identify the point where the move exceeds the end of the first wave.
The following chart corresponds to Copper in its daily range.
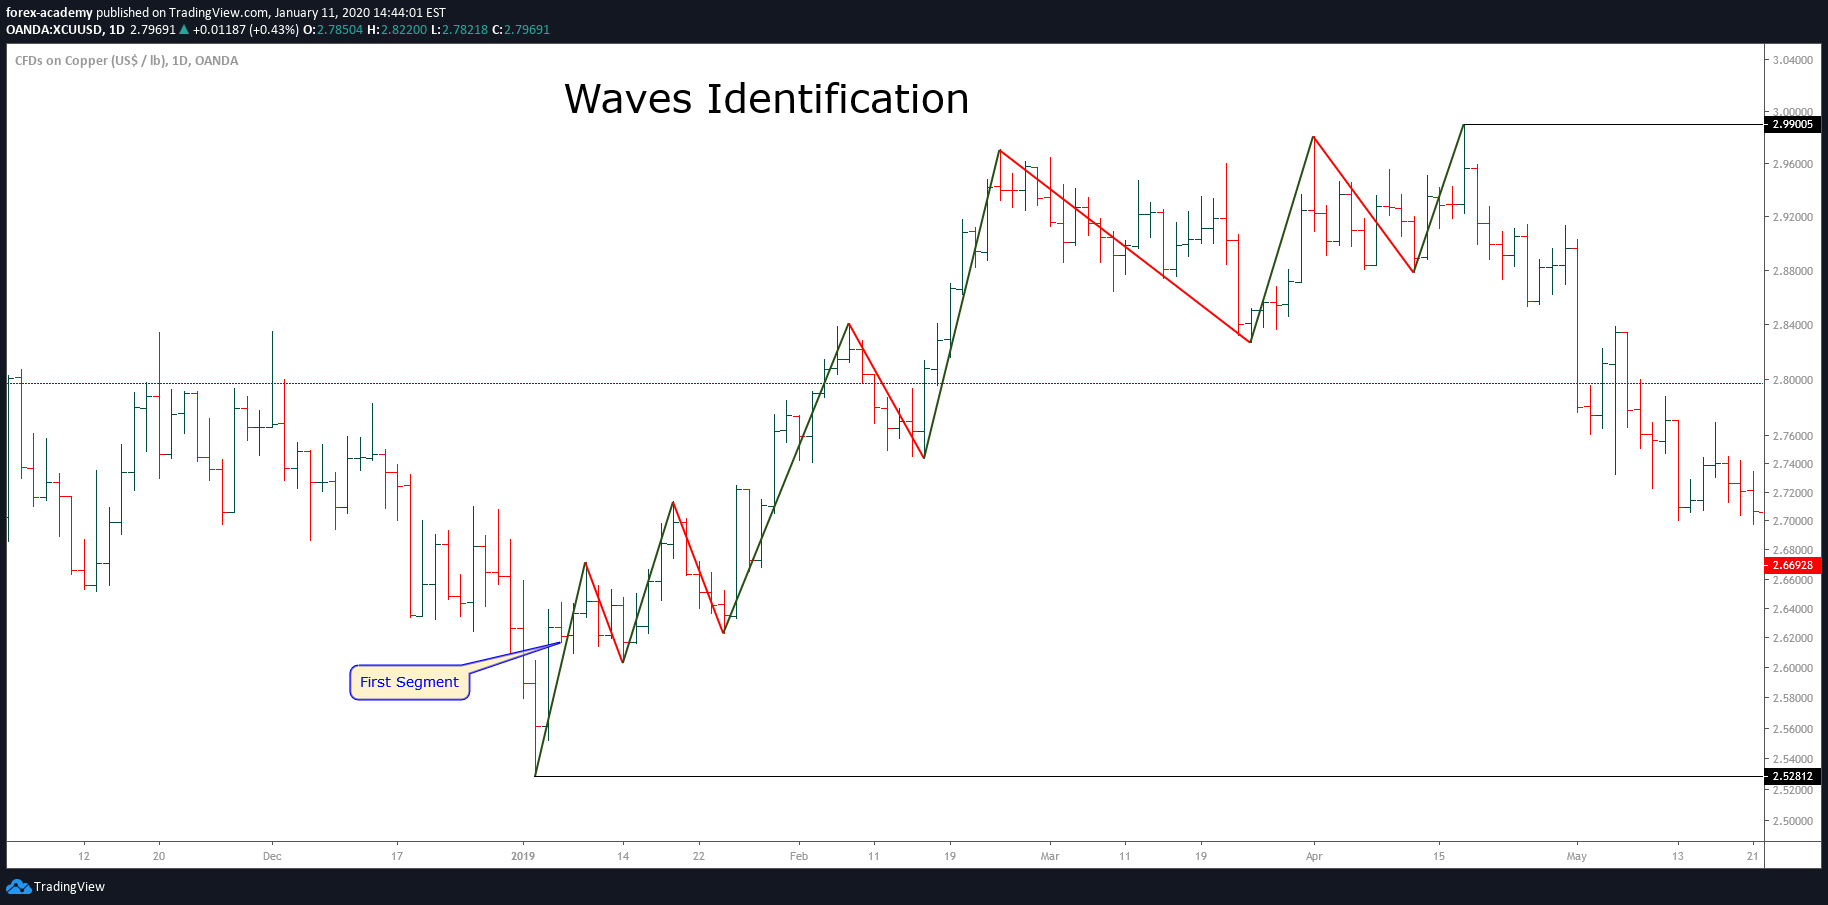
From the figure, we distinguish each segment that Copper develops in green, the upward move, and in red the downward movement.
The bullish sequence started in early January 2019, when Copper found buyers at $2.52 per pound. The red metal ended the upward path on April 17th, 2019, at $2.99 per pound.
Alibaba Still Moves Higher
The following example corresponds to Alibaba (NYSE: BABA) in its 2-hour timeframe. The chart exposes the rally developed by the e-commerce giant since October 08th, 2019, when BABA found fresh buyers at $161.92 per share.
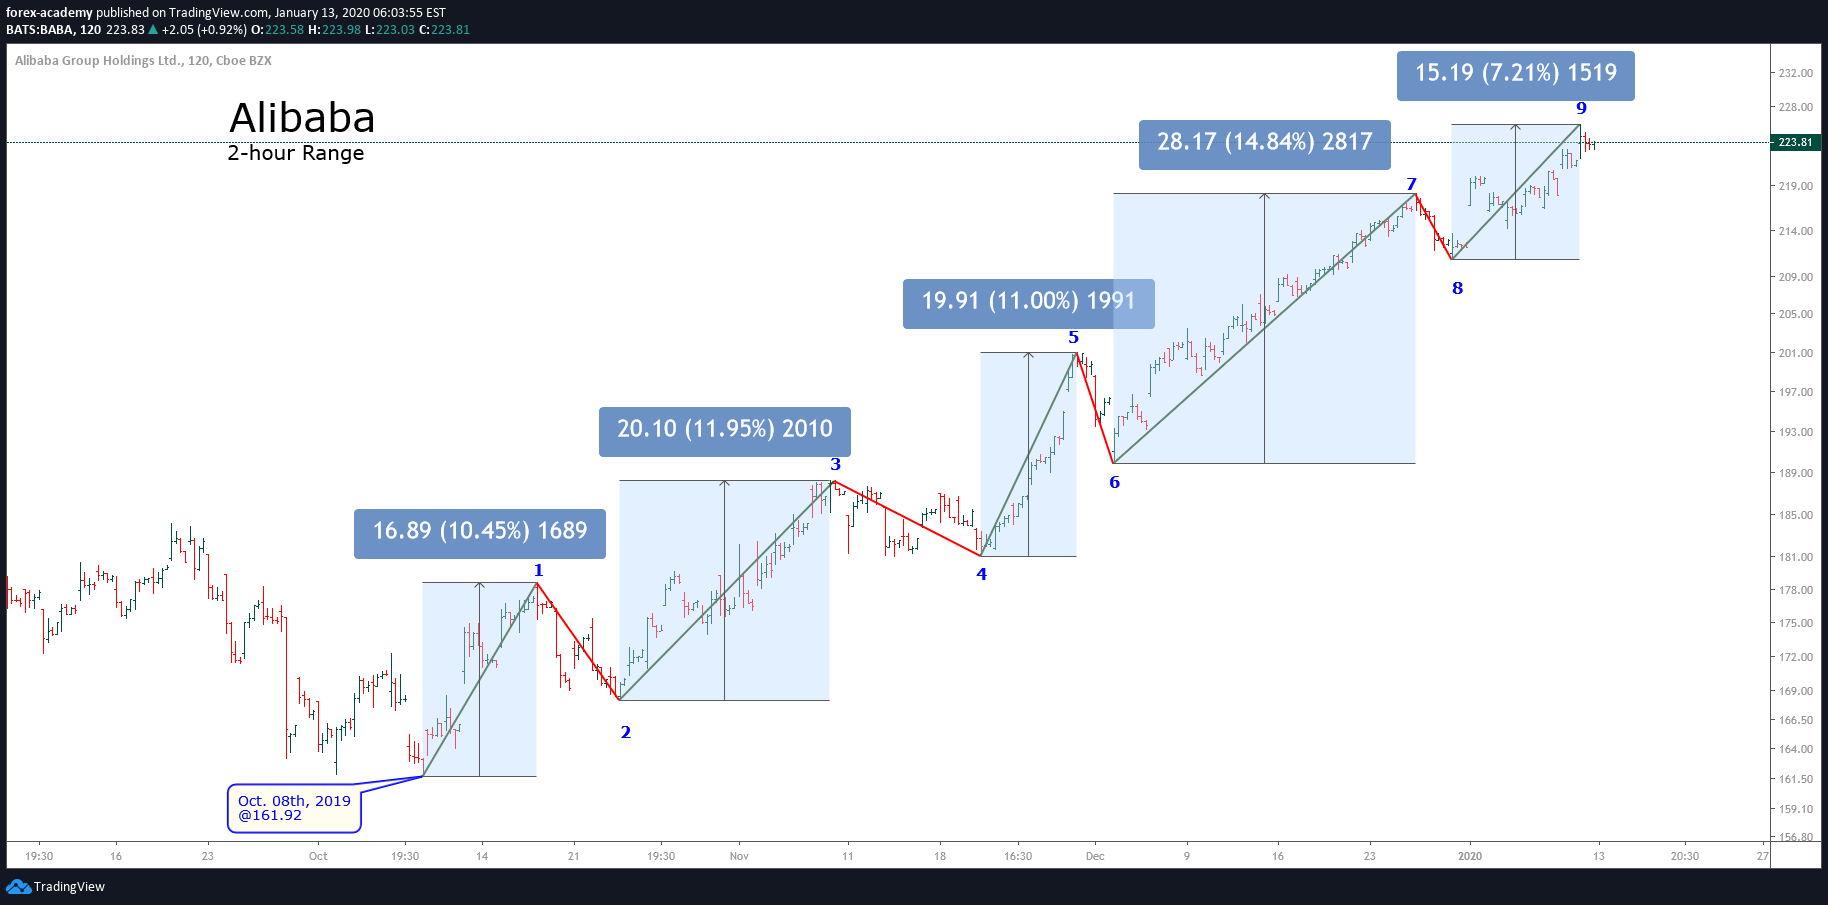
Once the price found support at $161.92, BABA started to move upward, building the first segment. We identified this first move as “1” labeled in blue, the section ends at $178.59 on October 17th, when the price reacted retracing the first segment. This drop is identified as “2”.
The third segment is active after the surpass of the end of the first move at $178.59. The third movement finishes at $188.17 per share. From this segment, we distinguish that the third movement is extender than the first segment. In other words, the first upward movement advanced $16.89, while the third progressed $20.10.
However, we observe that the seventh segment rallied $28.17, which is the most significant move developed by the entire bullish sequence that started on October 08th to date.
Conclusion
Wave identification is a first step that allows us to recognize the trend of each market in a specific timeframe. Due to the fractal nature of market movements, this procedure will be valid in any range of time.
Suggested Reading
- Neely, Glenn. Mastering Elliott Wave: Presenting the Neely Method. Windsor Books. 2nd Edition.