The triangle is a corrective pattern that has five internal segments. In this educational article, we will review how to analyze the triangle formation.

Triangles and their Characteristics
Within the set of corrective structures defined by R.N. Elliott, triangle formations are more complex to analyze compared to flat and zigzag patterns. This complexity occurs because there is no specific time span that marks the end of this structure.
Despite the complexity of the triangles, it is the most common Elliott pattern to find in the real market. The knowledge of this formation will help wave analysts to understand the price position within the market.
Construction Rules
The construction rules defined for the triangle pattern are detailed as follow:
– Triangles have five internal waves, regardless of the complexity of the inner segments.
– A complete three-wave corrective structure builds each part that makes up the triangle.
– The triangle can have a bullish or bearish inclination. However, its internal structure should not change.
– The triangle has six reference points of the same degree, the origin of wave A, and the end of waves A, B, C, D, and E. From these six extremes, the wave analyst should only channel four points through the contraction lines. The points to consider are the end of wave A with the end of wave C and the end of wave B with the end of wave D.
– The base-line of the triangle is the line that joins the end of waves B and D, and its function is similar to the guideline that joins waves 2 and 4 in an impulsive wave.
The following figure represents the construction model of the triangle pattern.
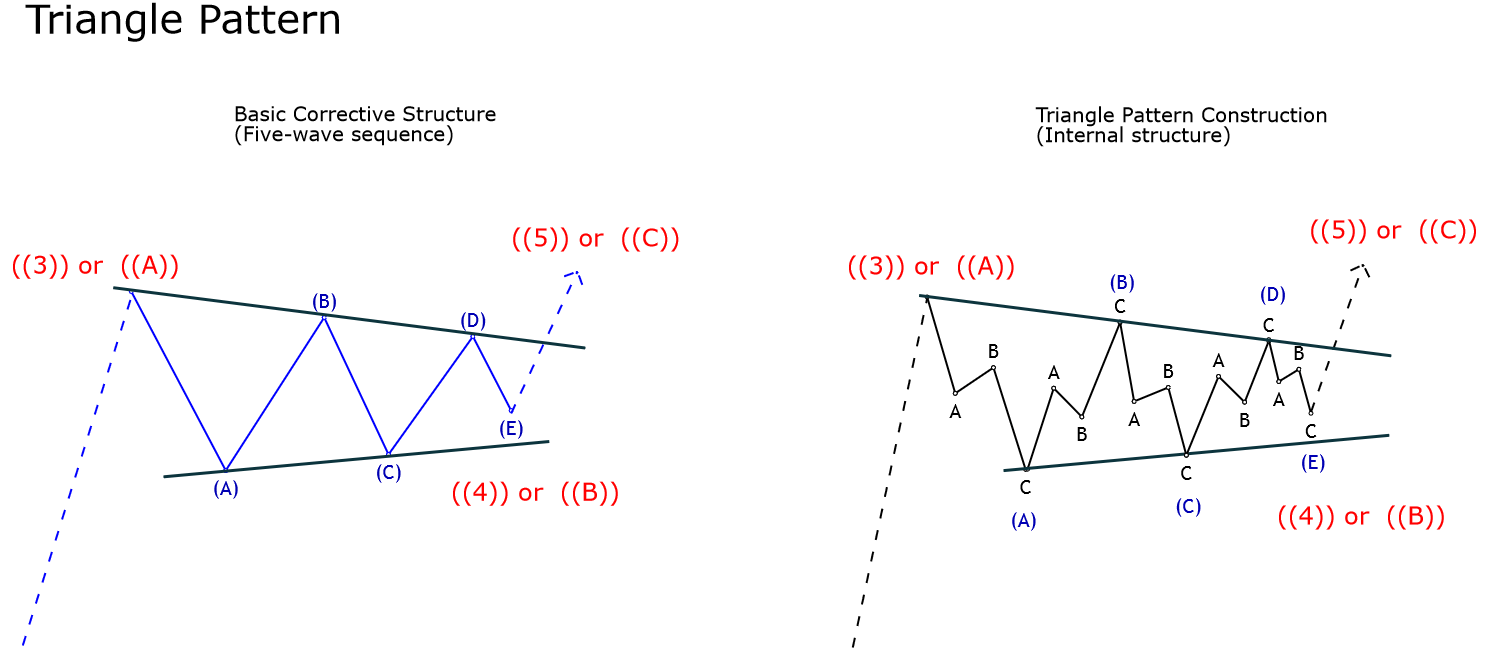
As can be noted, the triangle pattern tends to appear in a fourth wave or a wave B, in some exceptional cases, this pattern could appear in a second wave.
GBPUSD Consolidates in a Triangle Sequence
The next figure illustrates the GBPUSD pair in its 4-hour timeframe. In the chart, we observe that the Cable rallied since September 03rd when the price found its bottom at level 1.19589.

Once the GBPUSD pair moved in three waves identified in green, the fourth wave consolidated sideways, developing an expanding triangle.
The triangle pattern reveals the alternation principle in terms of time and price.
The GBPUSD pair alternated in terms of time being the triangle pattern more extended in comparison with the second wave. In the same way, the retracement developed by the second wave is sharp compared with the narrow correction realized by the fourth wave.
JP Morgan Consolidated in a Triangle Pattern
The chart below shows JP Morgan Chase & Co (JPM) in its log-scale 2-day timeframe. The ticker JPM developed a bullish impulsive sequence subdivided in five waves from early 2016 when the price found buyers at $52.50 per share.
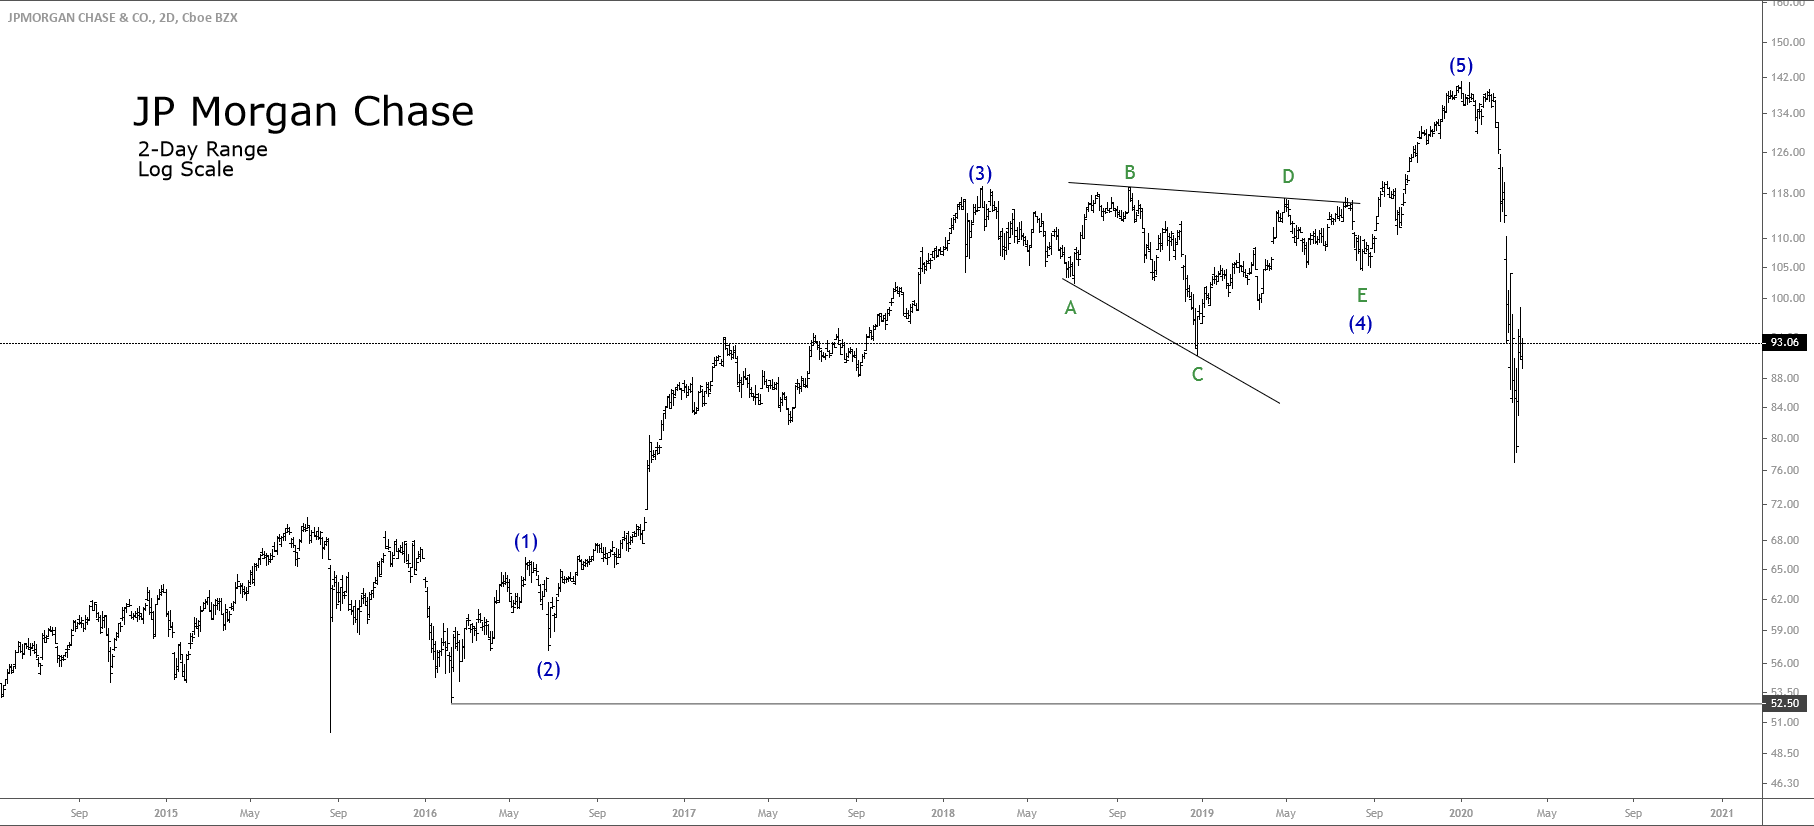
In the same way, the third wave that was formed corresponds to an extended wave, which makes us conclude that the first and fifth waves will not be extended, and they will be similar in terms of price, time, or both. In this case, both waves are identical in terms of time.
On the other hand, we observe that JPM consolidated developing an expanding triangle pattern with a slight bearish bias. Besides this structural bias, the internal sequence is respected by the price action.
Also, we distinguish the wide extension of the triangular sequence, which moved from late February 2018 until mid-August 2019, when JPM ended its internal wave E labeled in green.
Once JPM completed its fifth internal segment, the price action continued its previous bullish trend and soared to record highs at $141.10 per share.
Conclusions
From the cases analyzed, we can verify the Genn Neely’s affirmation that suggests that “the triangle pattern is a common formation that appears in the market.”
Also, we verified how the alternation principle works in the real market, while a corrective wave is simple, the other will be complex.
Finally, according to the examples reviewed, the triangle pattern could appear independently of the market analyzed, as on currencies, stocks, indices, etc.
In the next article, we will review the different variations of the triangle pattern.
Suggested Reading
- Neely, G.; Mastering Elliott Wave: Presenting the Neely Method; Windsor Books; 2nd Edition (1990).