Categories
Forex Market Analysis

EURCAD Looks Bouncing from Demand Zone

The EURCAD cross is still moving in a likely incomplete triangle pattern, developing since mid-March when the price found resistance on 1.59914. As pictured by the following 12-hour chart, the mid-term Elliott Wave structure shows the incomplete progress of a contracting triangle of Minor degree labeled in green.

Technical Overview

According to the Elliott wave theory, the triangle pattern follows an internal structure subdivided into 3-3-3-3-3 waves. In this context, the EURCAD triangle appears to be completing its third internal segment and start developing a new rally corresponding to wave D of Minor degree, identified in green.

On the other hand, considering the Alternation Principle, and in view that the movement developed by the wave C, in green seems like a complex corrective sequence, which took an extended time span, the following move -corresponding to wave D, could develop in a shorter time range. In this regard, it is possible that the cross would create an aggressive rally.

Short-term Technical Outlook

The short-term view displayed in its 12-hour chart (shown above) shows that the EURCAD reacted mostly upward in the demand zone identified in green between 1.54535 and 1.54273. This situation leads to expect that market participants could continue pushing it higher.

An alternative scenario considers the possibility of a new limited decline toward the next demand zone between 1.53688 and 1.53130. In this zone, the cross could find fresh buyers and complete its wave C of Minor degree, identified in green.

On the other hand, before taking any position on the bullish side, it is convenient to wait for the descending upper-line breakout that connects the waves (ii) and (iv). This would confirm the cross’s bullish bias. As for the targets, the suggested following movement, corresponding to wave D, in green, could rise till the next supply zone, located between 1.59139 and 1.59791.

Finally, the bullish scenario has its invalidation level at the end of wave A in green, located at 1.50562

Categories
Forex Elliott Wave Forex Market Analysis Forex Technical Analysis

Would you Trade this CADJPY Pattern?

The CADJPY cross moved up in the Tuesday trading session, boosted by the stock market’s risk-on sentiment. Although the cross advances 2.25% during the current month, the price is under -4% (YTD).

Technical Overview

The CADJPY prices represented in the next 12-hour chart reveal the short-term market participants’ sentiment moving in the 90-day high and low range. The figure illustrates the cross advancing mostly upward in the bullish sentiment zone.

On the other hand, the previous chart presents a contracting triangle, which began in early June when CADJPY found fresh sellers on 81.909, followed by a first support level at 77.614. According to the classic chartist theory, the triangle pattern distinguishes itself as a continuation formation. In this case, this contracting triangle suggests further upsides.

In this regard, the likely next move could lead to a test of its intraday resistance of 80.591: this level corresponds to the bullish sentiment zone’s resistance, as well. If the price overcomes it and extends its upward advance, the cross could reach its supply zone between 80.985 and 81.424, a level that matches the triangle pattern’s upper trendline.

Conversely, a downward correction could drop it to its demand zone between 79.468 and 79.237.

Short-term Technical Outlook

The short-term Elliott Wave view for the CADJPY cross displayed in the next 4-hour chart reveals the advance in an incomplete internal structural series of a contracting triangle pattern, which currently advances developing its wave (e) of Minuette degree, labeled in blue.

The previous chart presents the price advancing in the wave b of Subminuette degree, identified in blue, which belongs to wave (e), also in blue. According to the Elliott Wave theory, the triangle pattern follows an internal sequence subdivided into 3-3-3-3-3 waves. In this context, and observing its advance in the triangle formation, the cross could develop its latest decline before starting a rally that corresponds to wave ((c)) of Minute degree, labeled in black.

The current downward move, corresponding to wave c, in green, could reach two potential demand zones. The first one is located between 79.468 and 79.237, whereas the second one is seen from 78.878 to 78.394.

Once CADJPY starts to get fresh buyers, the cross could experience a strong rally and test June’s high zone of 81.909.

Finally, the bullish scenario has its invalidation level below the wave (a) of Minuette degree in blue located at 77.585, under the contracting triangle pattern limits.

Categories
Forex Elliott Wave Forex Market Analysis

EURCAD Advances in an Incomplete Triangle Pattern

The EURCAD cross reveals a mid-term consolidation formation that looks like an incomplete triangle pattern. This pattern continues in development since March 18th, when the price topped at 1.59914. In this context, this chartist pattern suggests the continuation of the previous movement, in the

The following 12-hour chart depicts the EURCAD action consolidating after a sharp rally, the cross began on February 19th when it found fresh buyers on 1.42637 and ended on 1.59914 on March 18th.

In terms of the Elliott Wave Theory, the corrective pattern presents a three-wave subdivision; the last downward move of Minute degree identified in black began at 1.59791, and current advances in its wave ((c)) in black. Likewise, its internal structure unveils four internal moves of the Minuette degree labeled in blue. 

Considering that the wave ((c)) in blue looks unfinished, the EURCAD cross could develop a new decline corresponding to its fifth wave. On the other hand, the breakout of the line that connects the end of waves (ii) and (iv) should confirm the new upward sequence that could boost the price likely toward the psychological barrier of level 1.59.

Short-term Technical Outlook

The short-term Elliott wave view unfolded in the following 4-hour chart, reveals the incomplete descending wave ((c)) of Minute degree labeled in black, which could start to advance in its fifth internal leg marked in blue.

In this context, the price could decline and found fresh buyers in the demand zone between 1.5471 and 1.5451; it even could extend its retracement to the area of 1.5408 and 1.5389, where the EURCAD cross could start to bounce.

If the price reacts mostly upward and surpasses the supply zone between 1.5538 and 1.5549, the EURCAD bias should start to turn primarily bullish. Likewise, the short-term bullish target can be found in the supply region bounded by 1.5718 and 1.5739.

Finally, if the price penetrates and closes below 1.5312, the bullish scenario will be invalid, and likely, the cross could extend its declines in “free fall.”


Categories
Forex Forex Elliott Wave Forex Market Analysis

Is CADJPY Ready for a New Rally?

Overview

The CADJPY cross advances mostly sideways in an incomplete triangle pattern. The corrective structure that remains in progress suggests the possibility of further upsides in the coming trading sessions.

Market Sentiment

The market sentiment on the CADJPY cross looks neutral, although during the overnight trading session, although the US presidential election is driving up volatility.

The following daily chart shows the long-term market participants’ sentiment unfolded between the 52-week high and low range. The figure reveals the price action currently moving on the neutral zone, which moves near the level of 79.274. 

In this context, the neutral sentiment is confirmed by the sideways channel, which began in early June, and the price action moving below the 60-day moving average Nevertheless, the bullish wide range candle of November 02nd leads to expect further upsides in the following weeks.

Technical Big Picture

The CADJPY cross moves in a sideways upward structure that belongs to an incomplete upward sequence that began last March 17th when the price found fresh buyers at 73.803.

The 2-day chart shown below illustrates the big picture of CADJPY under the Elliott Wave analysis perspective. The figure reveals the pair’s action advancing in an incomplete third wave of Minute degree labeled in black.

The consolidation structure of the CADJPY cross, in progress, suggests the possibility of a bullish continuation. Likewise, in terms of the Elliott Wave theory, if the current upward sequence corresponds to an incomplete impulsive sequence, the price could develop an extended wave. Nevertheless, a signal of confirmation of the potential new rally will occur if the price breaks and closes above the pivot level located at 79.823.

The short-term supports and resistance levels are as follows:

  • Resistance 1: 80.542
  • Resistance 2: 81.448
  • Resistance 3: 82.634

Pivot Level: 79.823

  • Support 1: 78.502
  • Support 2: 77.573
  • Support 3: 76.526

Short-term Technical Analysis Outlook

The CADJPY cross in its 4-hour chart unveils the course in a corrective structure that resembles a triangle pattern (subdivided into 3-3-3-3-3). This potential triangle pattern remains unfinished and could be developing its wave (d) of Minuette degree labeled in blue.


From the previous chart, both the breakout and close above the descending trendline connect the top of wave (b) of Minuette degree with the end of wave b identified in green as the close above the level 79.872 could confirm the turning bias from neutral to bullish.

The advance in its wave (d) identified in blue could find resistance between 81.448 and 81.909. Once the potential triangle pattern completes, the price could advance toward 84.739 and even extend its gains until 86.677.

Finally, the upward scenario’s invalidation level is located below the end of wave (a) of the Minuette degree labeled in blue.

Categories
Forex Course

145. Trading The Triangle Pattern Breakouts

Introduction

Breakouts trading and trading the triangle chart pattern are two different trading tools. A breakout occurs when the price goes above or below the significant support resistance area. It indicates that the price is ready to move in the direction of the breakout, and any entry near the breakout will be fruitful. This is the reason why breakout trading is considered a leading method of trading in the industry as it helps the traders to anticipate the trend and ride the potential moves.

On the other hand, the Triangle is a technical chart pattern. The best description of the triangle chart pattern is as a horizontal continuation chart pattern, which helps the traders in finding the best entry on the price chart. At the beginning of the pattern, it is widest, and as the market continues the ranging move, the price starts to move in a limited, narrow range, and as a result, we witness the point of the Triangle on the trading chart.

The Trading Strategies

There are two types of triangle chart patterns. The first one is ascending chart pattern, and the second is the descending chart pattern.

Ascending Triangle Chart Pattern

Ascending Triangle is a bullish chart pattern that helps traders to take buy trade in an ongoing uptrend. The image below represents the formation of an Ascending Triangle chart pattern in the CAD/JPY Forex pair.

The image below represents our entry, exit, stop-loss, and take-profit in the CAD/JPY forex pair. As you can see, in an uptrend, when the price broke above the chart pattern line, it is a sign that the buyers are strengthening. Therefore, if the price is holding above the support line, it is an indication for us to go long in this pair.

Right after our entry, we can see that the price smoothly ran towards the north, and printed a brand new higher high. We can close our trade based on any nearest support area, and we also can use any indicator for the exit. The stop-loss order was placed just below the entry. In a strong trending market, the smaller stops are good enough to ride the trend.

Descending Triangle Chart Pattern

The Descending Triangle is a bearish chart pattern that helps traders in taking sell trades in an ongoing downtrend. The image below indicates the formation of a Descending Triangle pattern in the GBP/CAD Forex pair.

The below price chart of the GBP/CAD pair represents our entry, exit, and stop-loss. In a downtrend, when the price breaks below the support area, it’s a sign that the strong buyers failed to push the price higher, and any hold below the resistance line is an indication to go short. Soon after our entry, price blasted down south, printing a brand new lower low.

The descending Triangle is simple and easy to trade Forex chart pattern. Most of the time, this pattern offers excellent risk to reward entry trades. So when you see the pattern on the price chart, don’t forget to scale your position for more significant gains.

That’s about trading the ascending and descending Triangle chart pattern breakouts. Take the below quick quiz before you go. Cheers.

[wp_quiz id=”85881″]
Categories
Forex Elliott Wave

Advanced Applications in Wave Analysis – Part 4 of 4

Introduction

In the previous educational article, we presented the contracting triangles and the restricting group. In this last part of our four-part series, we’ll show the non-restrictive contracting triangles and the expanding triangles with its variations. 

Non-Restrictive Triangles

This sub-group of triangles is characterized by locates in any other part of the wave cycle, not exclusively in waves 4 or B. The knowledge of this type of triangles could be useful to the wave analyst in the study of complex corrective patterns. This type of triangles tends to be produced at the end of complex corrections. Frequently, non-restrictive triangles tend to be more simple to identify than restrictive triangles.

  • Wave A. This segment tends to be the most volatile in terms of price at the time of the triangle. According to the alternation principle, if wave A is violent and takes a small portion of its completion, wave B will be slower and complex than wave A.
  • Wave E. In this scenario, the last segment of a non-restrictive contracting triangle, tends to develop a non-restrictive triangle. In other words, wave E could make a triangle inside a triangle of the upper degree. From the different types of non-restrictive triangles, the horizontal triangle tends to be the most common in the real market. The following list exposes the parts where the non-restrictive triangle.
    • Wave E in a horizontal triangle.
    • Last movement of a complex correction as a double or triple corrective pattern.
    • The fifth wave of an impulsive terminal structure.
    • The wave X of a complex correction.

Expanding Triangles

The expanding triangle tends to cheat the wave analyst more than the contracting triangle. This situation occurs because when the price moves in a volatile session, it tends to create a false breakout and quickly resuming its original trend.

The main characteristics of an expanding triangle are:

  • Wave A or wave B will be the shortest wave of the triangle.
  • Wave E tends to develop an explosive movement, higher in terms of price and time than the other waves.
  • In the same way that in contracting triangles, a contracting triangle can produce in wave E, in an expanding triangle, it can construct an expanding triangle.
  • The next movement of the triangle, which could correspond to wave C or 5, should not retrace the advance of wave E entirely.
  • The expanding triangle usually does not follow any Fibonacci relationship.
  • Expanding triangles normally occurs after a powerful movement such as an extended wave or an extended wave C. 

Restrictive Expanding Triangles

The restrictive expanding triangle tends to be placed in waves 4 and B. If the expanding triangle locates in wave B, the triangle belongs to a flat pattern. The rules applied to this group of expanding triangles are as follows:

  1. Waves A and E will be related through a 161.8%, being the wave E the largest segment.
  2. Wave A or B must be the shortest segment of the triangle.
  3. Only wave B or D can fail to try to surpass the previous wave.

Horizontal Expanding Triangle. The characteristics of this pattern are as follows:

  1. Wave A is the shortest segment of the triangle.
  2. Each leg after wave A will be larger than the previous segment.
  3. Wave E should be the most volatile, complex, and longer terms of time than the other waves.
  4. Wave E tends to be 161.8% of wave A.

Irregular Expanding Triangle. This variation of the expanding triangle is the most common to find in the real market. The main characteristic of this variation is that every time that wave B try to surpass to wave A fails in its advance. Wave E and A are show a 161.8% relationship, being wave E the longest segment.

Continuous Expanding Triangle. This type of restrictive expanding triangle is the second most common pattern to find in the real market. The continuous triangle characterizes by failing when this tries to surpass the end of wave C. If wave D fails, the pattern could show a slight bullish or bearish bias. Finally, waves A and E will be related in a 261.8%, being wave E the longest segment.

Non-Restrictive Expanding Triangles

The non-restrictive expanding triangle pattern follows the same conditions as restrictive expanding triangles. Its main characteristics are as follows:

  • Usually, they don’t have any Fibonacci relationship in their internal segments. The only relationship could be found on waves A and E, where wave E length could be 261.8% of wave A length.
  • The apex of the expanding triangle occurs before the triangle. If the apex occurs between 20% and the start of the expanding triangle, the formation should be non-restrictive.

Conclusions

In this educational article, corresponding to the last part of our four-part series covering the triangle pattern, we presented in the first section, the Non-Restrictive Contracting triangle. This group of contracting triangles tends to appear at the end of complex corrections, or the end of an impulsive terminal structure.

The second section corresponds to the expanding triangles, which are characterized by tricking the different market participants, who tend to think that the market has reversed and, after its last volatile movement corresponding to wave E, they discovered that the market in fact is resuming its previous trend.

Suggested Readings

  • Neely, G.; Mastering Elliott Wave: Presenting the Neely Method; Windsor Books; 2nd Edition (1990).


Categories
Forex Elliott Wave

Analyzing the Triangle Pattern – Intermediate Level Part 3

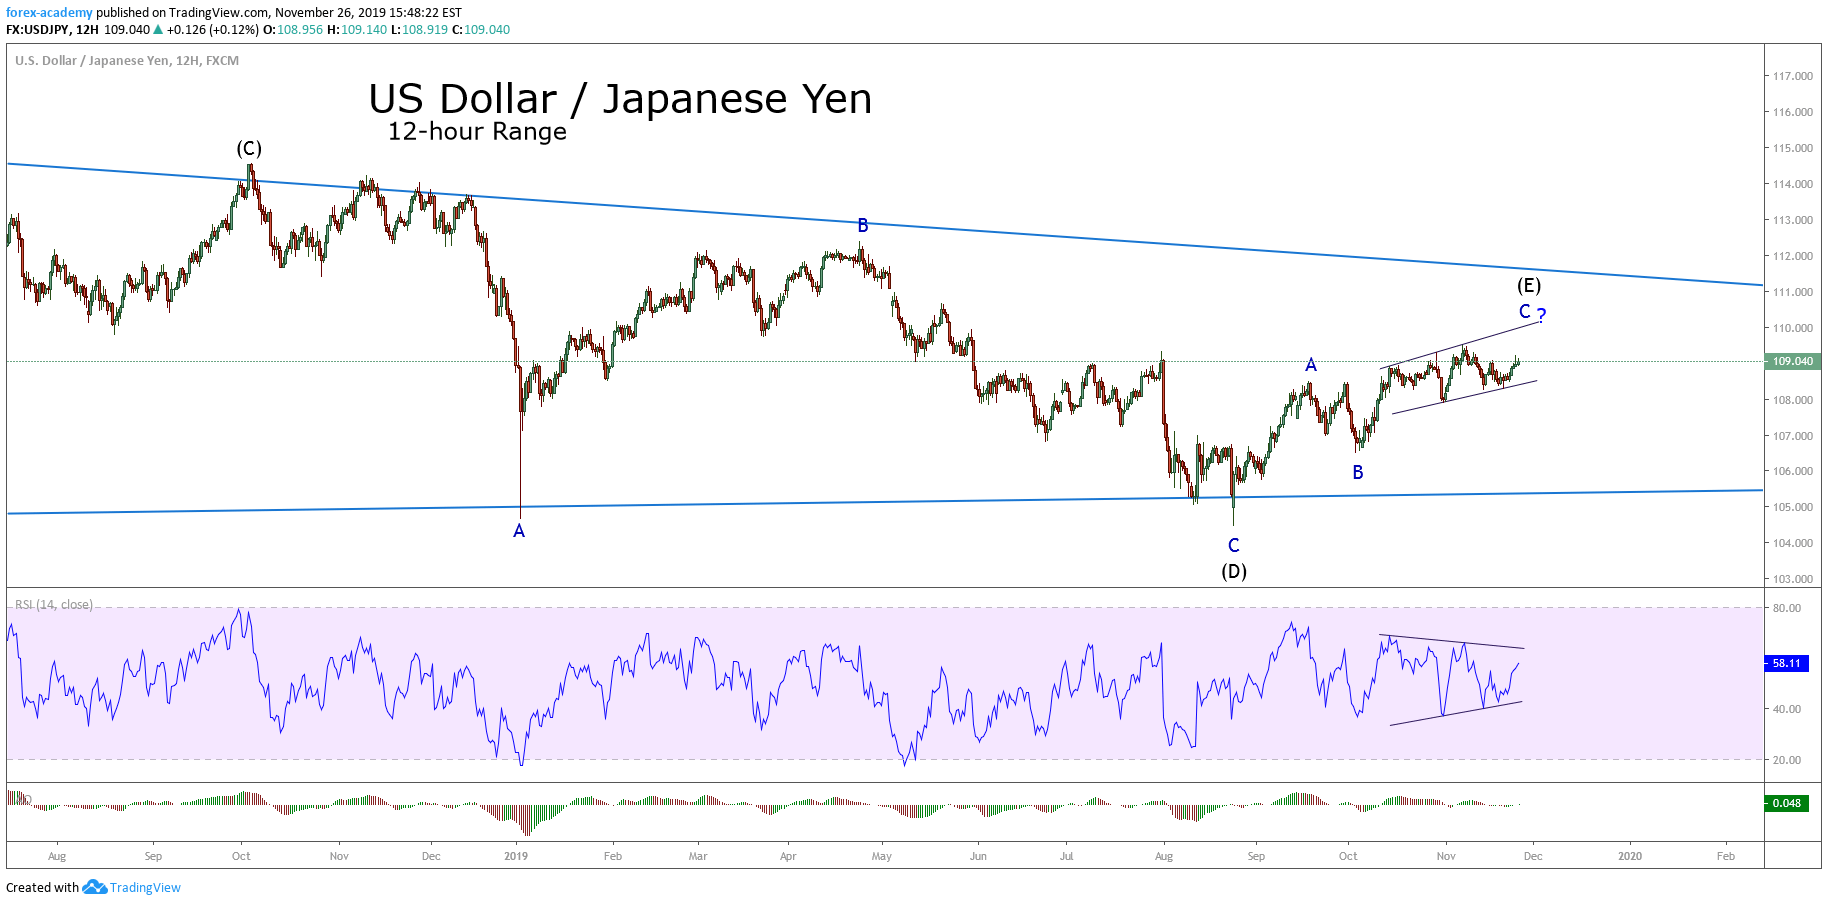
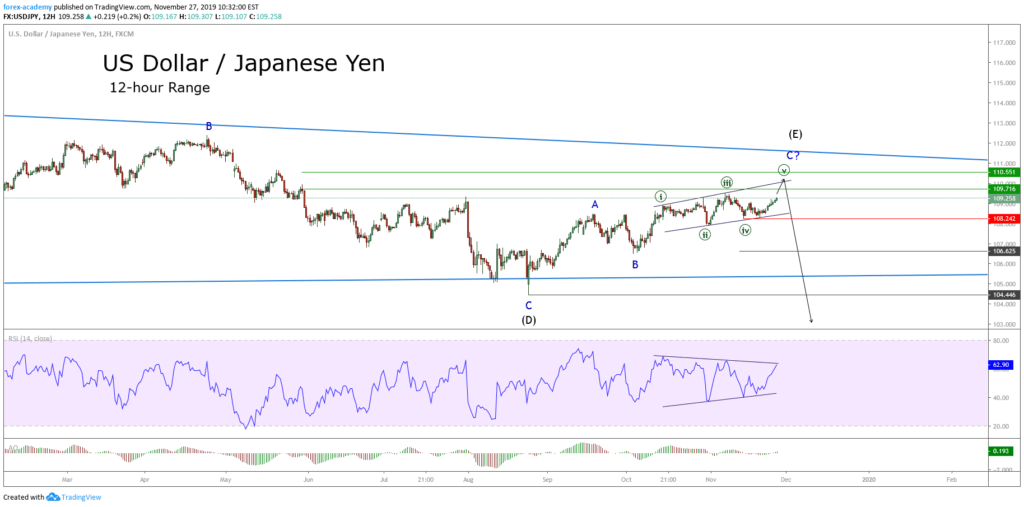
In the previous article, we expanded the ideas of the triangle pattern; in particular, we talked about the contracting triangle and its variations. In this last part dedicated to the triangle pattern, we will review the non-limiting triangle.

Non-Limiting Triangle

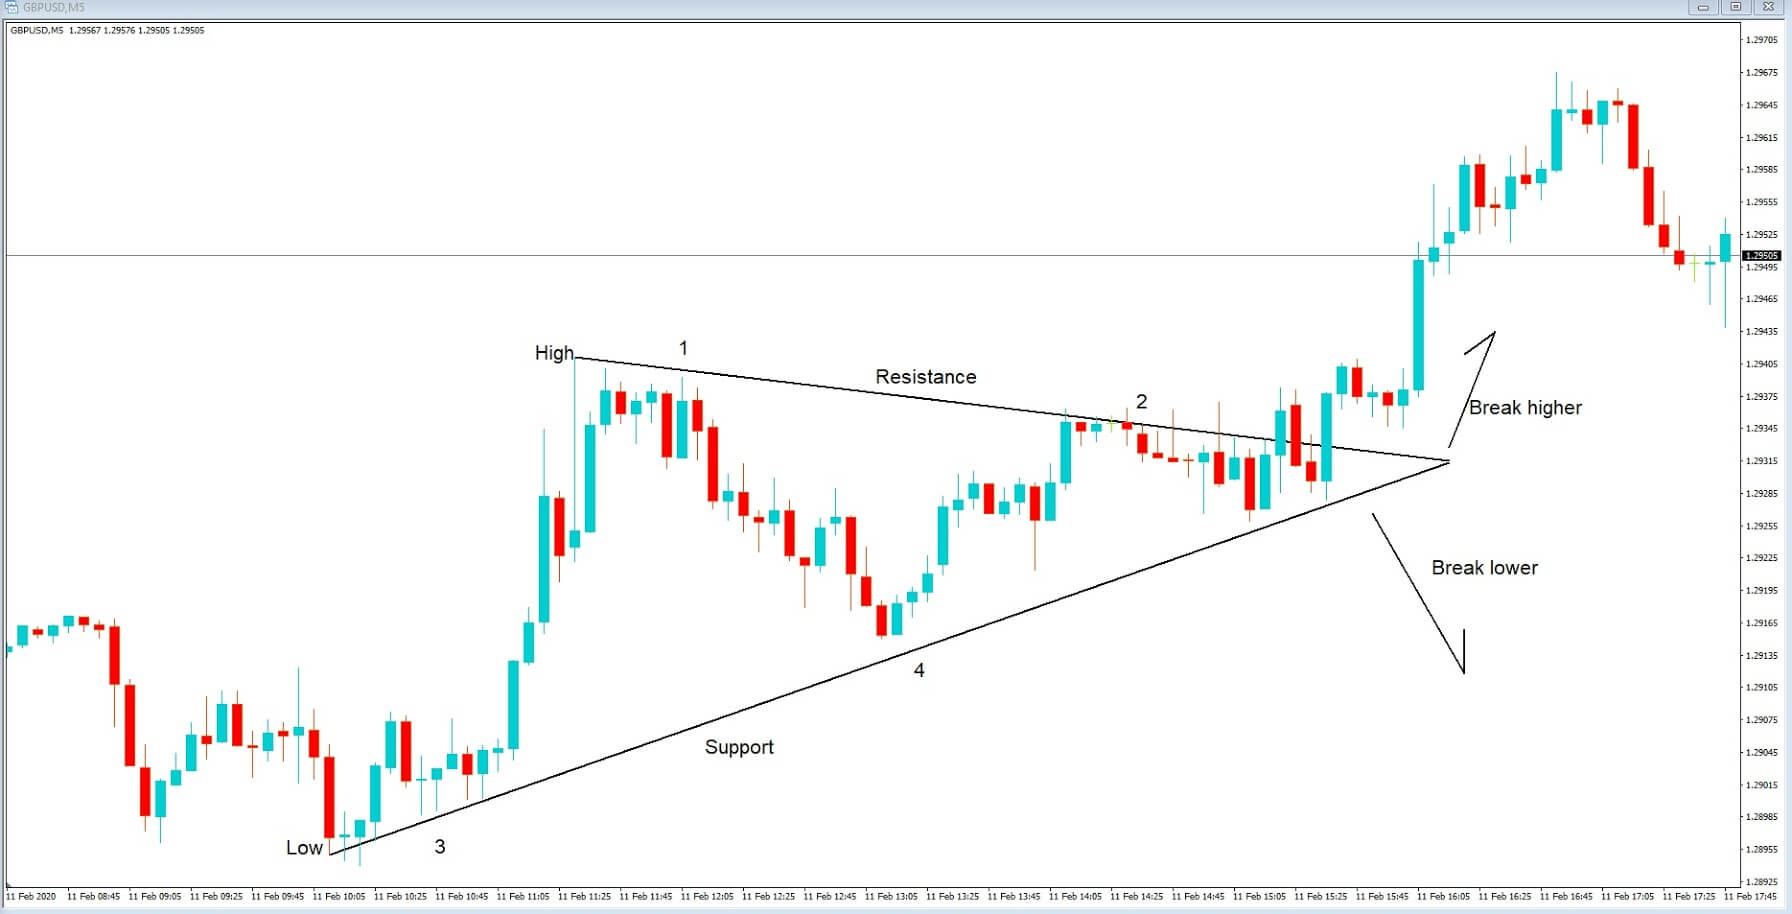
Non-limiting triangles do not differ much from limiting triangles. Both types of triangles must meet the minimum construction requirements. However, they will have the following characteristics:

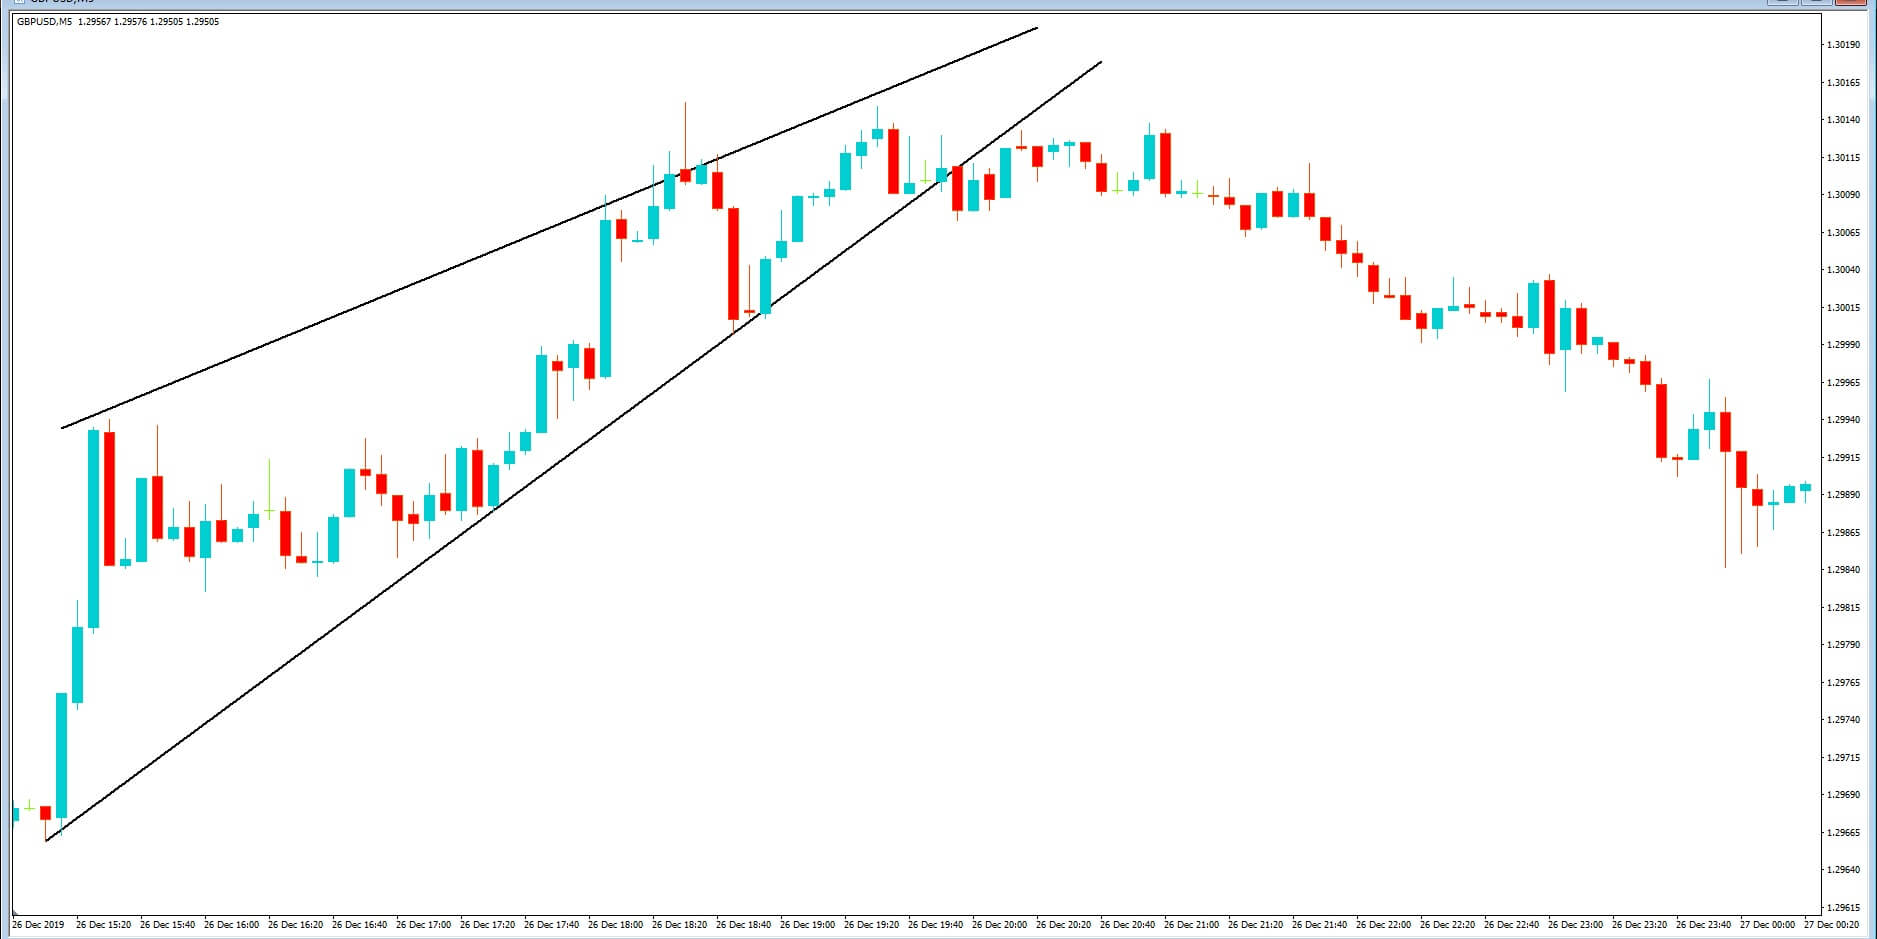
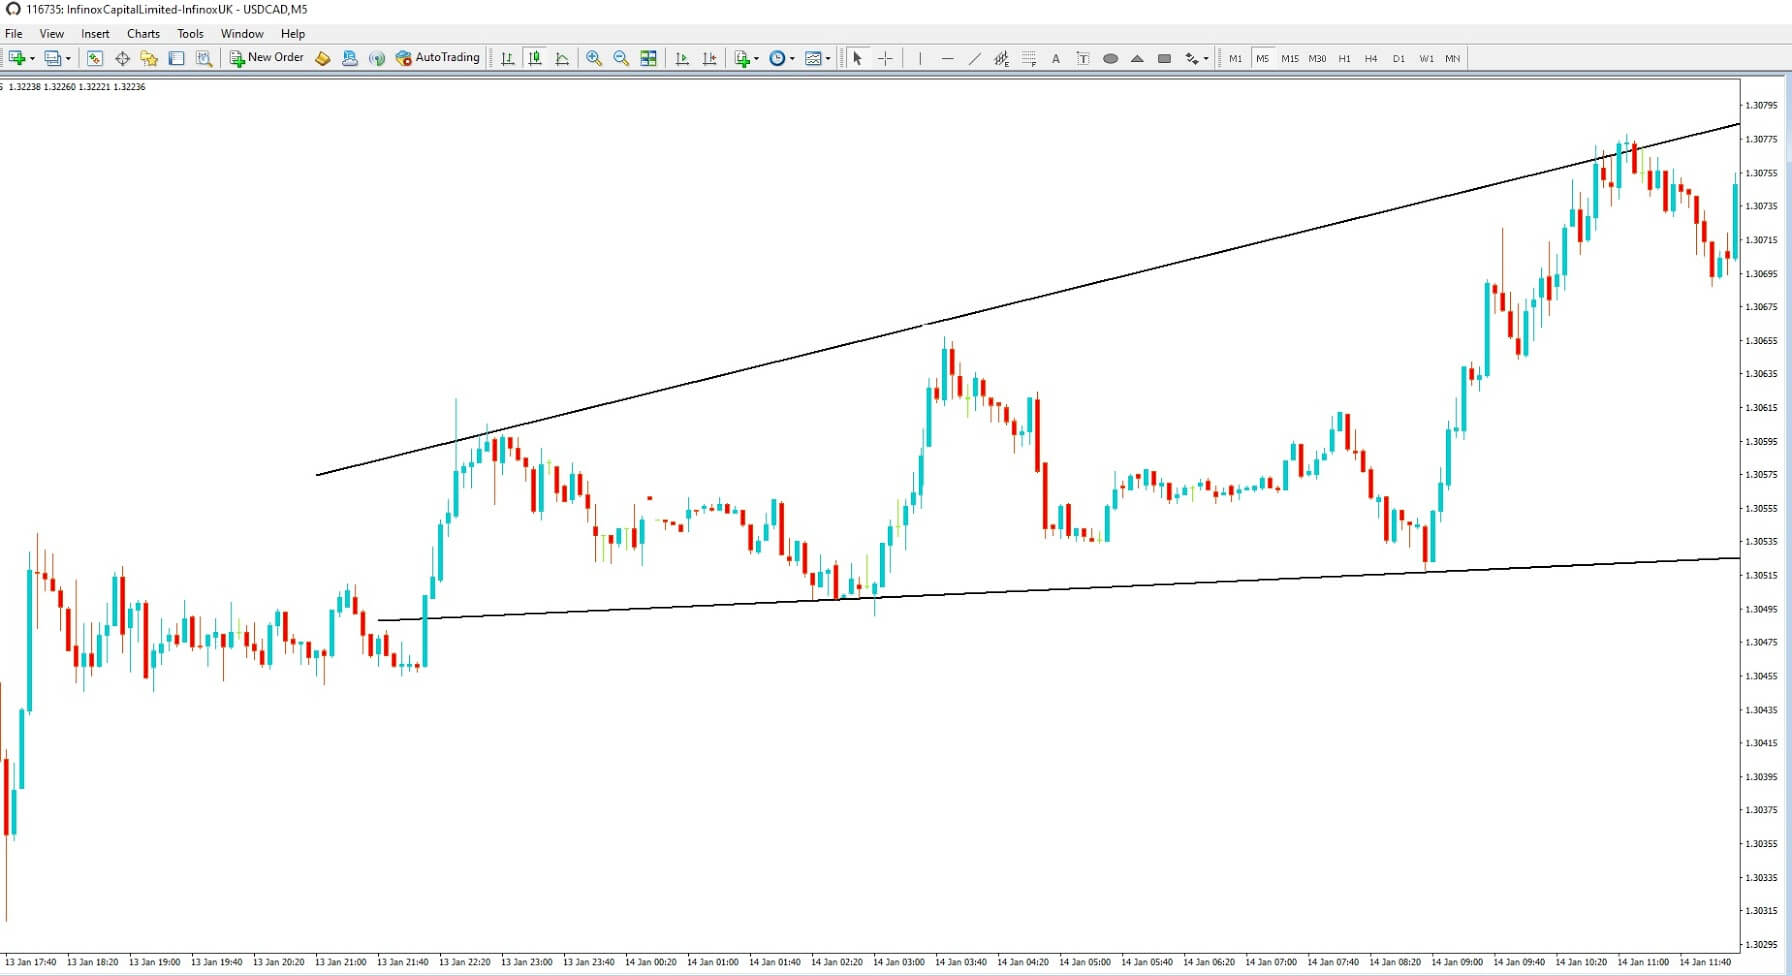
– Channeling. In the case of the non-limiting triangle, the trend lines are not convergent but divergent.

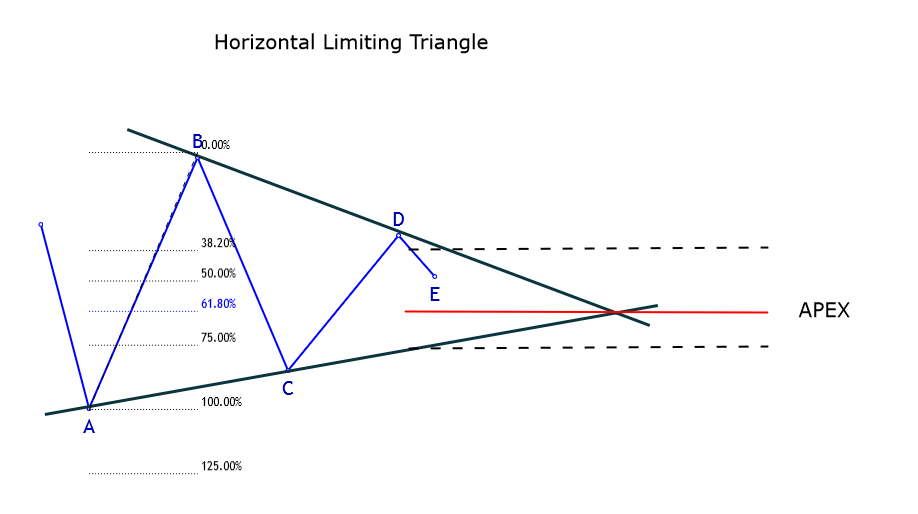
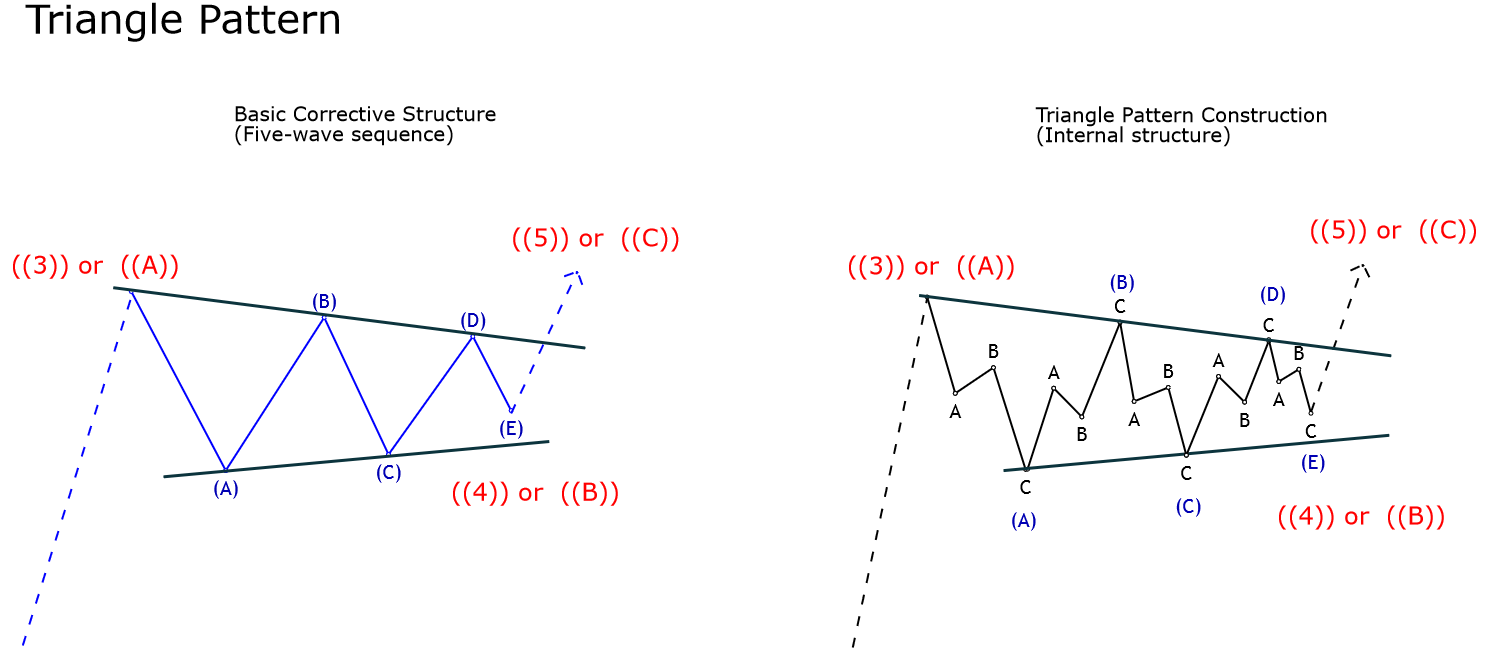
1. Congestion occurs just at or near the apex of the convergence lines.

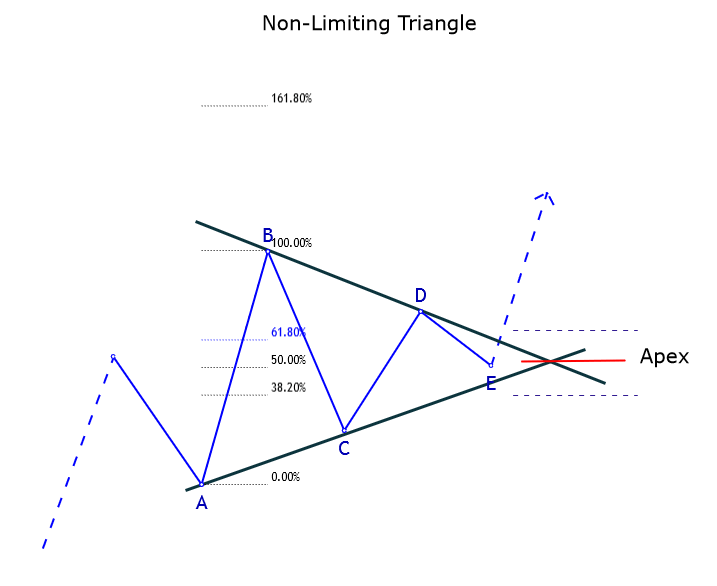
The wave analyst should note that the term “just or near the apex” refers to the end of wave E being close to the intersection of both trend lines and the extent of wave E to be measured in terms of the time spent in the triangle formation.

b. The triangle pattern is considered Non-Limiting if the measurement of time elapsed from its beginning until the end of wave E, and the apex occurs after 40% of the interval has passed.

c. There must be a post-thrust correction that must return to the apex area.

If the triangle met any of these three conditions, then the triangle will be said to be of the non-limiting type.

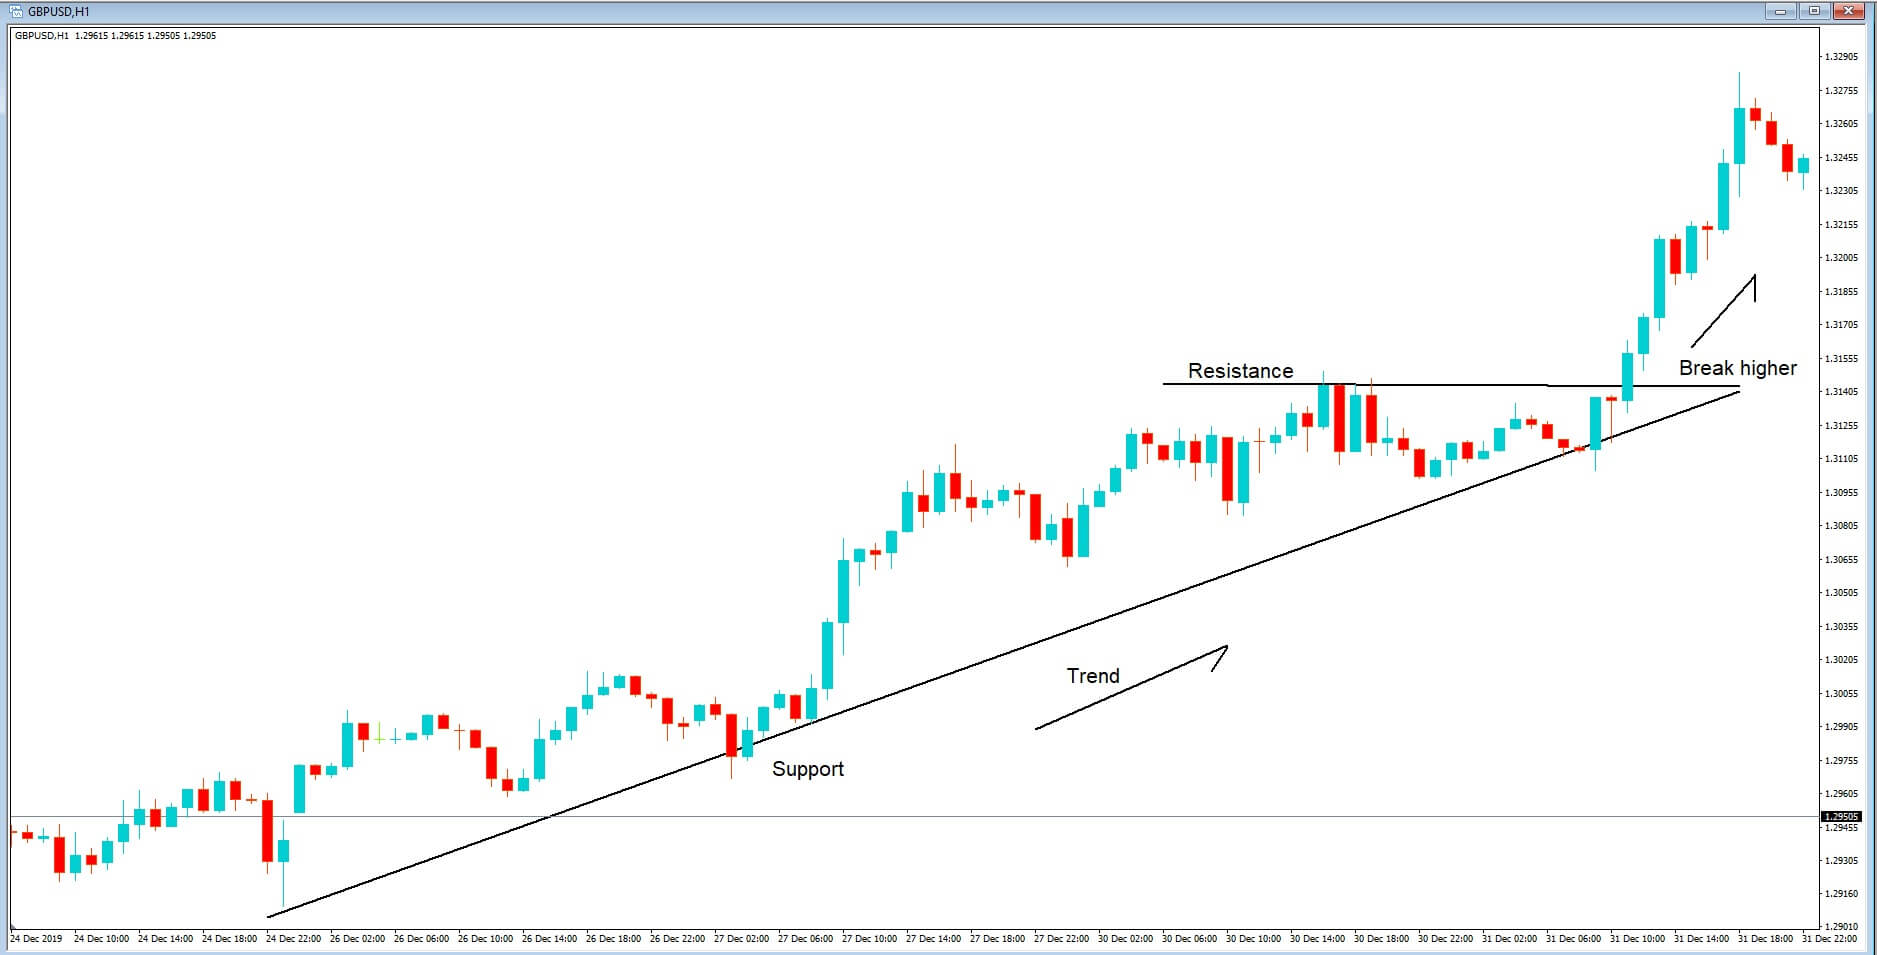
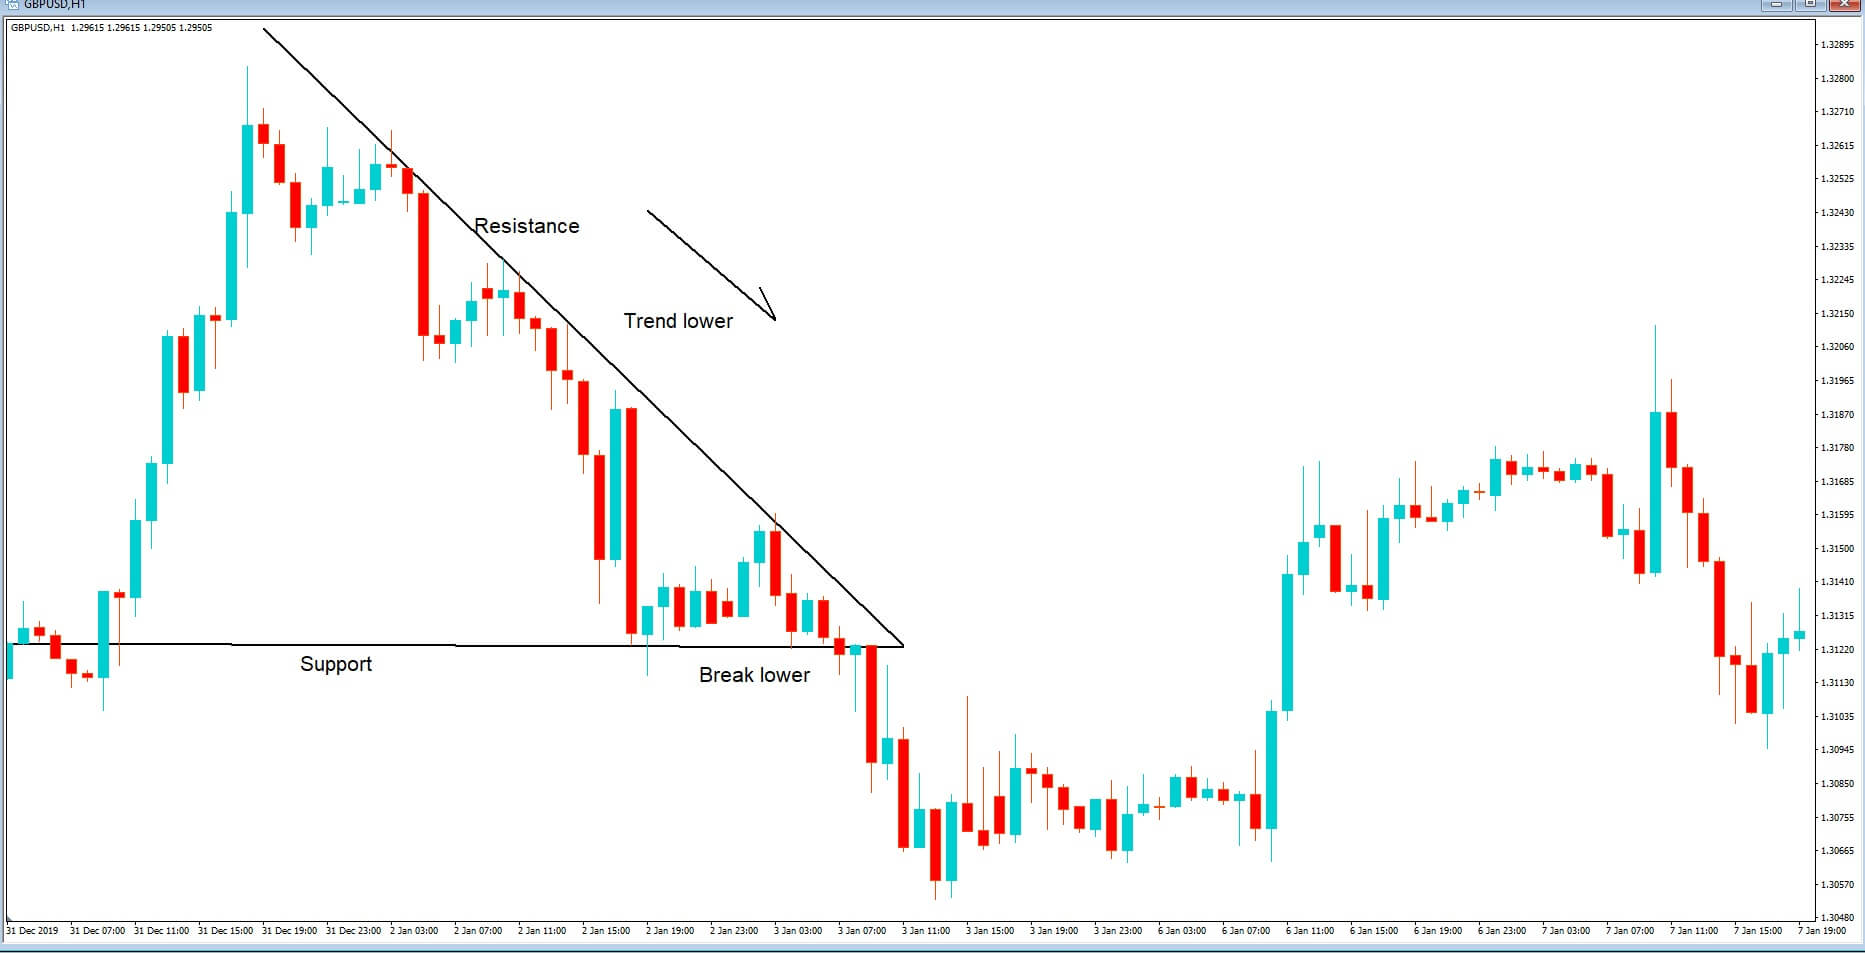
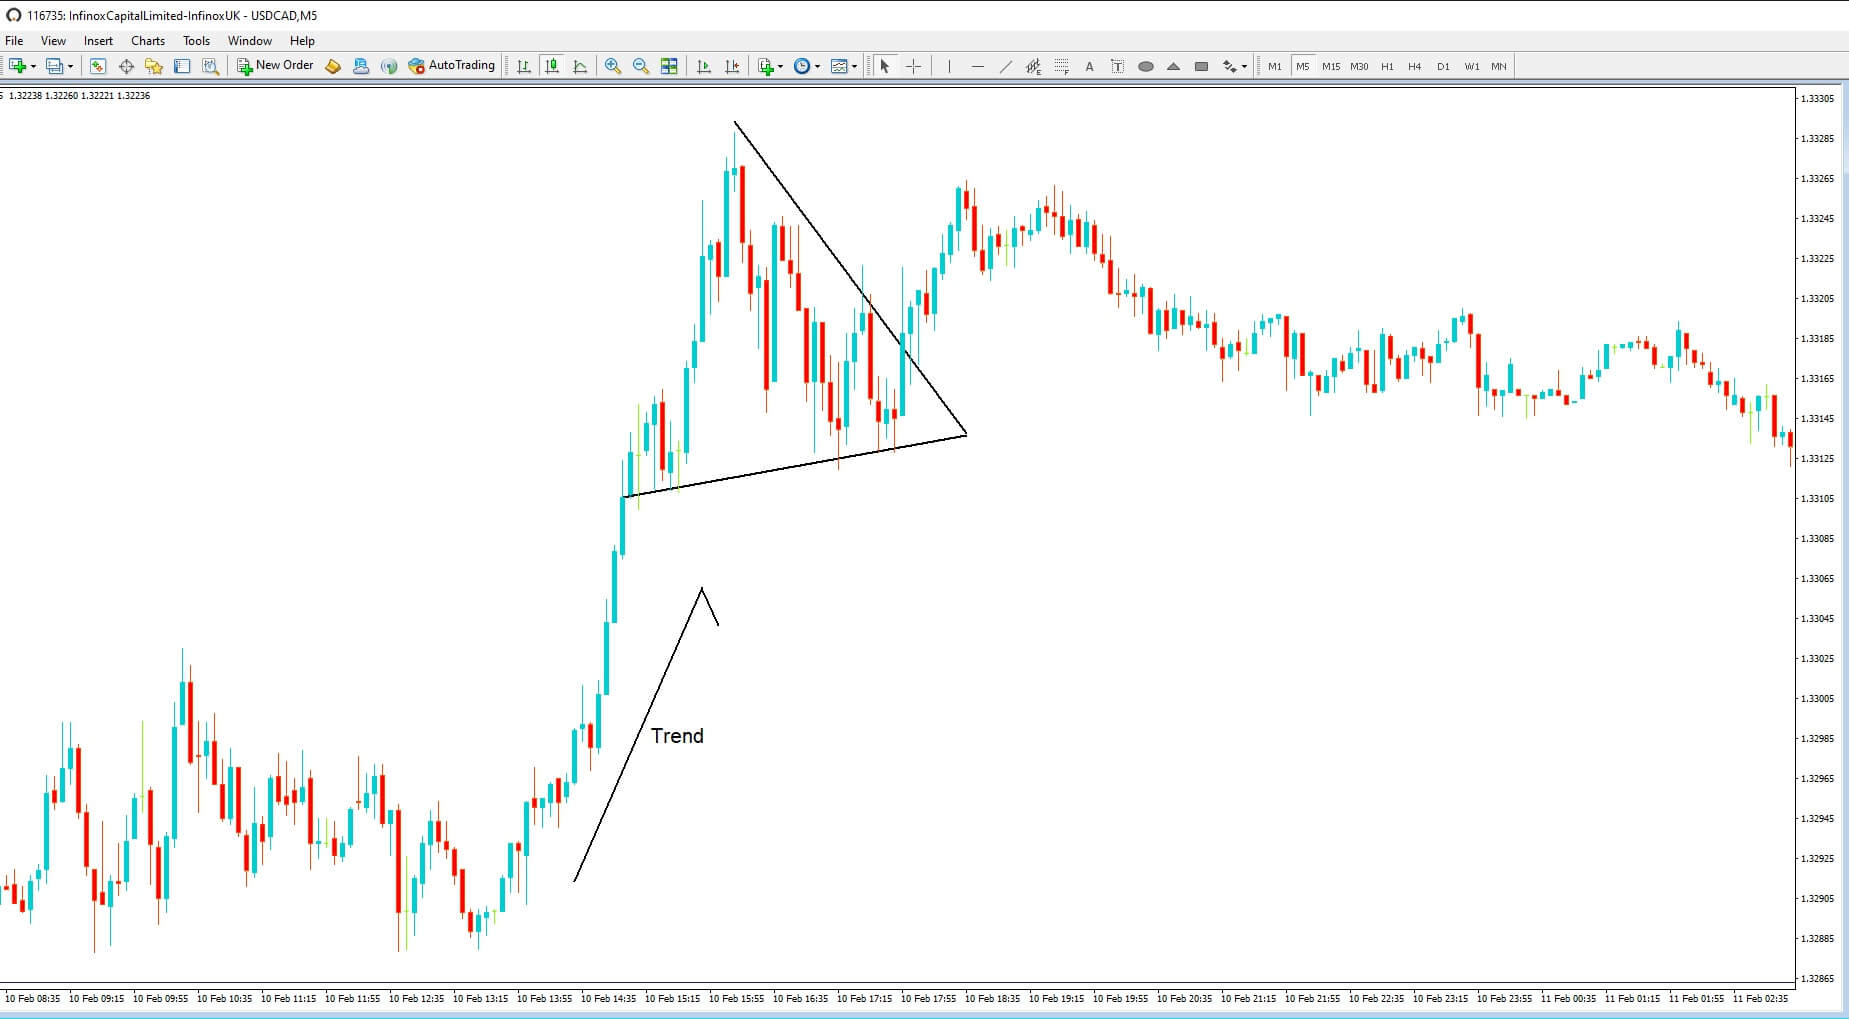
Post-Triangular Thrust

The distance of the thrust outside the limits of the non-limiting triangle does not have a specific restriction. However, it can reach the length equivalent to the longest segment of the triangle. 

Likewise, once reached this extension, there is a possibility that the price will continue in the original direction of the thrust.
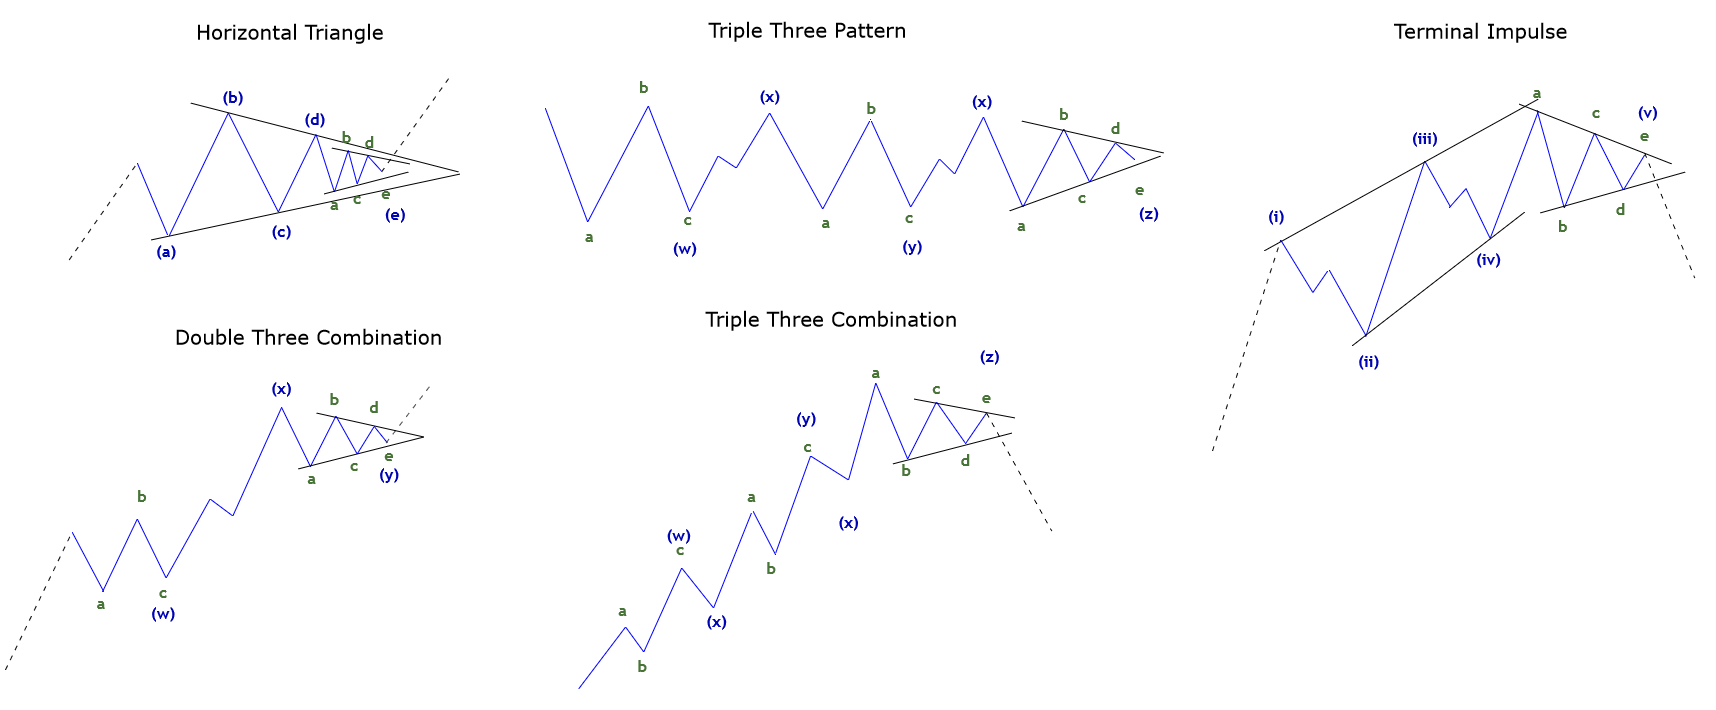
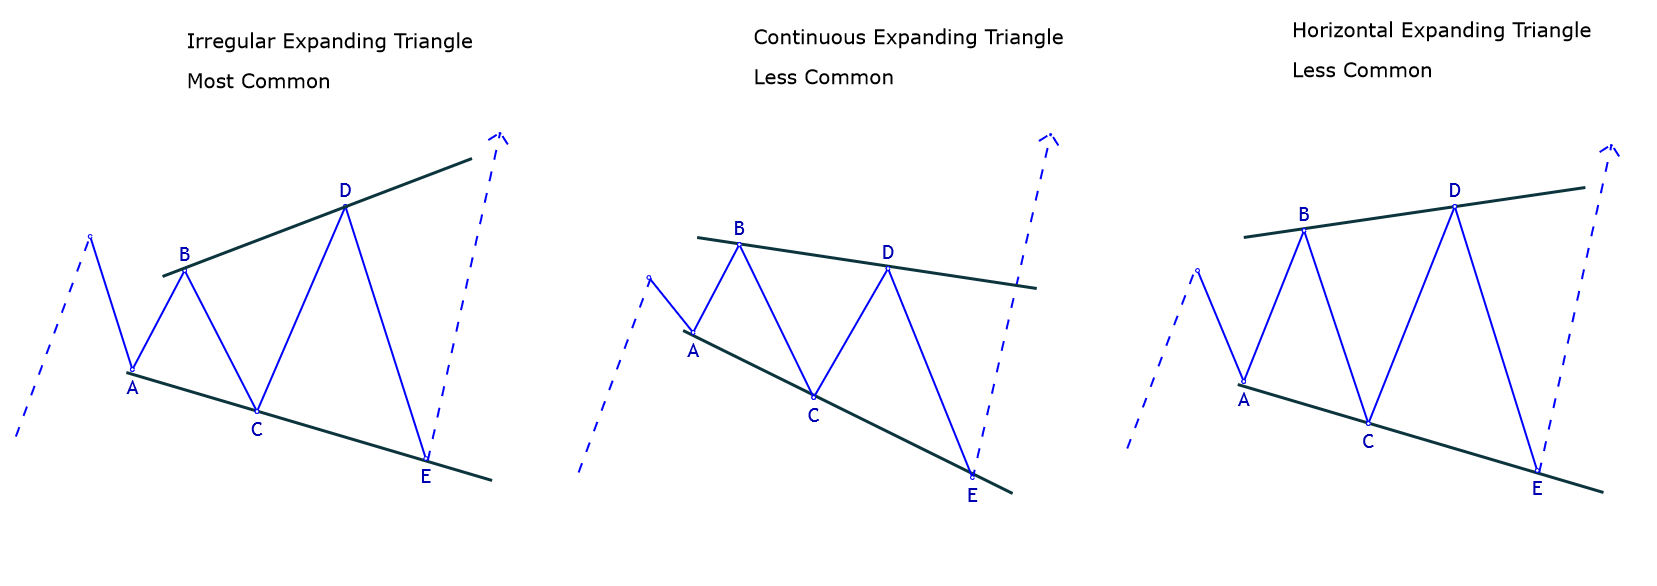
Expanding Triangles

Expanding triangles are very frequent in complex corrections. It is characterized because as it progresses in its formation, each segment, or the majority, is larger than the previous one.

The rules that characterize the expanding triangles are described below:

  1. Wave A or Wave B will always be the smallest wave in the triangle.
  2. In most cases, the E wave will be the longest.
  3. Expanding triangles cannot be part of wave B of a zigzag pattern. Nor can they be part of an intermediate wave, that is, waves B, C, or D of a triangle of higher degree.
  4. In most cases, the E wave will be the longest and most complex segment of the triangle. This wave can be formed by a zigzag or by a complex correction.
  5. Generally, wave E will pierce the trend line joining the ends of waves A and C.
  6. Line B-D should act similarly to contracting triangles.
  7. The extension of the thrust of the expanding triangle must be less than the longest wavelength of the triangle.
  8. When comparing the length from wave E to wave A, it must be verified that each previous wave must be greater than or equal to 50% of the next wave.

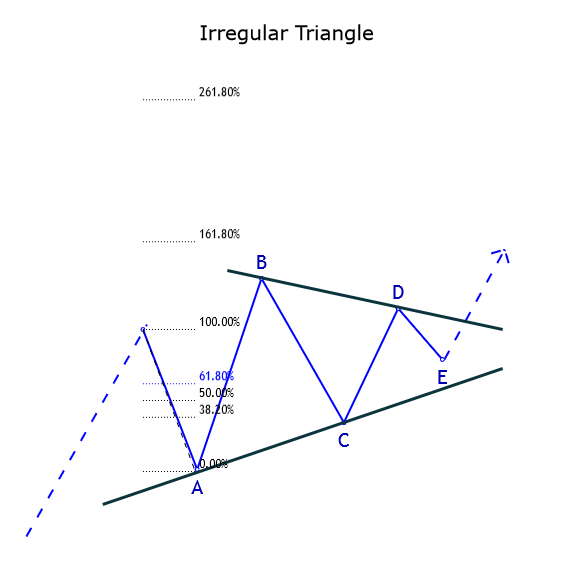
The following figure shows the three most common types of expanding triangles, of which the irregular is the most likely to appear in the real market.


In expanding triangles also exists limiting and non-limiting triangles. However, in this type of formations, there is no post-triangular variation between one and the other. The difference lies in the wave position that the triangle holds, which can be “standard” or be part of a complex correction.

Limiting Expanding Triangle

The term “limiting” refers to whether the triangle is a fourth wave or a B wave. Its main characteristics are described below.

1. An expansive limiting triangle usually appears in wave B, particularly in irregular failures or in flat wave formations with failure in wave C.

2. The thrust outside the triangle is a minimum of approximately 61.8% of the structure, measured from its highest to the lowest level.

Horizontal Expanding Triangle

This variation rarely appears in the real market. However, this does not mean that there is no possibility of it showing up in real markets.

The main characteristics of a horizontal triangle are:

1. Wave A must be the smallest of the formation.

2. Waves B, C, D, and E y must each exceed the final point of the previous wave.

3. There is a possibility that wave E will exceed the guideline of waves A-C.

Irregular Expanding Triangle

This variation is more common, and its characteristics are as follows:

1. Wave B is smaller than Wave A, while the rest of the waves maintain their increasing characteristics.

2. The longer the duration of the pattern, the higher the chance that the guideline will tilt up or down.

Continuous Expanding Triangle

This expanding triangle has a bias due, on the one hand, because wave B is longer than wave A, and on the other hand, because wave C is the shortest. The E wave, meanwhile, can be more volatile or “violent” than the rest of the waves.

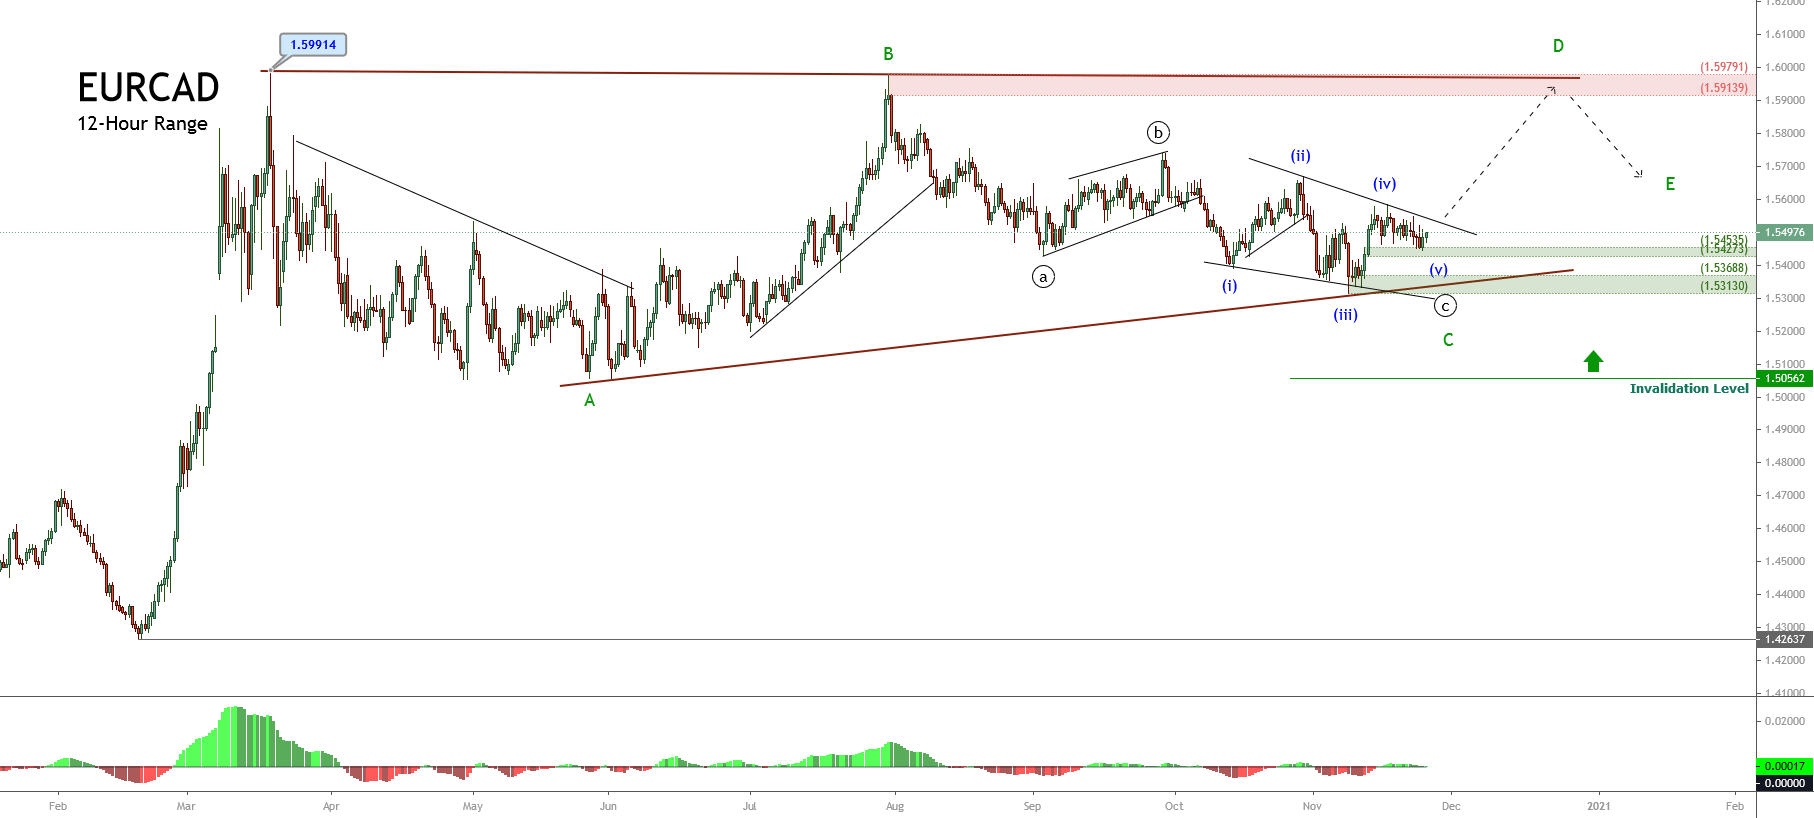
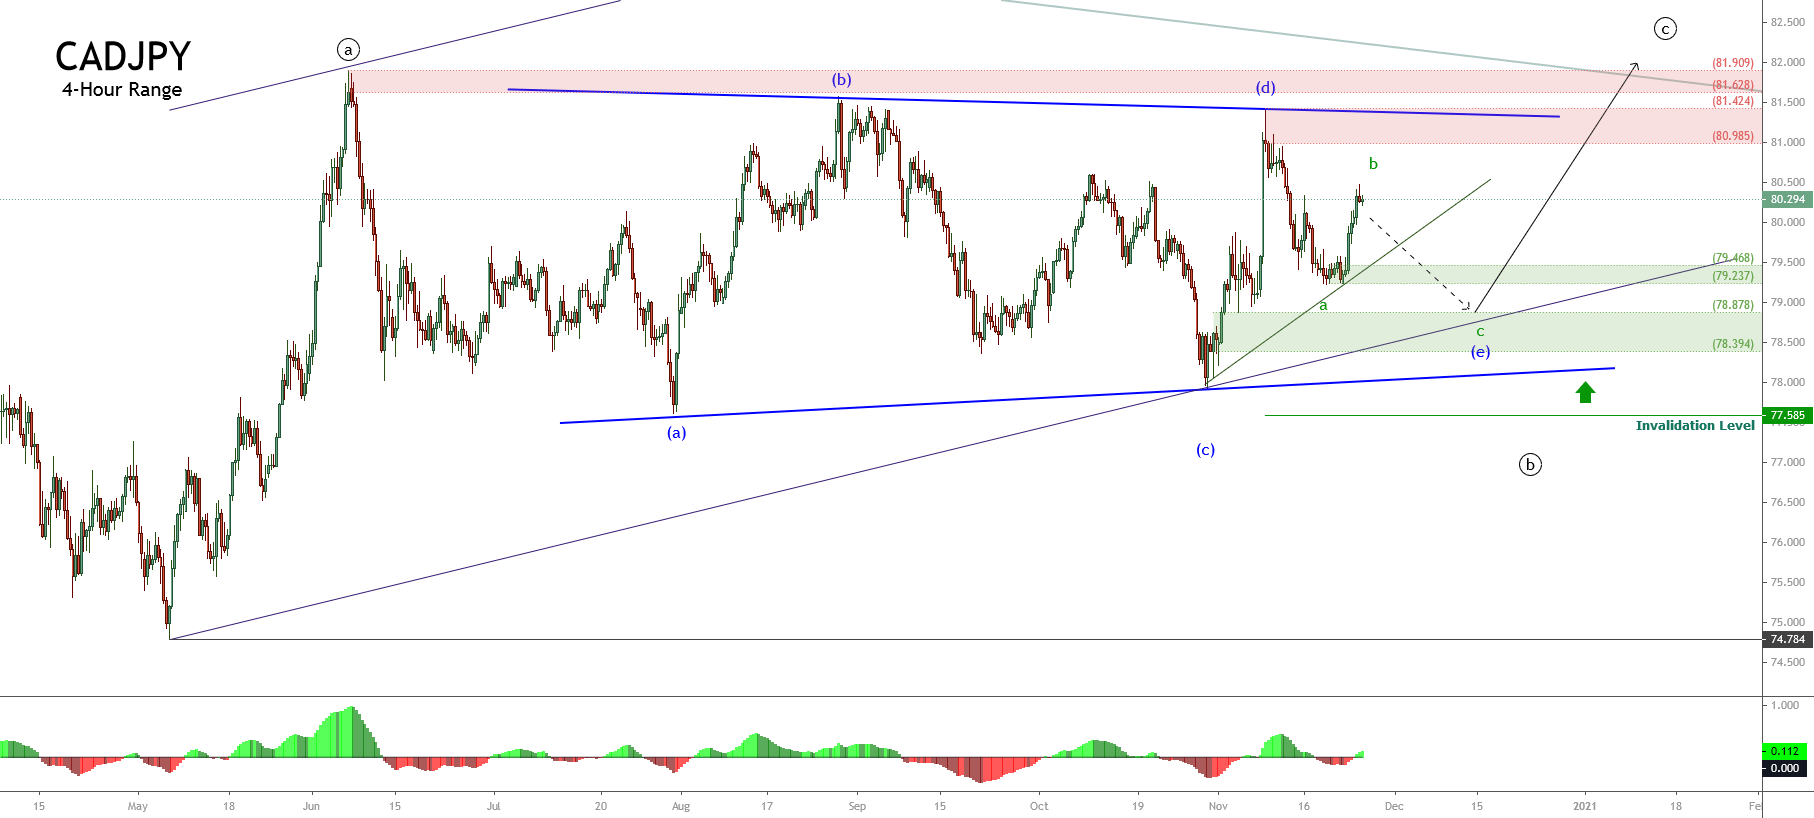
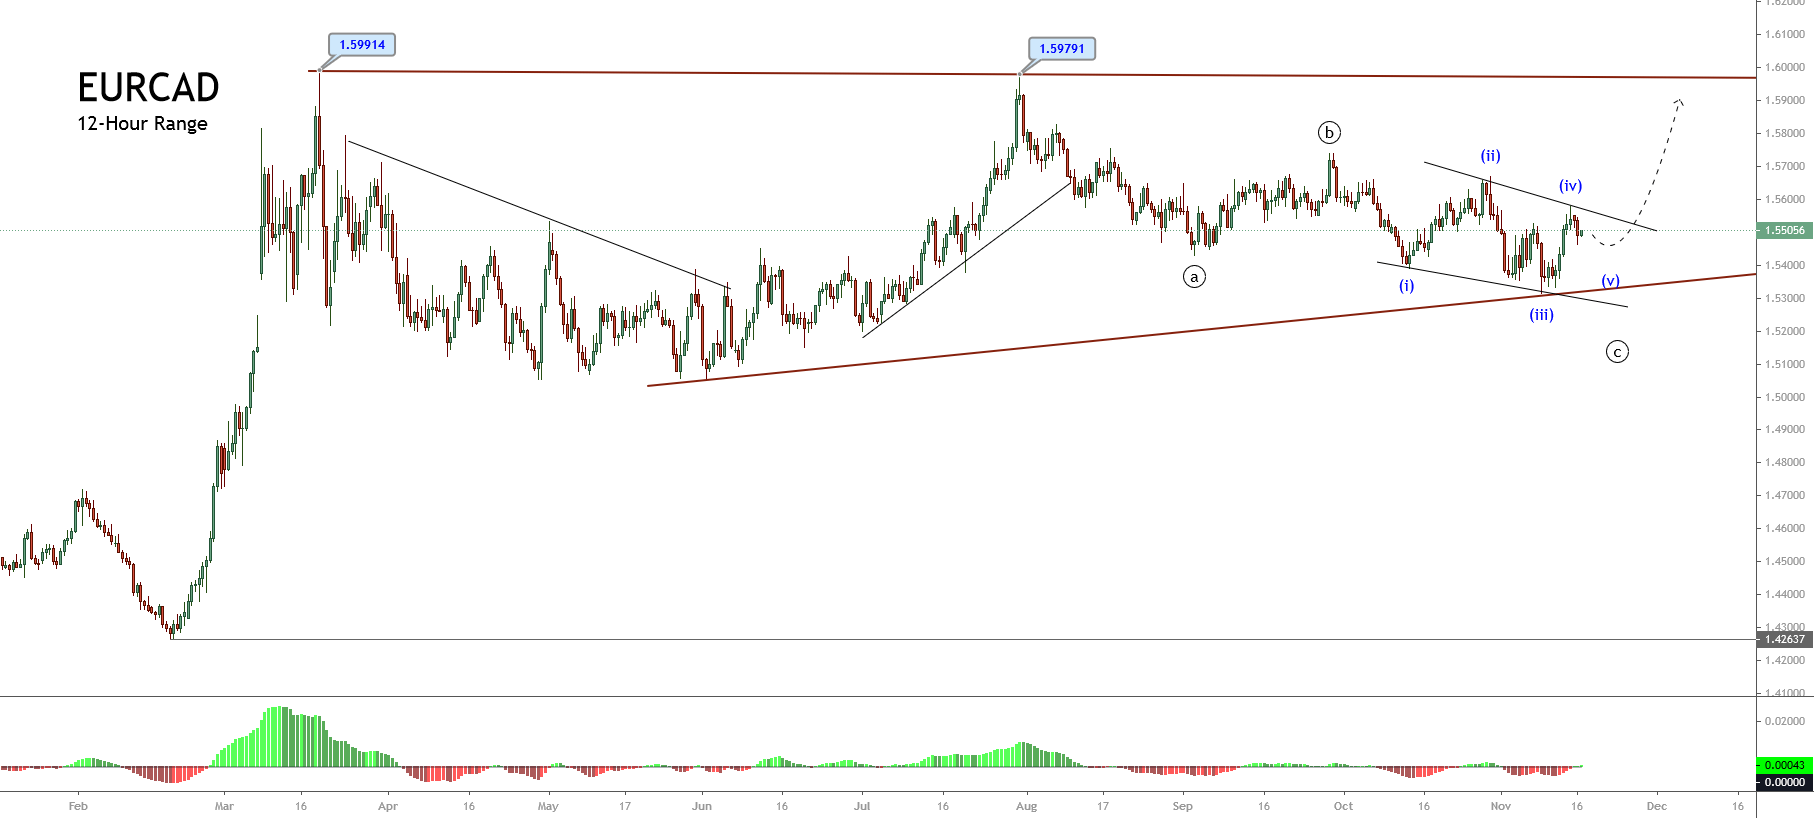
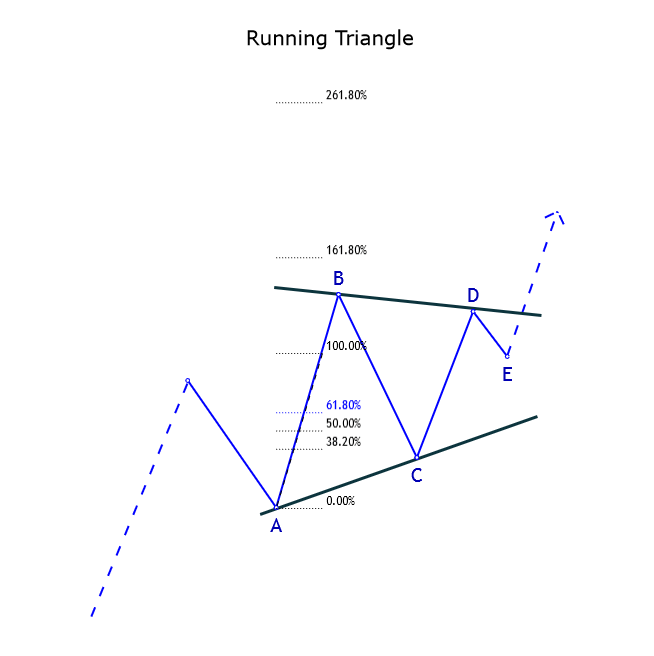
Non-Limiting Expanding Triangle

These types of triangles tend to appear in complex corrective formations, for example, in the first or last stage of a complex sequence. In this sense, in a complex corrective structure, the thrust will generate a wave X.

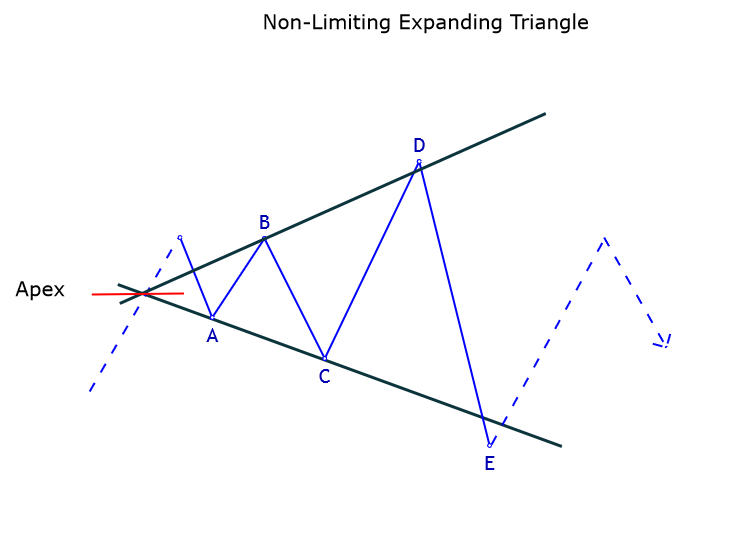
Finally, concerning the apex, it is located before wave A and must be produced before it reaches 20% of the construction time of wave A.

Conclusions

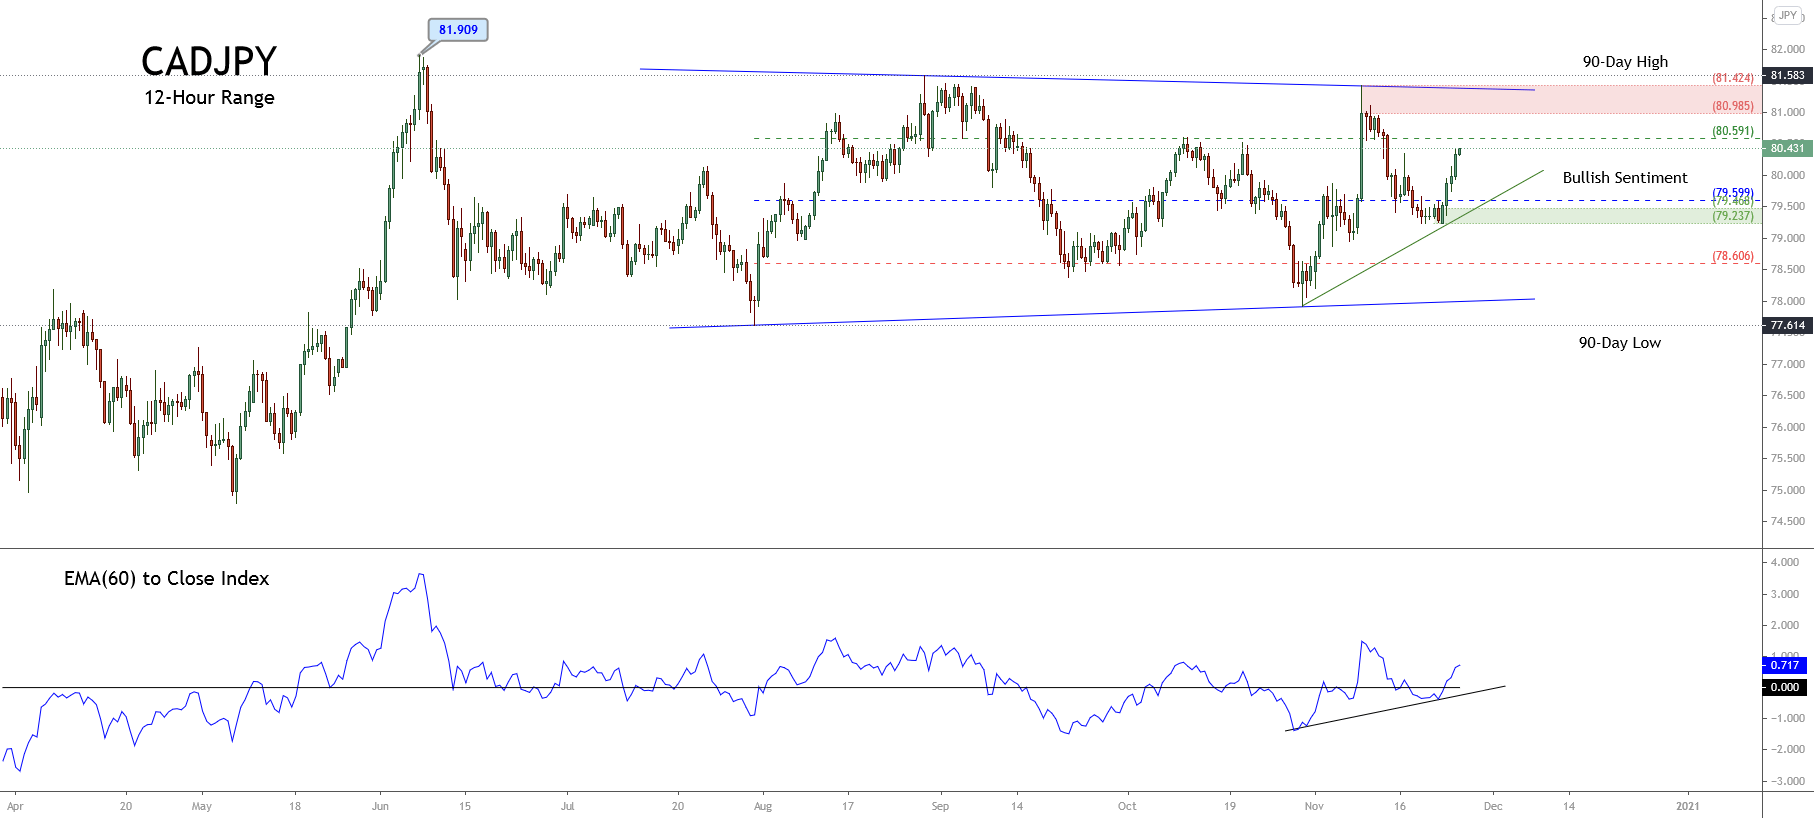
With this article, we have ended the standard corrective patterns defined by the Elliott wave theory. As we have seen in previous examples, expansive triangles also usually appear on waves 4 and B. However, this does not mean that they cannot appear on wave 2.

In the next educational article, we will see the process of validating impulsive structures.

Suggested Readings

  • Neely, G.; Mastering Elliott Wave: Presenting the Neely Method; Windsor Books; 2nd Edition (1990).


Categories
Forex Elliott Wave

Analyzing the Triangle Pattern – Intermediate Level Part 2

In our previous article, we saw that the triangle pattern is the most common of the three standard formations defined by R.N. Elliott. In this educational post, we will review the different types of variations of this corrective structure.

Contractive Triangle

Within the group of triangles, this formation is the most common of all. The minimum requirements of this structure are:

1. Once the contractive triangle is completed, the price must make a “thrust” that should be greater than or equal to 75% of the largest internal segment. On the other hand, this movement should not exceed 125% of the most extended triangle segment.

The following figure shows two cases. In the first, we see that wave A is the most extended segment of the contracting triangle after wave E is completed. The thrust can reach between 75% and 125% of wave A.

In the second case, we observe that wave B is the most extensive of the contracting triangle. Analogously to the previous case, we distinguish that the thrust made by the price should not be less than 75% nor greater than 125 of wave B.

2. In this type of triangle, the thrust must further exceed the highest (or lowest) end it reached during structure formation.

In other words, when the contracting triangle is about to be completed, two parallel lines should be drawn over the most extended segment, depending on which side the thrust is on, the price should touch the top or bottom line.

3. The E wave must be the smallest of all the segments of the triangle in terms of price.

As we observe in the following figure, the internal segment corresponding to wave E must be the smallest of all in terms of price, but not the time it takes for this movement to complete.

Limiting triangle

R.N. Elliott defined the limiting triangle as a formation that occurs in the waves fourth and B. Its name is because its completion must occur under specific conditions,

The completion of the limiting triangle in wave E must happen in the range of 20% to 40% before the apex point of the triangle.

Horizontal Limiting Triangle

1. The trendlines of the triangle must move in opposite directions.

In other words, when drawing the ends of the triangle corresponding to the end of waves A-C and B-D, the trendlines must correspond to a contracting triangle respecting the basic structure defined by Elliott.

2. The apex of the triangle must be within a range whose amplitude is 61.8% of the most extended segment of the triangle and whose center is the midpoint of that segment.

In the case of the previous figure, the most extended wave is wave B. However, this is analogous for the situation in which wave A or wave C is the longest in the triangle.

3. Wave D must be smaller than the internal leg corresponding to wave C. Likewise, the segment corresponding to wave E must be shorter than wave D.


Irregular Limiting Triangle

This type of triangle must perform a higher thrust and with greater speed than in the case of the horizontal triangle. The distinctive element of this formation is wave B, which must be longer than wave A. In general, its main characteristics are as follows.

  1. Wave B should not be higher than 261.8% of Wave A. Under normal conditions, it should be less than 161.8% of Wave A.
  2. Waves C, D, and E must be smaller than the previous wave.
  3. The trend lines of the triangle must have opposite directions.

Running Limiting Triangle

This type of wave can be confused with the Double Three corrective structure. Its main characteristics are:

  1. Wave B is longer than Wave A. It is also the largest segment of the triangle.
  2. Wave C is smaller than Wave B.
  3. Wave D is shorter than Wave C.
  4. Wave E is shorter than Wave D and is the smallest of the triangle.
  5. The thrust after the completion of wave E can become more extensive than wave B and even reach 261.8% of wave B.

Conclusions

In this educational article, we have examined the different variations of triangles and expanded their contracting variants. We must emphasize that its importance lies in the fact that this type of formations, in particular, the contracting triangle, is the most common of all triangular patterns. The knowledge of how triangles behave can provide the wave analyst with an advantage that would allow him to more accurately predict what the next market move would likely be.

In the next article, we will see the last part of the corrective formations. In particular, we will review the non-limiting triangles and their main characteristics.

Suggested Readings

– Neely, G.; Mastering Elliott Wave: Presenting the Neely Method; Windsor Books; 2nd Edition (1990).

Categories
Forex Elliott Wave

Analyzing the Triangle Pattern – Intermediate Level – Part 1

The triangle is a corrective pattern that has five internal segments. In this educational article, we will review how to analyze the triangle formation.

Triangles and their Characteristics

Within the set of corrective structures defined by R.N. Elliott, triangle formations are more complex to analyze compared to flat and zigzag patterns. This complexity occurs because there is no specific time span that marks the end of this structure.

Despite the complexity of the triangles, it is the most common Elliott pattern to find in the real market. The knowledge of this formation will help wave analysts to understand the price position within the market.

Construction Rules

The construction rules defined for the triangle pattern are detailed as follow:

– Triangles have five internal waves, regardless of the complexity of the inner segments.
– A complete three-wave corrective structure builds each part that makes up the triangle.
– The triangle can have a bullish or bearish inclination. However, its internal structure should not change.
– The triangle has six reference points of the same degree, the origin of wave A, and the end of waves A, B, C, D, and E. From these six extremes, the wave analyst should only channel four points through the contraction lines. The points to consider are the end of wave A with the end of wave C and the end of wave B with the end of wave D.
– The base-line of the triangle is the line that joins the end of waves B and D, and its function is similar to the guideline that joins waves 2 and 4 in an impulsive wave.

The following figure represents the construction model of the triangle pattern.

As can be noted, the triangle pattern tends to appear in a fourth wave or a wave B, in some exceptional cases, this pattern could appear in a second wave.

GBPUSD Consolidates in a Triangle Sequence

The next figure illustrates the GBPUSD pair in its 4-hour timeframe. In the chart, we observe that the Cable rallied since September 03rd when the price found its bottom at level 1.19589.

Once the GBPUSD pair moved in three waves identified in green, the fourth wave consolidated sideways, developing an expanding triangle.

The triangle pattern reveals the alternation principle in terms of time and price.

The GBPUSD pair alternated in terms of time being the triangle pattern more extended in comparison with the second wave. In the same way, the retracement developed by the second wave is sharp compared with the narrow correction realized by the fourth wave.

JP Morgan Consolidated in a Triangle Pattern

The chart below shows JP Morgan Chase & Co (JPM) in its log-scale 2-day timeframe. The ticker JPM developed a bullish impulsive sequence subdivided in five waves from early 2016 when the price found buyers at $52.50 per share.

In the same way, the third wave that was formed corresponds to an extended wave, which makes us conclude that the first and fifth waves will not be extended, and they will be similar in terms of price, time, or both. In this case, both waves are identical in terms of time.

On the other hand, we observe that JPM consolidated developing an expanding triangle pattern with a slight bearish bias. Besides this structural bias, the internal sequence is respected by the price action.

Also, we distinguish the wide extension of the triangular sequence, which moved from late February 2018 until mid-August 2019, when JPM ended its internal wave E labeled in green.

Once JPM completed its fifth internal segment, the price action continued its previous bullish trend and soared to record highs at $141.10 per share.

Conclusions

From the cases analyzed, we can verify the Genn Neely’s affirmation that suggests that “the triangle pattern is a common formation that appears in the market.”

Also, we verified how the alternation principle works in the real market, while a corrective wave is simple, the other will be complex.

Finally, according to the examples reviewed, the triangle pattern could appear independently of the market analyzed,  as on currencies, stocks, indices, etc.

In the next article, we will review the different variations of the triangle pattern.

Suggested Reading

  • Neely, G.; Mastering Elliott Wave: Presenting the Neely Method; Windsor Books; 2nd Edition (1990).
Categories
Forex Videos

Break The Brokers & Conquer The Forex Market By Trading Triangles!

Triangle Formations

Triangle formations are another key tool used by technical traders to gauge potential price action moves based on triangle patterns that form on their charts.

Such patterns regularly occur and where traders will draw the patterns on their screens themselves rather than using a technical tool to do the job for them. The triangles can then be used areas of support and resistance around these triangle formations in order to trade from.
So what is a triangle, or wedge as it is sometimes referred to as? It literally is what appears to be a triangle based on price action, where traders will identify these areas by drawing lines onto their screen charts, such as in example A.

Example A

Here we can see a low point and a high point, as marked on the chart, and where are we have drawn two lines which act as resistance and support, the rules of which require that price action must touch both lines on at least on two occasions, which they do at positions 1 and 2.3 and 4, and where price action goes through a period of consolidation and becomes wedged to a point that it must eventually break from, either lower or break higher. In this situation It breaks higher from the triangle, and where the previous area of resistance at its furthermost point goes on to become an area of support, from where bulls come in and drive price higher.

Example B


Example B is an ascending triangle formation. It offers bullish setups and where the main characteristics are price action moving higher, with a flat top, which is confirmed by at least two attempts of price action to move higher than the area of resistance. Here we can see that the price action trend is higher and where price action is largely following our support line until price action flattens off and where we see resistance forming at the furthest most point of the wedge. Traders will be looking for a break higher or a break lower from the wedge. In this situation, we have a break higher and a continuation with the overall upward trend.


Example C


Example C is a descending triangle. This shape offers bearish setups. Again we have at least two confirmed attempts to breach the area of support and at least two attempts to move higher than our area of resistance and where the overall trend is moving lower until price action eventually breaks lower from the furthermost point of our triangle shape.
Other shapes in this category include falling or descending wedge formations, where price action is contained within two narrowing lines and is identified by lower highs and lower lows such as, in example D.

Example D


Also, a rising or ascending wedge, where price action again is contained in two narrowing lines, but this time identified by higher highs and higher lows, such as in example E.

Example E


In both wedge-shapes, traders will be looking for a break out as the lines narrow and where the breaks usually prove to be good entry points for trading the opposite direction as the previous trends run out of steam.


Example F


Slightly more complex are the symmetrical triangle shapes as in example F, and where we would identify lower tops and higher bottoms with an almost flag-like appearance, and where we can see our confirmed area of support and resistance is breached and where price action eventually moves lower and where our initial area of support becomes an area of resistance.

We would usually look for our initial breakout from the first area of price action to reach the peak of the initial high. However, the shape is considered neutral with no real particular bias.
The next shape is a bullish Pennant and is defined by an initial upward trend with a triangle shape based on a slightly ascending support line with a confirmed area of resistance with lower highs and where we would expect a breach higher from this triangle shape formation such as in example G.


Example G


Our final shape in this series is the expanding wedge, which, as the name would suggest, is an area of price action that expands as it moves forward, as in example H. This might typically occur as extra volume enters the market after a period of tight consolidation.


Example H

Categories
Forex Elliott Wave

The USDJPY and its 3-Year Triangle

The triangle is one of the three basic corrective patterns along with the Flat structure, with more variations within Elliott’s Wave Theory. In this educational article, we will review the basic concepts of the triangle pattern and then apply it to the USDJPY pair.

The Fundamentals

Triangles are one of the three basic corrective formations described by R.N. Elliott. Five internal segments characterize them. The inner legs overlap and follow an internal sequence as 3-3-3-3-3.

The following figure shows the different types of triangles. By simplification, we omitted the internal structure of each segment that composes the triangle pattern.

We should consider the nature of the triangle, a balance between the buying and selling forces. In this context, and under a conservative approach to trading, it is not desirable to trade within this internal structure. However, the breakout of price action across the wave (D) can provide a reliable entry to the market with reduced risk.

The 3-Year Triangle of USDJPY

The following chart corresponds to the USDJPY pair in its weekly timeframe, using a log scale. We observe the price action on the Japanese currency developing a Contracting Triangle structure that began at the end of 2016.

The next chart shows the USDJPY moving in a 12-hour timeframe. The pair shows the last internal segment corresponding to a wave (E) of Intermediate degree labeled in black.

At the same time, in the last figure, we can distinguish the price action developing an Expanding Triangle formation in a wave C of Minor degree labeled in blue. However, the RSI oscillator reveals in its progress the shape of a contractive triangle pattern.

It should be noted that when the price action develops an Expansive Triangle in a wave C, the pattern should correspond to an Expansive Diagonal formation. Remember that a diagonal pattern has five internal waves overlapped one with another. At the same time, each inner leg holds three segments.

Trading the USDJPY Triangle

The USDJPY pair in its 12-hour chart shows an incomplete expansive diagonal. Consequently, positioning on the long-side could still have endeavored with a short-term objective placed in the upper trendline of the diagonal. A likely target area would be between 109,716 and 110,551.

Considering that the invalidation level of the bullish segment is the bottom of the wave ((iv)) in green at 108,242, the breakdown and close of the price below this level could give us the first bearish scenario with a target at the end of the wave B labeled in blue located at 106,625.

Now, if the USDJPY price continues extending its falls below the end of wave C in blue and (D) in black located at 104,446, a major-degree bearish scenario would be activated. Under this context, the pair could see the psychological support of 100 yen per dollar.

Conclusions

Depending on the trader’s style and its risk aversion, the internal structure of the triangle pattern could be traded one timeframe shorter than the time frame in which the triangle has been identified.

We must remember that the internal structure of the triangle follows a sequence 3-3-3-3-3. Under this context, a three-wave corrective structure can be a Flat pattern (which has a subdivision 3-3-5); or it can also be a zigzag pattern (5-3-5). Therefore, an internal wave C could give a trading opportunity. However, knowing the nature of the triangle pattern, and considering it is formed by the struggle between buyers and sellers, the targets of the movements anticipated should be limited by the triangle formation.

Categories
Forex Elliott Wave

Trading the Elliott Wave Principle – Part 5

Triangles are the third fundamental Elliott wave corrective structure. In this educational article, we will review the guidelines to trade this pattern.

The basics

The triangle structure is a corrective formation with a 3-3-3-3-3 internal sequence. Triangles usually tend to appear in waves four and B.

In this formation, volume tends to decrease as the triangle progresses. Also, it characterizes by the balance between bull and bear traders.

The following figure illustrates the trading setup for a contracting triangle. The entry is triggered once the price action strikes and closes above the end of wave (D) labeled in black degree.


To place the potential targets, we can measure the Fibonacci projection from the origin of wave ((3)) or ((A)) labeled in red, and the lowest level of the triangle. The first target will be at 61.8%, and the second target at 100%.

The trading setup is invalid if the price pierces the wave (A) labeled in black degree.

Golden triangle

Gold, in its weekly chart, shows the guideline of an Elliott wave contracting triangle in progress. The bullish sequence starts on November 30, 2015, once the yellow metal found buyers at $1,046.54 per ounce.

The golden metal made the first rally until early July 2016 at $1,375.15 per ounce. After this move, Gold made an up and down sideways movement till late April 2019.

Now that we have identified the start of a price cycle, we have to face the question, “do I recognize an Elliott wave pattern?”

In this case, we start from the most straightforward formation, which could correspond to a Contracting Triangle.


Now that we have recognized a wave pattern, we advance to the second stage, which is to define our trading plan. Following the triangle setup guideline, we have to expect the breakout of wave (D) labeled in black at $1,346.75.

The theory says that the first profit target must be at 61.8% of the Fibonacci projection. However, this level is under the entry-level. In this case, we place the first profit target at the 100% level at $1,453.78. The second profit target will be at the 127.2% level at $1,543.80 per ounce.

The invalidation level is theoretically below the wave (A) labeled in the black degree at $1,122.10.

Now that we have defined the trading plan, the third stage is to manage the trade and risk. The first step is to reduce the risk. In this case, we move the protective stop from the theoretical invalidation level to the end of the wave (E) at $1,266.39, as shown in the next figure.


Once that we have reduced the risk and the trade advances, the trader must eradicate the risk. In this example, after Gold reached the first profit target at $1,453.78, we move the protective stop to the entry-level.

As an alternative to eliminate the risk, the protective stop could be placed considering the entry-level plus the trade costs, for example, commission costs and swap.


The last step of the trade management, before the trade reaches the final profit target, is to protect open profits. This last stage depends on the criteria of each trader.

Categories
Forex Elliott Wave

Corrective Waves Construction – Part 4

The third basic corrective formation is the triangle. This pattern follows a 3-3-3-3-3 sequence. In this educational article, we will unfold the main characteristics of this Elliott Wave pattern.

The basics

A triangle structure emerges when the two markets’ forces, buyers, and sellers, are in balance. When the triangle pattern is in progress, the volume and volatility tend to decrease over time.

The triangle pattern is the most common Elliott Wave structure. The main rule of construction is the composition of five segments, or internal waves, which are built by three waves each segment. The following chart shows the basic structure of a triangle pattern.


Triangle variations

There are four triangle variations; these are contracting, barrier, expanding, and running. The next chart exposes the different triangle variations.


A triangle pattern tends to appear before the end of a trend. For this reason, it is useful the study in recognition of this Elliott Wave structure.

The triangle pattern in action

The example corresponds to the weekly chart of Nikkei 225 futures (CME:NKD) in log scale. The Japanese index shows a motive wave of Cycle degree in progress. The bullish sequence started in March 2009, when the market found buyers at 6,950 pts.

Pay attention to the extension of the third wave of Cycle degree, which climbed over 16,000 pts. At the same time, the third wave of Primary degree soared 12,740 pts (154.42%).


From the chart, we observe two triangles formations. The first one is a barrier triangle and was developed on wave 3 of Primary degree. The Elliott Wave structure started in the second half of May 2013 and ended in the first half of October 2014.

The second one is an expanding triangle in progress. The EW structure belongs to the fourth wave of Cycle degree. Currently develops the segment C-D. Consider the possibility that the price action could not reach the previous high of 2018 at 24,515 pts.

For the current sequence, the most likely path is a marginal upside, giving way to a bearish move probably to the 18,000 pts. Once completed this corrective move, Nikkei should start a rally with the eyes placed at the 26,000 pts.