
Introduction
Breakouts trading and trading the triangle chart pattern are two different trading tools. A breakout occurs when the price goes above or below the significant support resistance area. It indicates that the price is ready to move in the direction of the breakout, and any entry near the breakout will be fruitful. This is the reason why breakout trading is considered a leading method of trading in the industry as it helps the traders to anticipate the trend and ride the potential moves.
On the other hand, the Triangle is a technical chart pattern. The best description of the triangle chart pattern is as a horizontal continuation chart pattern, which helps the traders in finding the best entry on the price chart. At the beginning of the pattern, it is widest, and as the market continues the ranging move, the price starts to move in a limited, narrow range, and as a result, we witness the point of the Triangle on the trading chart.
The Trading Strategies
There are two types of triangle chart patterns. The first one is ascending chart pattern, and the second is the descending chart pattern.
Ascending Triangle Chart Pattern
Ascending Triangle is a bullish chart pattern that helps traders to take buy trade in an ongoing uptrend. The image below represents the formation of an Ascending Triangle chart pattern in the CAD/JPY Forex pair.
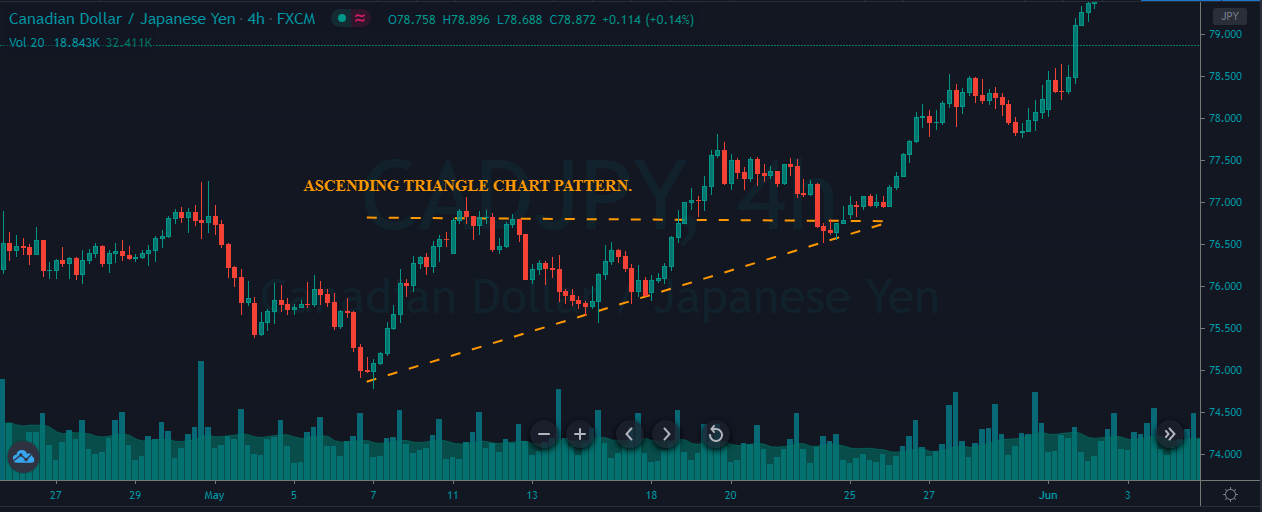
The image below represents our entry, exit, stop-loss, and take-profit in the CAD/JPY forex pair. As you can see, in an uptrend, when the price broke above the chart pattern line, it is a sign that the buyers are strengthening. Therefore, if the price is holding above the support line, it is an indication for us to go long in this pair.
Right after our entry, we can see that the price smoothly ran towards the north, and printed a brand new higher high. We can close our trade based on any nearest support area, and we also can use any indicator for the exit. The stop-loss order was placed just below the entry. In a strong trending market, the smaller stops are good enough to ride the trend.

Descending Triangle Chart Pattern
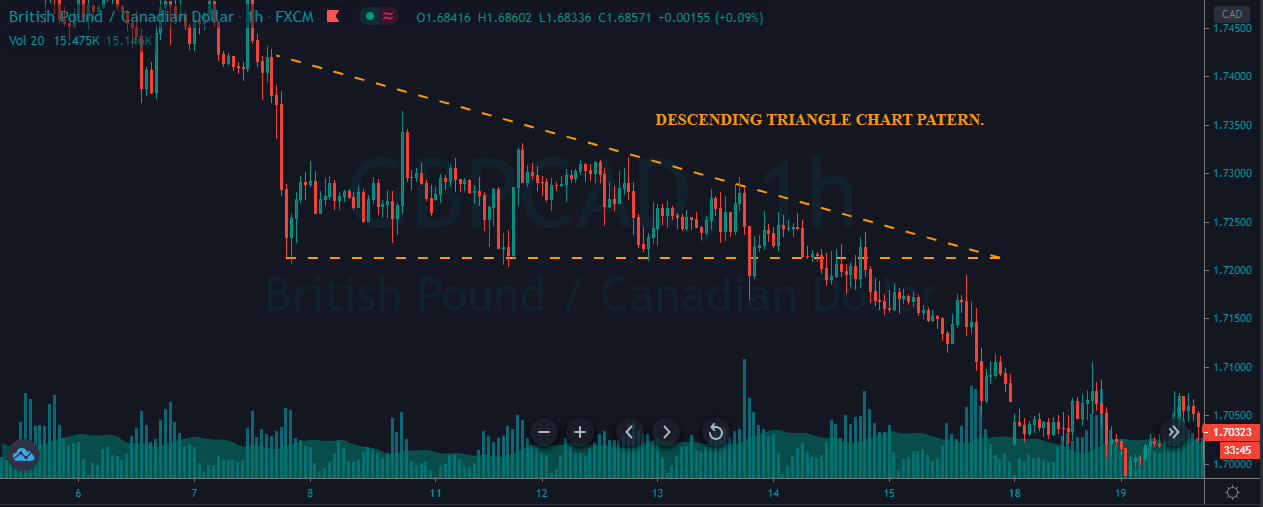
The Descending Triangle is a bearish chart pattern that helps traders in taking sell trades in an ongoing downtrend. The image below indicates the formation of a Descending Triangle pattern in the GBP/CAD Forex pair.
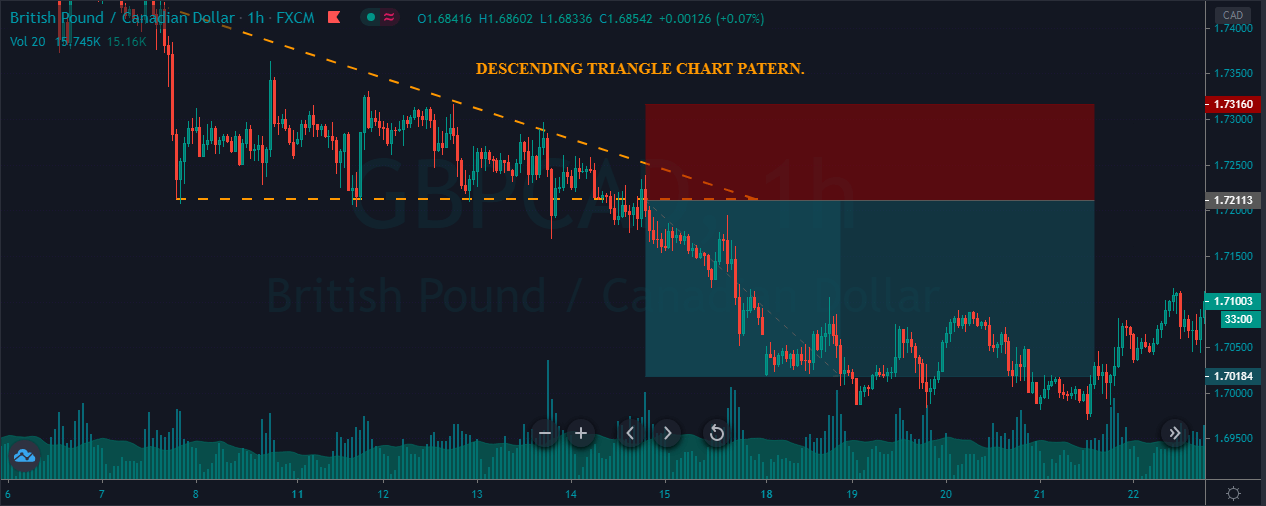
The below price chart of the GBP/CAD pair represents our entry, exit, and stop-loss. In a downtrend, when the price breaks below the support area, it’s a sign that the strong buyers failed to push the price higher, and any hold below the resistance line is an indication to go short. Soon after our entry, price blasted down south, printing a brand new lower low.
The descending Triangle is simple and easy to trade Forex chart pattern. Most of the time, this pattern offers excellent risk to reward entry trades. So when you see the pattern on the price chart, don’t forget to scale your position for more significant gains.
That’s about trading the ascending and descending Triangle chart pattern breakouts. Take the below quick quiz before you go. Cheers.
[wp_quiz id=”85881″]