Triangle Formations
Triangle formations are another key tool used by technical traders to gauge potential price action moves based on triangle patterns that form on their charts.
Such patterns regularly occur and where traders will draw the patterns on their screens themselves rather than using a technical tool to do the job for them. The triangles can then be used areas of support and resistance around these triangle formations in order to trade from.
So what is a triangle, or wedge as it is sometimes referred to as? It literally is what appears to be a triangle based on price action, where traders will identify these areas by drawing lines onto their screen charts, such as in example A.
Example A
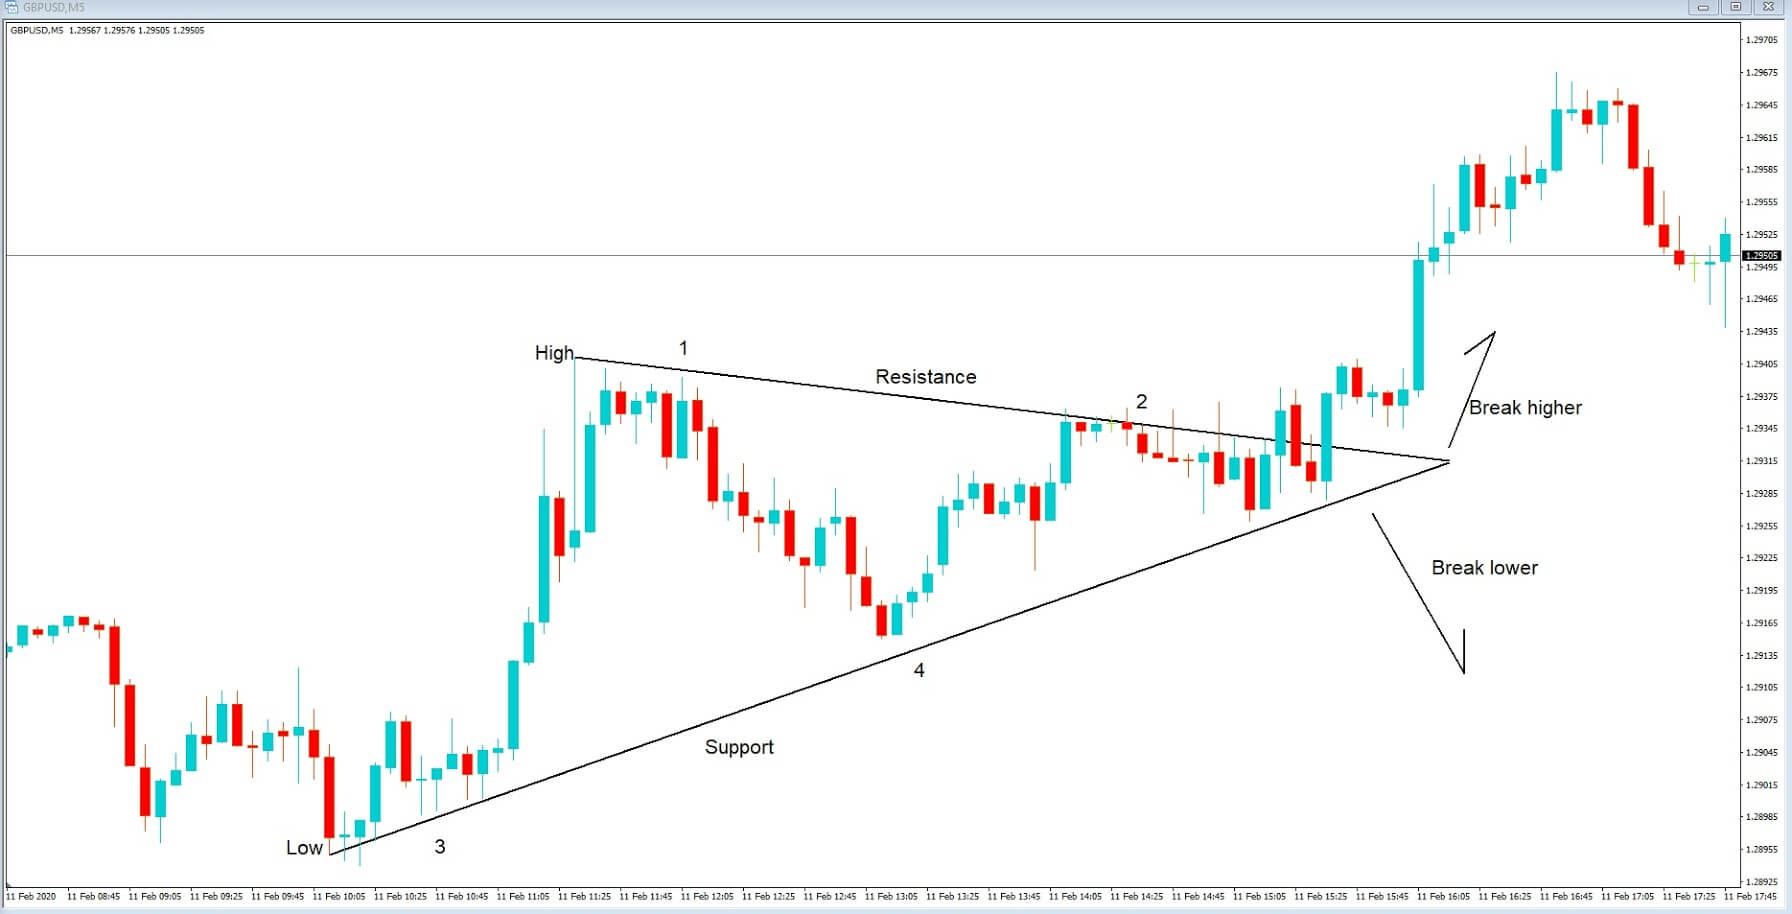
Here we can see a low point and a high point, as marked on the chart, and where are we have drawn two lines which act as resistance and support, the rules of which require that price action must touch both lines on at least on two occasions, which they do at positions 1 and 2.3 and 4, and where price action goes through a period of consolidation and becomes wedged to a point that it must eventually break from, either lower or break higher. In this situation It breaks higher from the triangle, and where the previous area of resistance at its furthermost point goes on to become an area of support, from where bulls come in and drive price higher.
Example B
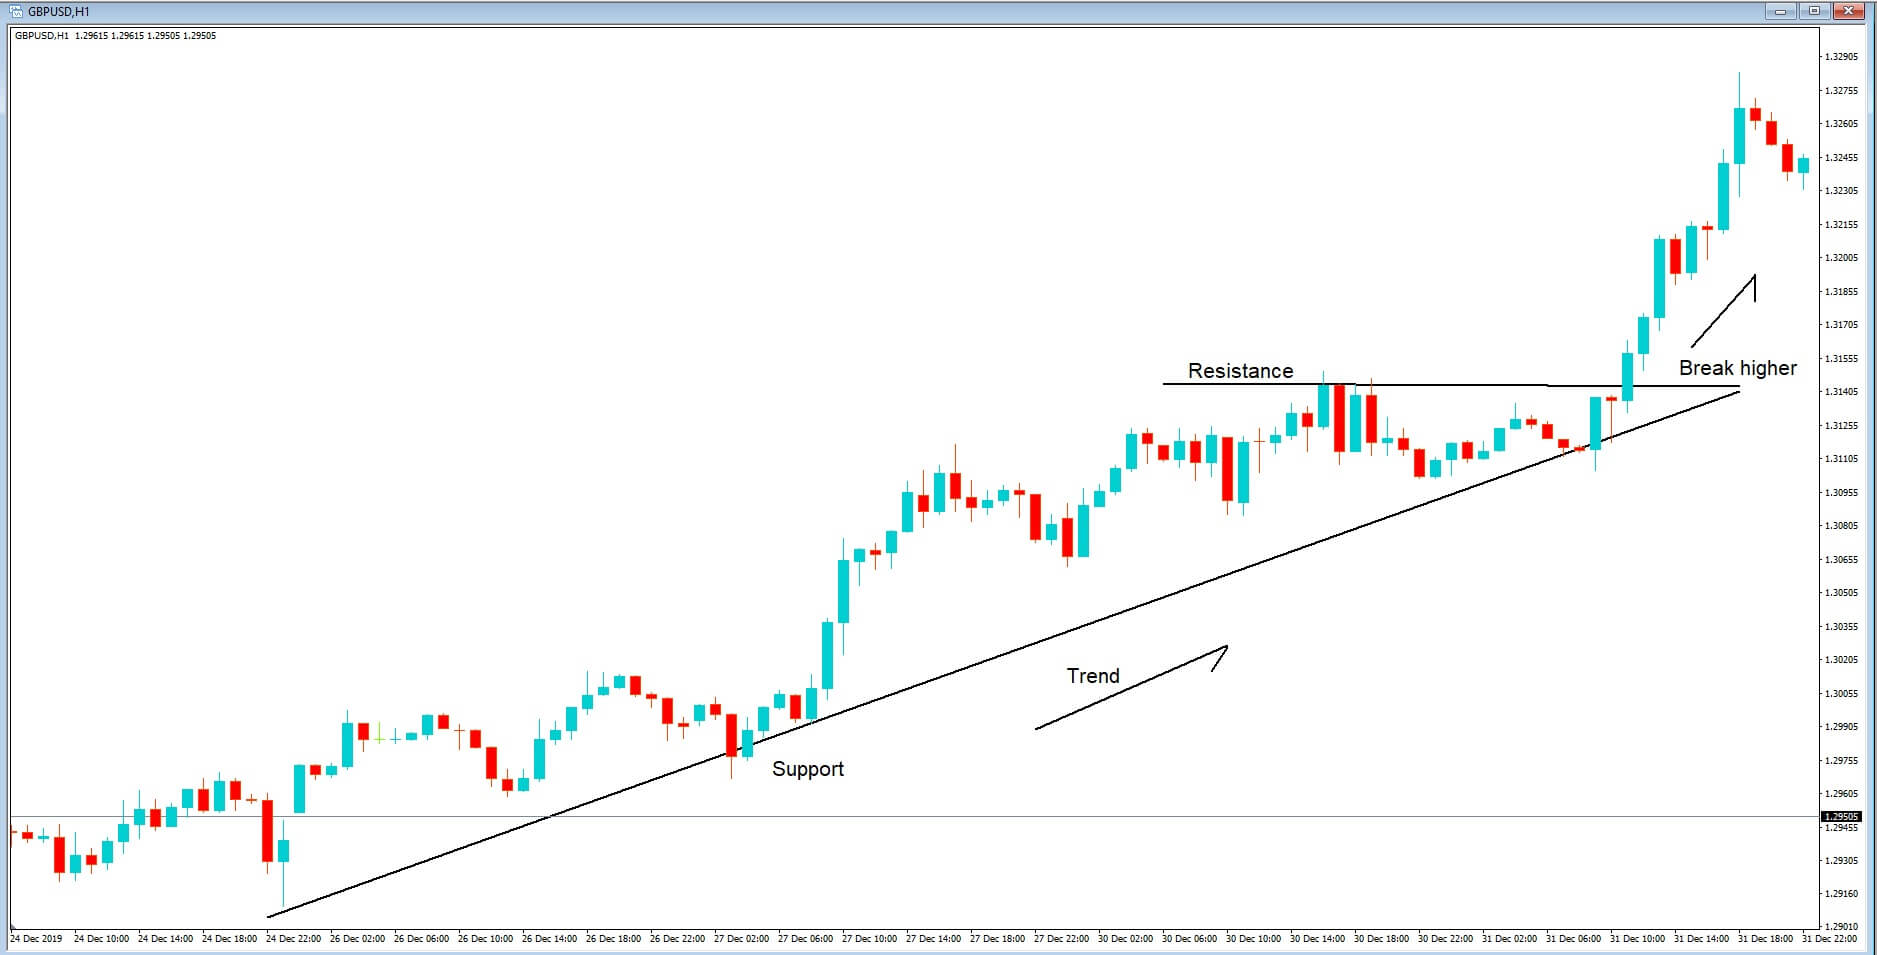
Example B is an ascending triangle formation. It offers bullish setups and where the main characteristics are price action moving higher, with a flat top, which is confirmed by at least two attempts of price action to move higher than the area of resistance. Here we can see that the price action trend is higher and where price action is largely following our support line until price action flattens off and where we see resistance forming at the furthest most point of the wedge. Traders will be looking for a break higher or a break lower from the wedge. In this situation, we have a break higher and a continuation with the overall upward trend.
Example C
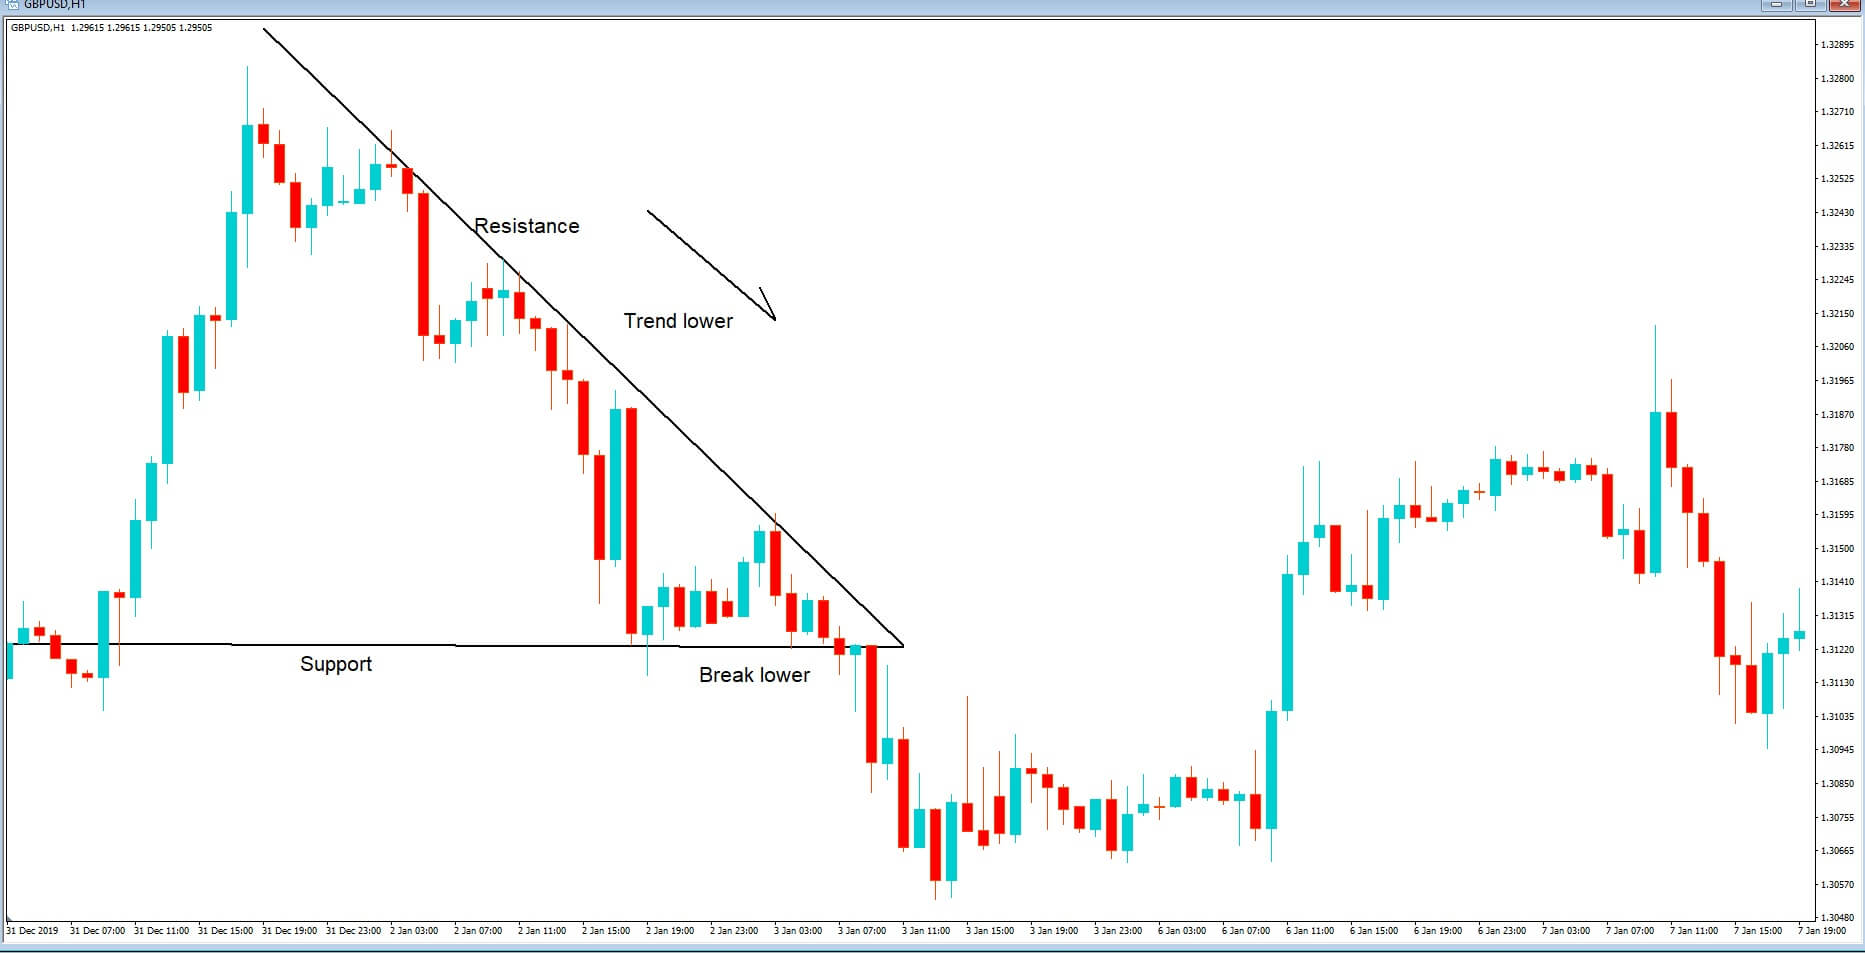
Example C is a descending triangle. This shape offers bearish setups. Again we have at least two confirmed attempts to breach the area of support and at least two attempts to move higher than our area of resistance and where the overall trend is moving lower until price action eventually breaks lower from the furthermost point of our triangle shape.
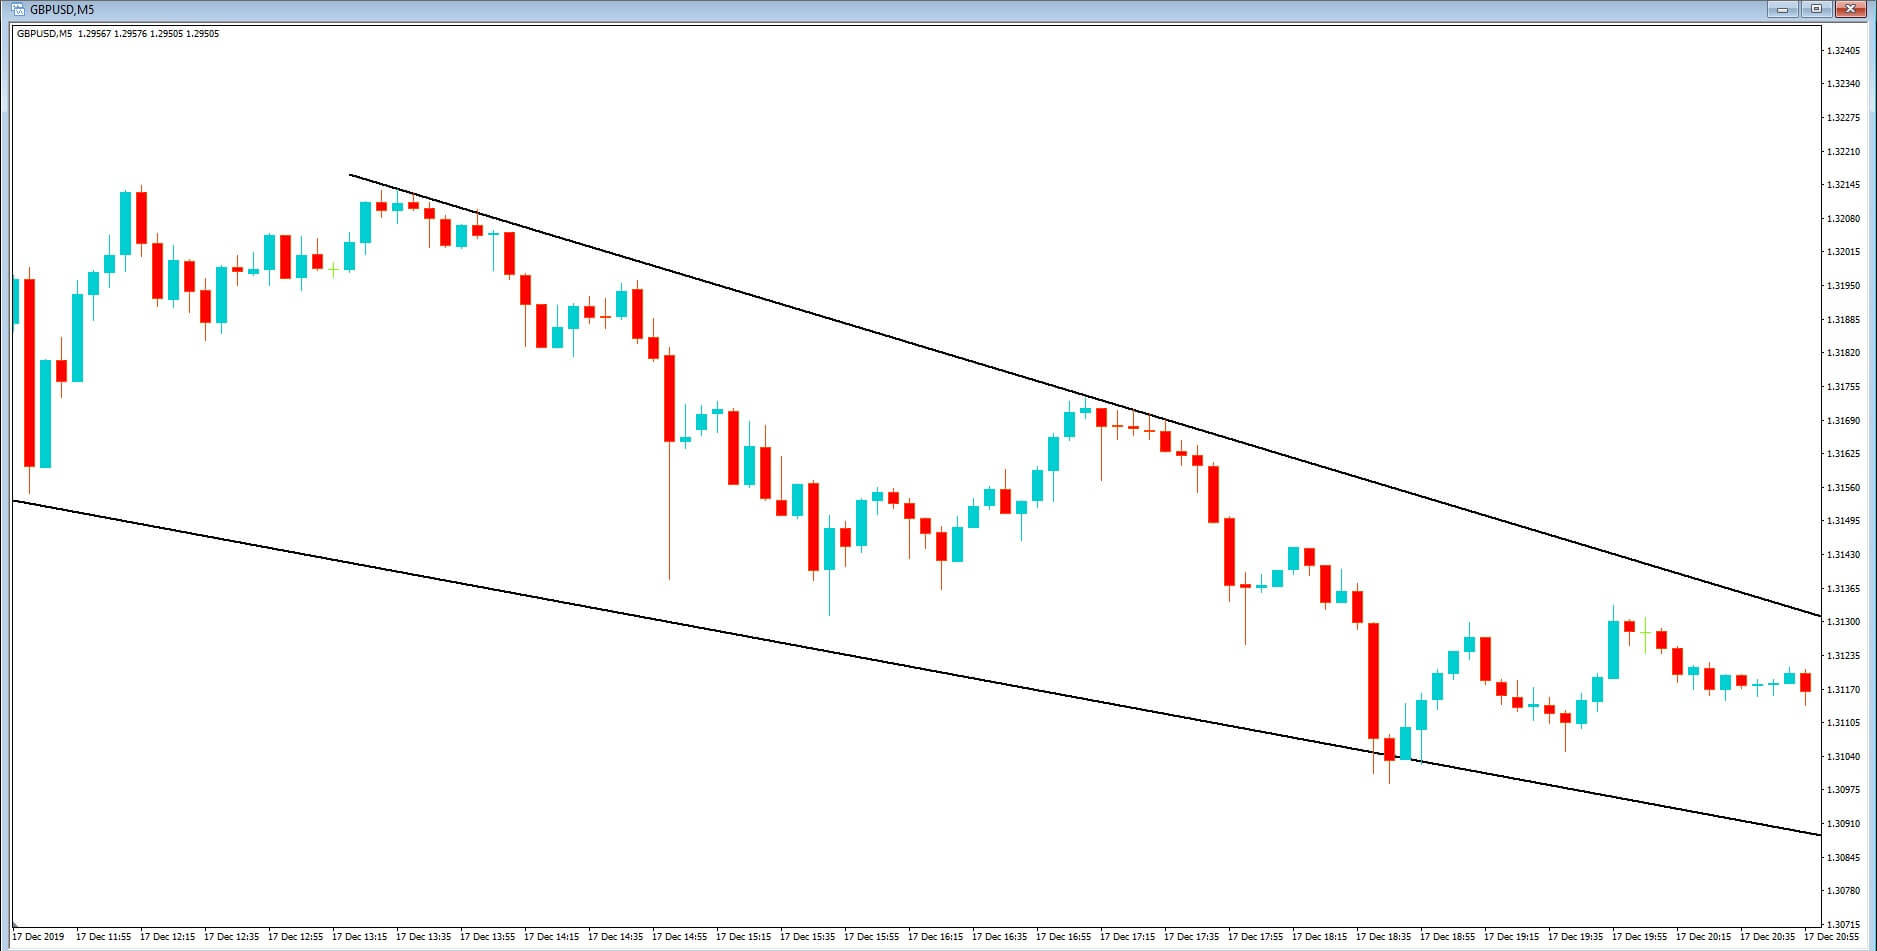
Other shapes in this category include falling or descending wedge formations, where price action is contained within two narrowing lines and is identified by lower highs and lower lows such as, in example D.
Example D
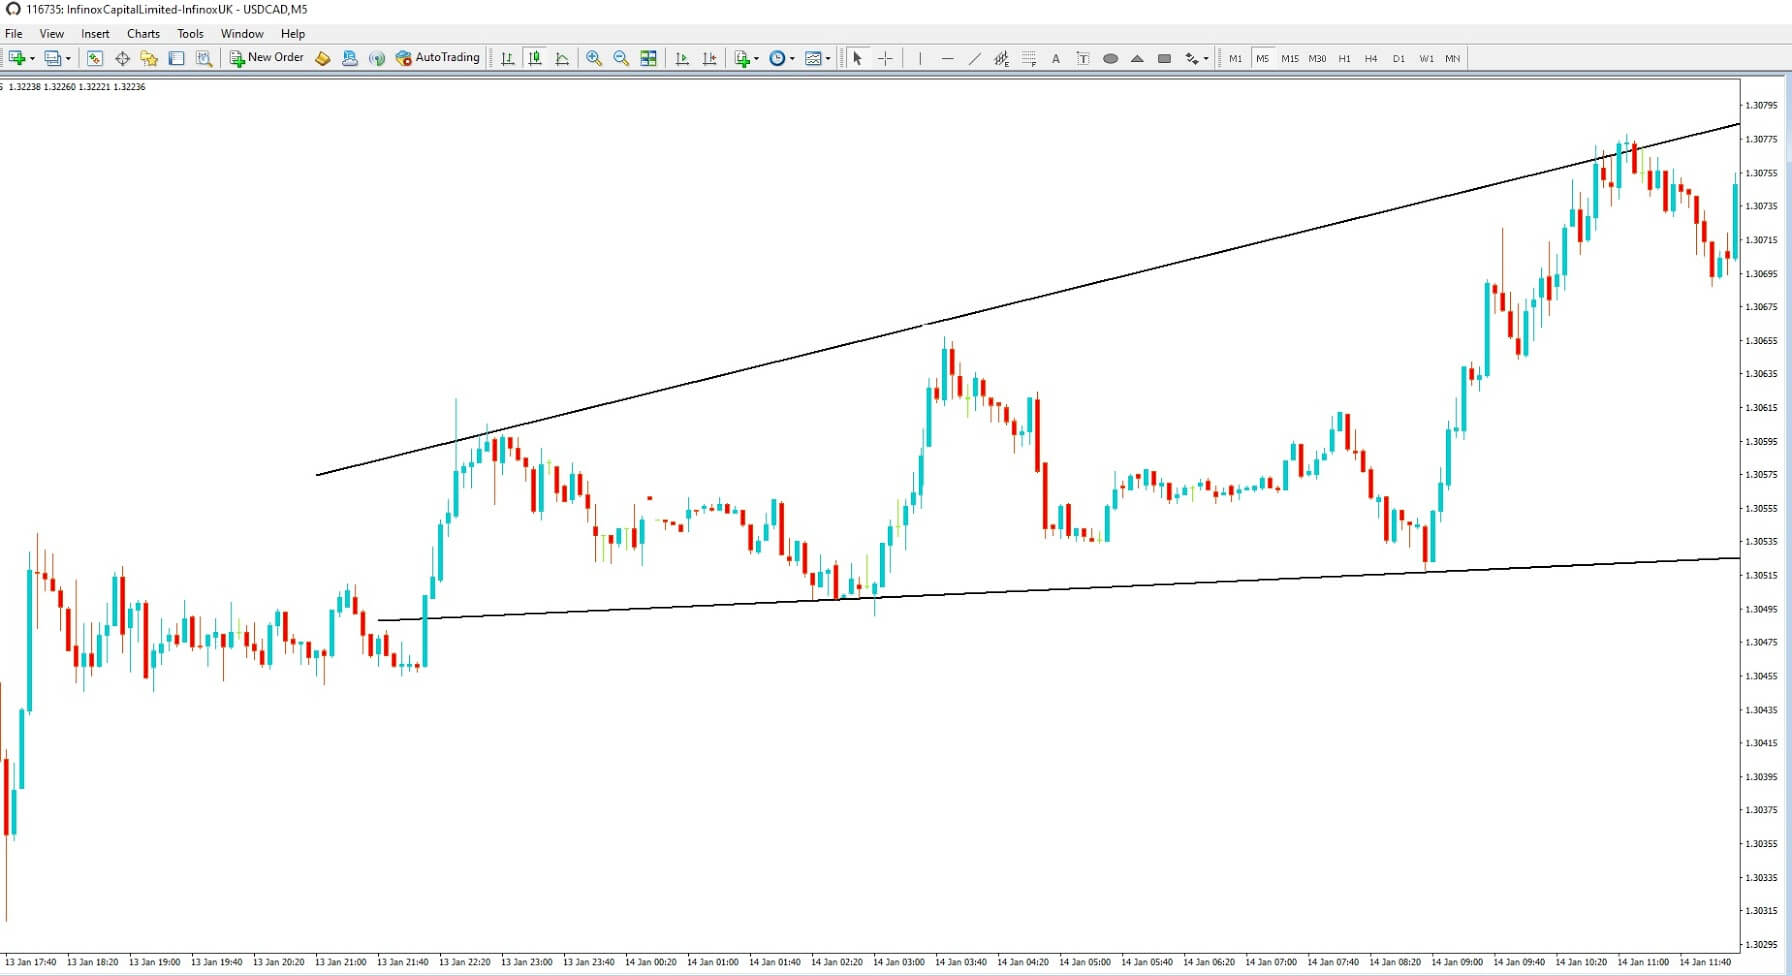
Also, a rising or ascending wedge, where price action again is contained in two narrowing lines, but this time identified by higher highs and higher lows, such as in example E.
Example E
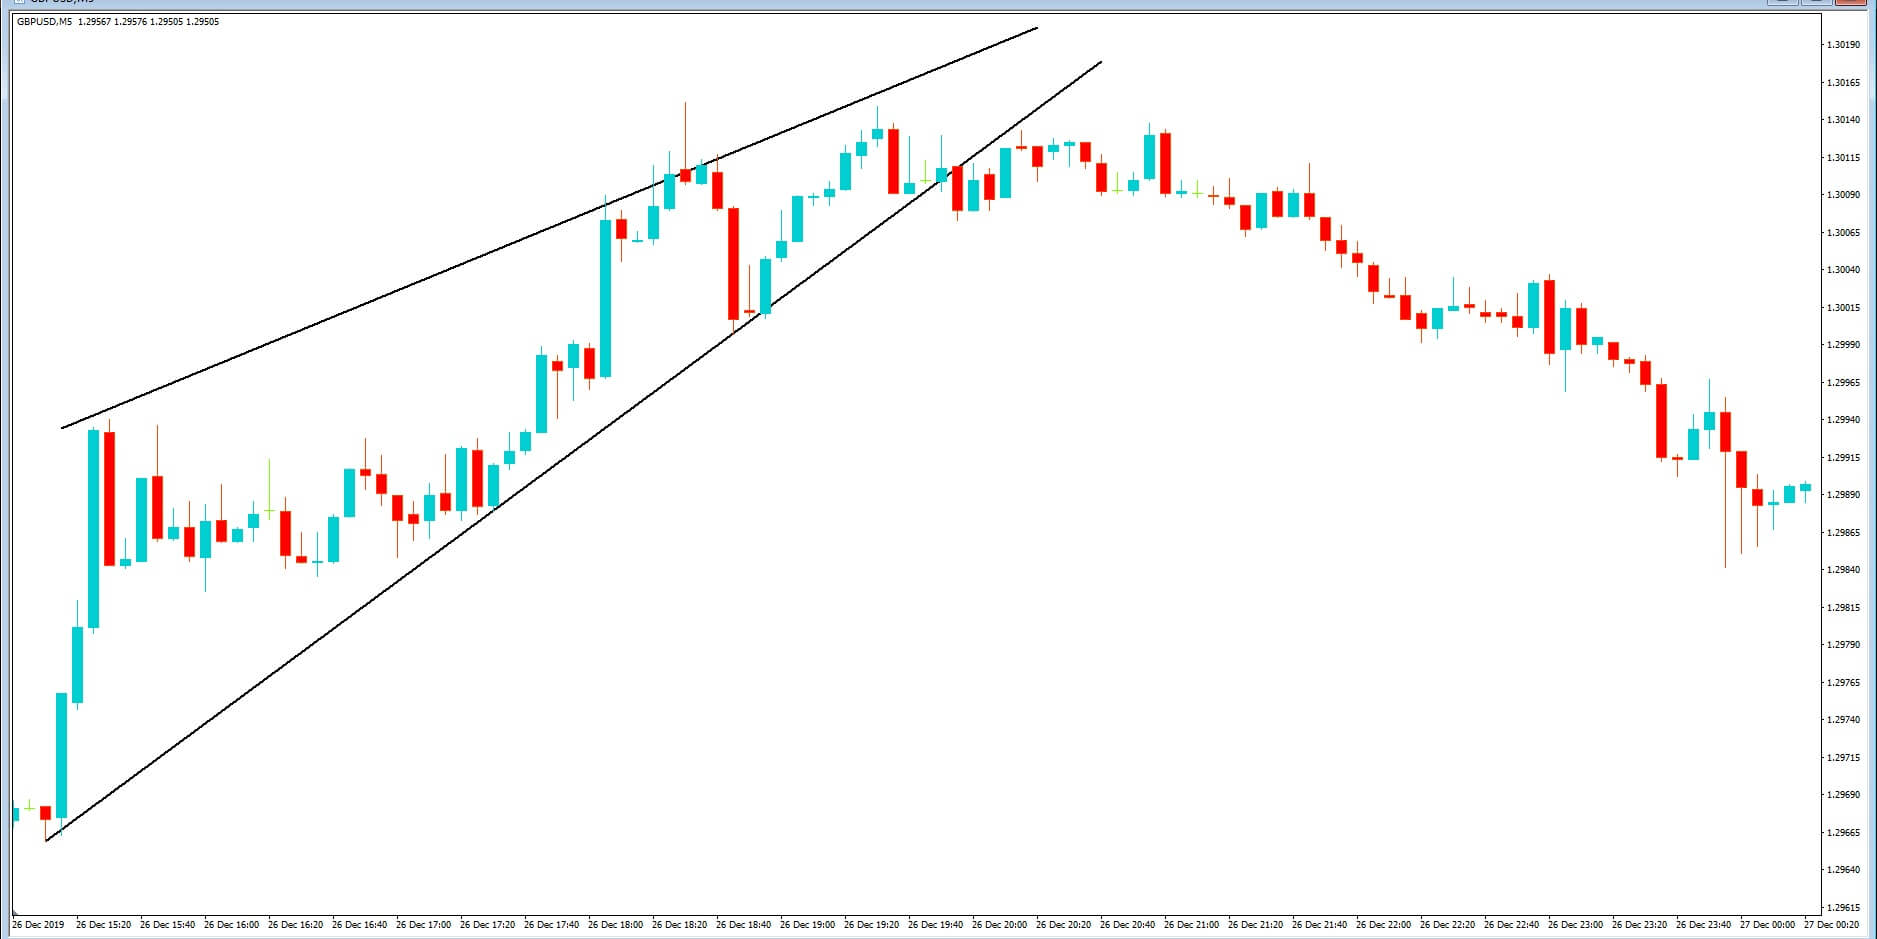
In both wedge-shapes, traders will be looking for a break out as the lines narrow and where the breaks usually prove to be good entry points for trading the opposite direction as the previous trends run out of steam.
Example F

Slightly more complex are the symmetrical triangle shapes as in example F, and where we would identify lower tops and higher bottoms with an almost flag-like appearance, and where we can see our confirmed area of support and resistance is breached and where price action eventually moves lower and where our initial area of support becomes an area of resistance.
We would usually look for our initial breakout from the first area of price action to reach the peak of the initial high. However, the shape is considered neutral with no real particular bias.
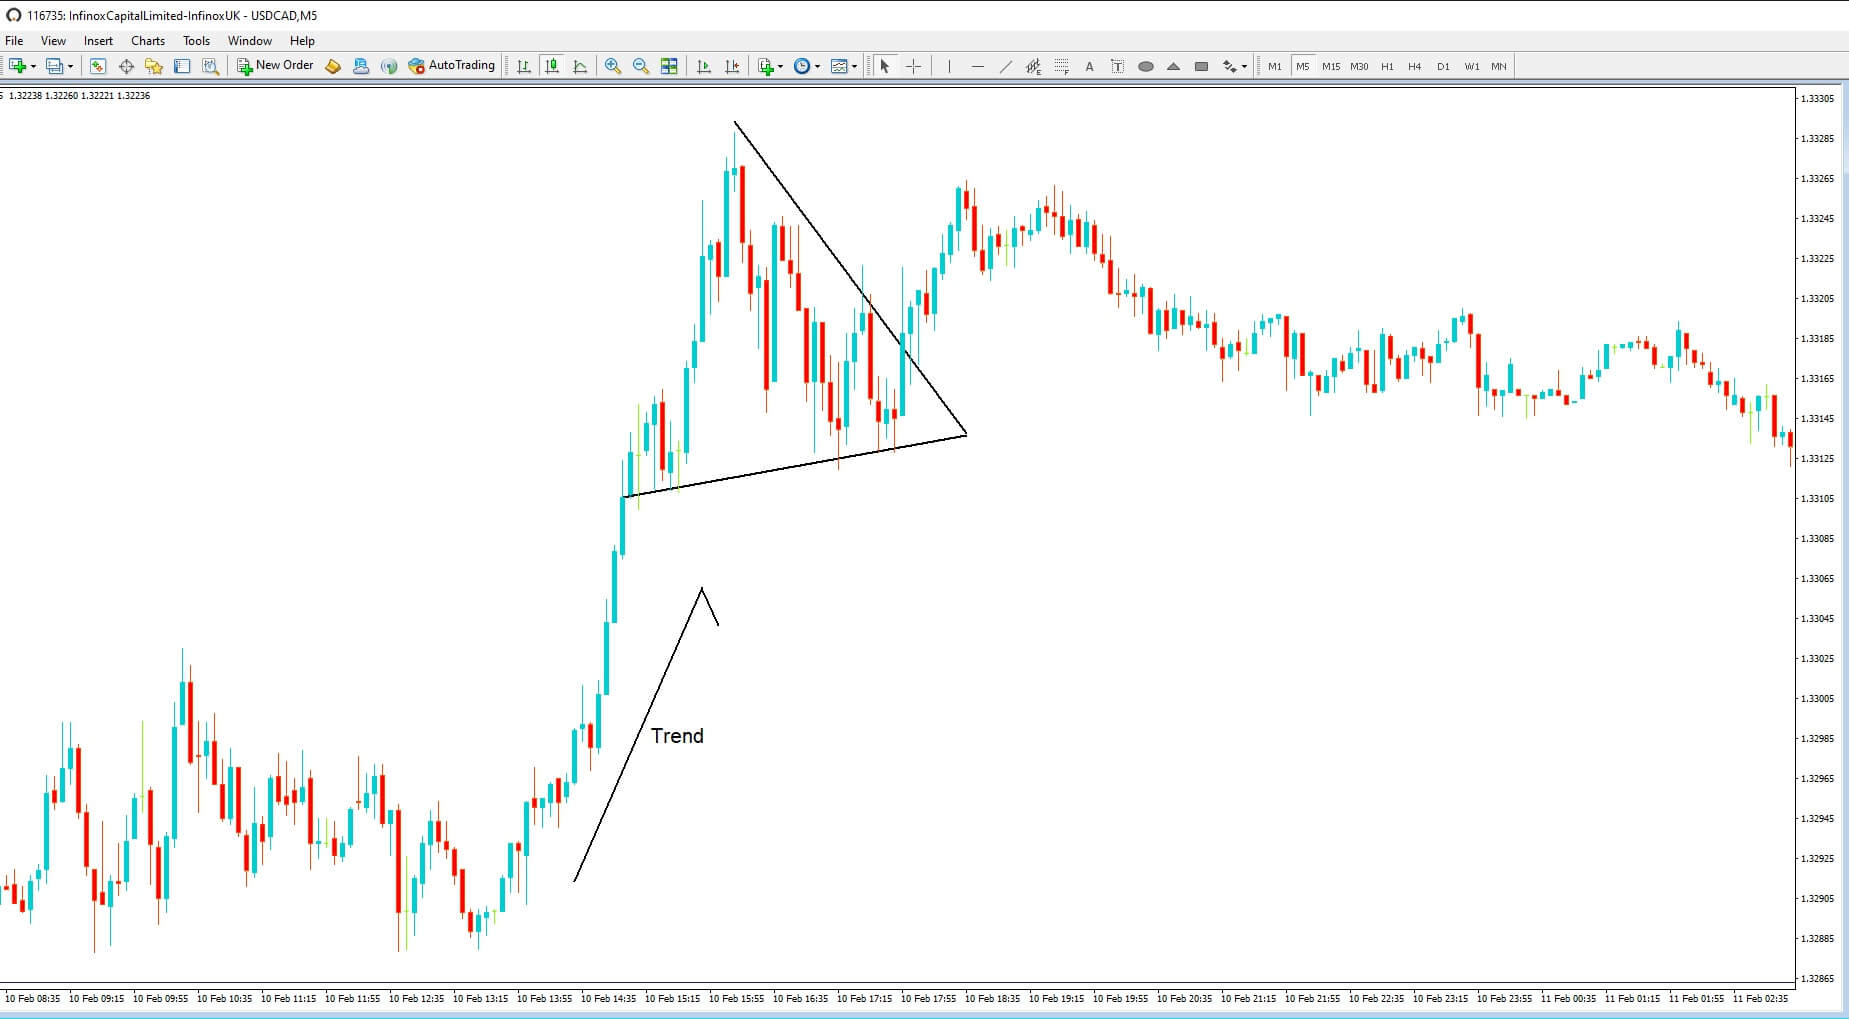
The next shape is a bullish Pennant and is defined by an initial upward trend with a triangle shape based on a slightly ascending support line with a confirmed area of resistance with lower highs and where we would expect a breach higher from this triangle shape formation such as in example G.
Example G
Our final shape in this series is the expanding wedge, which, as the name would suggest, is an area of price action that expands as it moves forward, as in example H. This might typically occur as extra volume enters the market after a period of tight consolidation.
Example H