Synchronized indicators equal more winning trades
A little bit of care and patience will enhance your trading. One area where new traders fall down is because they have a system, but do not stick to it. And one of the most common traits is using indicators in a haphazard way, so as to set up a trade to fail.
 Example 1
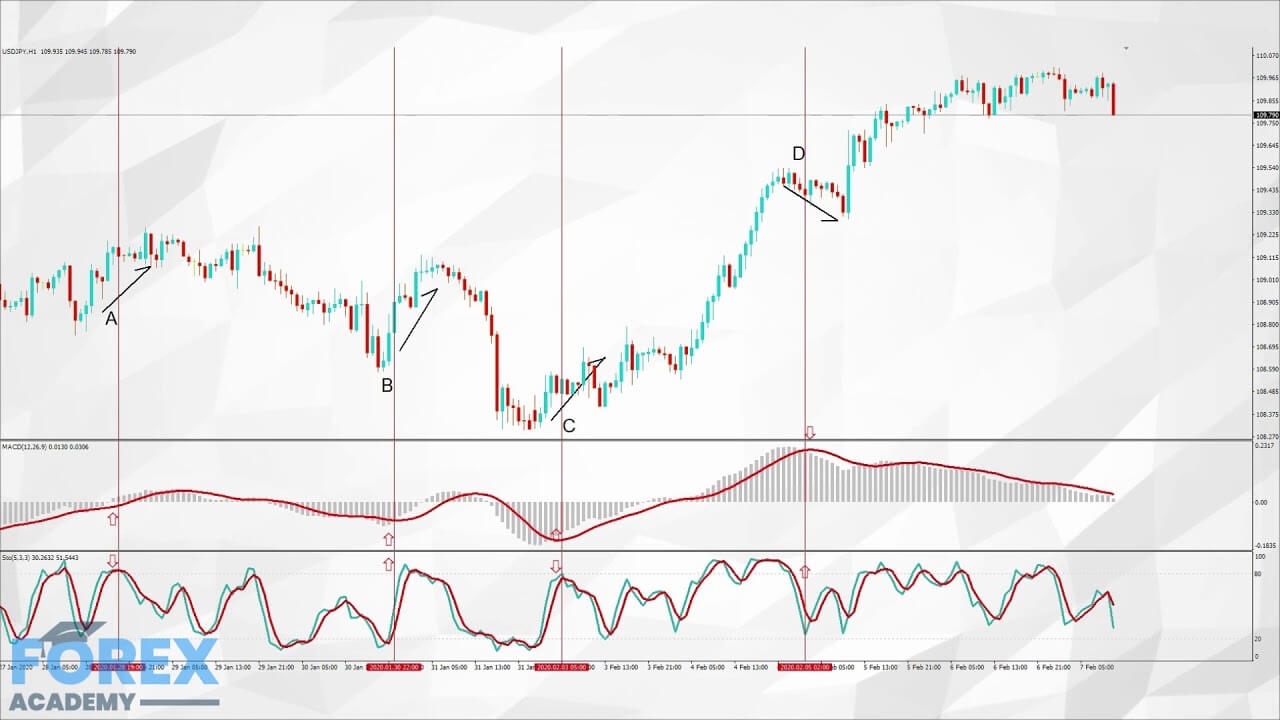
Let’s look at example 1, which is a one hour chart of the USDJPY pair for some examples. In this chart, we are using two commonly used indicators, the stochastic oscillator, and the moving average convergence and divergence or MACD indicator.
For a brief recap, the stochastic indicator tells us when an asset is overbought when the two moving averages cross above the 80 level and when they move beneath the 20 level the acid is considered to be oversold.
The MACD uses one or two moving averages – in our case we are using one, and when the MA is moving from a low and subsequently rising towards and then through and above the 0-axis it is considered to indicate that an asset should be moving higher, and especially if it is supported by and almost mirroring the histogram, which is the second component of the MACD the. The opposite action applies to a descending asset.

At position A, we have drawn a vertical line, which shows us that the stochastic is suggesting that this pair is overbought and due for a move lower. However, the MACD is moving higher and thus not working in unison with the Stochastic, and where the MACD’s moving average is going up above the 0-axis and the histogram is following suit, having come from underneath, to move above the 0-axis also. In this scenario price action has ignored the stochastic and moved higher. Here our indicators are at odds with each other. Selling this pair based only on the stochastic indicator would have resulted in a losing trade.

At position B, the stochastic is moving up, having been below the 20-line and on this occasion the MACD histogram is moving underneath its 0-axis and now higher, having pierced through its moving average, which is an indication that divergence is occurring and indeed the price action does move higher from this point. Here our indicators are synchronized, and the pay off is that buying the pair based on both of these indicators would have been rewarded with a positive winning outcome.
Position C, is similar to position A, in that our stochastic he is suggesting that the pair is overbought and due for a move lower and where the MACD histogram is starting move higher, quickly followed by the MA, and had we gone short at this point we would have entered a losing trade.
At position D, our stochastic is showing that the pair is oversold, and our Macd is showing that the pair is due to fall lower and where we see a slight move lower in price action, before a reversal. Again we have seen mixed messages from our indicators, and where we can see from our charts that when our indicators are working on a synchronized basis, they throw up more winning trades than losers.
Be patient and wait for your chart indicators to be synchronized and keep an eye on the price action, which is the most important indicator of all, and where all of your indicators are working together only then should you be thinking about pulling the trigger on a trade.


