Become An Expert On Candlesticks In 3 Minutes
This video is the beginner’s guide to candlesticks,
where we will teach you what a candlestick is, and identify its basic properties.
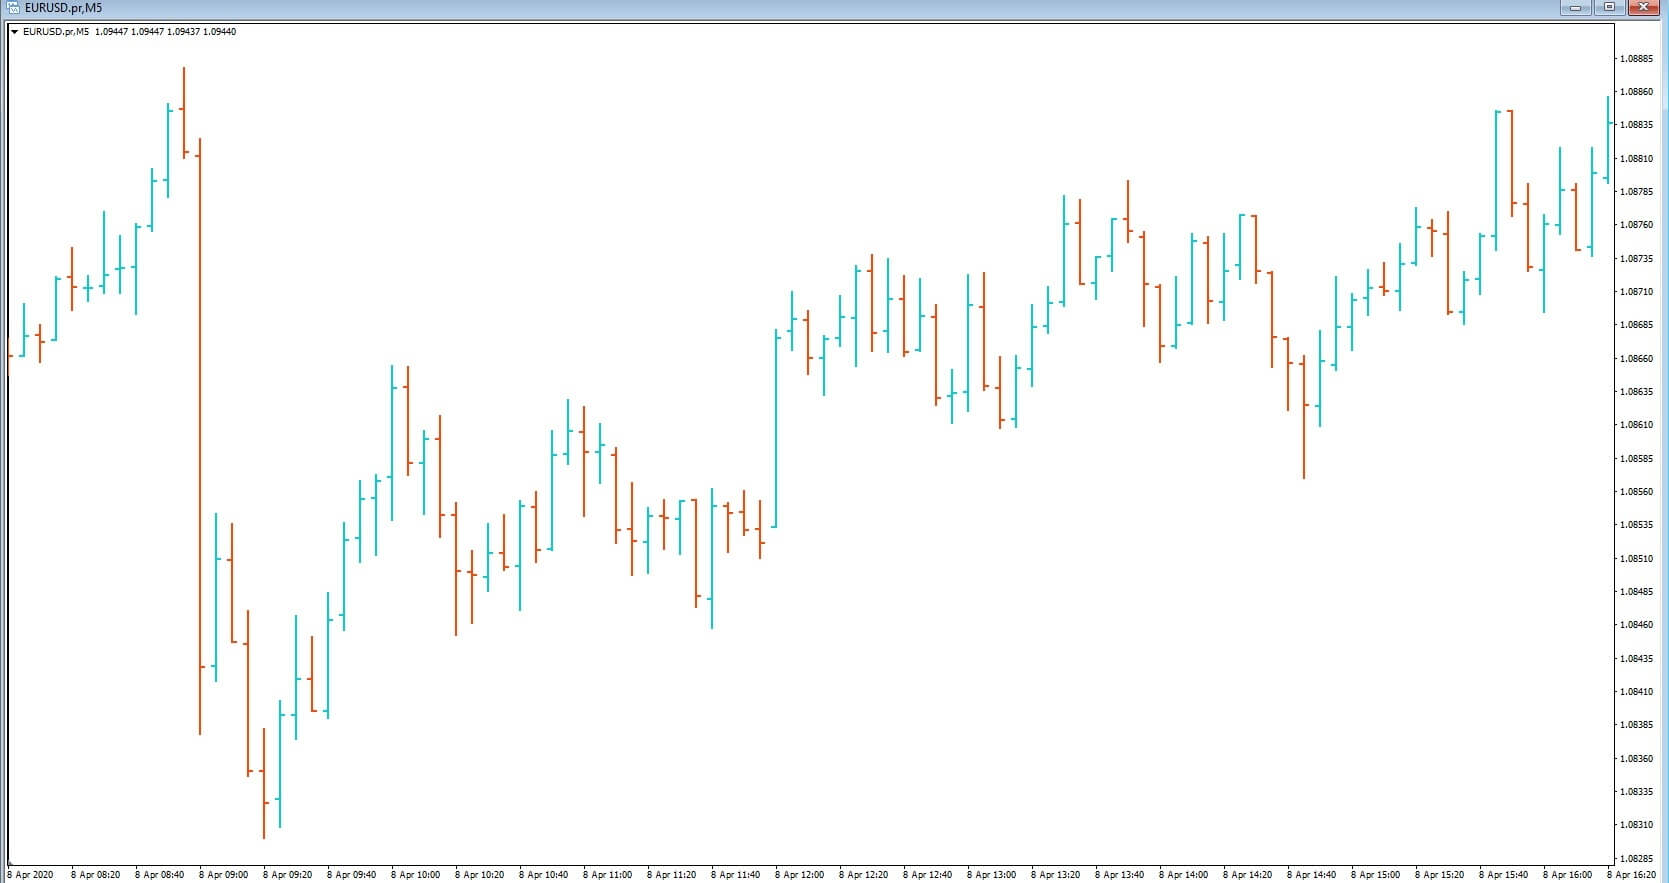
Insert B:
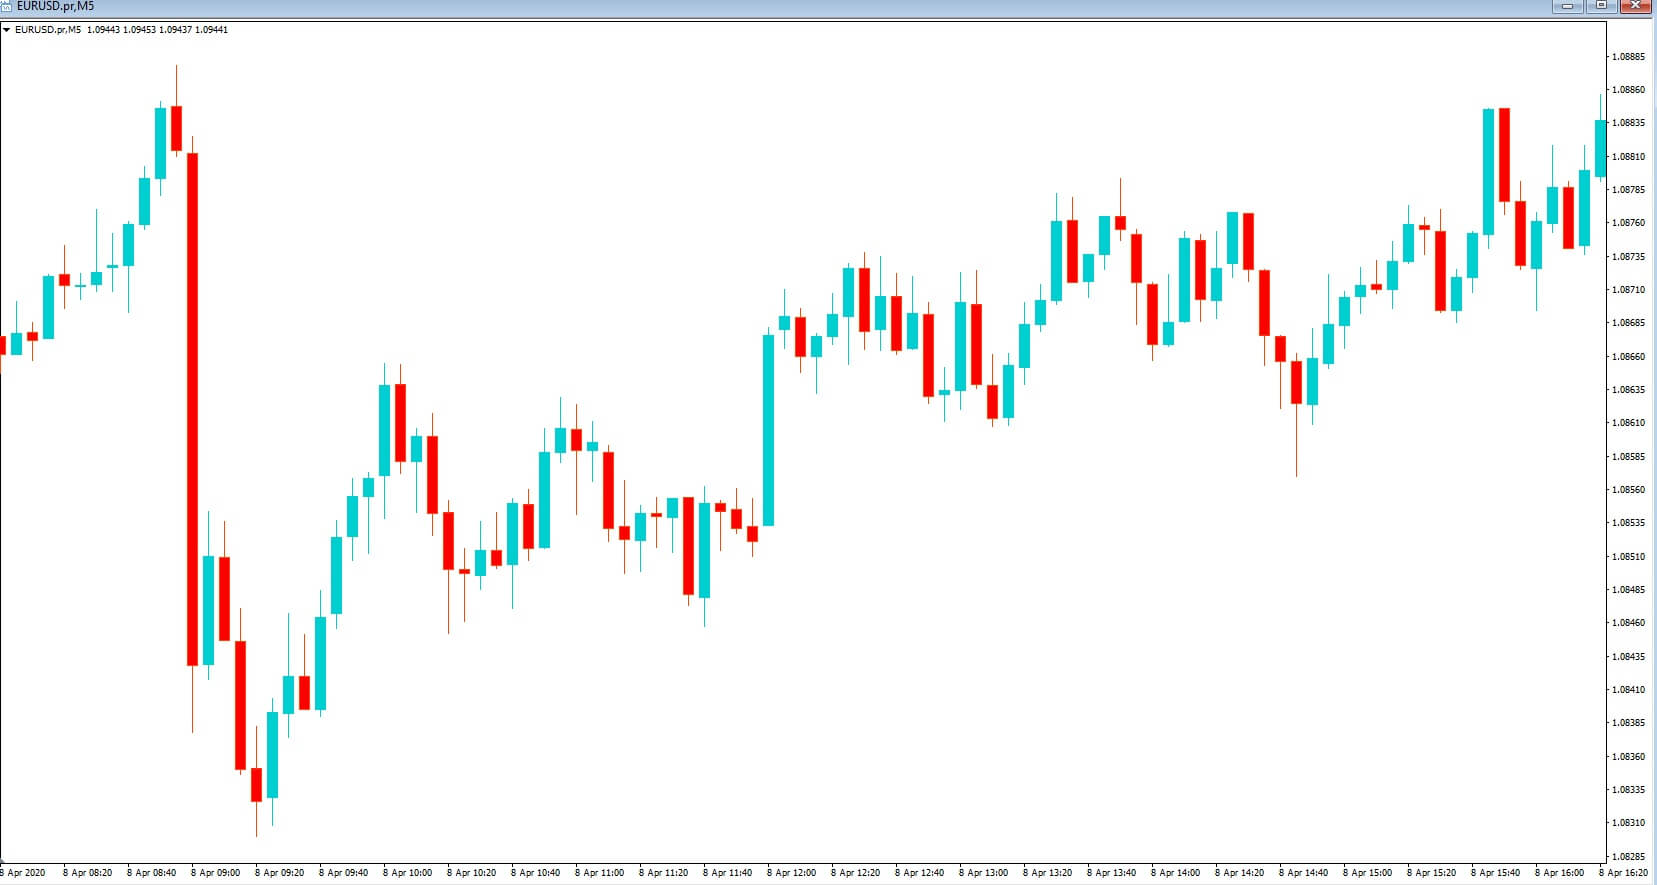
Candlesticks are one of the more preferred methods of showing the price of a currency pair in technical analysis.
Insert C Bar charts
Insert D
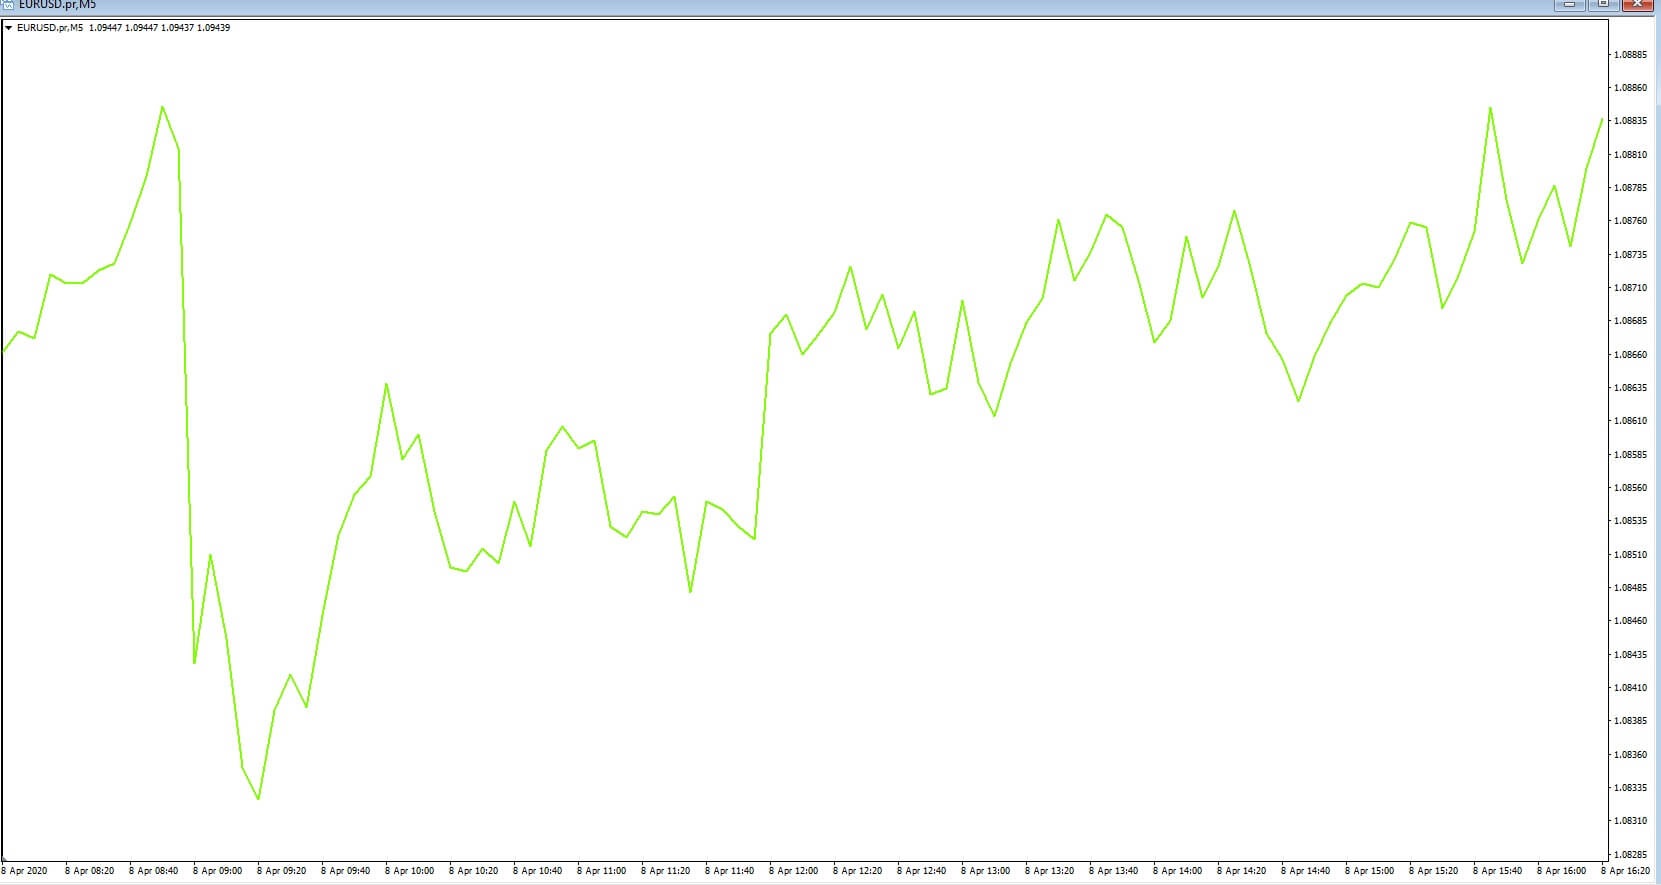
line charts are also used by traders but are somewhat more simplified versions of expressing price action as a visual representation on a screen.
See Insert B! Each candlestick tells a story of where price has been and where it is likely to go during the particular time frame that it is viewed upon. It is, therefore, essential that new Forex
traders learn how to read them because they are applicable in every currency pair that you may wish to trade.
The shape and size of a candlestick, and the color, will help you to determine if a trend in either direction is in play, or if a trend has stalled and is about to reverse, or the amount of volume being traded, which will tell you you the interest from participants at any given time, and this, of course, will help you chose your entry into a trade and of course your exit, either with a profit or as defined by a stop loss.
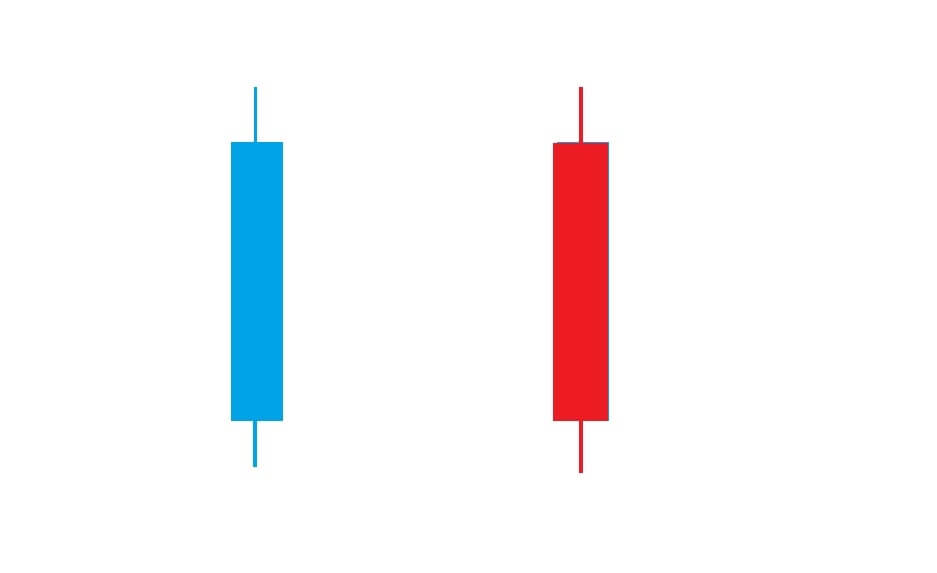
Insert E, Candlesticks can be the color of your preferred choice. In this example, we are using a blue candlestick to denote price ascending and a red candlestick to denote price falling. There are three parts that make up a candlestick.
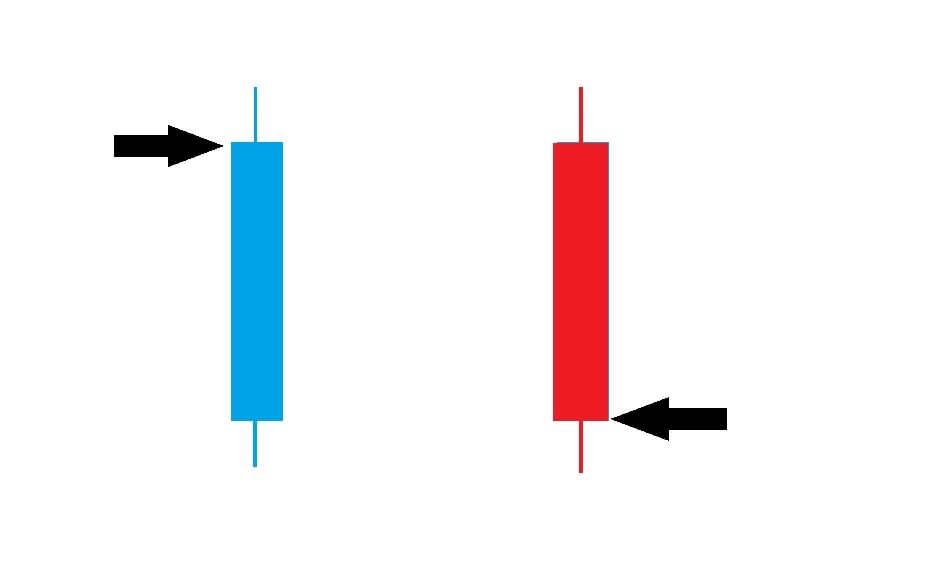
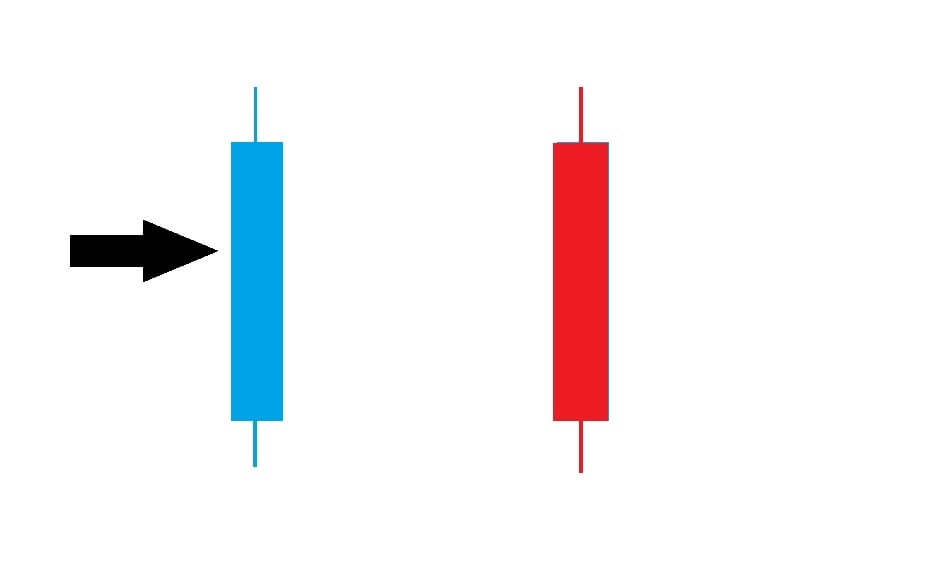
Insert F, the open price.
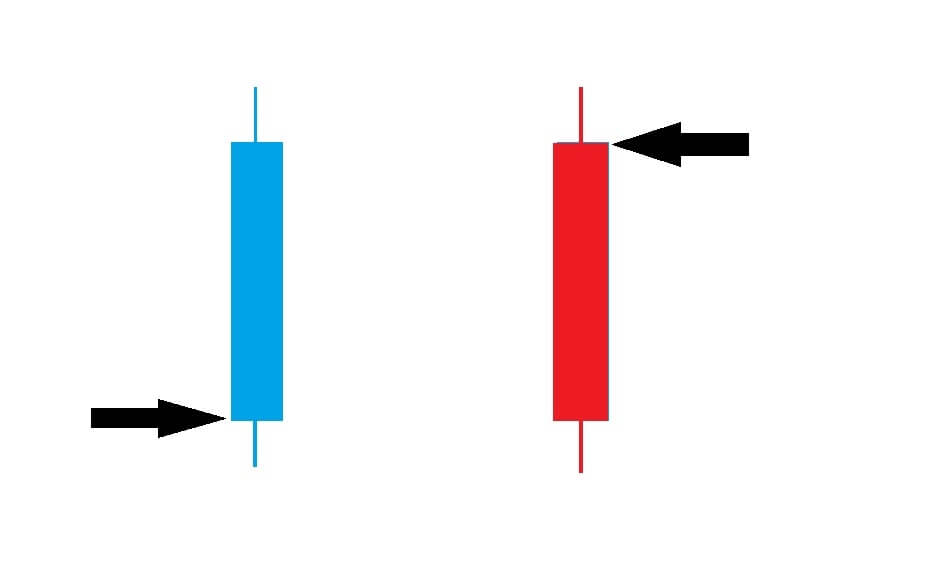
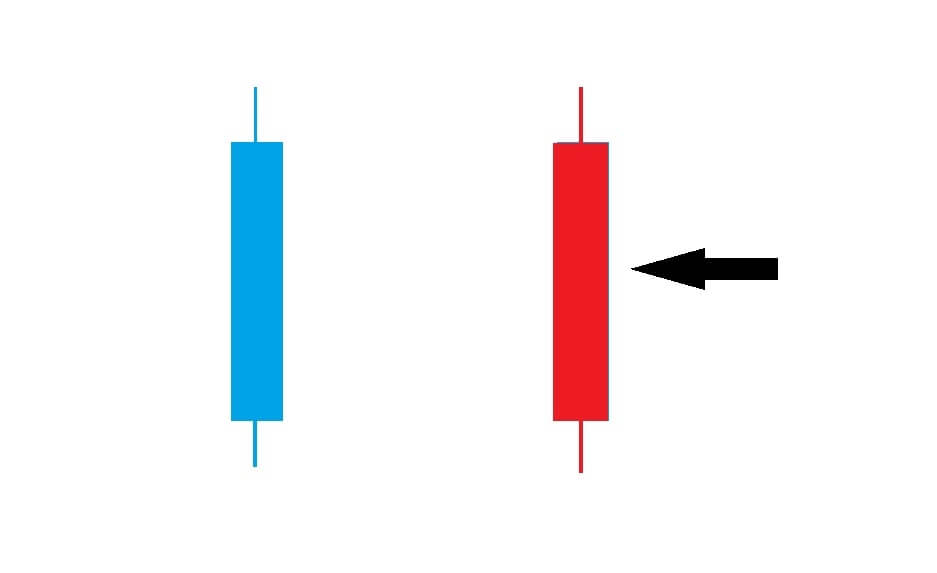
Insert G, the closing price.
Insert H and the wicks, which are also known as shadows, and which will appear on the majority of candlesticks.
Insert I
candlesticks will turn blue if the price of a currency pair moves above the exchange rate price when the candlestick first opened.
Insert J
and the candlestick will turn red if the exchange rate moves lower after the candlestick form opens.
Insert K
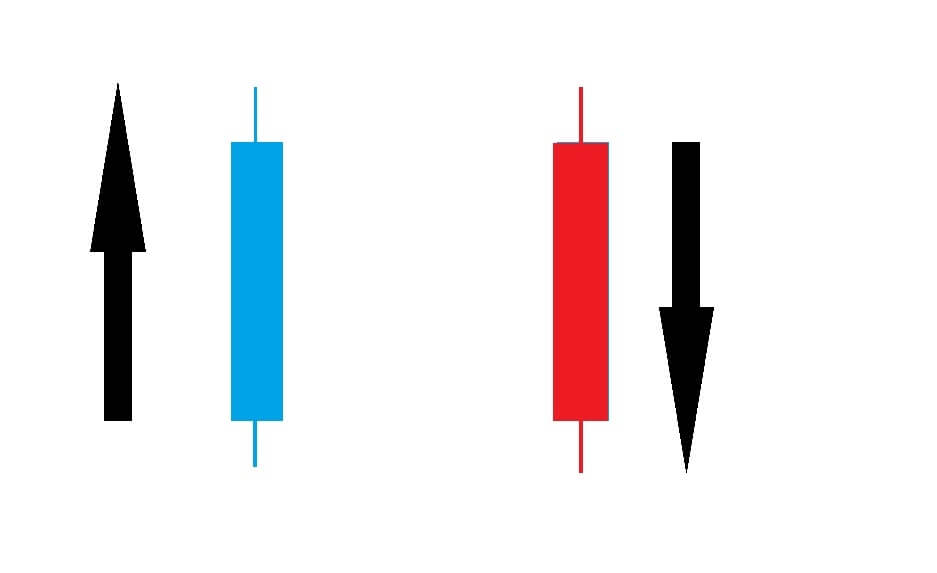
A blue candlestick is also known as a bullish candlestick, and a red one is known as a bearish candlestick. As mentioned previously, your broker may give you the option to change the candlestick’s colors, and this isn’t important, as long as you know which color represents the bullish or bearish direction.
Re-insert B, No matter which time frame you chose to trade on, be it a 5 minute, 15-minute, 1-hour, or daily, the candlestick will remain open for the duration of that specific time period.
Insert L
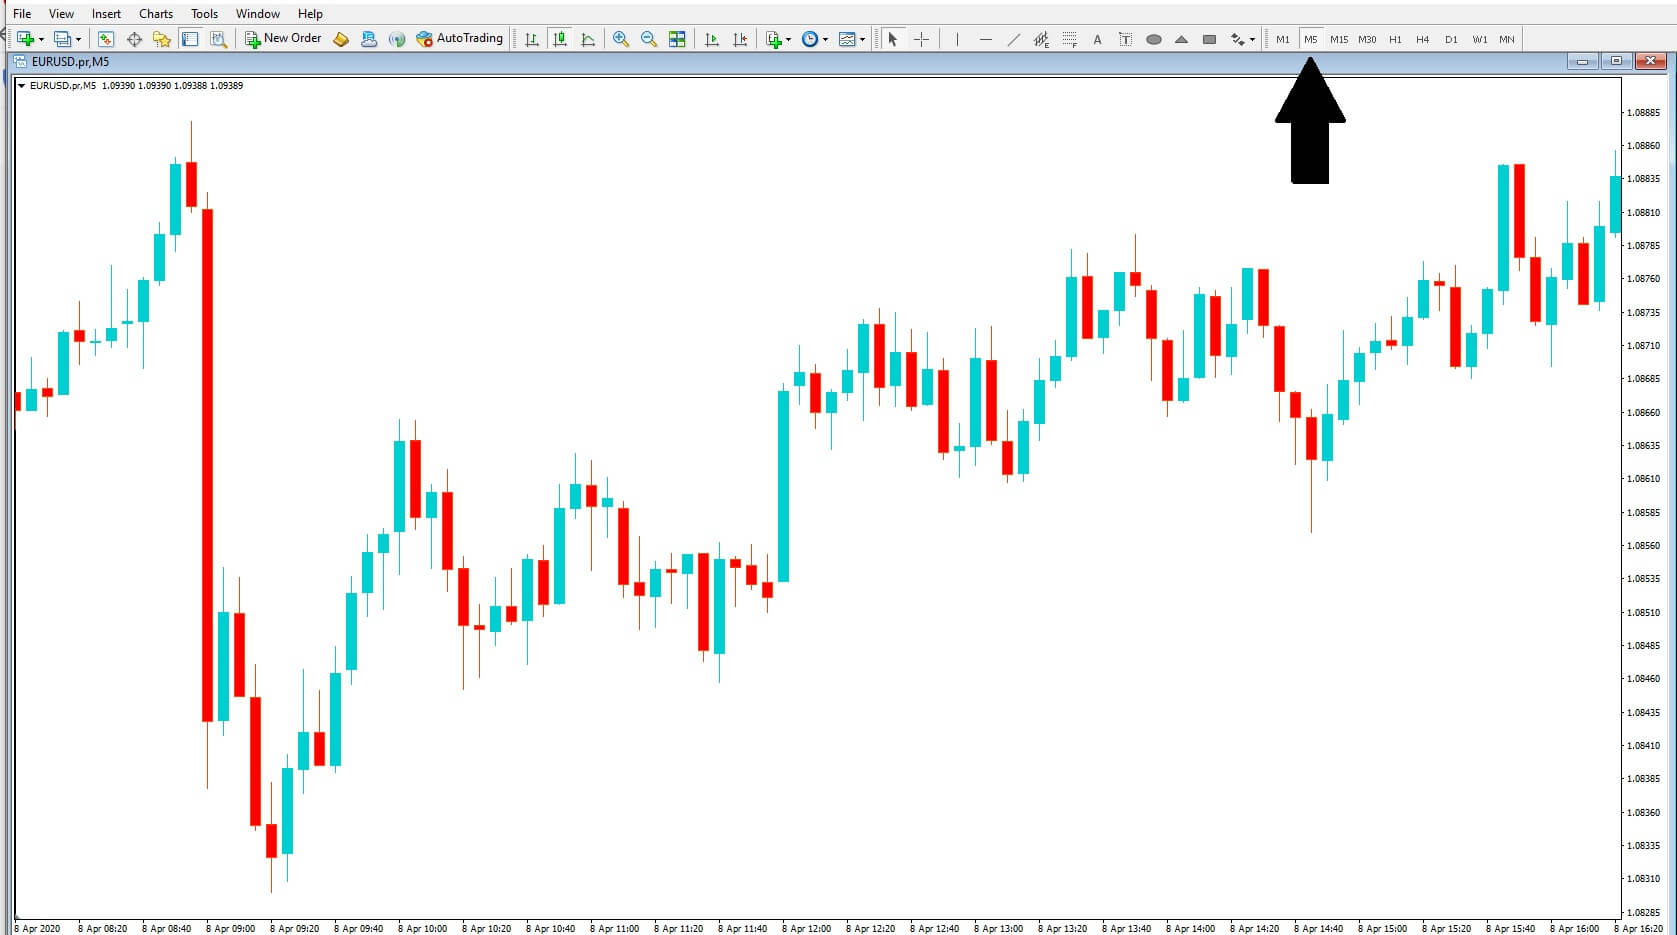
the candlestick will provide you with information on the first price traded on opening and then price direction during the particular time frame for which it is currently open. In this example, we have chosen the 5 minute time frame. And so, each candlestick will remain open for 5 minutes each. When closed it can also provide a host of information regarding the historical price action, including the last price traded for that candle, and which then can be used in conjunction with previous candlesticks to determine price direction and specifically trend formations, the end of a trend and possible reversals in price action. This is the key information that traders require to successfully utilize candlesticks in their technical analysis.
Insert M
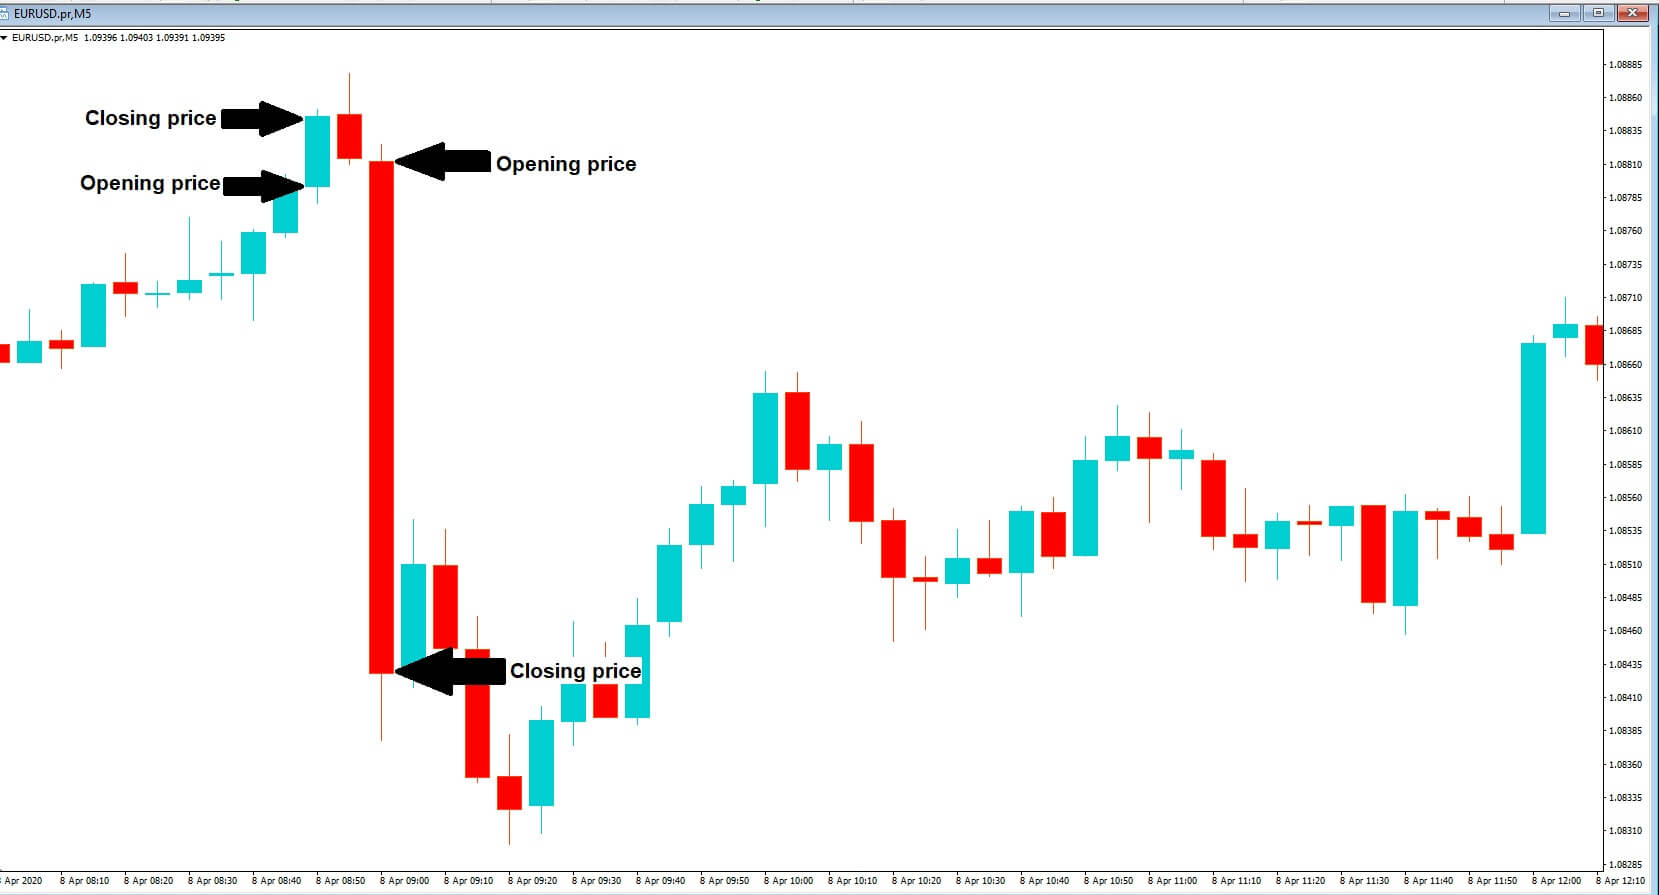
In the context of a real chart, we have two examples, one of a bullish or blue candlestick where we can see where the price opened during the five-minute period and where it eventually closed. And also the second bearish red candlestick, showing where that opened and eventually closed.
Insert N
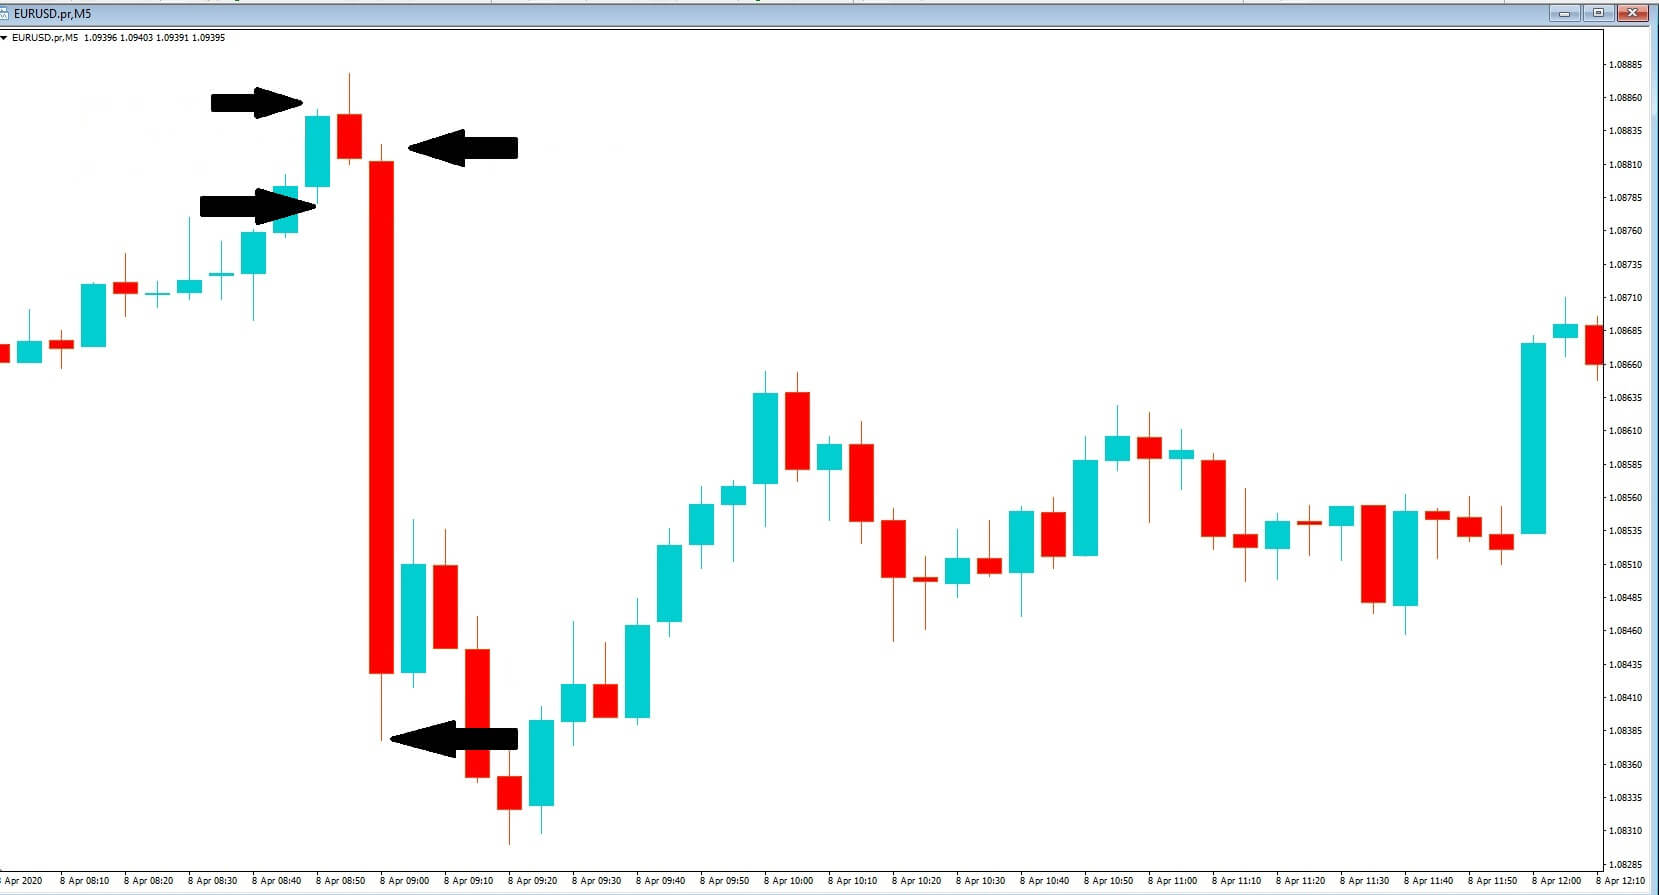
Initially, the price of a candlestick may change colors several times during the time frame, but the key information is left after the time frame has ended. However, the wicks or shadows, tells the trader that at some time during the time frame price may have gone above all below the initial open. Therefore, the wicks tell the trader the complete range of price action during any given time frame.
Insert O
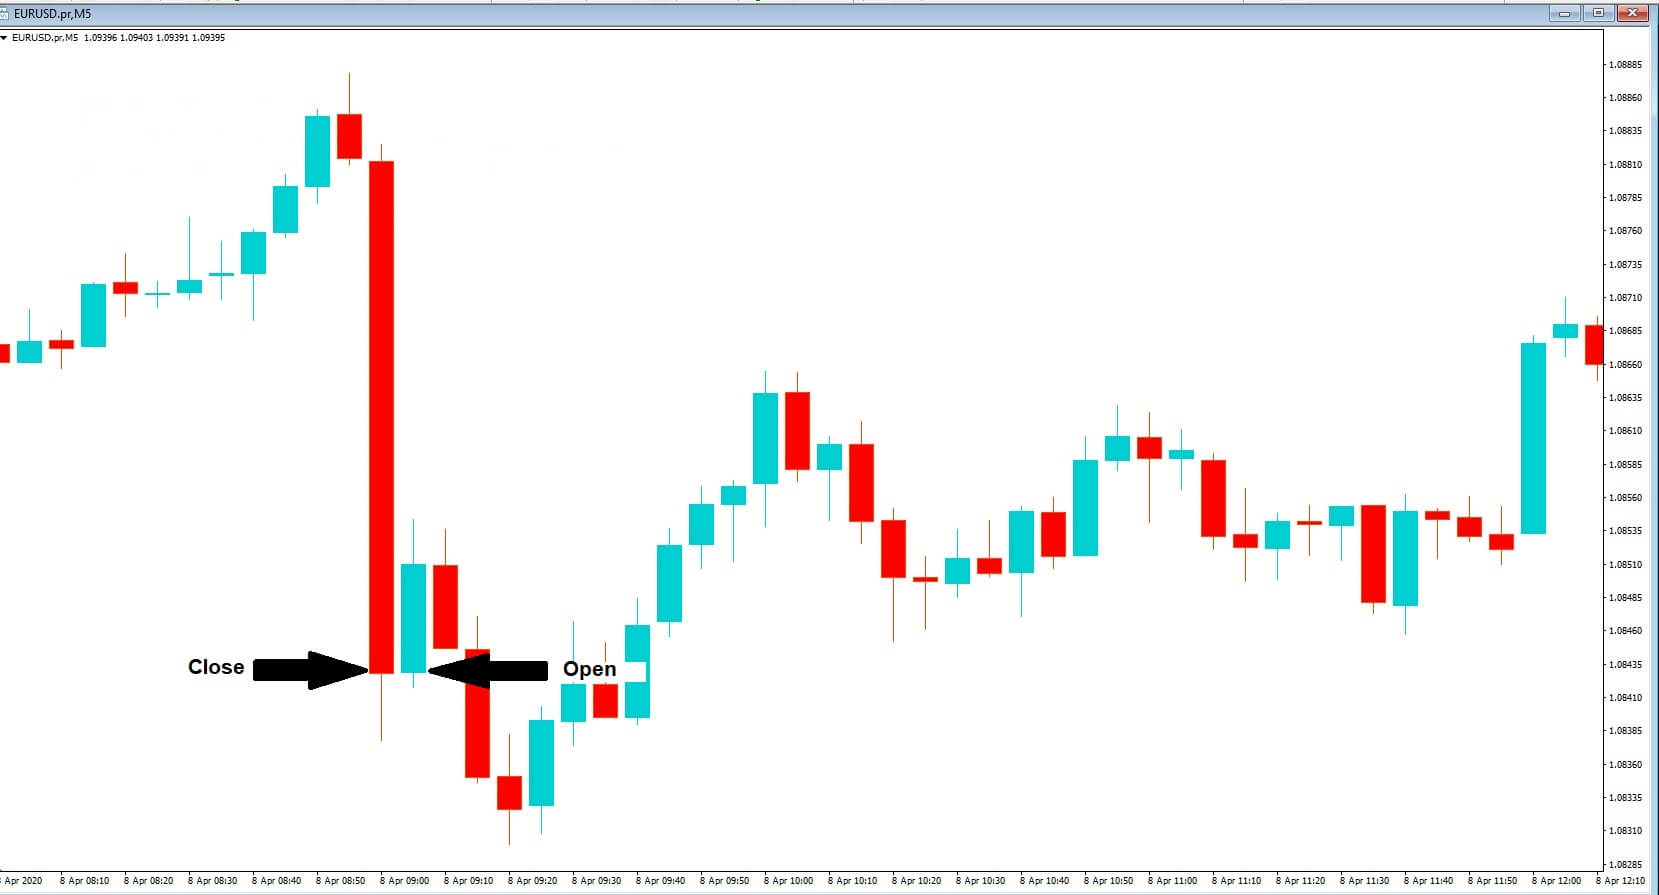
As a general rule of thumb, a new candlestick will open at the exchange rate, where the previous candlestick closed. Gaps can appear in volatile sessions and also sometimes when there has been a break in trading, such as after the weekend break.
The beauty about candlesticks is that forex market professionals all rely on certain formations which are well recognized and offer reliable entry points into the forex market because of the high probability that certain shapes or groups of patterns of candlesticks, which repeat themselves time after time and tells traders about the state of a particular currency pair and how it is performing and whether or not there will be a reversal in price action or if a trend is forming.
So how do we use candlesticks to trade Forex? Well, we are always looking for high probability setups because it is this which differentiates traders from gamblers, and if we know that certain candlestick formations offer a high probability of future directional bias, it will be in our favor to incorporate them into our training methodology.
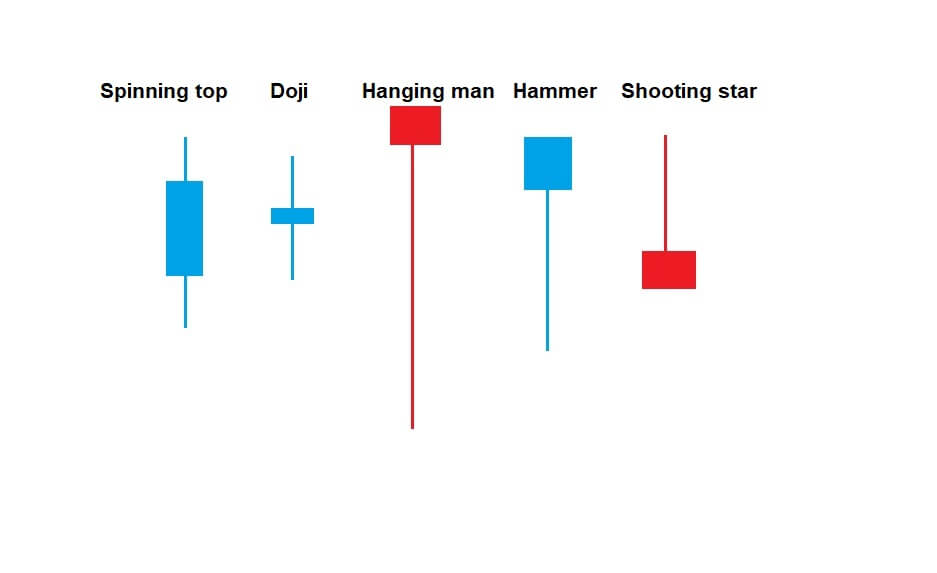
Insert Q
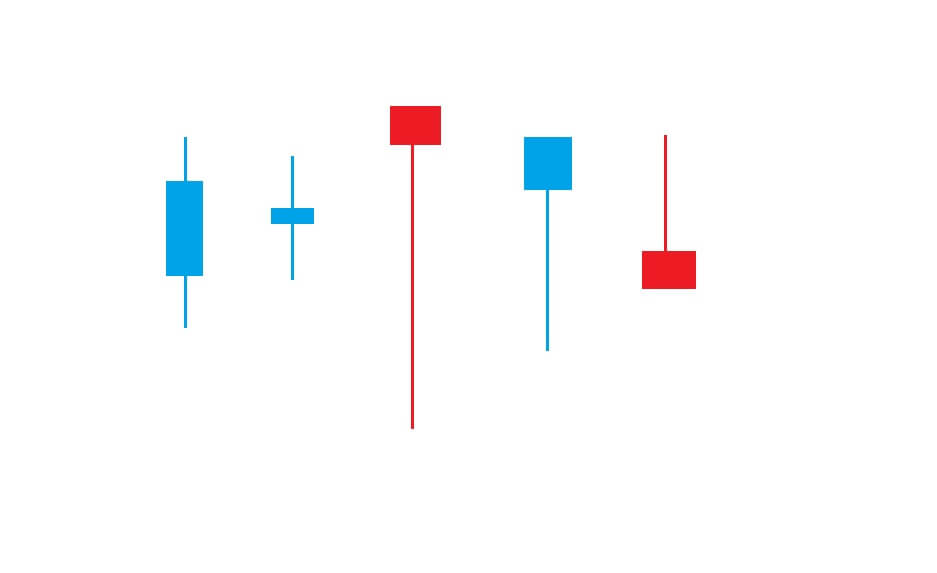
Here are just a few candlesticks that traders look out for, the spinning top, the Doji, the Hanging Man, the hammer, and the shooting star. All of these are firm favorites and offer reliable information to traders about future potential price direction.
Reading candlesticks is like reading a story, and they should always be read from left to right on your chart in order to tell you where price has been, and whether it is faltering in any particular direction. It can tell you if the market is flat or if the market is extremely volatile, and it can predict with a high degree of accuracy future price direction. Understand your candlesticks and use them like a detective, by analyzing them in great detail and using them to tell you what is happening currently with regard to price action and where to enter and exit your trades.