Technical Analysis Defined
Technical analysis is the study of historical exchange rate price action, which forex traders study in order to predict future price movement. Traders can look at historical price movements on charts with various time frames in order to determine the current trading conditions, including volume and liquidity and possible price movement. Technical analysts use screen charts because they are the easiest way to visualize historical data!
Example A
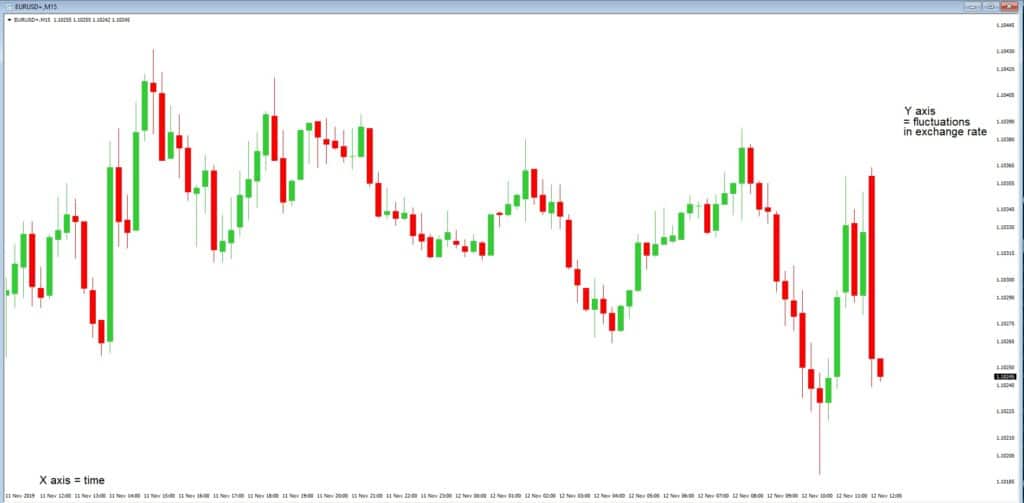
In the example ‘A,’ we can see a very basic screen 15-minute time frame chart of the EURUSD pair where the elapsed time is shown on the X-axis along the bottom and where the change in exchange rate price fluctuations is shown on the vertical Y-axis to the right of the chart.
Many professional technical traders are of the opinion that the fundamental reasons that might affect a currency exchange rate, such as the latest economic data releases, including interest rates, will all be encapsulated within the current exchange rate, as seen on the chart. But of course, everybody’s opinion differs and when you Factor in market sentiments and expectations from future events, plus institutions creating extra markets liquidity by ducking in and out of various currency pairs. This is just one of the reasons why exchange rates seldom stay static.
But, essentially, traders use past chart data in order to try and determine future exchange rate direction.
Example B

Let’s look at an example ‘B.’ This is the same 15-minutes charts of the EURUSD pair, and the only tool we have on the screen is Japanese candlesticks. Some Traders only have candlesticks on the charts because they are often the best indicator of all when it comes to historical price movement. In our example, we can see that to the left of the screen at position A there was a self in the pair to position B, and then a complete reversal to position C, where one single bullish candlestick engulfed the price activity of the previous elven time frames. Therefore, due to the size of this candlestick, it would have been considered to be a strong indication that the market was going to continue to move higher.
Example C
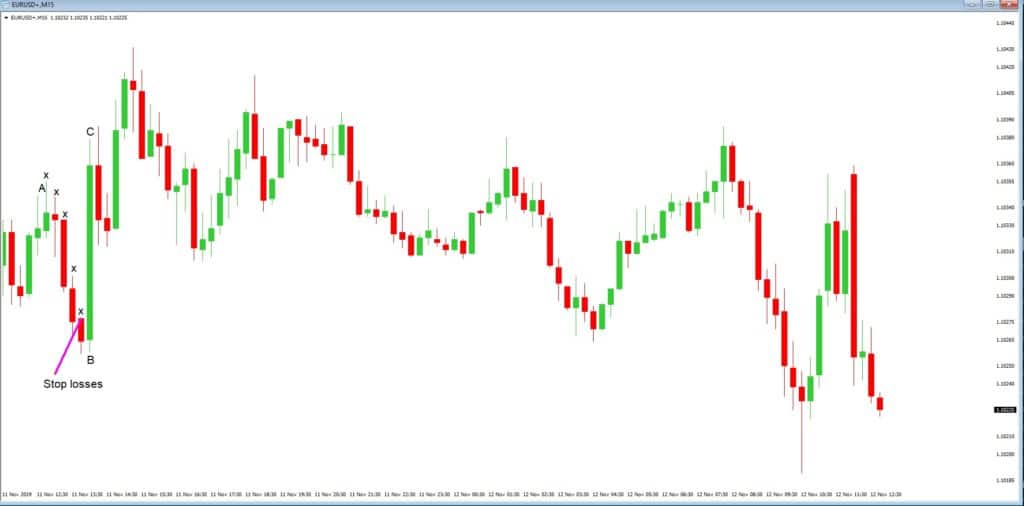
In example ‘C’, we are sticking with the initial A, B, C move, to try and identify what traders might have been looking for during the move from position B to position C. As such we have added some X’s, which mark areas, usually a couple of pips above entry points where the short-selling traders in our example may well have placed their stop losses, during periods mini stop losses are taken out, it can increase volatility, And so Traders will be aware where of where the stop losses lay.
Example D
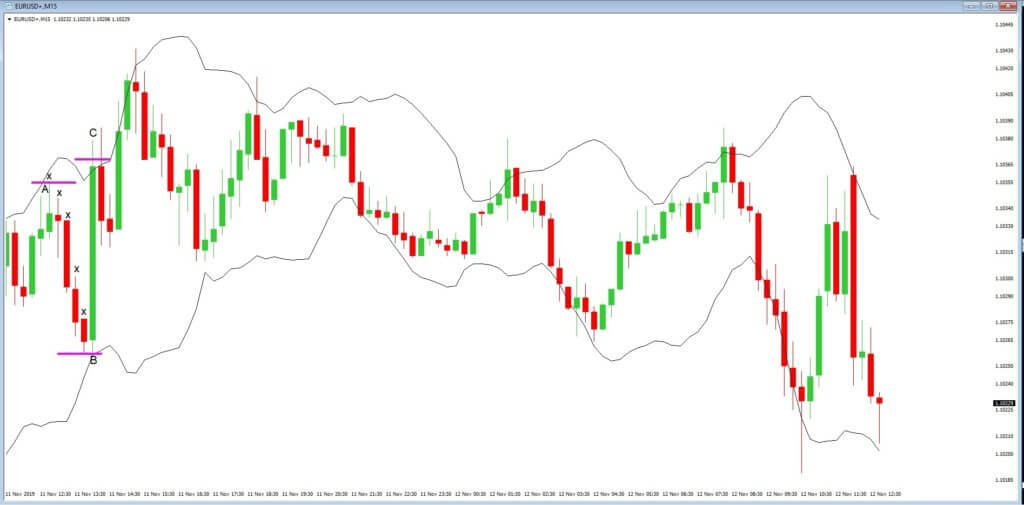
In example ‘D’, we have added Bollinger bands to our chart. This is another tool favored by technical analysts. Something clearly interesting can now be seen at point ‘A,’ which is at the top of the bands, and often features as a selling opportunity to traders. And at position ‘B,’ we can see price action bounce off the bottom of the bands and move up to position C. Again, price action had reached the top of the bands again before pulling back slightly, but not to the bottom of the bands this time. And this was most likely due to the fact that the move from b to c was seen as a bullish move and where several stop losses were taken out along the way.
Generally speaking, over 90% of price action will remain within the Bollinger bands.
In example ‘B’ we have added another favourite tool that technical Traders use the stochastic oscillator, which is a momentum indicator and tells traders when a pair might be overbought, for example when the two lines moved above the 80 axis line, and when the pair were likely oversold, which would be when the two lines crossed underneath the 20 axis line.
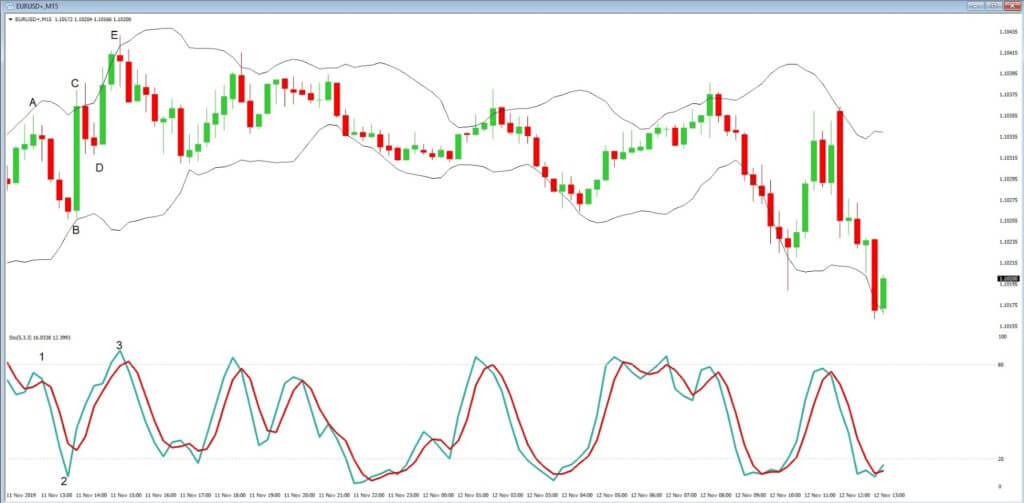
Here we can see that at position ‘A,’ the stochastic was close to the 80 axis line, and therefore overbought. We subsequently see at position B, that our stochastic had gone below the 20 axis line and the market then moved higher to position C. We think we know why there was only a short pullback from position C to position however D, and then position E coincides with our stochastic being overbought at position 3. From here, we then see a fall back in price action.
One of the most common mistakes that new traders make is to load up their screens with many and various technical tools. In the case of technical analysis, we find that less is more when it comes to using technical trading tools.
This is a short example of the power of technical analysis. However, there is a caveat, which is that indicators are just that, indicators! They are not a guarantee of future price action and must be used with caution. The best indicator is price action itself, and even this is not a guarantee that price action will not stop dead in its tracks and completely reverse without warning.